This pipeline computes the correlation between APOBRC groups and selected clinical features.
Testing the association between APOBEC groups identified by 2 different apobec score and 4 clinical features across 248 patients, 4 significant findings detected with Q value < 0.25.
-
3 subtypes identified in current cancer cohort by 'APOBEC MUTLOAD MINESTIMATE'. These subtypes correlate to 'HISTOLOGICAL_TYPE' and 'RESIDUAL_TUMOR'.
-
2 subtypes identified in current cancer cohort by 'APOBEC ENRICH'. These subtypes correlate to 'HISTOLOGICAL_TYPE' and 'RESIDUAL_TUMOR'.
Table 1. Get Full Table Overview of the association between APOBEC groups by 2 different APOBEC scores and 4 clinical features. Shown in the table are P values (Q values). Thresholded by Q value < 0.25, 4 significant findings detected.
|
Clinical Features |
Statistical Tests |
APOBEC MUTLOAD MINESTIMATE |
APOBEC ENRICH |
| Time to Death | logrank test |
0.983 (1) |
0.992 (1) |
| RADIATION THERAPY | Fisher's exact test |
0.891 (1) |
1 (1) |
| HISTOLOGICAL TYPE | Fisher's exact test |
0.00021 (0.00168) |
0.0017 (0.0068) |
| RESIDUAL TUMOR | Fisher's exact test |
0.0258 (0.0517) |
0.00823 (0.0219) |
Table S1. Description of APOBEC group #1: 'APOBEC MUTLOAD MINESTIMATE'
| Cluster Labels | 0 | HIGH | LOW |
|---|---|---|---|
| Number of samples | 236 | 6 | 6 |
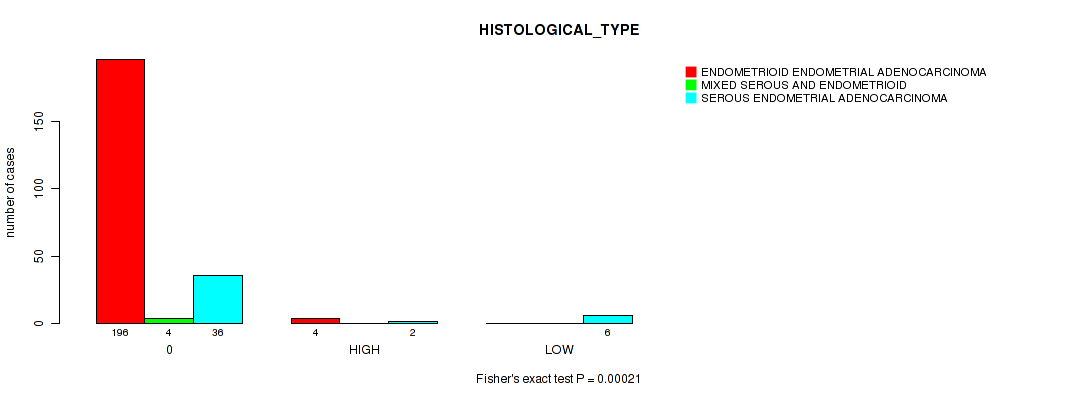
P value = 0.00021 (Fisher's exact test), Q value = 0.0017
Table S2. Clustering Approach #1: 'APOBEC MUTLOAD MINESTIMATE' versus Clinical Feature #3: 'HISTOLOGICAL_TYPE'
| nPatients | ENDOMETRIOID ENDOMETRIAL ADENOCARCINOMA | MIXED SEROUS AND ENDOMETRIOID | SEROUS ENDOMETRIAL ADENOCARCINOMA |
|---|---|---|---|
| ALL | 200 | 4 | 44 |
| 0 | 196 | 4 | 36 |
| HIGH | 4 | 0 | 2 |
| LOW | 0 | 0 | 6 |
Figure S1. Get High-res Image Clustering Approach #1: 'APOBEC MUTLOAD MINESTIMATE' versus Clinical Feature #3: 'HISTOLOGICAL_TYPE'
P value = 0.0258 (Fisher's exact test), Q value = 0.052
Table S3. Clustering Approach #1: 'APOBEC MUTLOAD MINESTIMATE' versus Clinical Feature #4: 'RESIDUAL_TUMOR'
| nPatients | R0 | R1 | R2 | RX |
|---|---|---|---|---|
| ALL | 172 | 10 | 7 | 18 |
| 0 | 165 | 10 | 4 | 18 |
| HIGH | 3 | 0 | 2 | 0 |
| LOW | 4 | 0 | 1 | 0 |
Figure S2. Get High-res Image Clustering Approach #1: 'APOBEC MUTLOAD MINESTIMATE' versus Clinical Feature #4: 'RESIDUAL_TUMOR'
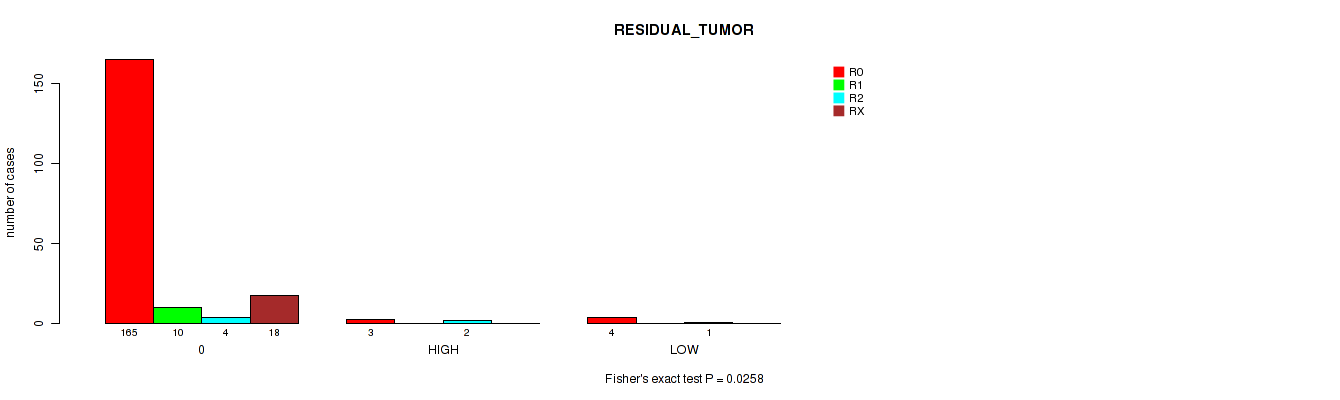
Table S4. Description of APOBEC group #2: 'APOBEC ENRICH'
| Cluster Labels | FC.HIGH.ENRICH | FC.LOW.ENRICH | FC.NO.ENRICH |
|---|---|---|---|
| Number of samples | 11 | 1 | 236 |
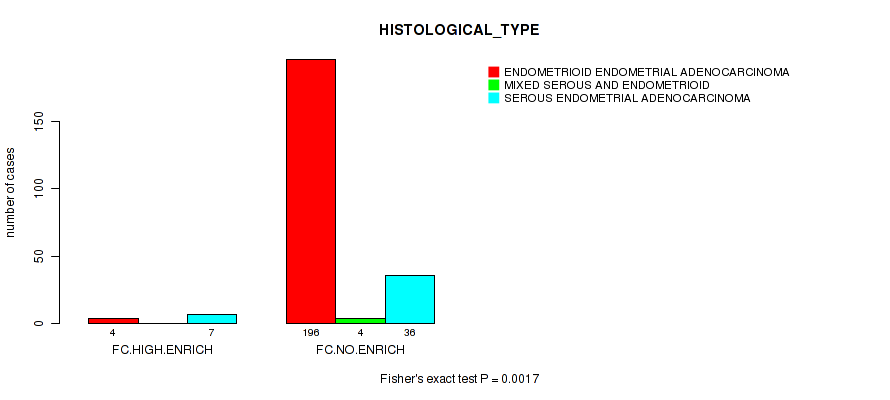
P value = 0.0017 (Fisher's exact test), Q value = 0.0068
Table S5. Clustering Approach #2: 'APOBEC ENRICH' versus Clinical Feature #3: 'HISTOLOGICAL_TYPE'
| nPatients | ENDOMETRIOID ENDOMETRIAL ADENOCARCINOMA | MIXED SEROUS AND ENDOMETRIOID | SEROUS ENDOMETRIAL ADENOCARCINOMA |
|---|---|---|---|
| ALL | 200 | 4 | 43 |
| FC.HIGH.ENRICH | 4 | 0 | 7 |
| FC.NO.ENRICH | 196 | 4 | 36 |
Figure S3. Get High-res Image Clustering Approach #2: 'APOBEC ENRICH' versus Clinical Feature #3: 'HISTOLOGICAL_TYPE'
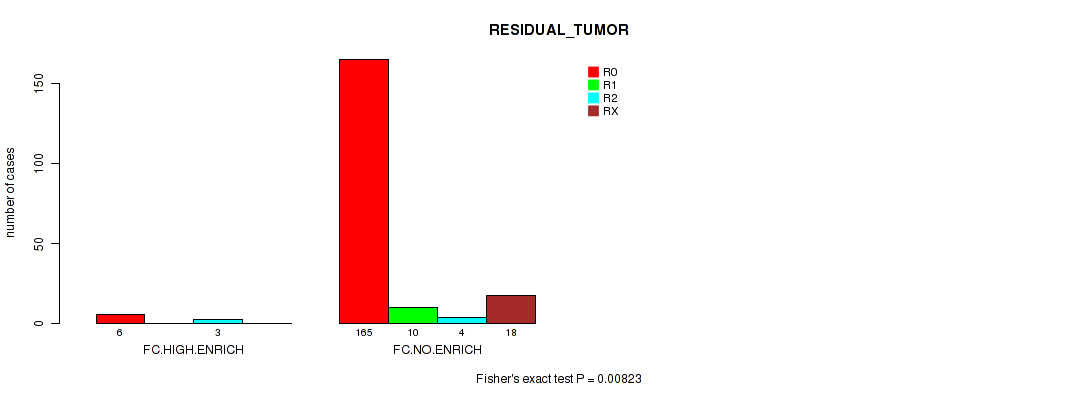
P value = 0.00823 (Fisher's exact test), Q value = 0.022
Table S6. Clustering Approach #2: 'APOBEC ENRICH' versus Clinical Feature #4: 'RESIDUAL_TUMOR'
| nPatients | R0 | R1 | R2 | RX |
|---|---|---|---|---|
| ALL | 171 | 10 | 7 | 18 |
| FC.HIGH.ENRICH | 6 | 0 | 3 | 0 |
| FC.NO.ENRICH | 165 | 10 | 4 | 18 |
Figure S4. Get High-res Image Clustering Approach #2: 'APOBEC ENRICH' versus Clinical Feature #4: 'RESIDUAL_TUMOR'
-
APOBEC groups file = /xchip/cga/gdac-prod/tcga-gdac/jobResults/APOBEC_Pipelines/UCEC-TP/22555825/__DELETED__1436046:APOBEC_clinical_corr_input_22572090/APOBEC_for_clinical.correlaion.input.categorical.txt
-
Clinical data file = /xchip/cga/gdac-prod/tcga-gdac/jobResults/Append_Data/UCEC-TP/22507145/UCEC-TP.merged_data.txt
-
Number of patients = 248
-
Number of selected clinical features = 4
APOBEC classification based on APOBEC_MutLoad_MinEstimate : a. APOBEC non group -- samples with zero value, b. APOBEC high group -- samples above median value in non zero samples, c. APOBEC low group -- samples below median value in non zero samples.
APOBEC classification based on APOBEC_enrich : a. No Enrichmment group -- all samples with BH_Fisher_p-value_tCw > 0.05, b. Low enrichment group -- samples with BH_Fisher_p-value_tCw = < 0.05 and APOBEC_enrich=<2, c. High enrichment group -- samples with BH_Fisher_p-value_tCw =< 0.05 and APOBEC_enrich>2.
For survival clinical features, the Kaplan-Meier survival curves of tumors with and without gene mutations were plotted and the statistical significance P values were estimated by logrank test (Bland and Altman 2004) using the 'survdiff' function in R
For binary clinical features, two-tailed Fisher's exact tests (Fisher 1922) were used to estimate the P values using the 'fisher.test' function in R
For multiple hypothesis correction, Q value is the False Discovery Rate (FDR) analogue of the P value (Benjamini and Hochberg 1995), defined as the minimum FDR at which the test may be called significant. We used the 'Benjamini and Hochberg' method of 'p.adjust' function in R to convert P values into Q values.
In addition to the links below, the full results of the analysis summarized in this report can also be downloaded programmatically using firehose_get, or interactively from either the Broad GDAC website or TCGA Data Coordination Center Portal.