This pipeline computes the correlation between significant copy number variation (cnv focal) genes and selected clinical features.
Testing the association between copy number variation 20 focal events and 7 clinical features across 80 patients, 8 significant findings detected with Q value < 0.25.
-
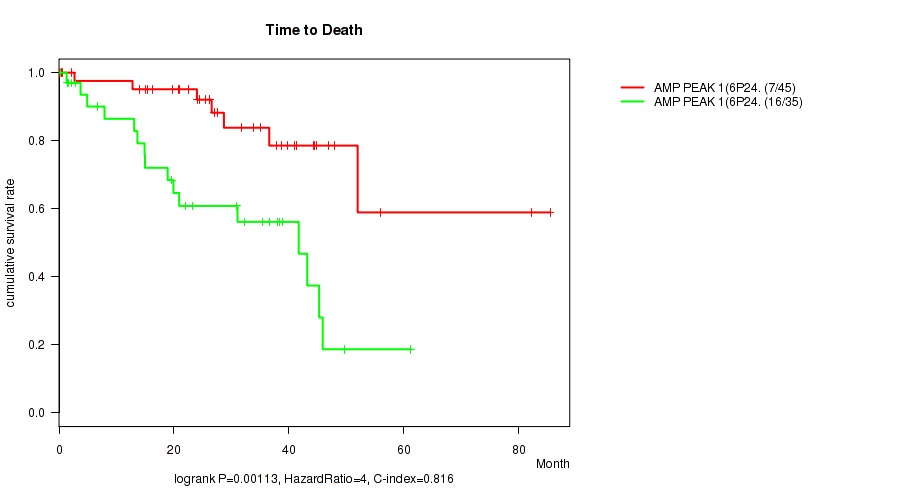
amp_6p24.3 cnv correlated to 'Time to Death'.
-
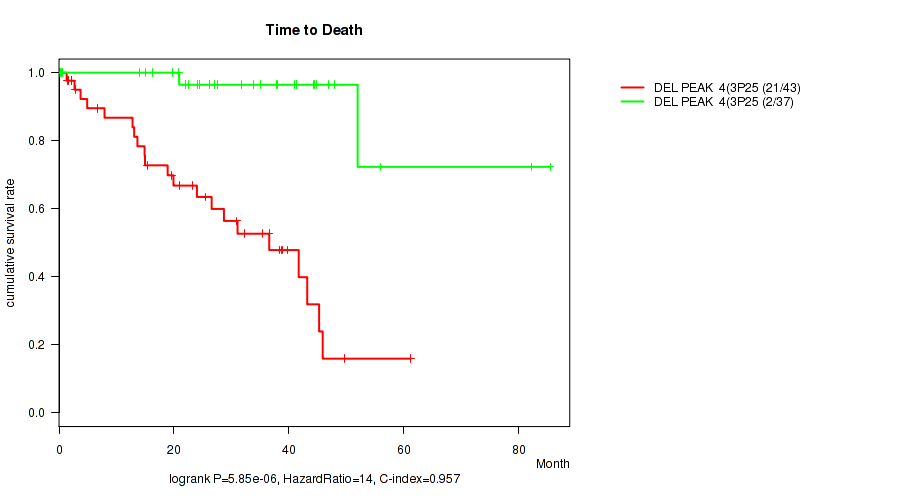
del_3p25.2 cnv correlated to 'Time to Death'.
-
del_3p25.1 cnv correlated to 'Time to Death'.
-
del_3p22.2 cnv correlated to 'Time to Death'.
-
del_3p14.2 cnv correlated to 'Time to Death'.
-
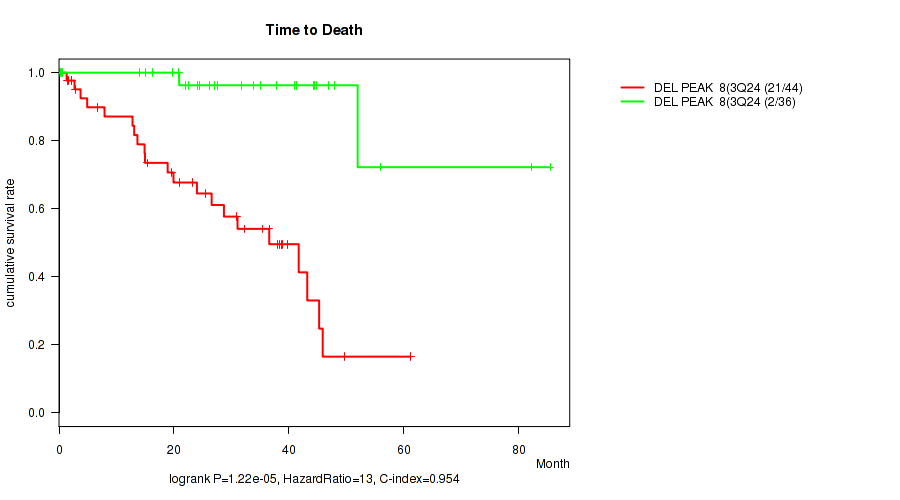
del_3q24 cnv correlated to 'Time to Death'.
-
del_3q29 cnv correlated to 'Time to Death'.
-
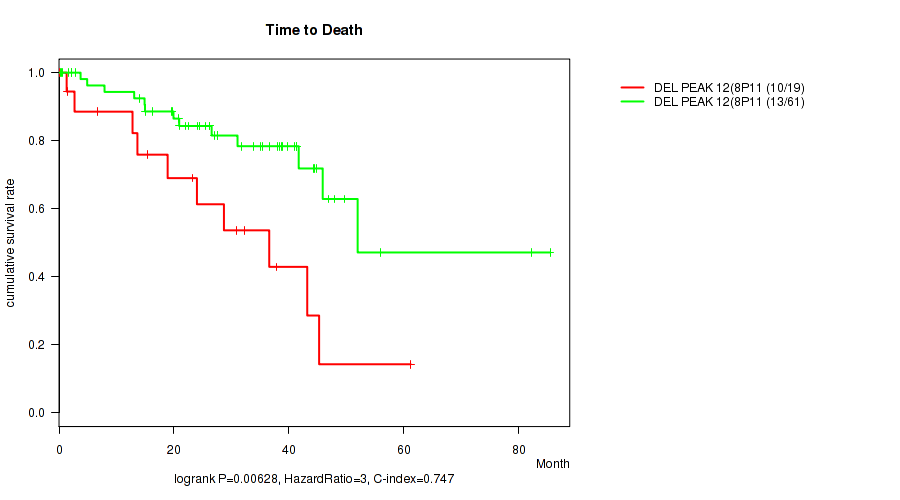
del_8p11.22 cnv correlated to 'Time to Death'.
Table 1. Get Full Table Overview of the association between significant copy number variation of 20 focal events and 7 clinical features. Shown in the table are P values (Q values). Thresholded by Q value < 0.25, 8 significant findings detected.
|
Clinical Features |
Time to Death |
YEARS TO BIRTH |
PATHOLOGIC STAGE |
PATHOLOGY T STAGE |
PATHOLOGY M STAGE |
GENDER |
RADIATION THERAPY |
||
| nCNV (%) | nWild-Type | logrank test | Wilcoxon-test | Fisher's exact test | Fisher's exact test | Fisher's exact test | Fisher's exact test | Fisher's exact test | |
| amp 6p24 3 | 45 (56%) | 35 |
0.00113 (0.0227) |
0.0832 (0.433) |
0.457 (0.772) |
0.48 (0.791) |
0.352 (0.631) |
1 (1.00) |
1 (1.00) |
| del 3p25 2 | 43 (54%) | 37 |
5.85e-06 (0.000273) |
0.322 (0.594) |
0.0586 (0.433) |
0.265 (0.571) |
0.117 (0.433) |
1 (1.00) |
1 (1.00) |
| del 3p25 1 | 43 (54%) | 37 |
5.85e-06 (0.000273) |
0.322 (0.594) |
0.0583 (0.433) |
0.265 (0.571) |
0.117 (0.433) |
1 (1.00) |
1 (1.00) |
| del 3p22 2 | 43 (54%) | 37 |
5.85e-06 (0.000273) |
0.322 (0.594) |
0.0589 (0.433) |
0.266 (0.571) |
0.117 (0.433) |
1 (1.00) |
1 (1.00) |
| del 3p14 2 | 44 (55%) | 36 |
1.22e-05 (0.000284) |
0.266 (0.571) |
0.0787 (0.433) |
0.182 (0.494) |
0.117 (0.433) |
1 (1.00) |
1 (1.00) |
| del 3q24 | 44 (55%) | 36 |
1.22e-05 (0.000284) |
0.266 (0.571) |
0.0785 (0.433) |
0.182 (0.494) |
0.117 (0.433) |
1 (1.00) |
1 (1.00) |
| del 3q29 | 44 (55%) | 36 |
1.22e-05 (0.000284) |
0.266 (0.571) |
0.0776 (0.433) |
0.183 (0.494) |
0.117 (0.433) |
1 (1.00) |
1 (1.00) |
| del 8p11 22 | 19 (24%) | 61 |
0.00628 (0.11) |
0.0876 (0.433) |
0.0668 (0.433) |
0.289 (0.575) |
0.204 (0.501) |
0.292 (0.575) |
0.142 (0.462) |
| amp 8q24 22 | 61 (76%) | 19 |
0.0196 (0.305) |
0.56 (0.85) |
0.899 (1.00) |
0.54 (0.85) |
0.562 (0.85) |
0.433 (0.748) |
1 (1.00) |
| amp 17q25 3 | 14 (18%) | 66 |
0.712 (0.931) |
0.276 (0.571) |
0.466 (0.777) |
0.795 (1.00) |
1 (1.00) |
1 (1.00) |
1 (1.00) |
| del 1p36 12 | 25 (31%) | 55 |
0.0477 (0.433) |
0.0638 (0.433) |
0.544 (0.85) |
0.627 (0.862) |
0.131 (0.459) |
0.634 (0.862) |
1 (1.00) |
| del 1p12 | 18 (22%) | 62 |
0.151 (0.48) |
0.179 (0.494) |
0.709 (0.931) |
0.882 (1.00) |
0.265 (0.571) |
0.111 (0.433) |
0.522 (0.849) |
| del 2q37 2 | 3 (4%) | 77 |
0.138 (0.462) |
0.63 (0.862) |
0.599 (0.862) |
0.296 (0.575) |
1 (1.00) |
0.578 (0.85) |
1 (1.00) |
| del 6q25 2 | 23 (29%) | 57 |
0.293 (0.575) |
0.312 (0.594) |
0.55 (0.85) |
0.0708 (0.433) |
0.58 (0.85) |
0.628 (0.862) |
0.202 (0.501) |
| del 6q27 | 24 (30%) | 56 |
0.165 (0.494) |
0.116 (0.433) |
0.703 (0.931) |
0.343 (0.623) |
0.58 (0.85) |
0.623 (0.862) |
0.218 (0.525) |
| del 11q24 3 | 7 (9%) | 73 |
0.373 (0.657) |
0.0683 (0.433) |
0.963 (1.00) |
0.87 (1.00) |
1 (1.00) |
0.693 (0.931) |
1 (1.00) |
| del 16q12 1 | 16 (20%) | 64 |
0.0544 (0.433) |
0.125 (0.448) |
0.169 (0.494) |
0.375 (0.657) |
0.204 (0.501) |
0.779 (1.00) |
0.0907 (0.433) |
| del 16q23 3 | 17 (21%) | 63 |
0.0559 (0.433) |
0.14 (0.462) |
0.17 (0.494) |
0.277 (0.571) |
0.204 (0.501) |
1 (1.00) |
0.103 (0.433) |
| del 16q24 3 | 17 (21%) | 63 |
0.0251 (0.352) |
0.0622 (0.433) |
0.166 (0.494) |
0.277 (0.571) |
0.204 (0.501) |
0.583 (0.85) |
0.103 (0.433) |
| del 17q12 | 3 (4%) | 77 |
0.0836 (0.433) |
0.612 (0.862) |
0.457 (0.772) |
0.577 (0.85) |
1 (1.00) |
1 (1.00) |
1 (1.00) |
P value = 0.00113 (logrank test), Q value = 0.023
Table S1. Gene #1: 'amp_6p24.3' versus Clinical Feature #1: 'Time to Death'
| nPatients | nDeath | Duration Range (Median), Month | |
|---|---|---|---|
| ALL | 80 | 23 | 0.1 - 85.5 (25.8) |
| AMP PEAK 1(6P24.3) MUTATED | 45 | 7 | 0.1 - 85.5 (27.0) |
| AMP PEAK 1(6P24.3) WILD-TYPE | 35 | 16 | 0.2 - 61.2 (19.9) |
Figure S1. Get High-res Image Gene #1: 'amp_6p24.3' versus Clinical Feature #1: 'Time to Death'
P value = 5.85e-06 (logrank test), Q value = 0.00027
Table S2. Gene #7: 'del_3p25.2' versus Clinical Feature #1: 'Time to Death'
| nPatients | nDeath | Duration Range (Median), Month | |
|---|---|---|---|
| ALL | 80 | 23 | 0.1 - 85.5 (25.8) |
| DEL PEAK 4(3P25.2) MUTATED | 43 | 21 | 0.1 - 61.2 (21.0) |
| DEL PEAK 4(3P25.2) WILD-TYPE | 37 | 2 | 0.2 - 85.5 (27.5) |
Figure S2. Get High-res Image Gene #7: 'del_3p25.2' versus Clinical Feature #1: 'Time to Death'
P value = 5.85e-06 (logrank test), Q value = 0.00027
Table S3. Gene #8: 'del_3p25.1' versus Clinical Feature #1: 'Time to Death'
| nPatients | nDeath | Duration Range (Median), Month | |
|---|---|---|---|
| ALL | 80 | 23 | 0.1 - 85.5 (25.8) |
| DEL PEAK 5(3P25.1) MUTATED | 43 | 21 | 0.1 - 61.2 (21.0) |
| DEL PEAK 5(3P25.1) WILD-TYPE | 37 | 2 | 0.2 - 85.5 (27.5) |
Figure S3. Get High-res Image Gene #8: 'del_3p25.1' versus Clinical Feature #1: 'Time to Death'

P value = 5.85e-06 (logrank test), Q value = 0.00027
Table S4. Gene #9: 'del_3p22.2' versus Clinical Feature #1: 'Time to Death'
| nPatients | nDeath | Duration Range (Median), Month | |
|---|---|---|---|
| ALL | 80 | 23 | 0.1 - 85.5 (25.8) |
| DEL PEAK 6(3P22.2) MUTATED | 43 | 21 | 0.1 - 61.2 (21.0) |
| DEL PEAK 6(3P22.2) WILD-TYPE | 37 | 2 | 0.2 - 85.5 (27.5) |
Figure S4. Get High-res Image Gene #9: 'del_3p22.2' versus Clinical Feature #1: 'Time to Death'

P value = 1.22e-05 (logrank test), Q value = 0.00028
Table S5. Gene #10: 'del_3p14.2' versus Clinical Feature #1: 'Time to Death'
| nPatients | nDeath | Duration Range (Median), Month | |
|---|---|---|---|
| ALL | 80 | 23 | 0.1 - 85.5 (25.8) |
| DEL PEAK 7(3P14.2) MUTATED | 44 | 21 | 0.1 - 61.2 (22.1) |
| DEL PEAK 7(3P14.2) WILD-TYPE | 36 | 2 | 0.2 - 85.5 (27.3) |
Figure S5. Get High-res Image Gene #10: 'del_3p14.2' versus Clinical Feature #1: 'Time to Death'

P value = 1.22e-05 (logrank test), Q value = 0.00028
Table S6. Gene #11: 'del_3q24' versus Clinical Feature #1: 'Time to Death'
| nPatients | nDeath | Duration Range (Median), Month | |
|---|---|---|---|
| ALL | 80 | 23 | 0.1 - 85.5 (25.8) |
| DEL PEAK 8(3Q24) MUTATED | 44 | 21 | 0.1 - 61.2 (22.1) |
| DEL PEAK 8(3Q24) WILD-TYPE | 36 | 2 | 0.2 - 85.5 (27.3) |
Figure S6. Get High-res Image Gene #11: 'del_3q24' versus Clinical Feature #1: 'Time to Death'
P value = 1.22e-05 (logrank test), Q value = 0.00028
Table S7. Gene #12: 'del_3q29' versus Clinical Feature #1: 'Time to Death'
| nPatients | nDeath | Duration Range (Median), Month | |
|---|---|---|---|
| ALL | 80 | 23 | 0.1 - 85.5 (25.8) |
| DEL PEAK 9(3Q29) MUTATED | 44 | 21 | 0.1 - 61.2 (22.1) |
| DEL PEAK 9(3Q29) WILD-TYPE | 36 | 2 | 0.2 - 85.5 (27.3) |
Figure S7. Get High-res Image Gene #12: 'del_3q29' versus Clinical Feature #1: 'Time to Death'

P value = 0.00628 (logrank test), Q value = 0.11
Table S8. Gene #15: 'del_8p11.22' versus Clinical Feature #1: 'Time to Death'
| nPatients | nDeath | Duration Range (Median), Month | |
|---|---|---|---|
| ALL | 80 | 23 | 0.1 - 85.5 (25.8) |
| DEL PEAK 12(8P11.22) MUTATED | 19 | 10 | 0.1 - 61.2 (23.3) |
| DEL PEAK 12(8P11.22) WILD-TYPE | 61 | 13 | 0.2 - 85.5 (26.2) |
Figure S8. Get High-res Image Gene #15: 'del_8p11.22' versus Clinical Feature #1: 'Time to Death'
-
Copy number data file = all_lesions.txt from GISTIC pipeline
-
Processed Copy number data file = /xchip/cga/gdac-prod/tcga-gdac/jobResults/GDAC_Correlate_Genomic_Events_Preprocess/UVM-TP/22534464/transformed.cor.cli.txt
-
Clinical data file = /xchip/cga/gdac-prod/tcga-gdac/jobResults/Append_Data/UVM-TP/22507229/UVM-TP.merged_data.txt
-
Number of patients = 80
-
Number of significantly focal cnvs = 20
-
Number of selected clinical features = 7
-
Exclude genes that fewer than K tumors have mutations, K = 3
For survival clinical features, the Kaplan-Meier survival curves of tumors with and without gene mutations were plotted and the statistical significance P values were estimated by logrank test (Bland and Altman 2004) using the 'survdiff' function in R
For binary or multi-class clinical features (nominal or ordinal), two-tailed Fisher's exact tests (Fisher 1922) were used to estimate the P values using the 'fisher.test' function in R
For multiple hypothesis correction, Q value is the False Discovery Rate (FDR) analogue of the P value (Benjamini and Hochberg 1995), defined as the minimum FDR at which the test may be called significant. We used the 'Benjamini and Hochberg' method of 'p.adjust' function in R to convert P values into Q values.
In addition to the links below, the full results of the analysis summarized in this report can also be downloaded programmatically using firehose_get, or interactively from either the Broad GDAC website or TCGA Data Coordination Center Portal.