This report serves to describe the mutational landscape and properties of a given individual set, as well as rank genes and genesets according to mutational significance. MutSig v2.0 was used to generate the results found in this report.
-
Working with individual set: UVM-TP
-
Number of patients in set: 80
The input for this pipeline is a set of individuals with the following files associated for each:
-
An annotated .maf file describing the mutations called for the respective individual, and their properties.
-
A .wig file that contains information about the coverage of the sample.
-
MAF used for this analysis:UVM-TP.final_analysis_set.maf
-
Blacklist used for this analysis: pancan_mutation_blacklist.v14.hg19.txt
-
Significantly mutated genes (q ≤ 0.1): 6
-
Mutations seen in COSMIC: 44
-
Significantly mutated genes in COSMIC territory: 5
-
Significantly mutated genesets: 32
-
Significantly mutated genesets: (excluding sig. mutated genes):0
-
Read 80 MAFs of type "maf1"
-
Total number of mutations in input MAFs: 2174
-
After removing 10 blacklisted mutations: 2164
-
After removing 100 noncoding mutations: 2064
-
Number of mutations before filtering: 2064
-
After removing 137 mutations outside gene set: 1927
-
After removing 4 mutations outside category set: 1923
Table 1. Get Full Table Table representing breakdown of mutations by type.
| type | count |
|---|---|
| Frame_Shift_Del | 75 |
| Frame_Shift_Ins | 17 |
| In_Frame_Del | 17 |
| In_Frame_Ins | 2 |
| Missense_Mutation | 1237 |
| Nonsense_Mutation | 68 |
| Silent | 454 |
| Splice_Site | 51 |
| Start_Codon_SNP | 2 |
| Total | 1923 |
Table 2. Get Full Table A breakdown of mutation rates per category discovered for this individual set.
| category | n | N | rate | rate_per_mb | relative_rate | exp_ns_s_ratio |
|---|---|---|---|---|---|---|
| *CpG->T | 555 | 121008619 | 4.6e-06 | 4.6 | 7 | 2.1 |
| *Cp(A/C/T)->T | 187 | 1019738599 | 1.8e-07 | 0.18 | 0.28 | 1.7 |
| A->G | 136 | 1112999983 | 1.2e-07 | 0.12 | 0.19 | 2.3 |
| transver | 361 | 2253747201 | 1.6e-07 | 0.16 | 0.25 | 5.1 |
| indel+null | 226 | 2253747201 | 1e-07 | 0.1 | 0.15 | NaN |
| double_null | 4 | 2253747201 | 1.8e-09 | 0.0018 | 0.0027 | NaN |
| Total | 1469 | 2253747201 | 6.5e-07 | 0.65 | 1 | 3.5 |
The x axis represents the samples. The y axis represents the exons, one row per exon, and they are sorted by average coverage across samples. For exons with exactly the same average coverage, they are sorted next by the %GC of the exon. (The secondary sort is especially useful for the zero-coverage exons at the bottom). If the figure is unpopulated, then full coverage is assumed (e.g. MutSig CV doesn't use WIGs and assumes full coverage).
Figure 1.
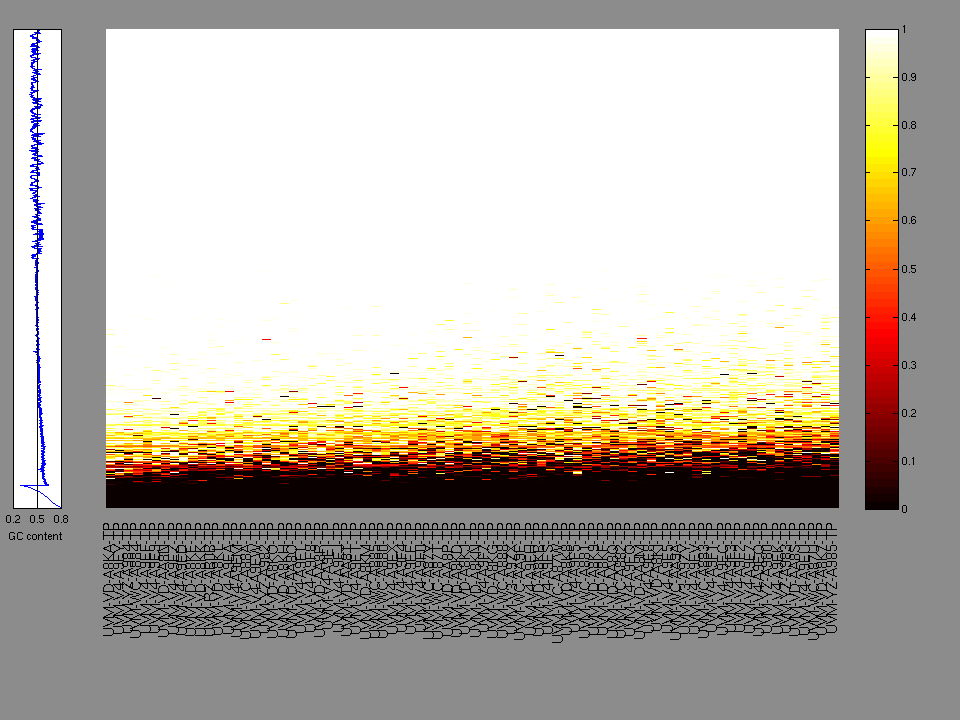
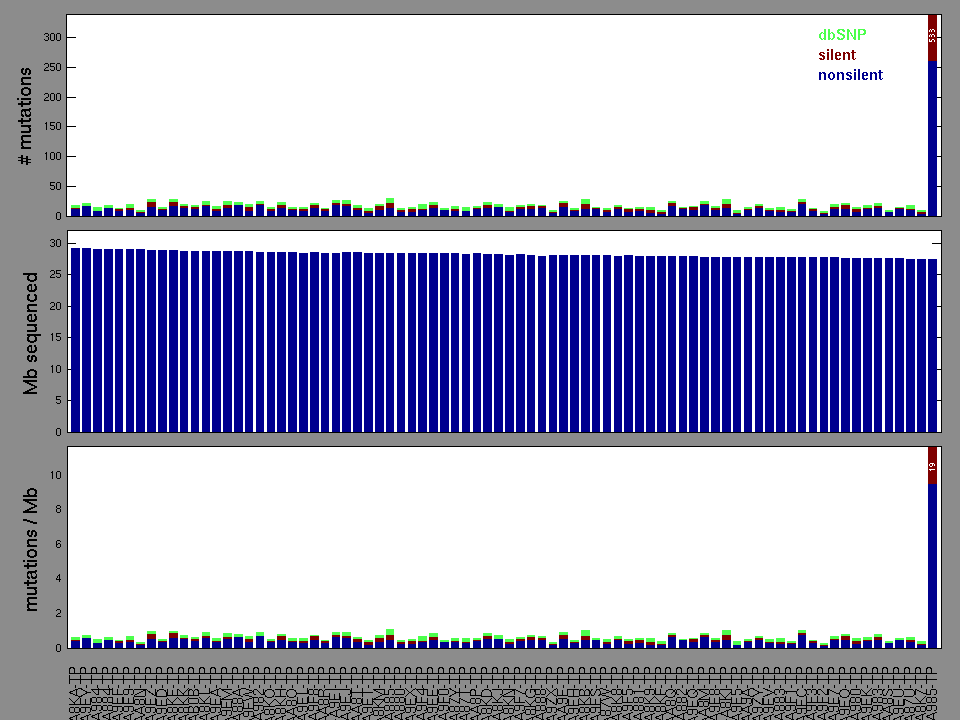
Figure 2. Patients counts and rates file used to generate this plot: UVM-TP.patients.counts_and_rates.txt
The mutation spectrum is depicted in the lego plots below in which the 96 possible mutation types are subdivided into six large blocks, color-coded to reflect the base substitution type. Each large block is further subdivided into the 16 possible pairs of 5' and 3' neighbors, as listed in the 4x4 trinucleotide context legend. The height of each block corresponds to the mutation frequency for that kind of mutation (counts of mutations normalized by the base coverage in a given bin). The shape of the spectrum is a signature for dominant mutational mechanisms in different tumor types.
Figure 3. Get High-res Image SNV Mutation rate lego plot for entire set. Each bin is normalized by base coverage for that bin. Colors represent the six SNV types on the upper right. The three-base context for each mutation is labeled in the 4x4 legend on the lower right. The fractional breakdown of SNV counts is shown in the pie chart on the upper left. If this figure is blank, not enough information was provided in the MAF to generate it.
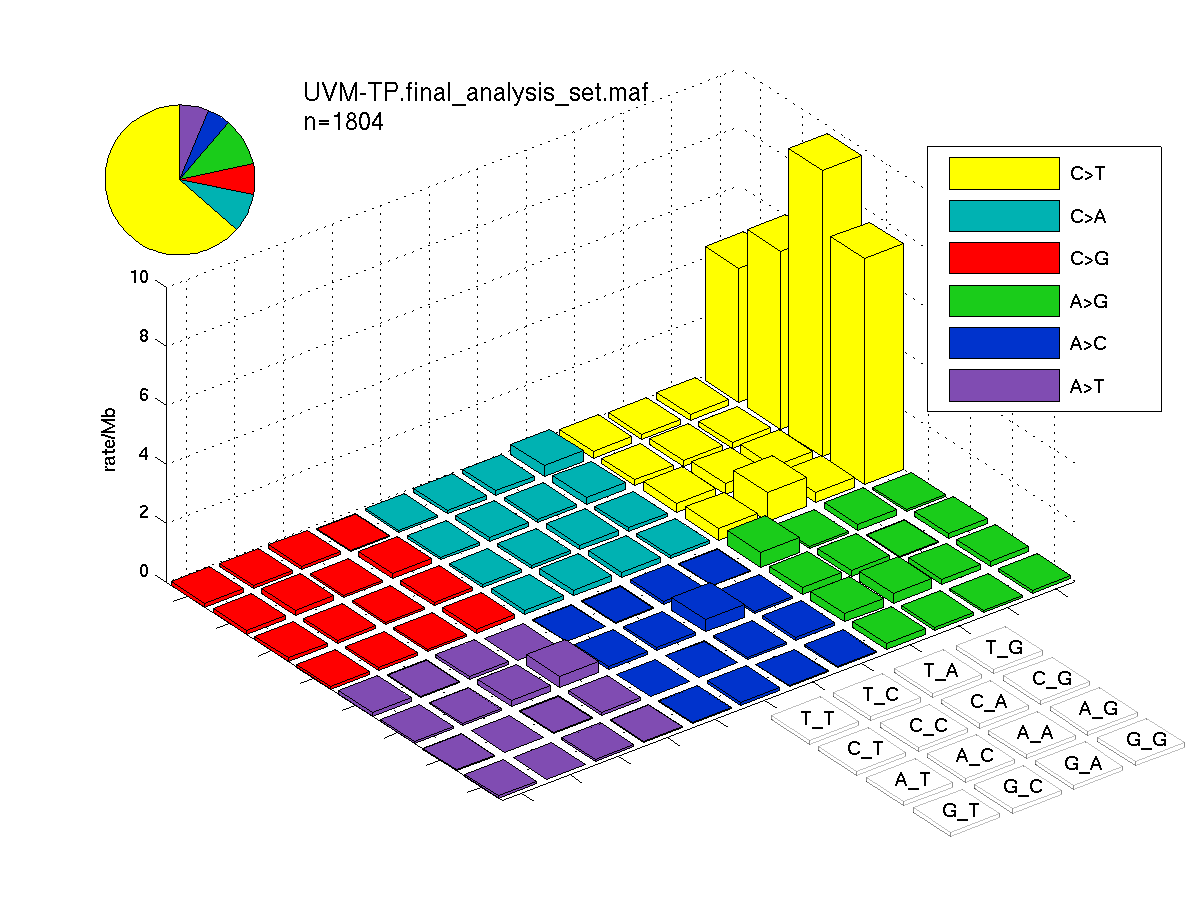
Figure 4. Get High-res Image SNV Mutation rate lego plots for 4 slices of mutation allele fraction (0<=AF<0.1, 0.1<=AF<0.25, 0.25<=AF<0.5, & 0.5<=AF) . The color code and three-base context legends are the same as the previous figure. If this figure is blank, not enough information was provided in the MAF to generate it.
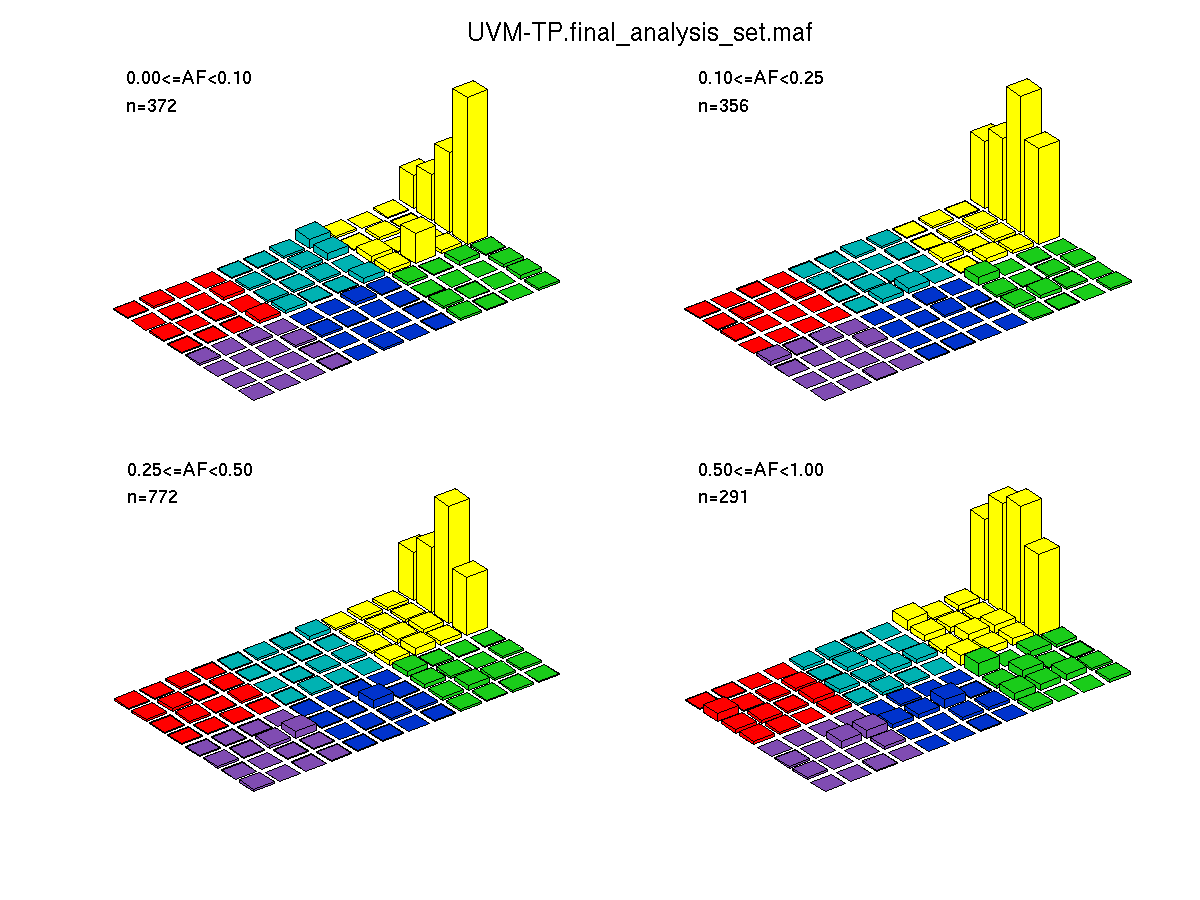
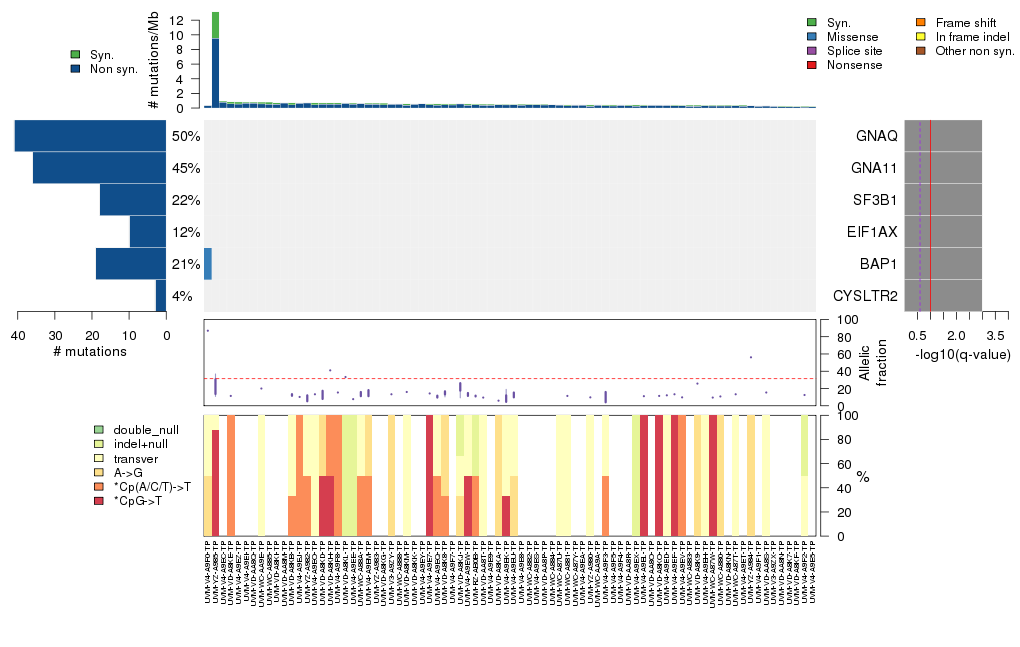
Figure 5. Get High-res Image The matrix in the center of the figure represents individual mutations in patient samples, color-coded by type of mutation, for the significantly mutated genes. The rate of synonymous and non-synonymous mutations is displayed at the top of the matrix. The barplot on the left of the matrix shows the number of mutations in each gene. The percentages represent the fraction of tumors with at least one mutation in the specified gene. The barplot to the right of the matrix displays the q-values for the most significantly mutated genes. The purple boxplots below the matrix (only displayed if required columns are present in the provided MAF) represent the distributions of allelic fractions observed in each sample. The plot at the bottom represents the base substitution distribution of individual samples, using the same categories that were used to calculate significance.
Column Descriptions:
-
N = number of sequenced bases in this gene across the individual set
-
n = number of (nonsilent) mutations in this gene across the individual set
-
npat = number of patients (individuals) with at least one nonsilent mutation
-
nsite = number of unique sites having a non-silent mutation
-
nsil = number of silent mutations in this gene across the individual set
-
n1 = number of nonsilent mutations of type: *CpG->T
-
n2 = number of nonsilent mutations of type: *Cp(A/C/T)->T
-
n3 = number of nonsilent mutations of type: A->G
-
n4 = number of nonsilent mutations of type: transver
-
n5 = number of nonsilent mutations of type: indel+null
-
n6 = number of nonsilent mutations of type: double_null
-
p_classic = p-value for the observed amount of nonsilent mutations being elevated in this gene
-
p_ns_s = p-value for the observed nonsilent/silent ratio being elevated in this gene
-
p_cons = p-value for enrichment of mutations at evolutionarily most-conserved sites in gene
-
p_joint = p-value for clustering + conservation
-
p = p-value (overall)
-
q = q-value, False Discovery Rate (Benjamini-Hochberg procedure)
Table 3. Get Full Table A Ranked List of Significantly Mutated Genes. Number of significant genes found: 6. Number of genes displayed: 35. Click on a gene name to display its stick figure depicting the distribution of mutations and mutation types across the chosen gene (this feature may not be available for all significant genes).
| rank | gene | description | N | n | npat | nsite | nsil | n1 | n2 | n3 | n4 | n5 | n6 | p_classic | p_ns_s | p_clust | p_cons | p_joint | p | q |
|---|---|---|---|---|---|---|---|---|---|---|---|---|---|---|---|---|---|---|---|---|
| 1 | GNAQ | guanine nucleotide binding protein (G protein), q polypeptide | 80906 | 41 | 40 | 4 | 0 | 2 | 0 | 0 | 38 | 1 | 0 | <1.00e-15 | 0.0012 | 0 | 0.00017 | 0 | <1.00e-15 | <4.49e-12 |
| 2 | GNA11 | guanine nucleotide binding protein (G protein), alpha 11 (Gq class) | 77747 | 36 | 36 | 3 | 0 | 2 | 0 | 0 | 34 | 0 | 0 | 1.44e-15 | 0.0013 | 0 | 0.00021 | 0 | <1.00e-15 | <4.49e-12 |
| 3 | SF3B1 | splicing factor 3b, subunit 1, 155kDa | 313797 | 18 | 18 | 5 | 0 | 14 | 0 | 1 | 3 | 0 | 0 | 5.33e-15 | 0.012 | 0 | 0.88 | 0 | <1.00e-15 | <4.49e-12 |
| 4 | EIF1AX | eukaryotic translation initiation factor 1A, X-linked | 34466 | 10 | 10 | 6 | 0 | 0 | 4 | 0 | 3 | 3 | 0 | 1.81e-14 | 0.11 | 4e-06 | 0.0013 | 0 | <1.00e-15 | <4.49e-12 |
| 5 | BAP1 | BRCA1 associated protein-1 (ubiquitin carboxy-terminal hydrolase) | 135417 | 19 | 17 | 19 | 0 | 0 | 0 | 2 | 2 | 11 | 4 | 8.66e-15 | 0.11 | 0.1 | 0.49 | 0.21 | 6.39e-14 | 2.30e-10 |
| 6 | CYSLTR2 | cysteinyl leukotriene receptor 2 | 83578 | 3 | 3 | 1 | 0 | 0 | 0 | 0 | 3 | 0 | 0 | 7.45e-06 | 0.58 | 0.000083 | 0.0039 | 0.000011 | 2.05e-09 | 6.15e-06 |
| 7 | PLCB4 | phospholipase C, beta 4 | 294902 | 3 | 2 | 2 | 0 | 1 | 0 | 0 | 2 | 0 | 0 | 0.0115 | 0.54 | 0.000083 | 0.025 | 0.00034 | 5.16e-05 | 0.132 |
| 8 | PLCB2 | phospholipase C, beta 2 | 246300 | 3 | 3 | 3 | 0 | 1 | 0 | 0 | 0 | 2 | 0 | 8.11e-05 | 0.55 | 0.094 | 0.5 | 0.18 | 0.000179 | 0.398 |
| 9 | MAPKAPK5 | mitogen-activated protein kinase-activated protein kinase 5 | 80593 | 2 | 2 | 2 | 0 | 0 | 0 | 0 | 0 | 2 | 0 | 0.000193 | 1 | 0.99 | 0.014 | 0.086 | 0.000200 | 0.398 |
| 10 | UBE2N | ubiquitin-conjugating enzyme E2N (UBC13 homolog, yeast) | 37996 | 1 | 1 | 1 | 0 | 1 | 0 | 0 | 0 | 0 | 0 | 0.000326 | 0.73 | NaN | NaN | NaN | 0.000326 | 0.543 |
| 11 | EIF1B | eukaryotic translation initiation factor 1B | 28613 | 2 | 2 | 2 | 0 | 0 | 0 | 0 | 1 | 1 | 0 | 3.14e-05 | 0.86 | 0.79 | 0.81 | 1 | 0.000357 | 0.543 |
| 12 | COL14A1 | collagen, type XIV, alpha 1 | 445955 | 3 | 3 | 3 | 0 | 1 | 1 | 1 | 0 | 0 | 0 | 0.000619 | 0.3 | 0.074 | 0.096 | 0.052 | 0.000363 | 0.543 |
| 13 | GMEB2 | glucocorticoid modulatory element binding protein 2 | 98241 | 2 | 2 | 2 | 0 | 0 | 0 | 1 | 0 | 1 | 0 | 0.000219 | 0.67 | 0.026 | 0.63 | 0.16 | 0.000404 | 0.558 |
| 14 | PLEKHF2 | pleckstrin homology domain containing, family F (with FYVE domain) member 2 | 60320 | 1 | 1 | 1 | 0 | 1 | 0 | 0 | 0 | 0 | 0 | 0.000529 | 0.9 | NaN | NaN | NaN | 0.000529 | 0.678 |
| 15 | TMOD2 | tropomodulin 2 (neuronal) | 87077 | 1 | 1 | 1 | 0 | 1 | 0 | 0 | 0 | 0 | 0 | 0.00124 | 0.77 | NaN | NaN | NaN | 0.00124 | 1.000 |
| 16 | OR1L1 | olfactory receptor, family 1, subfamily L, member 1 | 74800 | 1 | 1 | 1 | 0 | 1 | 0 | 0 | 0 | 0 | 0 | 0.00128 | 0.75 | NaN | NaN | NaN | 0.00128 | 1.000 |
| 17 | RPTN | repetin | 189040 | 2 | 2 | 2 | 0 | 1 | 0 | 1 | 0 | 0 | 0 | 0.000215 | 0.46 | 0.27 | 0.74 | 0.64 | 0.00135 | 1.000 |
| 18 | HSD17B7 | hydroxysteroid (17-beta) dehydrogenase 7 | 82585 | 2 | 2 | 2 | 0 | 0 | 1 | 0 | 1 | 0 | 0 | 0.000279 | 0.52 | 0.28 | 0.26 | 0.52 | 0.00142 | 1.000 |
| 19 | SNRPA1 | small nuclear ribonucleoprotein polypeptide A' | 56989 | 1 | 1 | 1 | 0 | 0 | 0 | 0 | 0 | 1 | 0 | 0.00152 | 1 | NaN | NaN | NaN | 0.00152 | 1.000 |
| 20 | SELE | selectin E (endothelial adhesion molecule 1) | 149603 | 2 | 2 | 2 | 0 | 0 | 0 | 0 | 2 | 0 | 0 | 0.00207 | 0.72 | 0.14 | 0.025 | 0.082 | 0.00163 | 1.000 |
| 21 | OR52M1 | olfactory receptor, family 52, subfamily M, member 1 | 76532 | 1 | 1 | 1 | 0 | 0 | 0 | 1 | 0 | 0 | 0 | 0.00166 | 0.72 | NaN | NaN | NaN | 0.00166 | 1.000 |
| 22 | XRCC3 | X-ray repair complementing defective repair in Chinese hamster cells 3 | 34076 | 1 | 1 | 1 | 0 | 0 | 0 | 1 | 0 | 0 | 0 | 0.00171 | 0.73 | NaN | NaN | NaN | 0.00171 | 1.000 |
| 23 | ZNF680 | zinc finger protein 680 | 120715 | 1 | 1 | 1 | 0 | 1 | 0 | 0 | 0 | 0 | 0 | 0.00176 | 0.85 | NaN | NaN | NaN | 0.00176 | 1.000 |
| 24 | PCGF6 | polycomb group ring finger 6 | 63580 | 1 | 1 | 1 | 0 | 0 | 0 | 0 | 0 | 1 | 0 | 0.00179 | 1 | NaN | NaN | NaN | 0.00179 | 1.000 |
| 25 | CCDC126 | coiled-coil domain containing 126 | 34118 | 1 | 1 | 1 | 1 | 0 | 0 | 1 | 0 | 0 | 0 | 0.00180 | 0.87 | NaN | NaN | NaN | 0.00180 | 1.000 |
| 26 | ARPC1B | actin related protein 2/3 complex, subunit 1B, 41kDa | 67615 | 1 | 1 | 1 | 0 | 0 | 0 | 1 | 0 | 0 | 0 | 0.00198 | 0.84 | NaN | NaN | NaN | 0.00198 | 1.000 |
| 27 | CNPY2 | canopy 2 homolog (zebrafish) | 45514 | 1 | 1 | 1 | 0 | 1 | 0 | 0 | 0 | 0 | 0 | 0.00224 | 0.79 | NaN | NaN | NaN | 0.00224 | 1.000 |
| 28 | OR2D3 | olfactory receptor, family 2, subfamily D, member 3 | 79663 | 1 | 1 | 1 | 0 | 0 | 1 | 0 | 0 | 0 | 0 | 0.00231 | 0.59 | NaN | NaN | NaN | 0.00231 | 1.000 |
| 29 | USP49 | ubiquitin specific peptidase 49 | 148283 | 2 | 2 | 2 | 0 | 1 | 0 | 0 | 0 | 1 | 0 | 0.000804 | 0.58 | 0.39 | 0.066 | 0.32 | 0.00240 | 1.000 |
| 30 | RAB2B | RAB2B, member RAS oncogene family | 54538 | 1 | 1 | 1 | 0 | 0 | 0 | 1 | 0 | 0 | 0 | 0.00251 | 0.72 | NaN | NaN | NaN | 0.00251 | 1.000 |
| 31 | MCEE | methylmalonyl CoA epimerase | 40902 | 1 | 1 | 1 | 0 | 0 | 1 | 0 | 0 | 0 | 0 | 0.00255 | 0.71 | NaN | NaN | NaN | 0.00255 | 1.000 |
| 32 | VPREB3 | pre-B lymphocyte gene 3 | 20218 | 1 | 1 | 1 | 0 | 0 | 1 | 0 | 0 | 0 | 0 | 0.00261 | 0.6 | NaN | NaN | NaN | 0.00261 | 1.000 |
| 33 | ZSWIM1 | zinc finger, SWIM-type containing 1 | 116960 | 1 | 1 | 1 | 0 | 0 | 0 | 1 | 0 | 0 | 0 | 0.00261 | 0.76 | NaN | NaN | NaN | 0.00261 | 1.000 |
| 34 | CANT1 | calcium activated nucleotidase 1 | 78668 | 1 | 1 | 1 | 0 | 0 | 0 | 1 | 0 | 0 | 0 | 0.00285 | 0.84 | NaN | NaN | NaN | 0.00285 | 1.000 |
| 35 | RPL36AL | ribosomal protein L36a-like | 26000 | 1 | 1 | 1 | 0 | 0 | 0 | 1 | 0 | 0 | 0 | 0.00293 | 0.73 | NaN | NaN | NaN | 0.00293 | 1.000 |
Figure S1. This figure depicts the distribution of mutations and mutation types across the GNAQ significant gene.
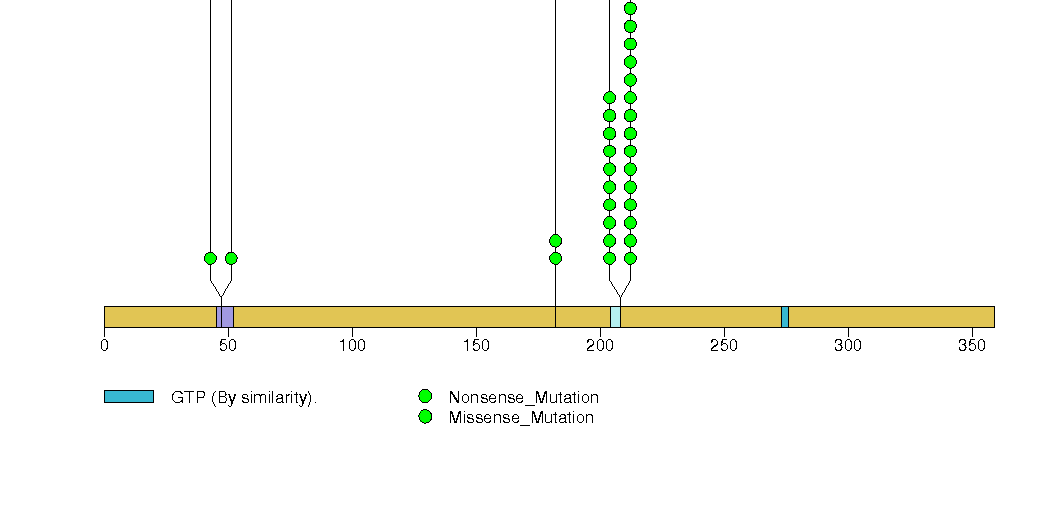
Figure S2. This figure depicts the distribution of mutations and mutation types across the GNA11 significant gene.
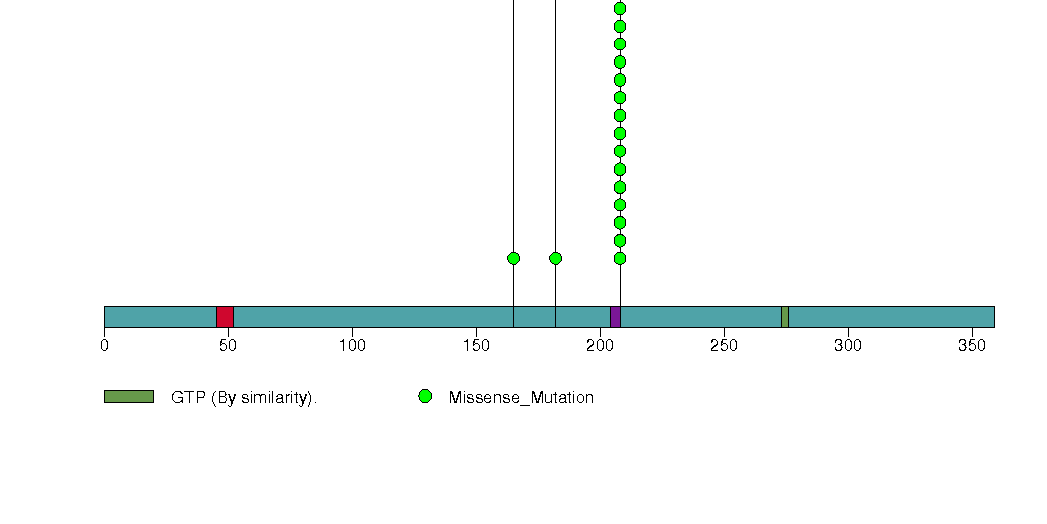
Figure S3. This figure depicts the distribution of mutations and mutation types across the SF3B1 significant gene.
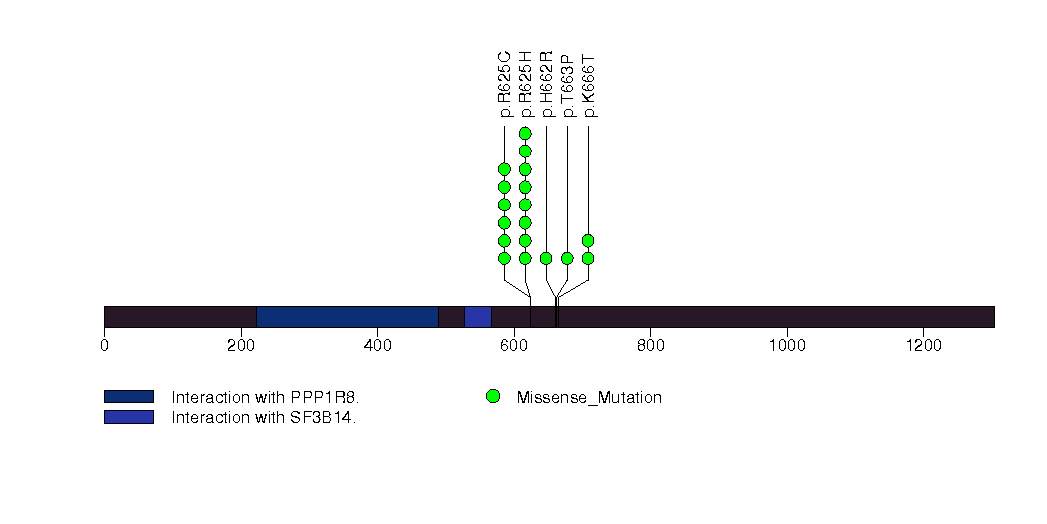
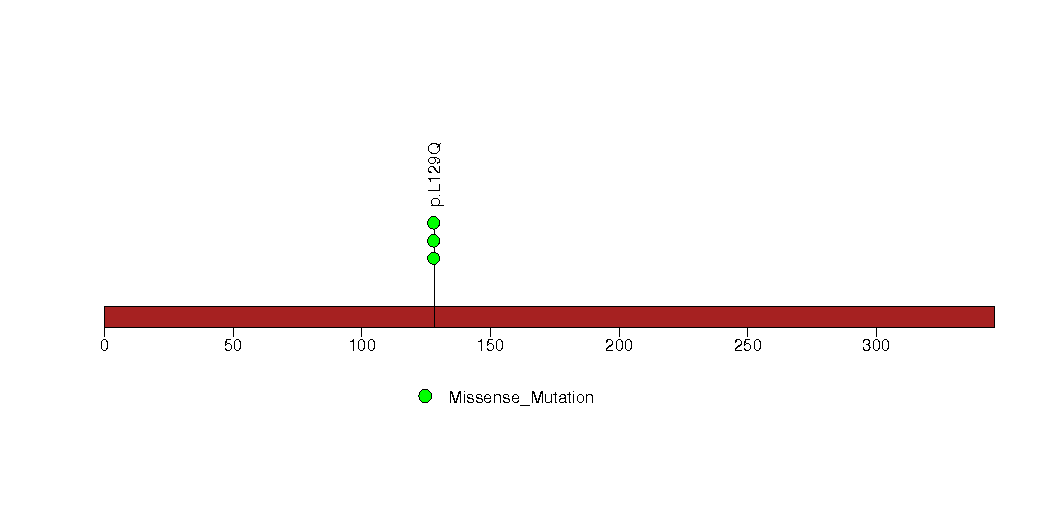
Figure S4. This figure depicts the distribution of mutations and mutation types across the EIF1AX significant gene.
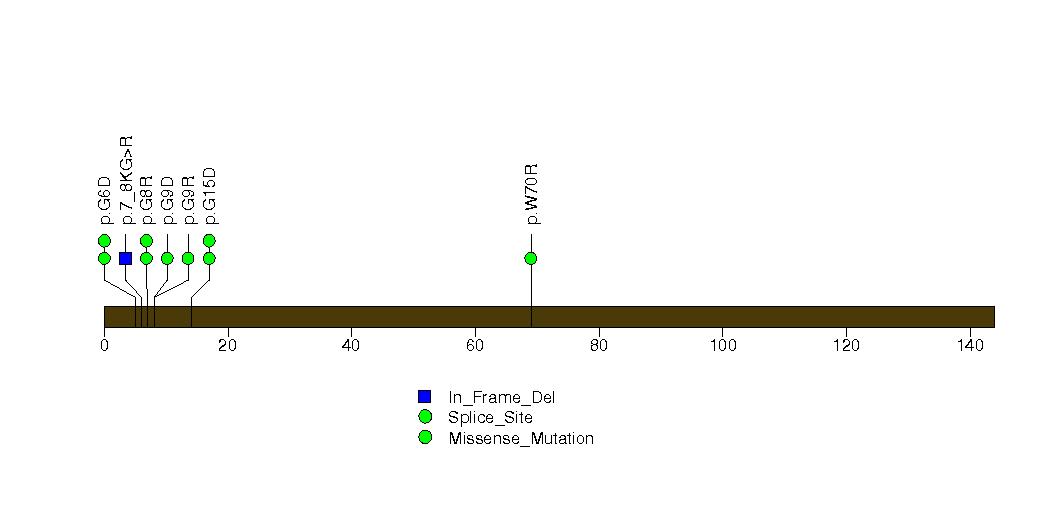
Figure S5. This figure depicts the distribution of mutations and mutation types across the BAP1 significant gene.
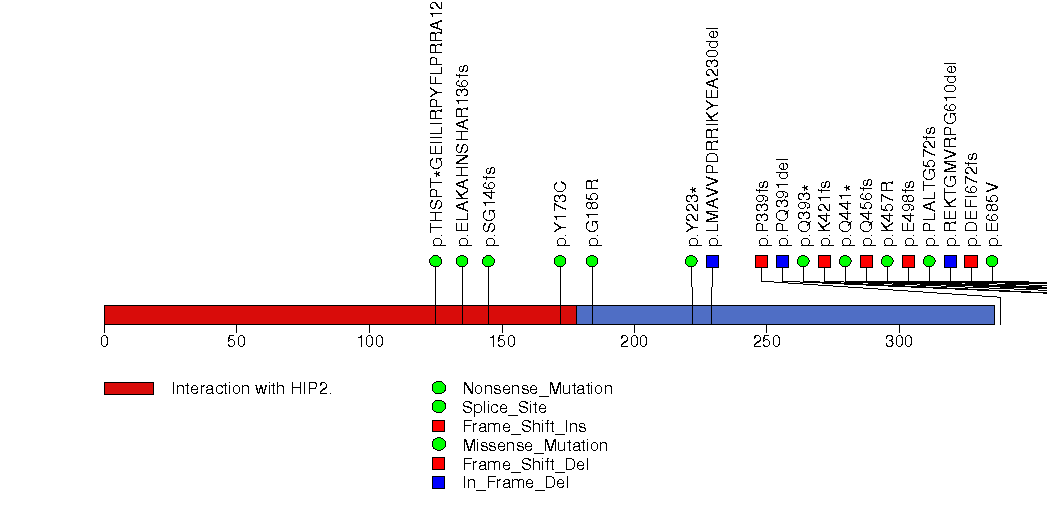
Figure S6. This figure depicts the distribution of mutations and mutation types across the CYSLTR2 significant gene.
In this analysis, COSMIC is used as a filter to increase power by restricting the territory of each gene. Cosmic version: v48.
Table 4. Get Full Table Significantly mutated genes (COSMIC territory only). To access the database please go to: COSMIC. Number of significant genes found: 5. Number of genes displayed: 10
| rank | gene | description | n | cos | n_cos | N_cos | cos_ev | p | q |
|---|---|---|---|---|---|---|---|---|---|
| 1 | GNAQ | guanine nucleotide binding protein (G protein), q polypeptide | 41 | 4 | 37 | 320 | 3811 | 1.4e-14 | 6.2e-11 |
| 2 | BAP1 | BRCA1 associated protein-1 (ubiquitin carboxy-terminal hydrolase) | 19 | 2 | 2 | 160 | 1 | 5.4e-09 | 0.000012 |
| 3 | RAB38 | RAB38, member RAS oncogene family | 1 | 1 | 1 | 80 | 1 | 0.000052 | 0.059 |
| 4 | RGAG4 | retrotransposon gag domain containing 4 | 2 | 1 | 1 | 80 | 1 | 0.000052 | 0.059 |
| 5 | GNA11 | guanine nucleotide binding protein (G protein), alpha 11 (Gq class) | 36 | 2 | 1 | 160 | 1 | 0.0001 | 0.094 |
| 6 | RET | ret proto-oncogene | 1 | 49 | 1 | 3920 | 1 | 0.0026 | 1 |
| 7 | BRCA2 | breast cancer 2, early onset | 2 | 59 | 1 | 4720 | 0 | 0.0031 | 1 |
| 8 | FBXW7 | F-box and WD repeat domain containing 7 | 1 | 91 | 1 | 7280 | 31 | 0.0047 | 1 |
| 9 | CDKN2A | cyclin-dependent kinase inhibitor 2A (melanoma, p16, inhibits CDK4) | 1 | 332 | 1 | 26560 | 6 | 0.017 | 1 |
| 10 | A4GNT | alpha-1,4-N-acetylglucosaminyltransferase | 0 | 0 | 0 | 0 | 0 | 1 | 1 |
Note:
n - number of (nonsilent) mutations in this gene across the individual set.
cos = number of unique mutated sites in this gene in COSMIC
n_cos = overlap between n and cos.
N_cos = number of individuals times cos.
cos_ev = total evidence: number of reports in COSMIC for mutations seen in this gene.
p = p-value for seeing the observed amount of overlap in this gene)
q = q-value, False Discovery Rate (Benjamini-Hochberg procedure)
Table 5. Get Full Table A Ranked List of Significantly Mutated Genesets. (Source: MSigDB GSEA Cannonical Pathway Set).Number of significant genesets found: 32. Number of genesets displayed: 10
| rank | geneset | description | genes | N_genes | mut_tally | N | n | npat | nsite | nsil | n1 | n2 | n3 | n4 | n5 | n6 | p_ns_s | p | q |
|---|---|---|---|---|---|---|---|---|---|---|---|---|---|---|---|---|---|---|---|
| 1 | HSA04540_GAP_JUNCTION | Genes involved in gap junction | ADCY1, ADCY2, ADCY3, ADCY4, ADCY5, ADCY6, ADCY7, ADCY8, ADCY9, ADRB1, CDC2, CSNK1D, DRD1, DRD2, EDG2, EGF, EGFR, GJA1, GJD2, GNA11, GNAI1, GNAI2, GNAI3, GNAQ, GNAS, GRB2, GRM1, GRM5, GUCY1A2, GUCY1A3, GUCY1B3, GUCY2C, GUCY2D, GUCY2F, HRAS, HTR2A, HTR2B, HTR2C, ITPR1, ITPR2, ITPR3, KRAS, LOC643224, LOC654264, MAP2K1, MAP2K2, MAP2K5, MAP3K2, MAPK1, MAPK3, MAPK7, NPR1, NPR2, NRAS, PDGFA, PDGFB, PDGFC, PDGFD, PDGFRA, PDGFRB, PLCB1, PLCB2, PLCB3, PLCB4, PRKACA, PRKACB, PRKACG, PRKCA, PRKCB1, PRKCG, PRKG1, PRKG2, PRKX, PRKY, RAF1, SOS1, SOS2, SRC, TJP1, TUBA1A, TUBA1B, TUBA1C, TUBA3C, TUBA3D, TUBA3E, TUBA4A, TUBA8, TUBAL3, TUBB, TUBB1, TUBB2A, TUBB2B, TUBB2C, TUBB3, TUBB4, TUBB4Q, TUBB6, TUBB8 | 92 | ADCY4(1), EGF(1), GJA1(1), GNA11(36), GNAQ(41), HTR2B(1), ITPR1(1), ITPR2(1), PDGFRA(1), PLCB2(3), PLCB4(3), PRKG1(1) | 15229164 | 91 | 75 | 20 | 6 | 11 | 0 | 0 | 75 | 5 | 0 | 0.00013 | <1.00e-15 | <8.80e-14 |
| 2 | ST_DIFFERENTIATION_PATHWAY_IN_PC12_CELLS | Rat-derived PC12 cells respond to nerve growth factor (NGF) and PACAP to differentiate into neuronal cells. | AKT1, ASAH1, ATF1, BRAF, CAMP, CREB1, CREB3, CREB5, CREBBP, CRKL, DAG1, EGR1, EGR2, EGR3, EGR4, ELK1, FRS2, GAS, GNAQ, GRF2, JUN, MAP1B, MAP2K4, MAP2K7, MAPK1, MAPK10, MAPK3, MAPK8, MAPK8IP1, MAPK8IP2, MAPK8IP3, MAPK9, NTRK1, OPN1LW, PACAP, PIK3C2G, PIK3CA, PIK3CD, PIK3R1, PTPN11, RPS6KA3, SH2B, SHC1, SRC, TERF2IP, TH, TUBA3 | 42 | GNAQ(41), MAPK8IP2(1), MAPK8IP3(1) | 5810912 | 43 | 42 | 6 | 0 | 2 | 0 | 1 | 39 | 1 | 0 | 0.00021 | <1.00e-15 | <8.80e-14 |
| 3 | MYOSINPATHWAY | Myosin light chain kinase phosphorylates myosin and promotes muscle contraction and platelet formation; myosin phosphatase antagonizes these processes. | ARHGAP5, ARHGEF1, GNA12, GNA13, GNAQ, GNB1, GNGT1, MYL2, MYLK, PLCB1, PPP1R12B, PRKCA, PRKCB1, PRKCL1, ROCK1 | 13 | GNAQ(41), GNB1(2) | 2393153 | 43 | 41 | 6 | 0 | 3 | 0 | 0 | 39 | 1 | 0 | 0.00046 | <1.00e-15 | <8.80e-14 |
| 4 | TUBBYPATHWAY | Tubby is activated by phospholipase C activity and hydrolysis of PIP2, after which it enters the nucleus and regulates transcription. | CHRM1, GNAQ, GNB1, GNGT1, HTR2C, PLCB1, TUB | 7 | CHRM1(1), GNAQ(41), GNB1(2) | 840313 | 44 | 41 | 7 | 0 | 4 | 0 | 0 | 39 | 1 | 0 | 0.00018 | <1.00e-15 | <8.80e-14 |
| 5 | CCR5PATHWAY | CCR5 is a G-protein coupled receptor expressed in macrophages that recognizes chemokine ligands and is targeted by the HIV envelope protein GP120. | CALM1, CALM2, CALM3, CCL2, CCL4, CCR5, CXCL12, CXCR4, FOS, GNAQ, JUN, MAPK14, MAPK8, PLCG1, PRKCA, PRKCB1, PTK2B, SYT1 | 17 | GNAQ(41) | 1605284 | 41 | 40 | 4 | 0 | 2 | 0 | 0 | 38 | 1 | 0 | 0.00065 | <1.00e-15 | <8.80e-14 |
| 6 | PYK2PATHWAY | Pyk2 and Rac1 stimulate the JNK cascade and activate MKK3, which activates p38. | BCAR1, CALM1, CALM2, CALM3, CRKL, GNAQ, GRB2, HRAS, JUN, MAP2K1, MAP2K2, MAP2K3, MAP2K4, MAP3K1, MAPK1, MAPK14, MAPK3, MAPK8, PAK1, PLCG1, PRKCA, PRKCB1, PTK2B, RAC1, RAF1, SHC1, SOS1, SRC, SYT1 | 28 | GNAQ(41), MAP2K3(1) | 3298743 | 42 | 40 | 5 | 0 | 2 | 0 | 0 | 38 | 2 | 0 | 0.00037 | <1.00e-15 | <8.80e-14 |
| 7 | BIOPEPTIDESPATHWAY | Extracellular signaling peptides exert biological effects via G-protein coupled receptors (GPCRs), which activate intracellular GTPases. | AGT, AGTR2, BDK, CALM1, CALM2, CALM3, CAMK2A, CAMK2B, CAMK2D, CAMK2G, CDK5, F2, FYN, GNA11, GNAI1, GNB1, GNGT1, GRB2, HRAS, JAK2, MAP2K1, MAP2K2, MAPK1, MAPK14, MAPK3, MAPK8, MAPT, MYLK, PLCG1, PRKCA, PRKCB1, PTK2B, RAF1, SHC1, SOS1, STAT1, STAT3, STAT5A, SYT1 | 37 | GNA11(36), GNB1(2) | 4817051 | 38 | 37 | 5 | 0 | 3 | 0 | 0 | 35 | 0 | 0 | 0.00078 | <1.00e-15 | <8.80e-14 |
| 8 | ST_GRANULE_CELL_SURVIVAL_PATHWAY | The survival and differentiation of granule cells in the brain is controlled by pro-growth PACAP and pro-apoptotic ceramides. | ADPRT, APC, ASAH1, CAMP, CASP3, CERK, CREB1, CREB3, CREB5, CXCL2, DAG1, EPHB2, FOS, GNAQ, IL8RB, ITPKA, ITPKB, JUN, MAP2K4, MAP2K7, MAPK1, MAPK10, MAPK8, MAPK8IP1, MAPK8IP2, MAPK8IP3, MAPK9, PACAP | 25 | APC(2), GNAQ(41), ITPKB(1), MAPK8IP2(1), MAPK8IP3(1) | 3259817 | 46 | 43 | 9 | 0 | 2 | 0 | 1 | 42 | 1 | 0 | 0.00012 | 1.33e-15 | 1.03e-13 |
| 9 | CXCR4PATHWAY | CXCR4 is a G-protein coupled receptor that responds to the ligand SDF-1 by activating Ras and PI3 kinase to promote lymphocyte chemotaxis. | BCAR1, CRK, CXCL12, CXCR4, GNAI1, GNAQ, GNB1, GNGT1, HRAS, MAP2K1, MAPK1, MAPK3, NFKB1, PIK3C2G, PIK3CA, PIK3R1, PLCG1, PRKCA, PRKCB1, PTK2, PTK2B, PXN, RAF1, RELA | 23 | GNAQ(41), GNB1(2) | 3160447 | 43 | 41 | 6 | 0 | 3 | 0 | 0 | 39 | 1 | 0 | 0.00036 | 1.67e-15 | 1.05e-13 |
| 10 | G_PROTEIN_SIGNALING | ADCY1, ADCY2, ADCY3, ADCY4, ADCY5, ADCY6, ADCY7, ADCY8, ADCY9, AKAP1, AKAP10, AKAP11, AKAP12, AKAP2, PALM2_AKAP2, AKAP3, AKAP4, AKAP5, AKAP6, AKAP7, AKAP8, AKAP9, ARHGEF1, CALM1, CALM2, CALM3, CHMP1B, GNA11, GNA12, GNA13, GNA14, GNA15, GNAI2, GNAI3, GNAL, GNAO1, GNAQ, GNAZ, GNB1, GNB2, GNB3, GNB5, GNG10, GNG10, LOC552891, GNG12, GNG13, GNG3, GNG4, GNG5, GNG7, GNGT1, GNGT2, HRAS, IL18BP, ITPR1, KCNJ3, KRAS, MGC11266, NRAS, PALM2, PALM2_AKAP2, PALM2_AKAP2, PDE1A, PDE1B, PDE1C, PDE4A, PDE4B, PDE4C, PDE4D, PDE7A, PDE7B, PDE8A, PDE8B, PLCB3, PPP3CA, PPP3CC, PRKACA, PRKACB, PRKACG, PRKAR1A, PRKAR1B, PRKAR2A, PRKAR2B, PRKCA, PRKCB1, PRKCD, PRKCE, PRKCG, PRKCH, PRKCI, PRKCQ, PRKCZ, PRKD1, PRKD3, RHOA, RRAS, SARA1, SLC9A1, USP5 | 92 | ADCY4(1), AKAP9(1), GNA11(36), GNAQ(41), GNB1(2), GNB3(1), ITPR1(1), PDE4D(1), PDE8B(1), PRKD1(1) | 13427629 | 86 | 74 | 16 | 4 | 6 | 1 | 2 | 73 | 4 | 0 | 0.000086 | 1.89e-15 | 1.05e-13 |
Table 6. Get Full Table A Ranked List of Significantly Mutated Genesets (Excluding Significantly Mutated Genes). Number of significant genesets found: 0. Number of genesets displayed: 10
| rank | geneset | description | genes | N_genes | mut_tally | N | n | npat | nsite | nsil | n1 | n2 | n3 | n4 | n5 | n6 | p_ns_s | p | q |
|---|---|---|---|---|---|---|---|---|---|---|---|---|---|---|---|---|---|---|---|
| 1 | HSA04742_TASTE_TRANSDUCTION | Genes involved in taste transduction | ACCN1, ADCY4, ADCY6, ADCY8, CACNA1A, CACNA1B, GNAS, GNAT3, GNB1, GNB3, GNG13, GNG3, GRM4, ITPR3, KCNB1, PDE1A, PLCB2, PRKACA, PRKACB, PRKACG, PRKX, PRKY, SCNN1A, SCNN1B, SCNN1G, TAS1R1, TAS1R2, TAS1R3, TAS2R1, TAS2R10, TAS2R13, TAS2R14, TAS2R16, TAS2R3, TAS2R38, TAS2R39, TAS2R4, TAS2R40, TAS2R41, TAS2R42, TAS2R43, TAS2R44, TAS2R45, TAS2R46, TAS2R48, TAS2R49, TAS2R5, TAS2R50, TAS2R60, TAS2R7, TAS2R8, TAS2R9, TRPM5 | 48 | ADCY4(1), CACNA1A(1), CACNA1B(2), GNB1(2), GNB3(1), PLCB2(3), TAS1R2(1), TRPM5(1) | 6427695 | 12 | 11 | 12 | 2 | 4 | 1 | 1 | 2 | 4 | 0 | 0.32 | 0.00058 | 0.36 |
| 2 | SA_DIACYLGLYCEROL_SIGNALING | DAG (diacylglycerol) signaling activity | ESR1, ESR2, ITPKA, PDE1A, PDE1B, PLCB1, PLCB2, PRL, TRH, VIP | 10 | ESR1(1), PLCB2(3) | 1275965 | 4 | 4 | 4 | 0 | 1 | 1 | 0 | 0 | 2 | 0 | 0.31 | 0.0023 | 0.71 |
| 3 | STEROID_BIOSYNTHESIS | CYP17A1, F13B, HSD17B1, HSD17B2, HSD17B3, HSD17B4, HSD17B7, HSD3B1, HSD3B2 | 9 | CYP17A1(1), HSD17B1(1), HSD17B7(2) | 949947 | 4 | 3 | 4 | 0 | 1 | 1 | 1 | 1 | 0 | 0 | 0.24 | 0.0061 | 1 | |
| 4 | TUBBYPATHWAY | Tubby is activated by phospholipase C activity and hydrolysis of PIP2, after which it enters the nucleus and regulates transcription. | CHRM1, GNAQ, GNB1, GNGT1, HTR2C, PLCB1, TUB | 6 | CHRM1(1), GNB1(2) | 759407 | 3 | 3 | 3 | 0 | 2 | 0 | 0 | 1 | 0 | 0 | 0.4 | 0.01 | 1 |
| 5 | CDC42RACPATHWAY | PI3 kinase stimulates cell migration by activating cdc42, which activates ARP2/3, which in turn promotes formation of new actin fibers. | ACTR2, ACTR3, ARHA, ARPC1A, ARPC1B, ARPC2, ARPC3, ARPC4, CDC42, PAK1, PDGFRA, PIK3CA, PIK3R1, RAC1, WASL | 14 | ARPC1B(1), ARPC2(1), PDGFRA(1) | 1582336 | 3 | 3 | 3 | 1 | 1 | 1 | 1 | 0 | 0 | 0 | 0.64 | 0.014 | 1 |
| 6 | 1_2_DICHLOROETHANE_DEGRADATION | ALDH1A1, ALDH1A2, ALDH1A3, ALDH1B1, ALDH2, ALDH3A1, ALDH3A2, ALDH9A1 | 8 | ALDH1A3(1), ALDH2(1), ALDH9A1(1) | 922476 | 3 | 3 | 3 | 0 | 1 | 1 | 0 | 1 | 0 | 0 | 0.33 | 0.015 | 1 | |
| 7 | ASCORBATE_AND_ALDARATE_METABOLISM | ALDH1A1, ALDH1A2, ALDH1A3, ALDH1B1, ALDH2, ALDH3A1, ALDH3A2, ALDH9A1 | 8 | ALDH1A3(1), ALDH2(1), ALDH9A1(1) | 922476 | 3 | 3 | 3 | 0 | 1 | 1 | 0 | 1 | 0 | 0 | 0.33 | 0.015 | 1 | |
| 8 | HSA00053_ASCORBATE_AND_ALDARATE_METABOLISM | Genes involved in ascorbate and aldarate metabolism | ALDH1A3, ALDH1B1, ALDH2, ALDH3A1, ALDH3A2, ALDH7A1, ALDH9A1, MIOX, UGDH | 9 | ALDH1A3(1), ALDH2(1), ALDH9A1(1) | 984315 | 3 | 3 | 3 | 0 | 1 | 1 | 0 | 1 | 0 | 0 | 0.34 | 0.018 | 1 |
| 9 | ST_GRANULE_CELL_SURVIVAL_PATHWAY | The survival and differentiation of granule cells in the brain is controlled by pro-growth PACAP and pro-apoptotic ceramides. | ADPRT, APC, ASAH1, CAMP, CASP3, CERK, CREB1, CREB3, CREB5, CXCL2, DAG1, EPHB2, FOS, GNAQ, IL8RB, ITPKA, ITPKB, JUN, MAP2K4, MAP2K7, MAPK1, MAPK10, MAPK8, MAPK8IP1, MAPK8IP2, MAPK8IP3, MAPK9, PACAP | 24 | APC(2), ITPKB(1), MAPK8IP2(1), MAPK8IP3(1) | 3178911 | 5 | 5 | 5 | 0 | 0 | 0 | 1 | 4 | 0 | 0 | 0.34 | 0.021 | 1 |
| 10 | HSA00533_KERATAN_SULFATE_BIOSYNTHESIS | Genes involved in keratan sulfate biosynthesis | B3GNT1, B3GNT2, B3GNT7, B4GALT1, B4GALT2, B4GALT3, B4GALT4, CHST1, CHST2, CHST4, CHST6, FUT8, ST3GAL1, ST3GAL2, ST3GAL3, ST3GAL4 | 16 | B4GALT4(1), CHST2(1), CHST4(1) | 1414921 | 3 | 3 | 3 | 0 | 2 | 1 | 0 | 0 | 0 | 0 | 0.27 | 0.022 | 1 |
In brief, we tabulate the number of mutations and the number of covered bases for each gene. The counts are broken down by mutation context category: four context categories that are discovered by MutSig, and one for indel and 'null' mutations, which include indels, nonsense mutations, splice-site mutations, and non-stop (read-through) mutations. For each gene, we calculate the probability of seeing the observed constellation of mutations, i.e. the product P1 x P2 x ... x Pm, or a more extreme one, given the background mutation rates calculated across the dataset. [1]
In addition to the links below, the full results of the analysis summarized in this report can also be downloaded programmatically using firehose_get, or interactively from either the Broad GDAC website or TCGA Data Coordination Center Portal.