(primary solid tumor cohort)
This report serves to describe the mutational landscape and properties of a given individual set, as well as rank genes and genesets according to mutational significance. MutSig v2.0 was used to generate the results found in this report.
-
Working with individual set: GBM-TP
-
Number of patients in set: 291
The input for this pipeline is a set of individuals with the following files associated for each:
-
An annotated .maf file describing the mutations called for the respective individual, and their properties.
-
A .wig file that contains information about the coverage of the sample.
-
MAF used for this analysis:GBM-TP.final_analysis_set.maf
-
Significantly mutated genes (q ≤ 0.1): 116
-
Mutations seen in COSMIC: 0
-
Significantly mutated genes in COSMIC territory: 0
-
Genes with clustered mutations (≤ 3 aa apart): 1
-
Significantly mutated genesets: 190
-
Significantly mutated genesets: (excluding sig. mutated genes):16
-
Read 291 MAFs of type "Broad"
-
Total number of mutations in input MAFs: 21540
-
After removing 126 blacklisted mutations: 21414
-
Number of mutations before filtering: 21414
-
After removing 234 mutations outside gene set: 21180
-
After removing 5581 mutations outside category set: 15599
-
After removing 62 "impossible" mutations in
-
gene-patient-category bins of zero coverage: 9722
Table 1. Get Full Table Table representing breakdown of mutations by type.
| type | count |
|---|---|
| Frame_Shift_Del | 537 |
| Frame_Shift_Ins | 206 |
| In_Frame_Del | 206 |
| In_Frame_Ins | 26 |
| Missense_Mutation | 9859 |
| Nonsense_Mutation | 591 |
| Nonstop_Mutation | 9 |
| Silent | 3837 |
| Splice_Site | 283 |
| Translation_Start_Site | 45 |
| Total | 15599 |
Table 2. Get Full Table A breakdown of mutation rates per category discovered for this individual set.
| category | n | N | rate | rate_per_mb | relative_rate |
|---|---|---|---|---|---|
| A->T | 2819 | 4185997415 | 6.7e-07 | 0.67 | 0.49 |
| C->(A/T) | 4383 | 4350488149 | 1e-06 | 1 | 0.73 |
| A->(C/G) | 1952 | 4185997415 | 4.7e-07 | 0.47 | 0.34 |
| C->G | 711 | 4350488149 | 1.6e-07 | 0.16 | 0.12 |
| indel+null | 1854 | 8536485735 | 2.2e-07 | 0.22 | 0.16 |
| double_null | 0 | 8536485735 | 0 | 0 | 0 |
| Total | 11719 | 8536485735 | 1.4e-06 | 1.4 | 1 |
The x axis represents the samples. The y axis represents the exons, one row per exon, and they are sorted by average coverage across samples. For exons with exactly the same average coverage, they are sorted next by the %GC of the exon. (The secondary sort is especially useful for the zero-coverage exons at the bottom).
Figure 1.
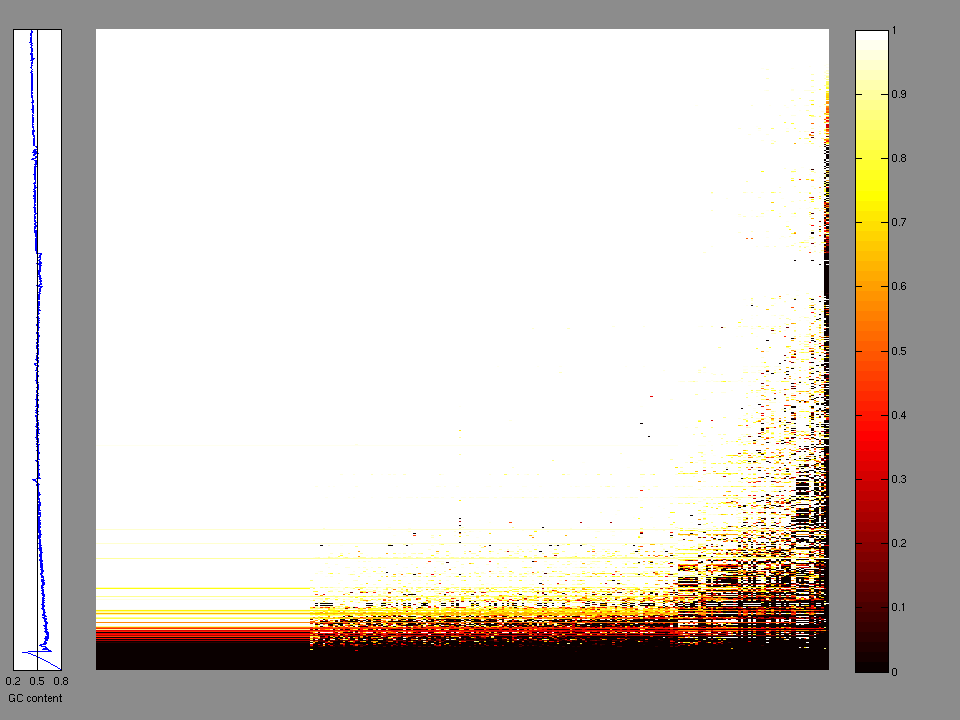
Figure 2. Patients counts and rates file used to generate this plot: GBM-TP.patients.counts_and_rates.txt
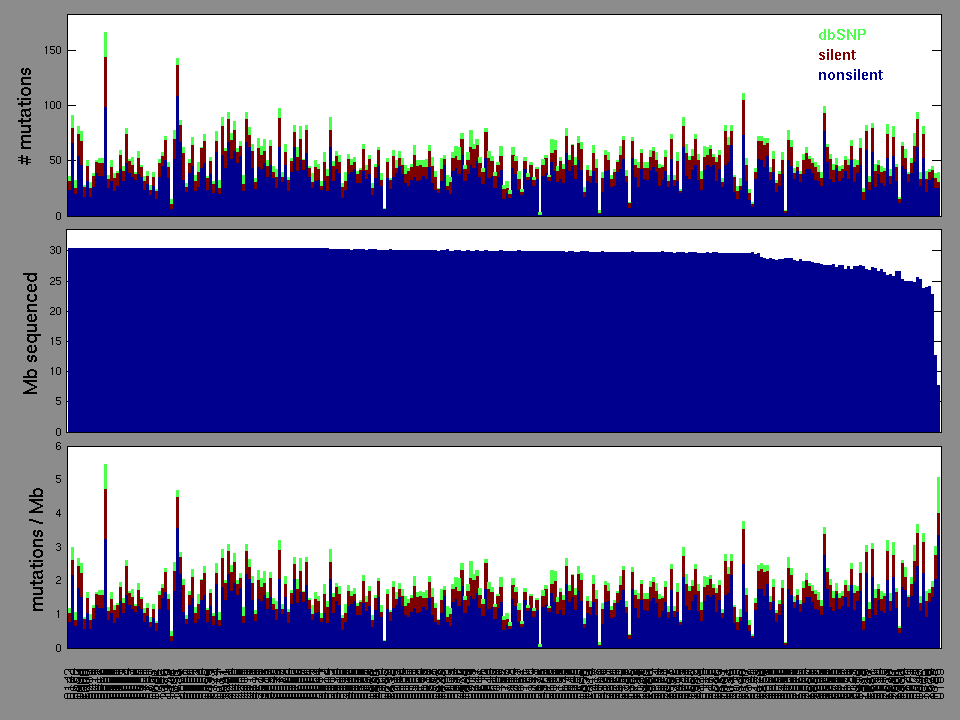
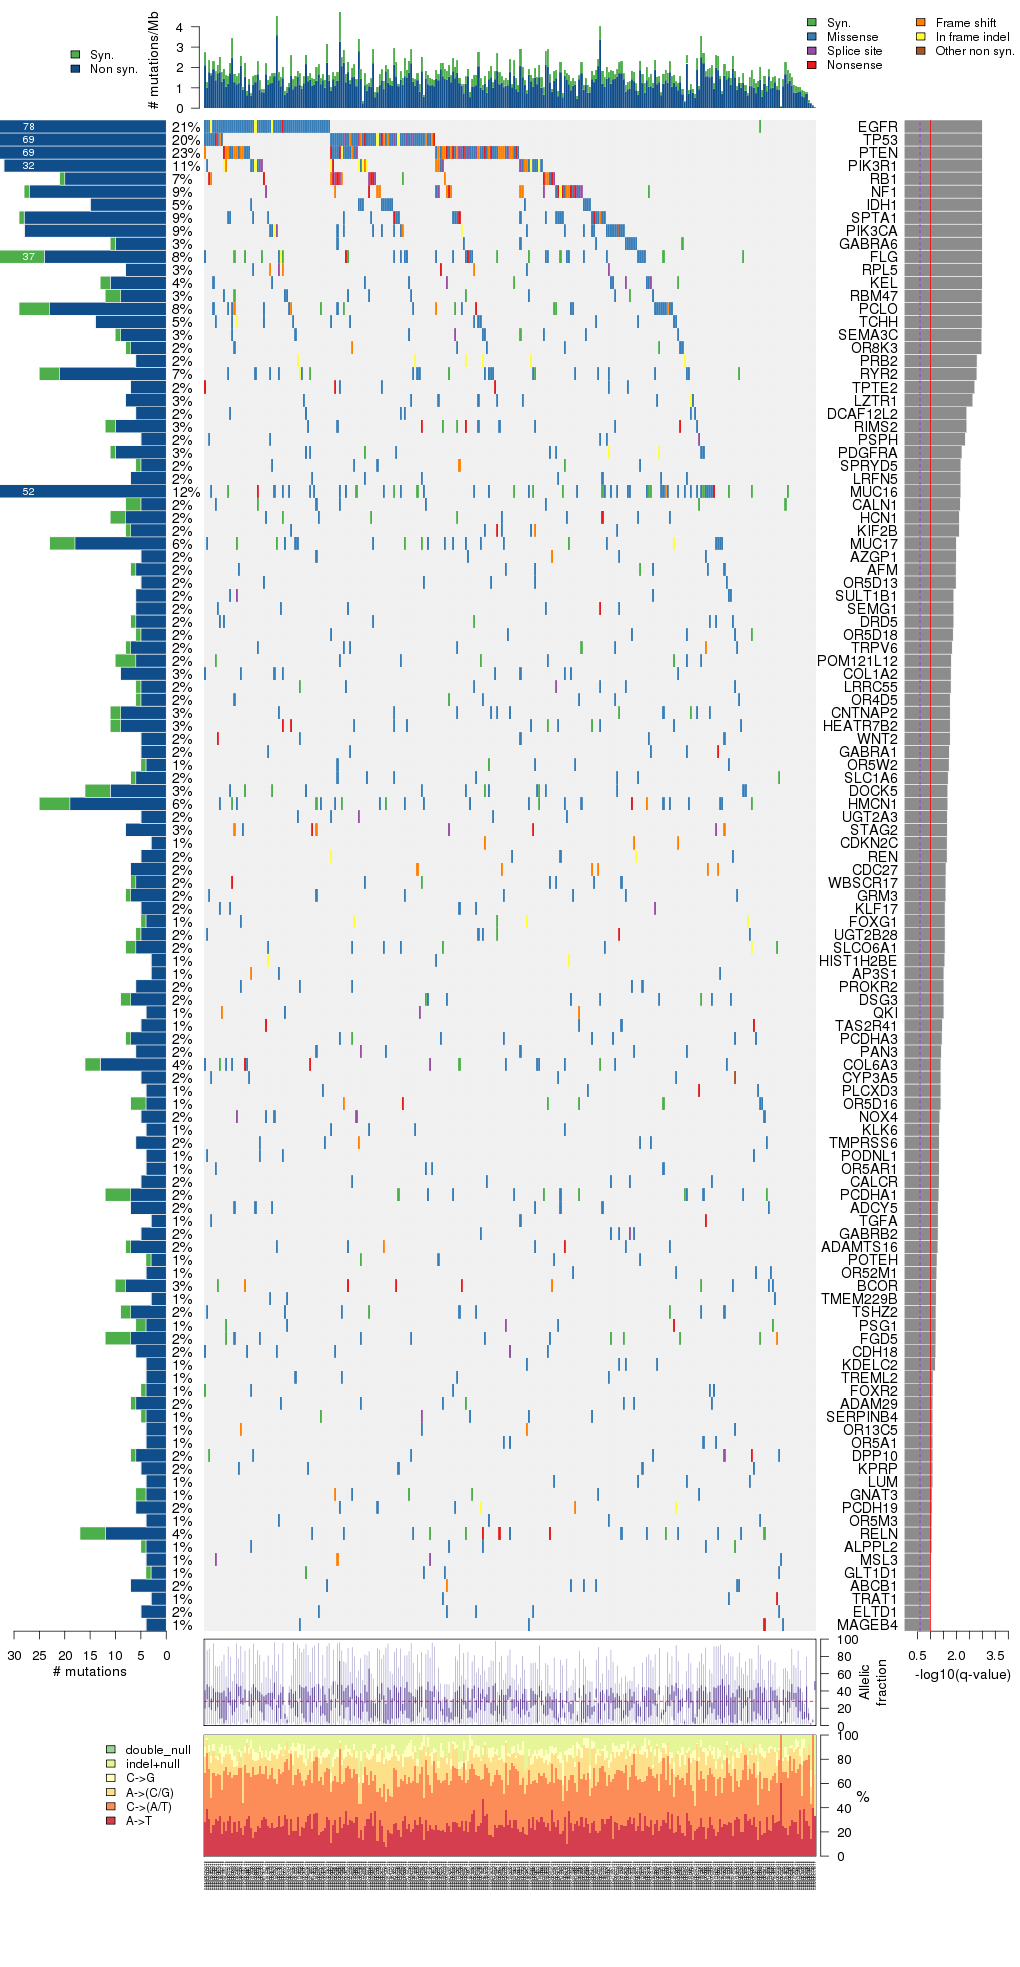
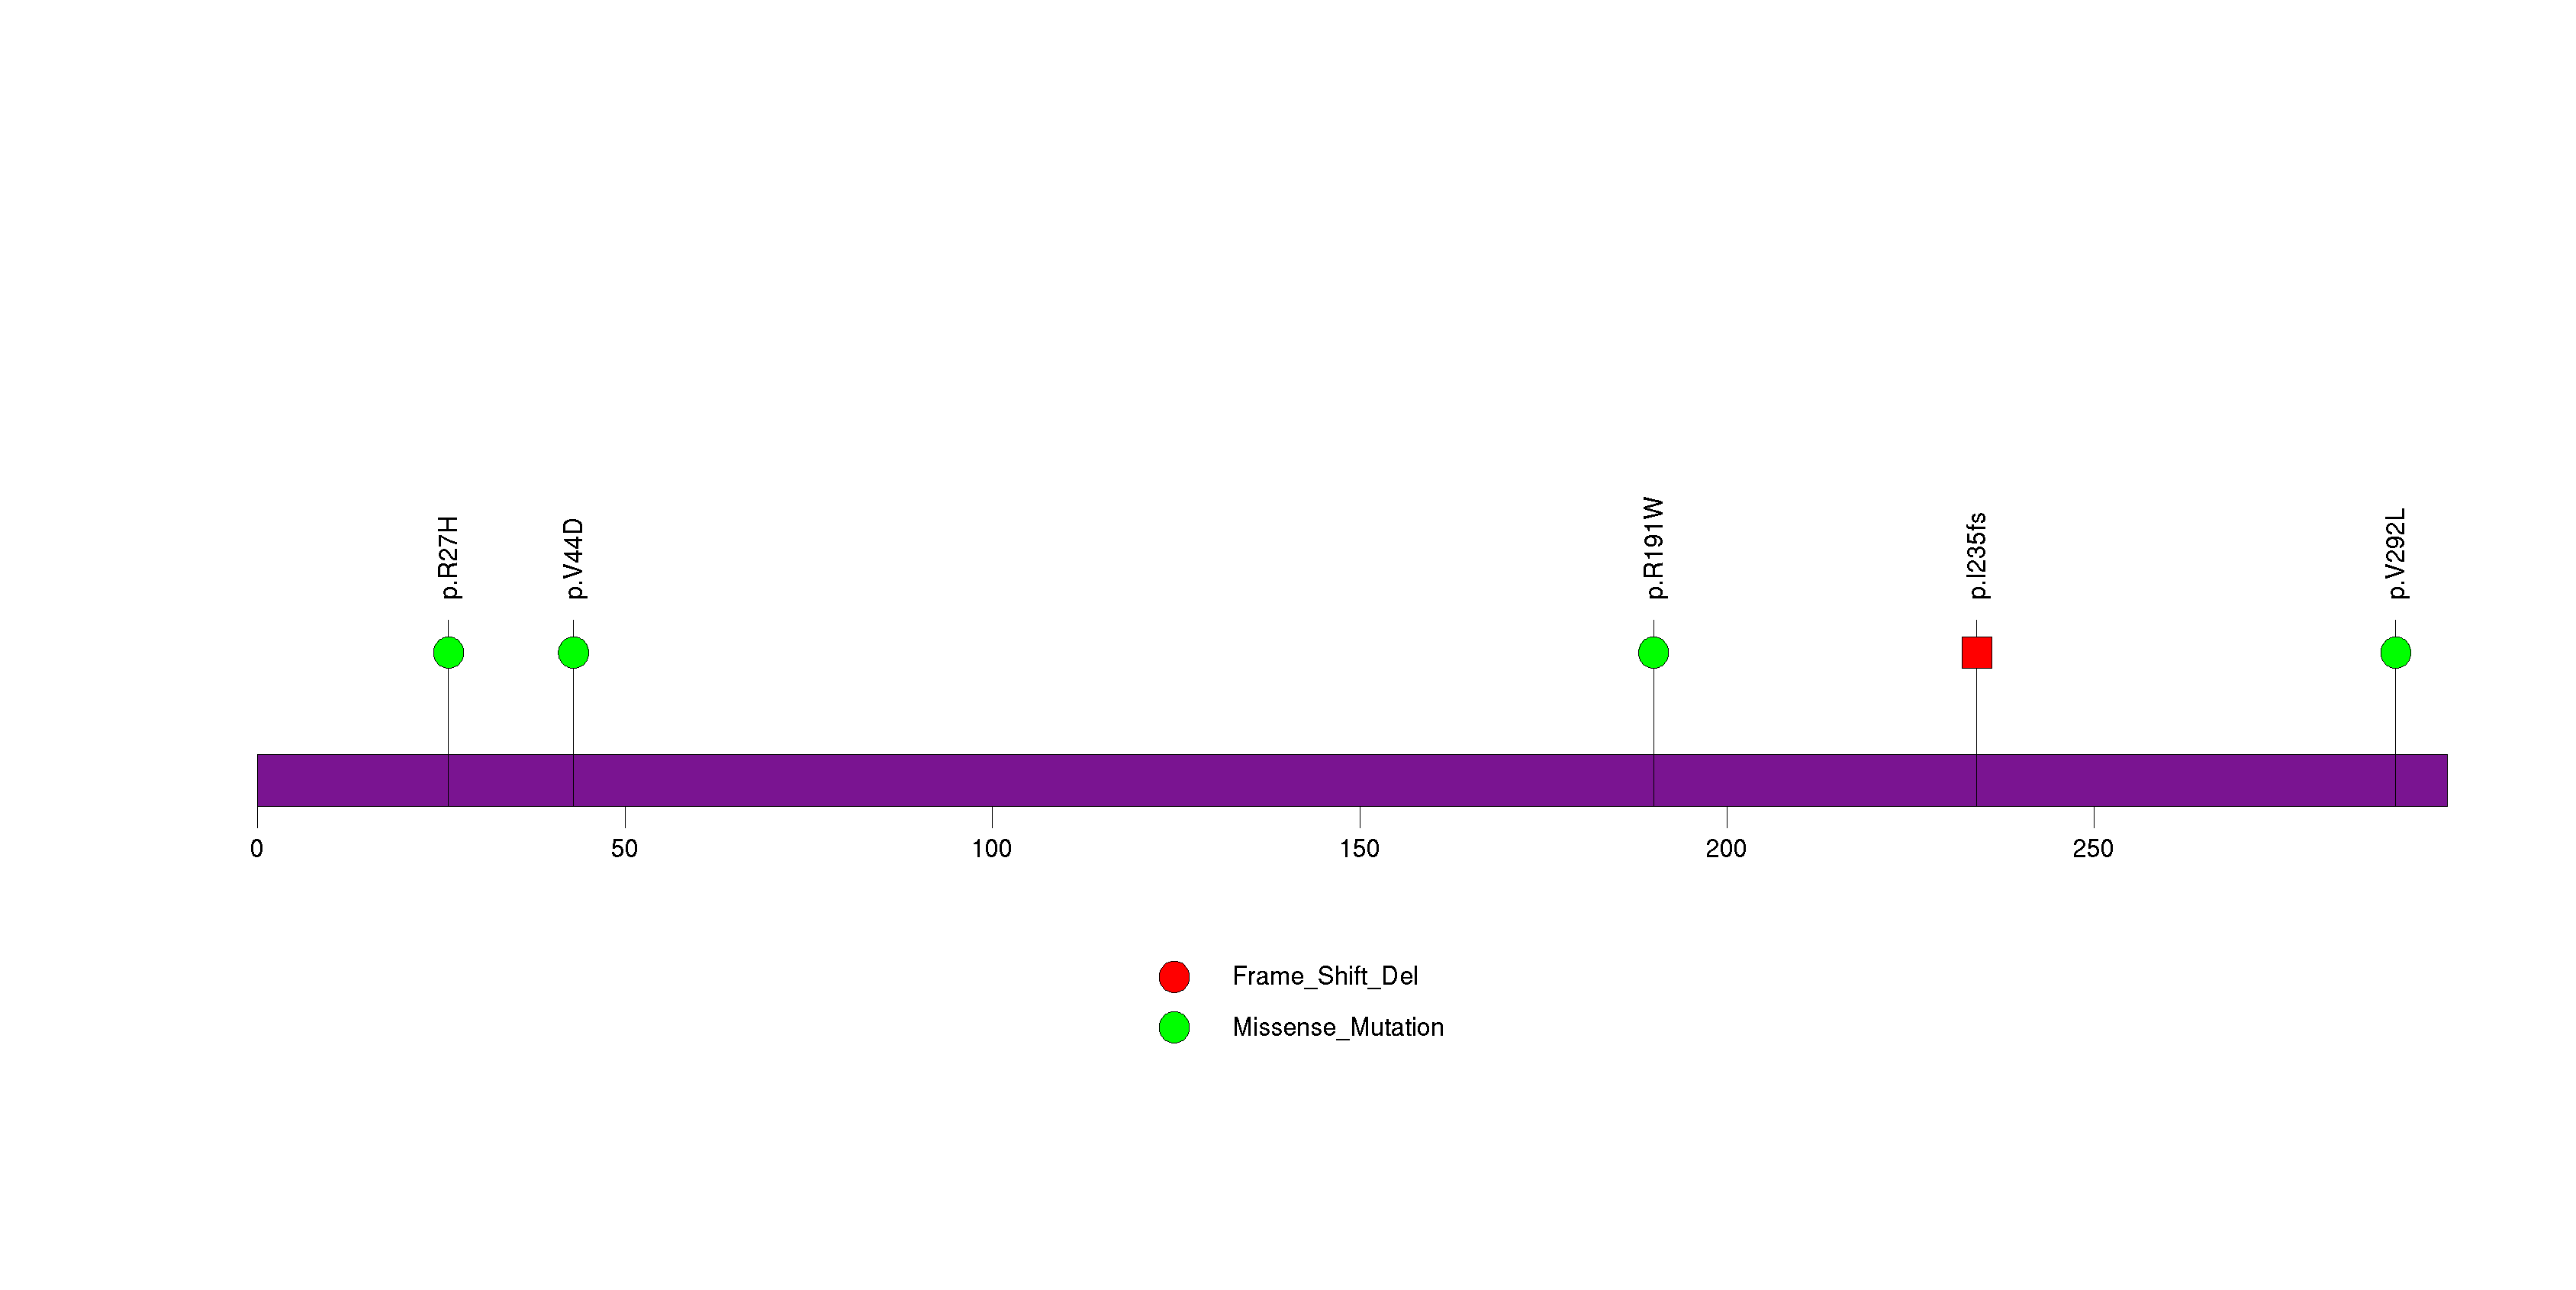
Figure 3. Get High-res Image The matrix in the center of the figure represents individual mutations in patient samples, color-coded by type of mutation, for the significantly mutated genes. The rate of synonymous and non-synonymous mutations is displayed at the top of the matrix. The barplot on the left of the matrix shows the number of mutations in each gene. The percentages represent the fraction of tumors with at least one mutation in the specified gene. The barplot to the right of the matrix displays the q-values for the most significantly mutated genes. The purple boxplots below the matrix (only displayed if required columns are present in the provided MAF) represent the distributions of allelic fractions observed in each sample. The plot at the bottom represents the base substitution distribution of individual samples, using the same categories that were used to calculate significance.
Column Descriptions:
-
N = number of sequenced bases in this gene across the individual set
-
n = number of (nonsilent) mutations in this gene across the individual set
-
npat = number of patients (individuals) with at least one nonsilent mutation
-
nsite = number of unique sites having a non-silent mutation
-
nsil = number of silent mutations in this gene across the individual set
-
n1 = number of nonsilent mutations of type: A->T
-
n2 = number of nonsilent mutations of type: C->(A/T)
-
n3 = number of nonsilent mutations of type: A->(C/G)
-
n4 = number of nonsilent mutations of type: C->G
-
n5 = number of nonsilent mutations of type: indel+null
-
n6 = number of nonsilent mutations of type: double_null
-
p_classic = p-value for the observed amount of nonsilent mutations being elevated in this gene
-
p_cons = p-value for enrichment of mutations at evolutionarily most-conserved sites in gene
-
p_joint = p-value for clustering + conservation
-
p = p-value (overall)
-
q = q-value, False Discovery Rate (Benjamini-Hochberg procedure)
Table 3. Get Full Table A Ranked List of Significantly Mutated Genes. Number of significant genes found: 116. Number of genes displayed: 35. Click on a gene name to display its stick figure depicting the distribution of mutations and mutation types across the chosen gene (this feature may not be available for all significant genes).
| rank | gene | description | N | n | npat | nsite | nsil | n1 | n2 | n3 | n4 | n5 | n6 | p_classic | p_cons | p_joint | p | q |
|---|---|---|---|---|---|---|---|---|---|---|---|---|---|---|---|---|---|---|
| 1 | EGFR | epidermal growth factor receptor (erythroblastic leukemia viral (v-erb-b) oncogene homolog, avian) | 1157577 | 73 | 60 | 39 | 5 | 39 | 19 | 9 | 1 | 5 | 0 | <1.00e-15 | NaN | NaN | <1.00e-15 | <8.99e-12 |
| 2 | TP53 | tumor protein p53 | 366862 | 69 | 59 | 48 | 0 | 17 | 20 | 7 | 7 | 18 | 0 | <1.00e-15 | NaN | NaN | <1.00e-15 | <8.99e-12 |
| 3 | PTEN | phosphatase and tensin homolog (mutated in multiple advanced cancers 1) | 345600 | 69 | 67 | 59 | 0 | 11 | 8 | 12 | 3 | 35 | 0 | 3.22e-15 | NaN | NaN | 3.22e-15 | 1.93e-11 |
| 4 | PIK3R1 | phosphoinositide-3-kinase, regulatory subunit 1 (alpha) | 681132 | 32 | 31 | 28 | 0 | 1 | 4 | 4 | 3 | 20 | 0 | 5.55e-15 | NaN | NaN | 5.55e-15 | 2.08e-11 |
| 5 | RB1 | retinoblastoma 1 (including osteosarcoma) | 778931 | 20 | 20 | 20 | 1 | 0 | 0 | 0 | 1 | 19 | 0 | 5.77e-15 | NaN | NaN | 5.77e-15 | 2.08e-11 |
| 6 | NF1 | neurofibromin 1 (neurofibromatosis, von Recklinghausen disease, Watson disease) | 2521044 | 27 | 26 | 27 | 1 | 2 | 2 | 1 | 1 | 21 | 0 | 7.44e-15 | NaN | NaN | 7.44e-15 | 2.23e-11 |
| 7 | IDH1 | isocitrate dehydrogenase 1 (NADP+), soluble | 369059 | 15 | 15 | 2 | 0 | 0 | 13 | 0 | 2 | 0 | 0 | 1.21e-14 | NaN | NaN | 1.21e-14 | 2.55e-11 |
| 8 | SPTA1 | spectrin, alpha, erythrocytic 1 (elliptocytosis 2) | 2163316 | 28 | 26 | 26 | 1 | 3 | 12 | 7 | 2 | 4 | 0 | 1.27e-14 | NaN | NaN | 1.27e-14 | 2.55e-11 |
| 9 | PIK3CA | phosphoinositide-3-kinase, catalytic, alpha polypeptide | 943754 | 28 | 26 | 22 | 0 | 9 | 4 | 6 | 3 | 6 | 0 | 1.28e-14 | NaN | NaN | 1.28e-14 | 2.55e-11 |
| 10 | GABRA6 | gamma-aminobutyric acid (GABA) A receptor, alpha 6 | 405492 | 10 | 10 | 9 | 1 | 6 | 3 | 1 | 0 | 0 | 0 | 2.43e-10 | NaN | NaN | 2.43e-10 | 4.23e-07 |
| 11 | FLG | filaggrin | 3451129 | 24 | 24 | 23 | 13 | 7 | 12 | 2 | 0 | 3 | 0 | 2.59e-10 | NaN | NaN | 2.59e-10 | 4.23e-07 |
| 12 | RPL5 | ribosomal protein L5 | 267625 | 8 | 8 | 8 | 0 | 0 | 1 | 1 | 0 | 6 | 0 | 3.45e-10 | NaN | NaN | 3.45e-10 | 5.17e-07 |
| 13 | KEL | Kell blood group, metallo-endopeptidase | 655925 | 11 | 11 | 9 | 2 | 6 | 1 | 1 | 0 | 3 | 0 | 9.29e-10 | NaN | NaN | 9.29e-10 | 1.29e-06 |
| 14 | RBM47 | RNA binding motif protein 47 | 480608 | 9 | 9 | 9 | 3 | 5 | 3 | 1 | 0 | 0 | 0 | 1.65e-08 | NaN | NaN | 1.65e-08 | 2.12e-05 |
| 15 | PCLO | piccolo (presynaptic cytomatrix protein) | 4271304 | 23 | 23 | 23 | 6 | 9 | 6 | 3 | 0 | 5 | 0 | 1.78e-08 | NaN | NaN | 1.78e-08 | 2.14e-05 |
| 16 | TCHH | trichohyalin | 1639471 | 14 | 14 | 14 | 0 | 7 | 4 | 2 | 0 | 1 | 0 | 2.20e-08 | NaN | NaN | 2.20e-08 | 2.48e-05 |
| 17 | SEMA3C | sema domain, immunoglobulin domain (Ig), short basic domain, secreted, (semaphorin) 3C | 670293 | 9 | 9 | 9 | 1 | 1 | 3 | 2 | 2 | 1 | 0 | 5.55e-08 | NaN | NaN | 5.55e-08 | 5.87e-05 |
| 18 | OR8K3 | olfactory receptor, family 8, subfamily K, member 3 | 273493 | 7 | 7 | 7 | 1 | 0 | 5 | 1 | 0 | 1 | 0 | 7.01e-08 | NaN | NaN | 7.01e-08 | 7.00e-05 |
| 19 | PRB2 | proline-rich protein BstNI subfamily 2 | 344124 | 6 | 6 | 2 | 0 | 0 | 0 | 0 | 0 | 6 | 0 | 6.26e-07 | NaN | NaN | 6.26e-07 | 0.000593 |
| 20 | RYR2 | ryanodine receptor 2 (cardiac) | 4070819 | 21 | 20 | 21 | 4 | 7 | 7 | 5 | 1 | 1 | 0 | 6.97e-07 | NaN | NaN | 6.97e-07 | 0.000627 |
| 21 | TPTE2 | transmembrane phosphoinositide 3-phosphatase and tensin homolog 2 | 473916 | 7 | 7 | 5 | 0 | 2 | 1 | 0 | 1 | 3 | 0 | 1.14e-06 | NaN | NaN | 1.14e-06 | 0.000973 |
| 22 | LZTR1 | leucine-zipper-like transcription regulator 1 | 637471 | 8 | 9 | 9 | 0 | 0 | 3 | 2 | 2 | 1 | 0 | 1.68e-06 | NaN | NaN | 1.68e-06 | 0.00137 |
| 23 | DCAF12L2 | DDB1 and CUL4 associated factor 12-like 2 | 391480 | 6 | 6 | 5 | 0 | 4 | 2 | 0 | 0 | 0 | 0 | 3.86e-06 | NaN | NaN | 3.86e-06 | 0.00301 |
| 24 | RIMS2 | regulating synaptic membrane exocytosis 2 | 1243358 | 10 | 10 | 9 | 2 | 3 | 2 | 2 | 0 | 3 | 0 | 4.09e-06 | NaN | NaN | 4.09e-06 | 0.00307 |
| 25 | PSPH | phosphoserine phosphatase | 202218 | 5 | 5 | 3 | 0 | 3 | 0 | 1 | 0 | 1 | 0 | 4.89e-06 | NaN | NaN | 4.89e-06 | 0.00352 |
| 26 | PDGFRA | platelet-derived growth factor receptor, alpha polypeptide | 973191 | 10 | 9 | 9 | 1 | 2 | 3 | 3 | 0 | 2 | 0 | 7.40e-06 | NaN | NaN | 7.40e-06 | 0.00512 |
| 27 | SPRYD5 | SPRY domain containing 5 | 260718 | 5 | 5 | 5 | 1 | 2 | 1 | 0 | 1 | 1 | 0 | 8.65e-06 | NaN | NaN | 8.65e-06 | 0.00576 |
| 28 | LRFN5 | leucine rich repeat and fibronectin type III domain containing 5 | 626196 | 7 | 7 | 7 | 0 | 3 | 2 | 1 | 1 | 0 | 0 | 9.16e-06 | NaN | NaN | 9.16e-06 | 0.00588 |
| 29 | MUC16 | mucin 16, cell surface associated | 12550554 | 37 | 36 | 37 | 15 | 9 | 16 | 6 | 3 | 3 | 0 | 9.53e-06 | NaN | NaN | 9.53e-06 | 0.00591 |
| 30 | CALN1 | calneuron 1 | 198851 | 5 | 5 | 5 | 3 | 3 | 2 | 0 | 0 | 0 | 0 | 9.92e-06 | NaN | NaN | 9.92e-06 | 0.00594 |
| 31 | HCN1 | hyperpolarization activated cyclic nucleotide-gated potassium channel 1 | 710195 | 8 | 7 | 8 | 3 | 2 | 3 | 0 | 2 | 1 | 0 | 1.17e-05 | NaN | NaN | 1.17e-05 | 0.00672 |
| 32 | KIF2B | kinesin family member 2B | 585575 | 7 | 7 | 7 | 1 | 2 | 2 | 0 | 1 | 2 | 0 | 1.20e-05 | NaN | NaN | 1.20e-05 | 0.00672 |
| 33 | MUC17 | mucin 17, cell surface associated | 3928199 | 18 | 17 | 17 | 5 | 4 | 5 | 4 | 3 | 2 | 0 | 1.67e-05 | NaN | NaN | 1.67e-05 | 0.00903 |
| 34 | AZGP1 | alpha-2-glycoprotein 1, zinc-binding | 264723 | 5 | 5 | 5 | 0 | 2 | 1 | 1 | 0 | 1 | 0 | 1.71e-05 | NaN | NaN | 1.71e-05 | 0.00903 |
| 35 | AFM | afamin | 535897 | 6 | 6 | 6 | 1 | 1 | 1 | 3 | 1 | 0 | 0 | 1.81e-05 | NaN | NaN | 1.81e-05 | 0.00923 |
Figure S1. This figure depicts the distribution of mutations and mutation types across the EGFR significant gene.
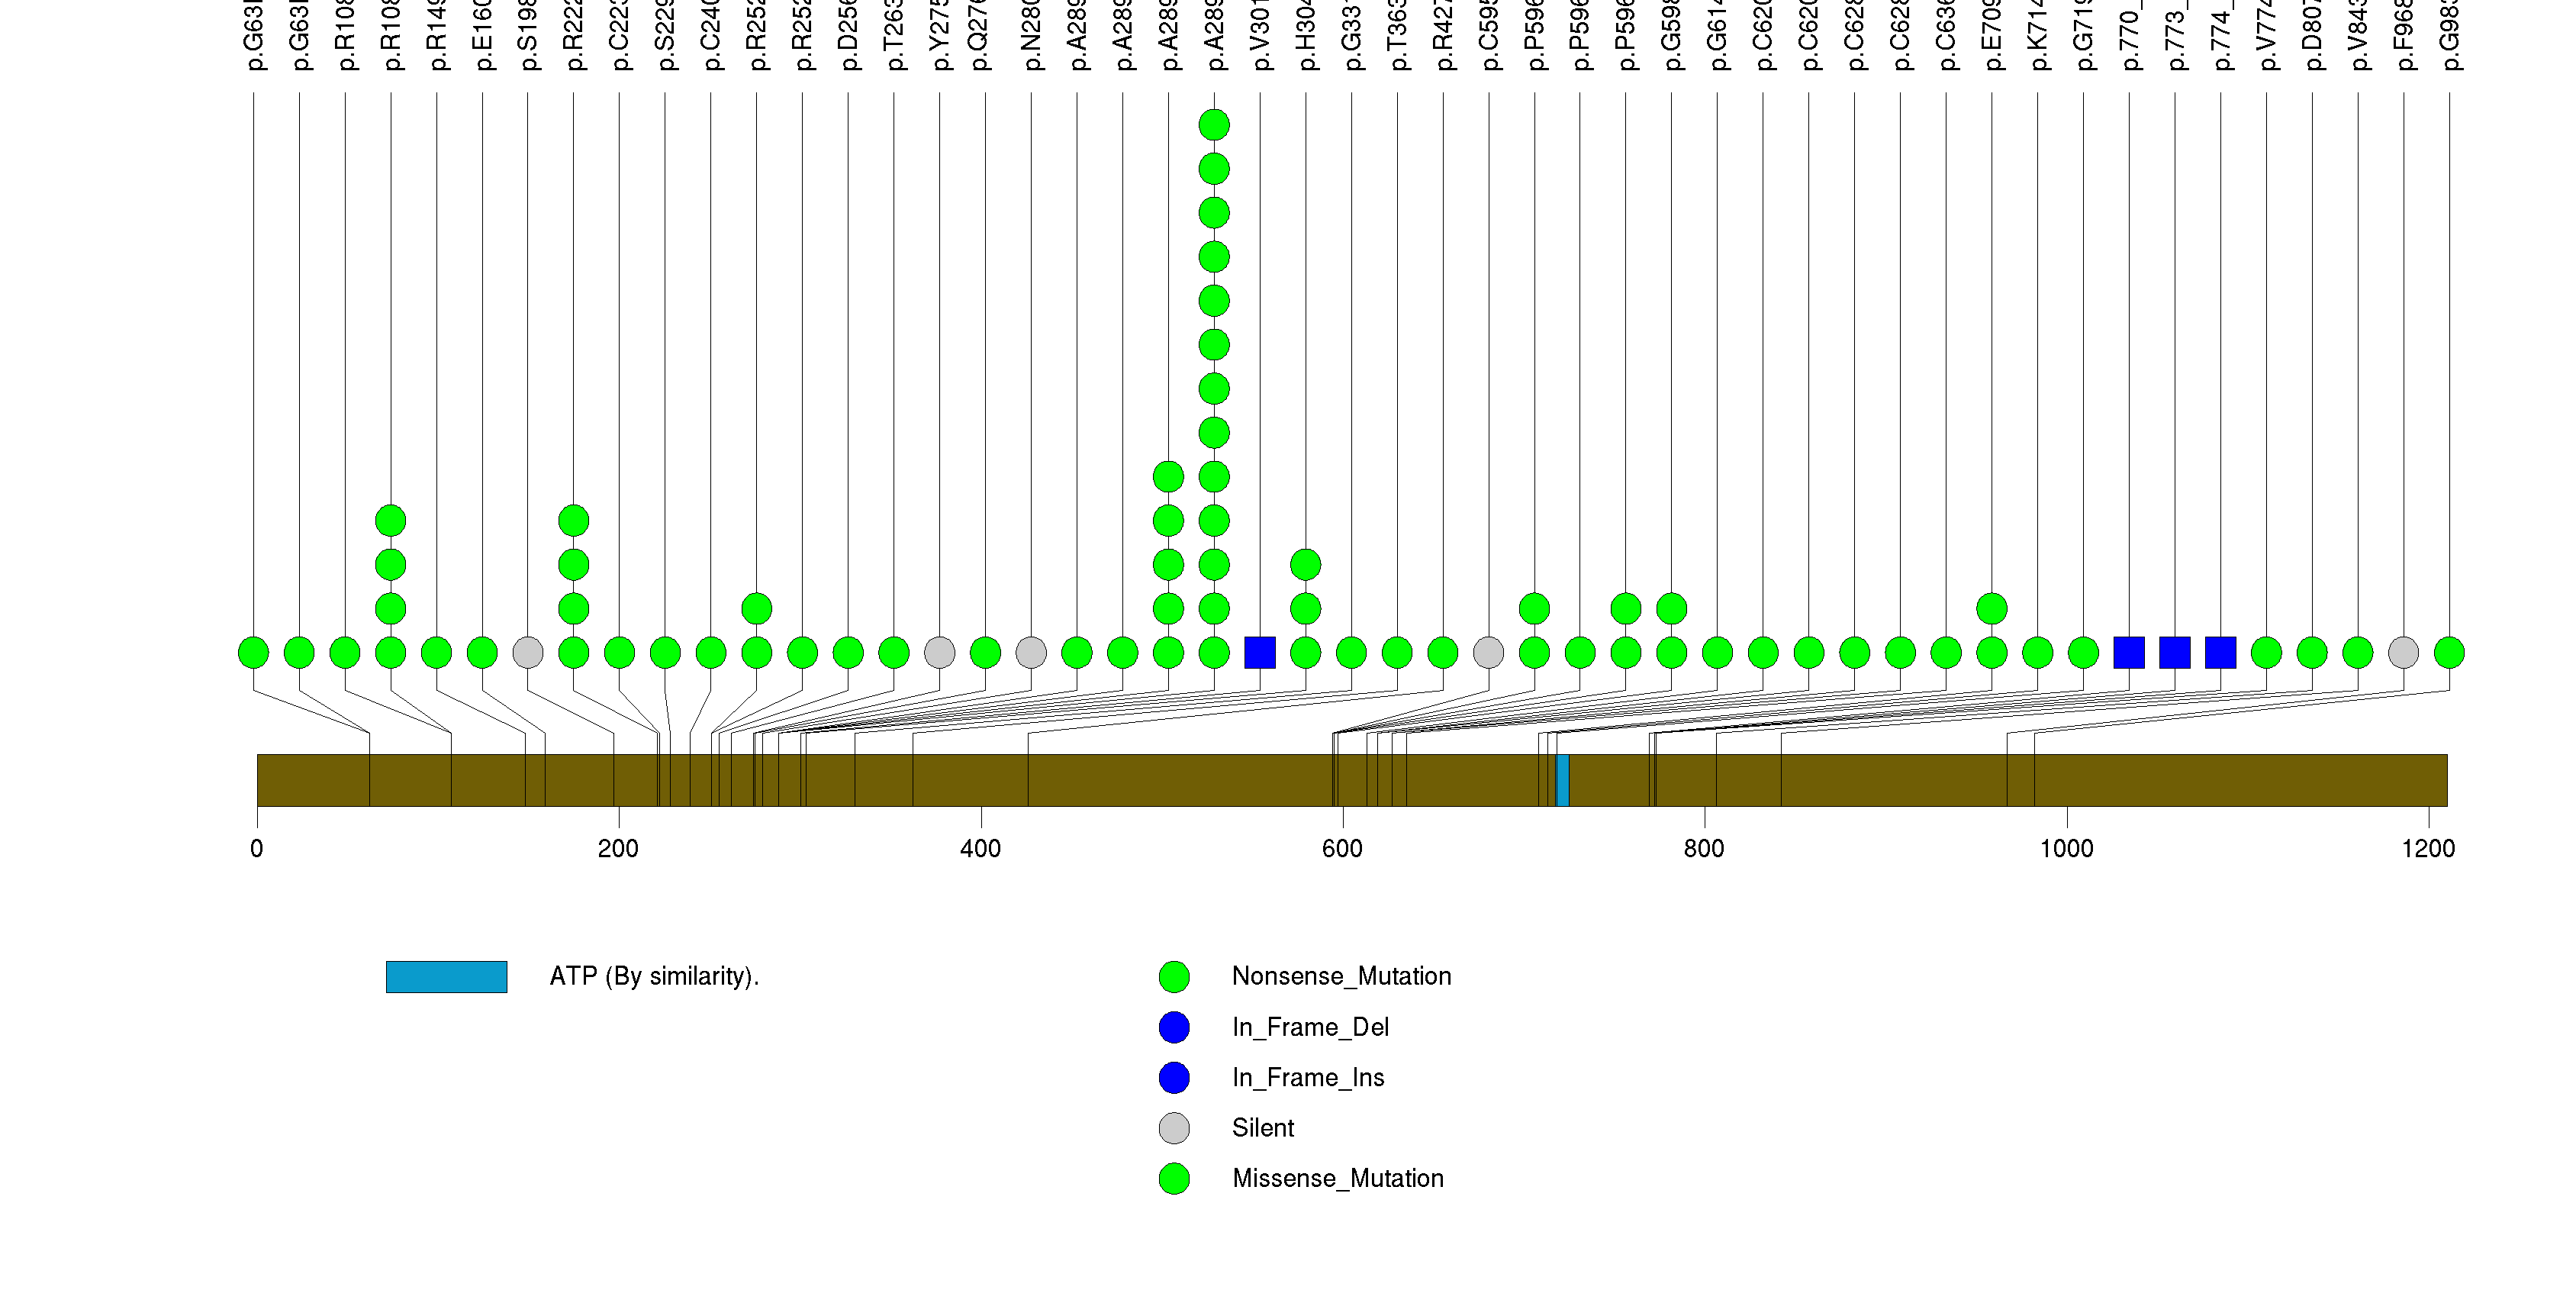
Figure S2. This figure depicts the distribution of mutations and mutation types across the TP53 significant gene.
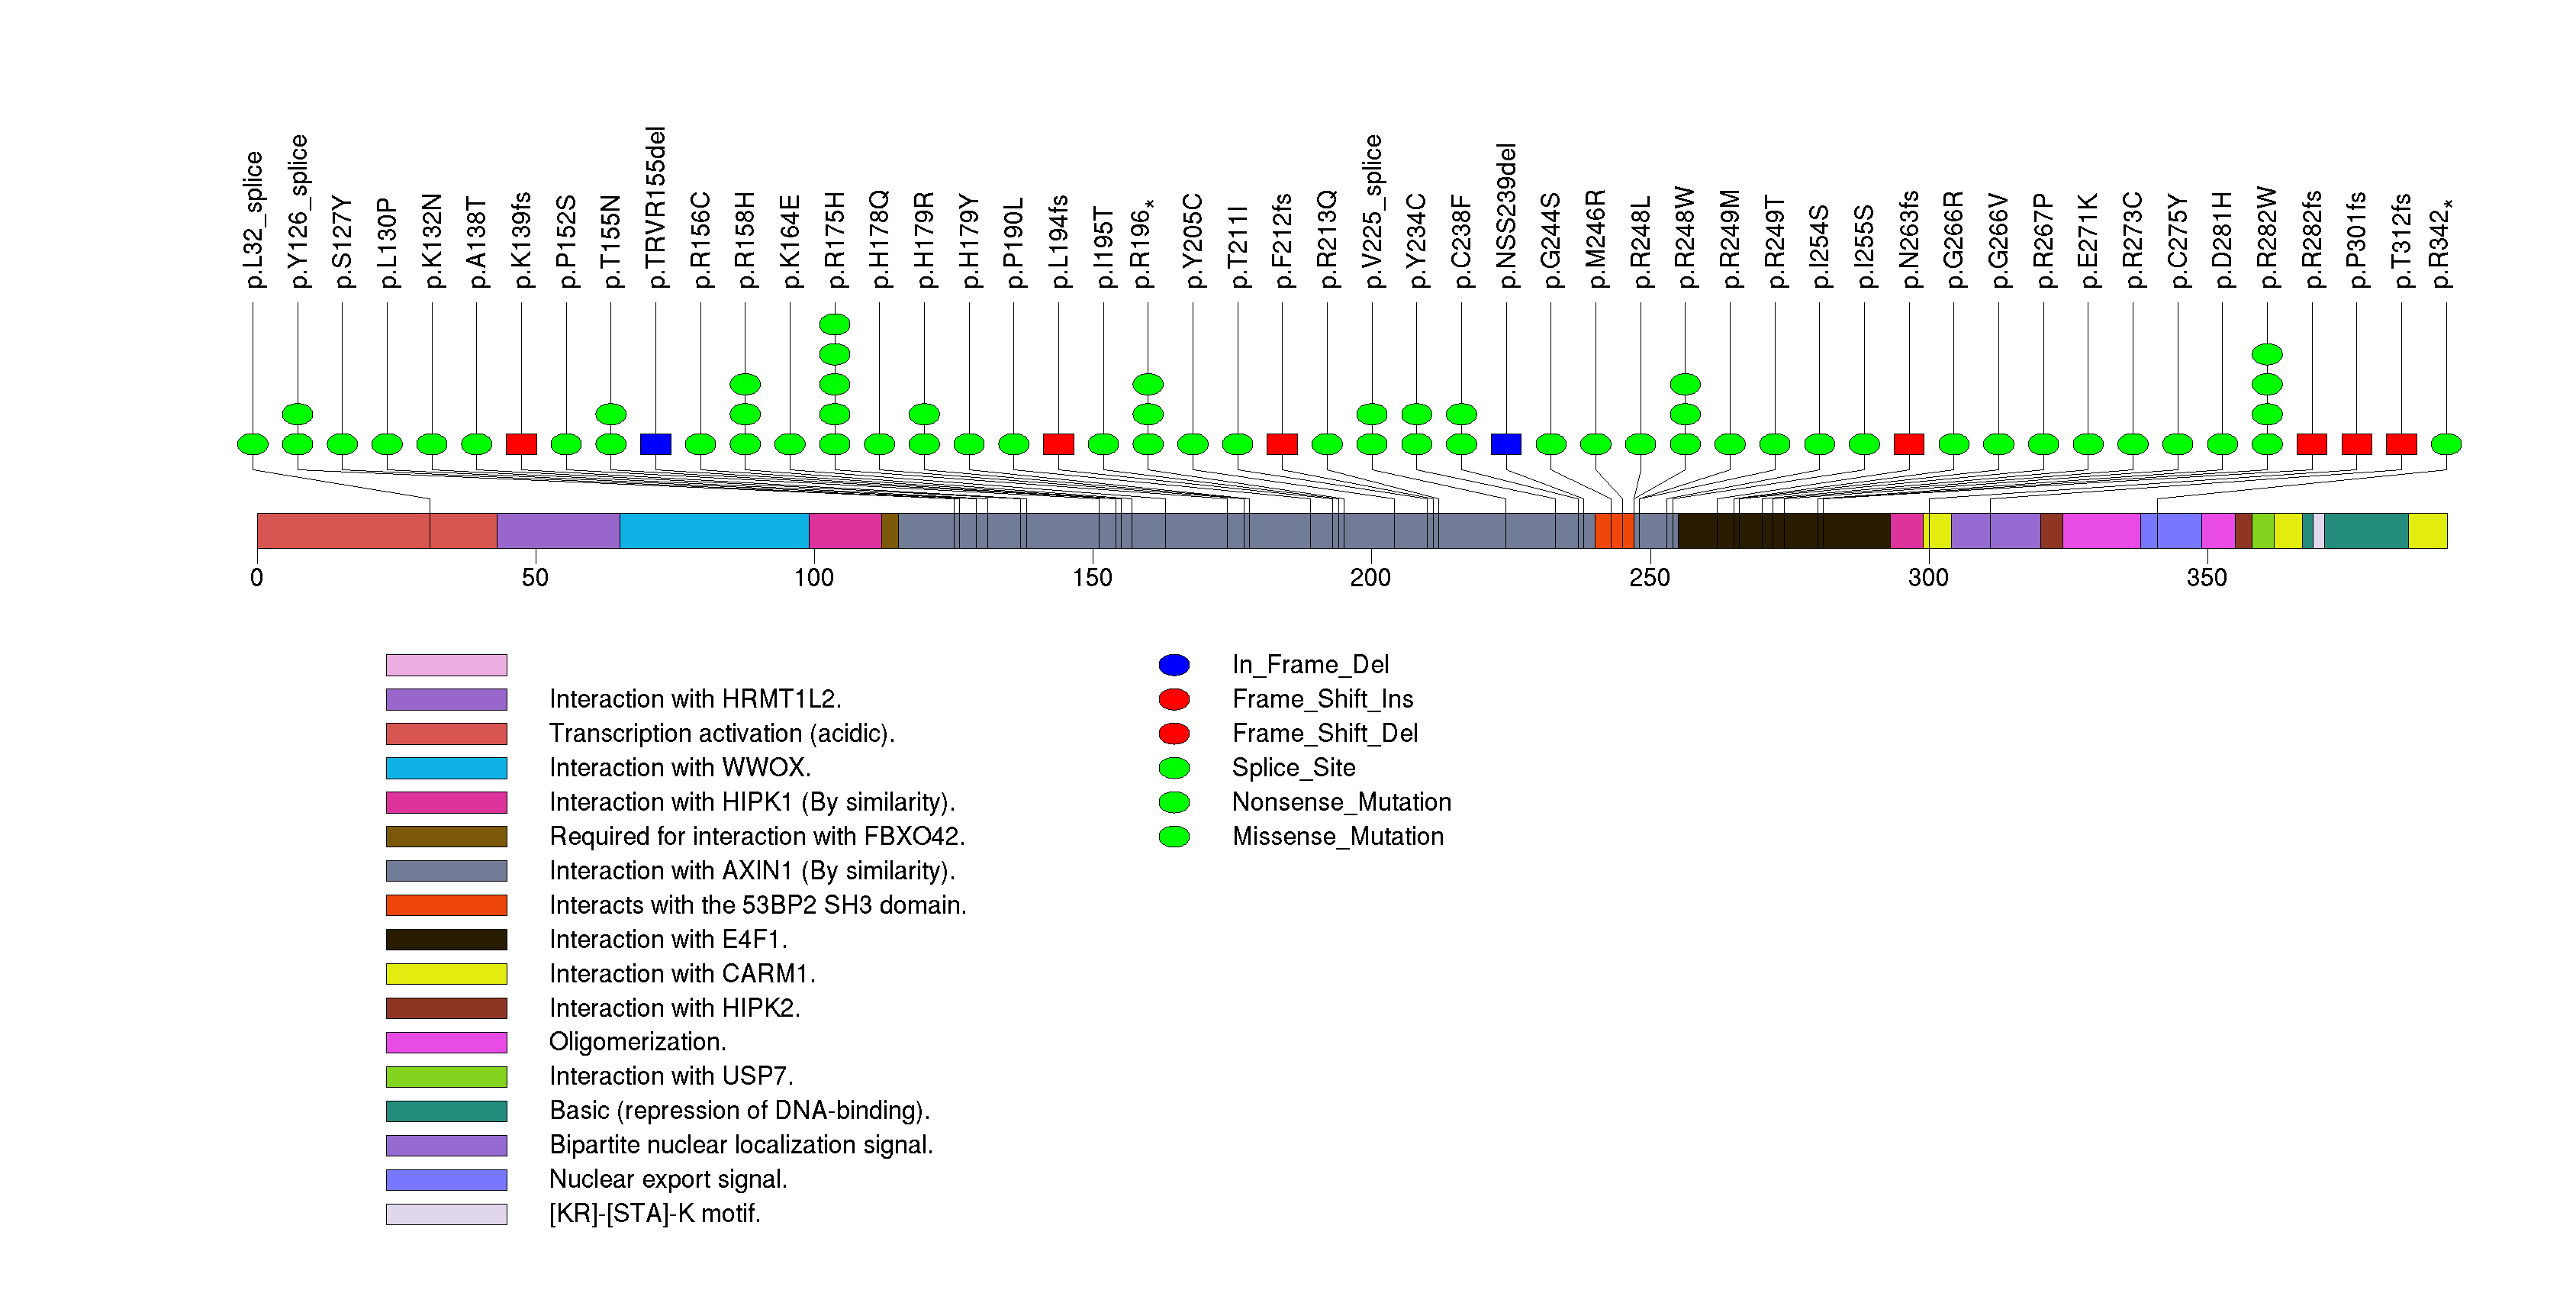
Figure S3. This figure depicts the distribution of mutations and mutation types across the PTEN significant gene.
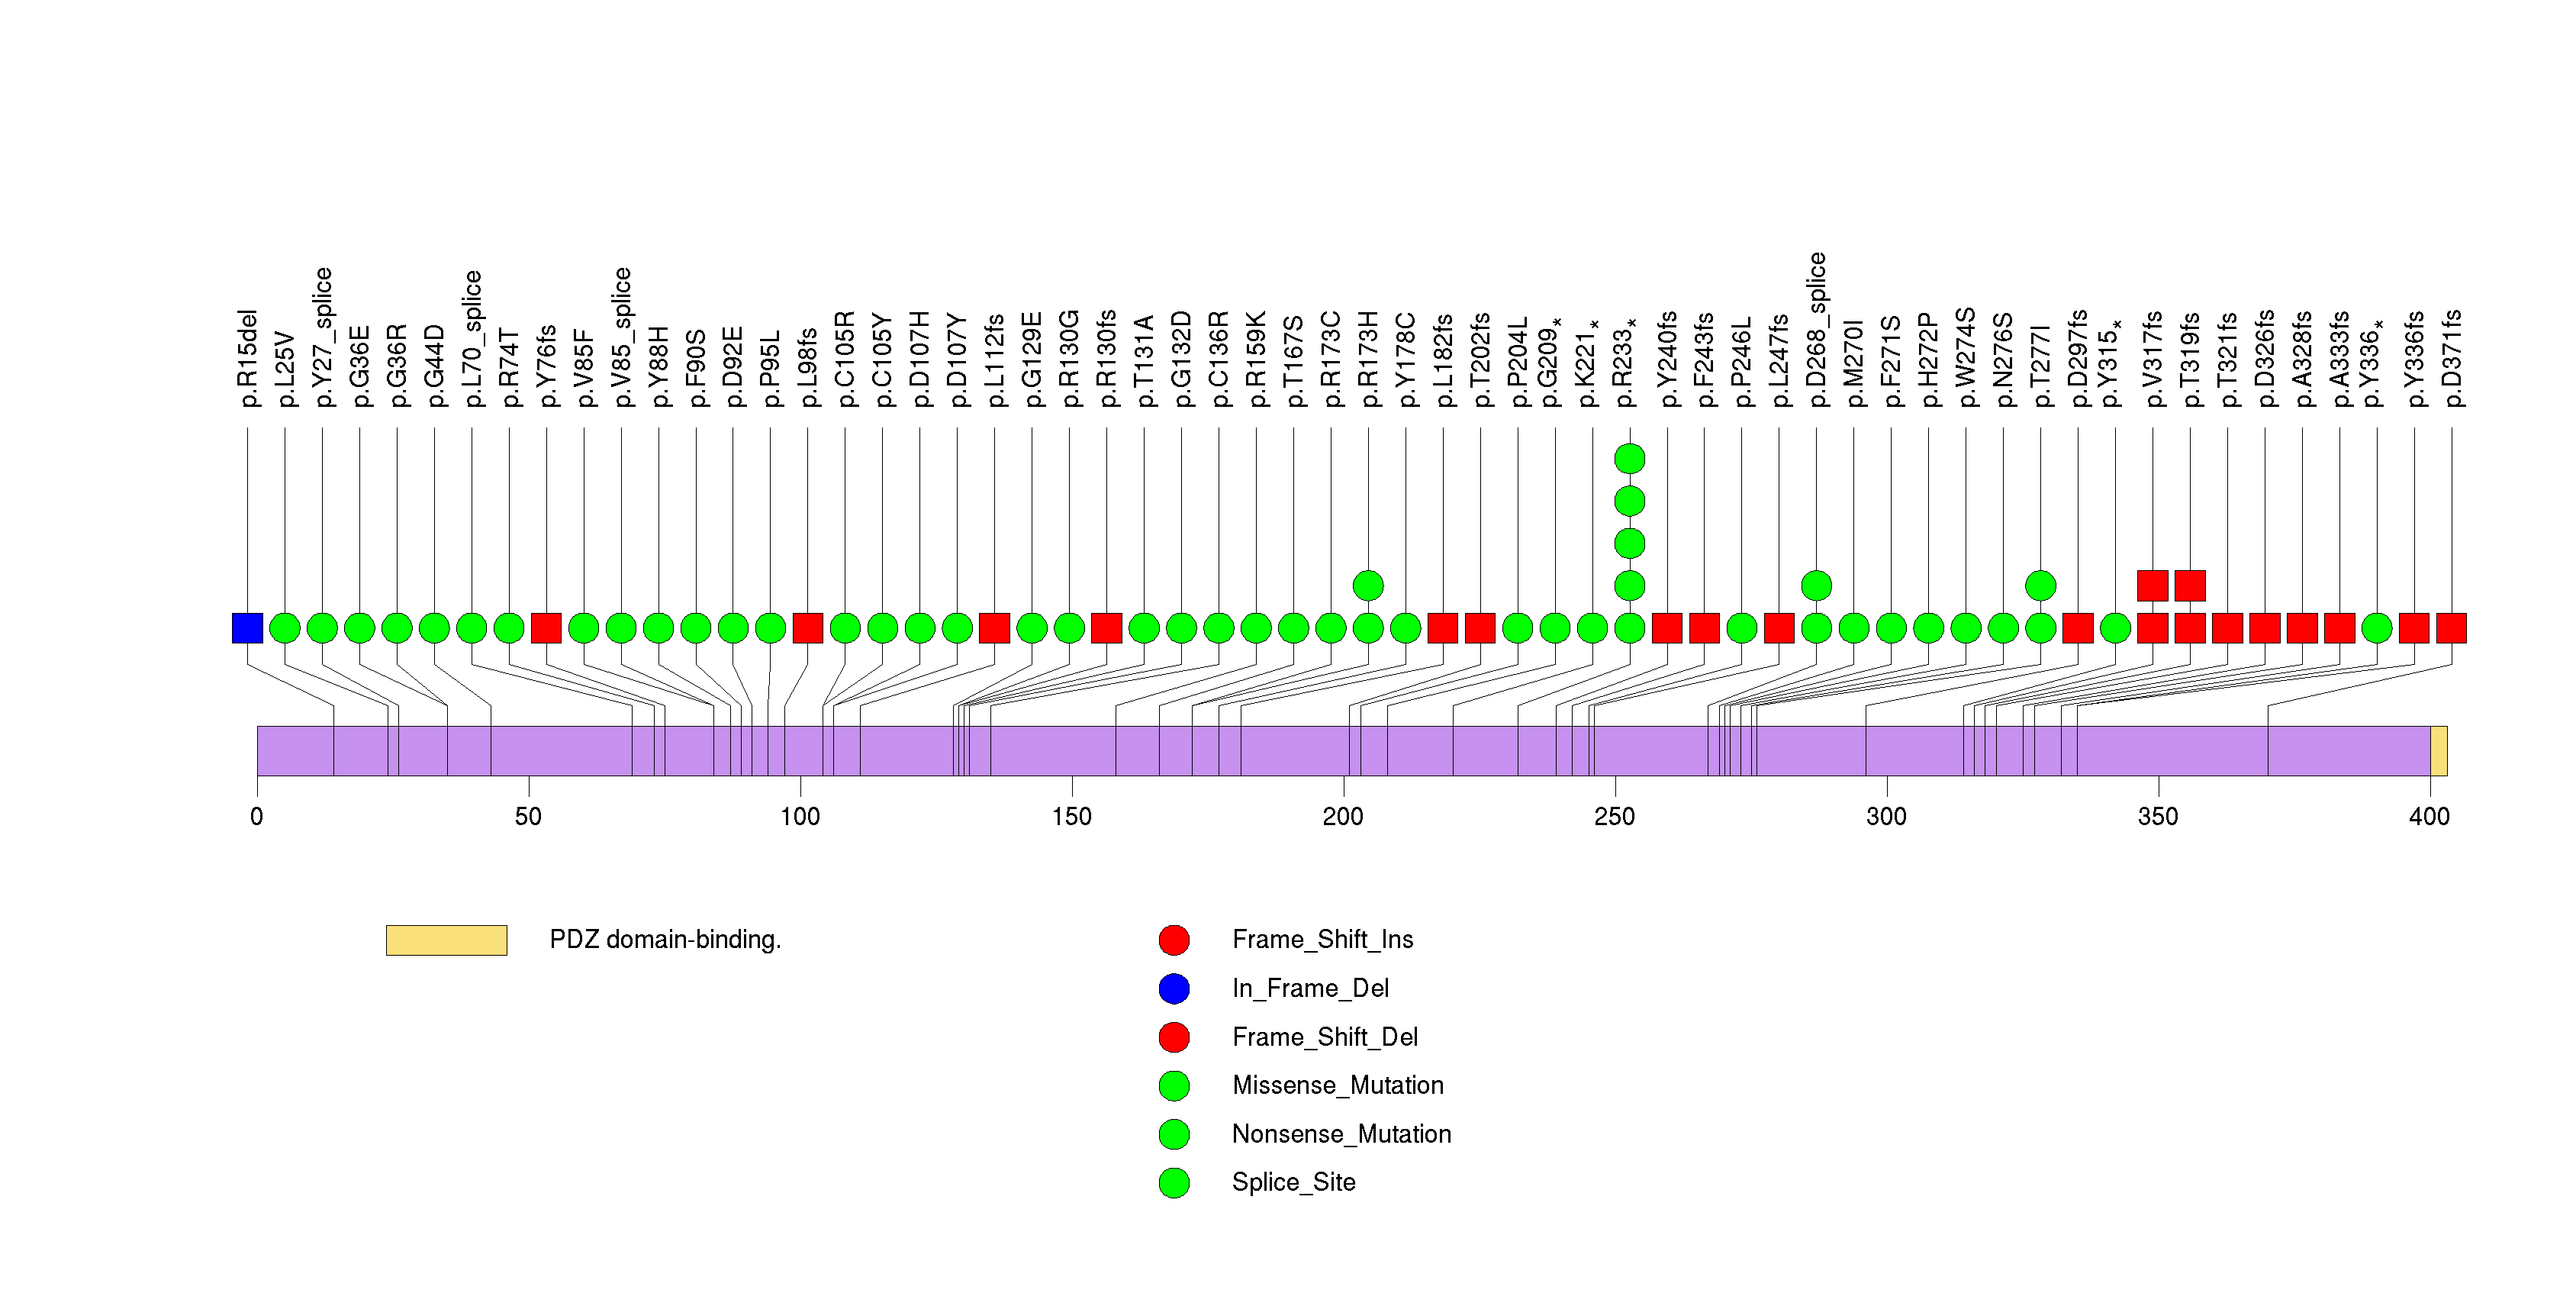
Figure S4. This figure depicts the distribution of mutations and mutation types across the PIK3R1 significant gene.
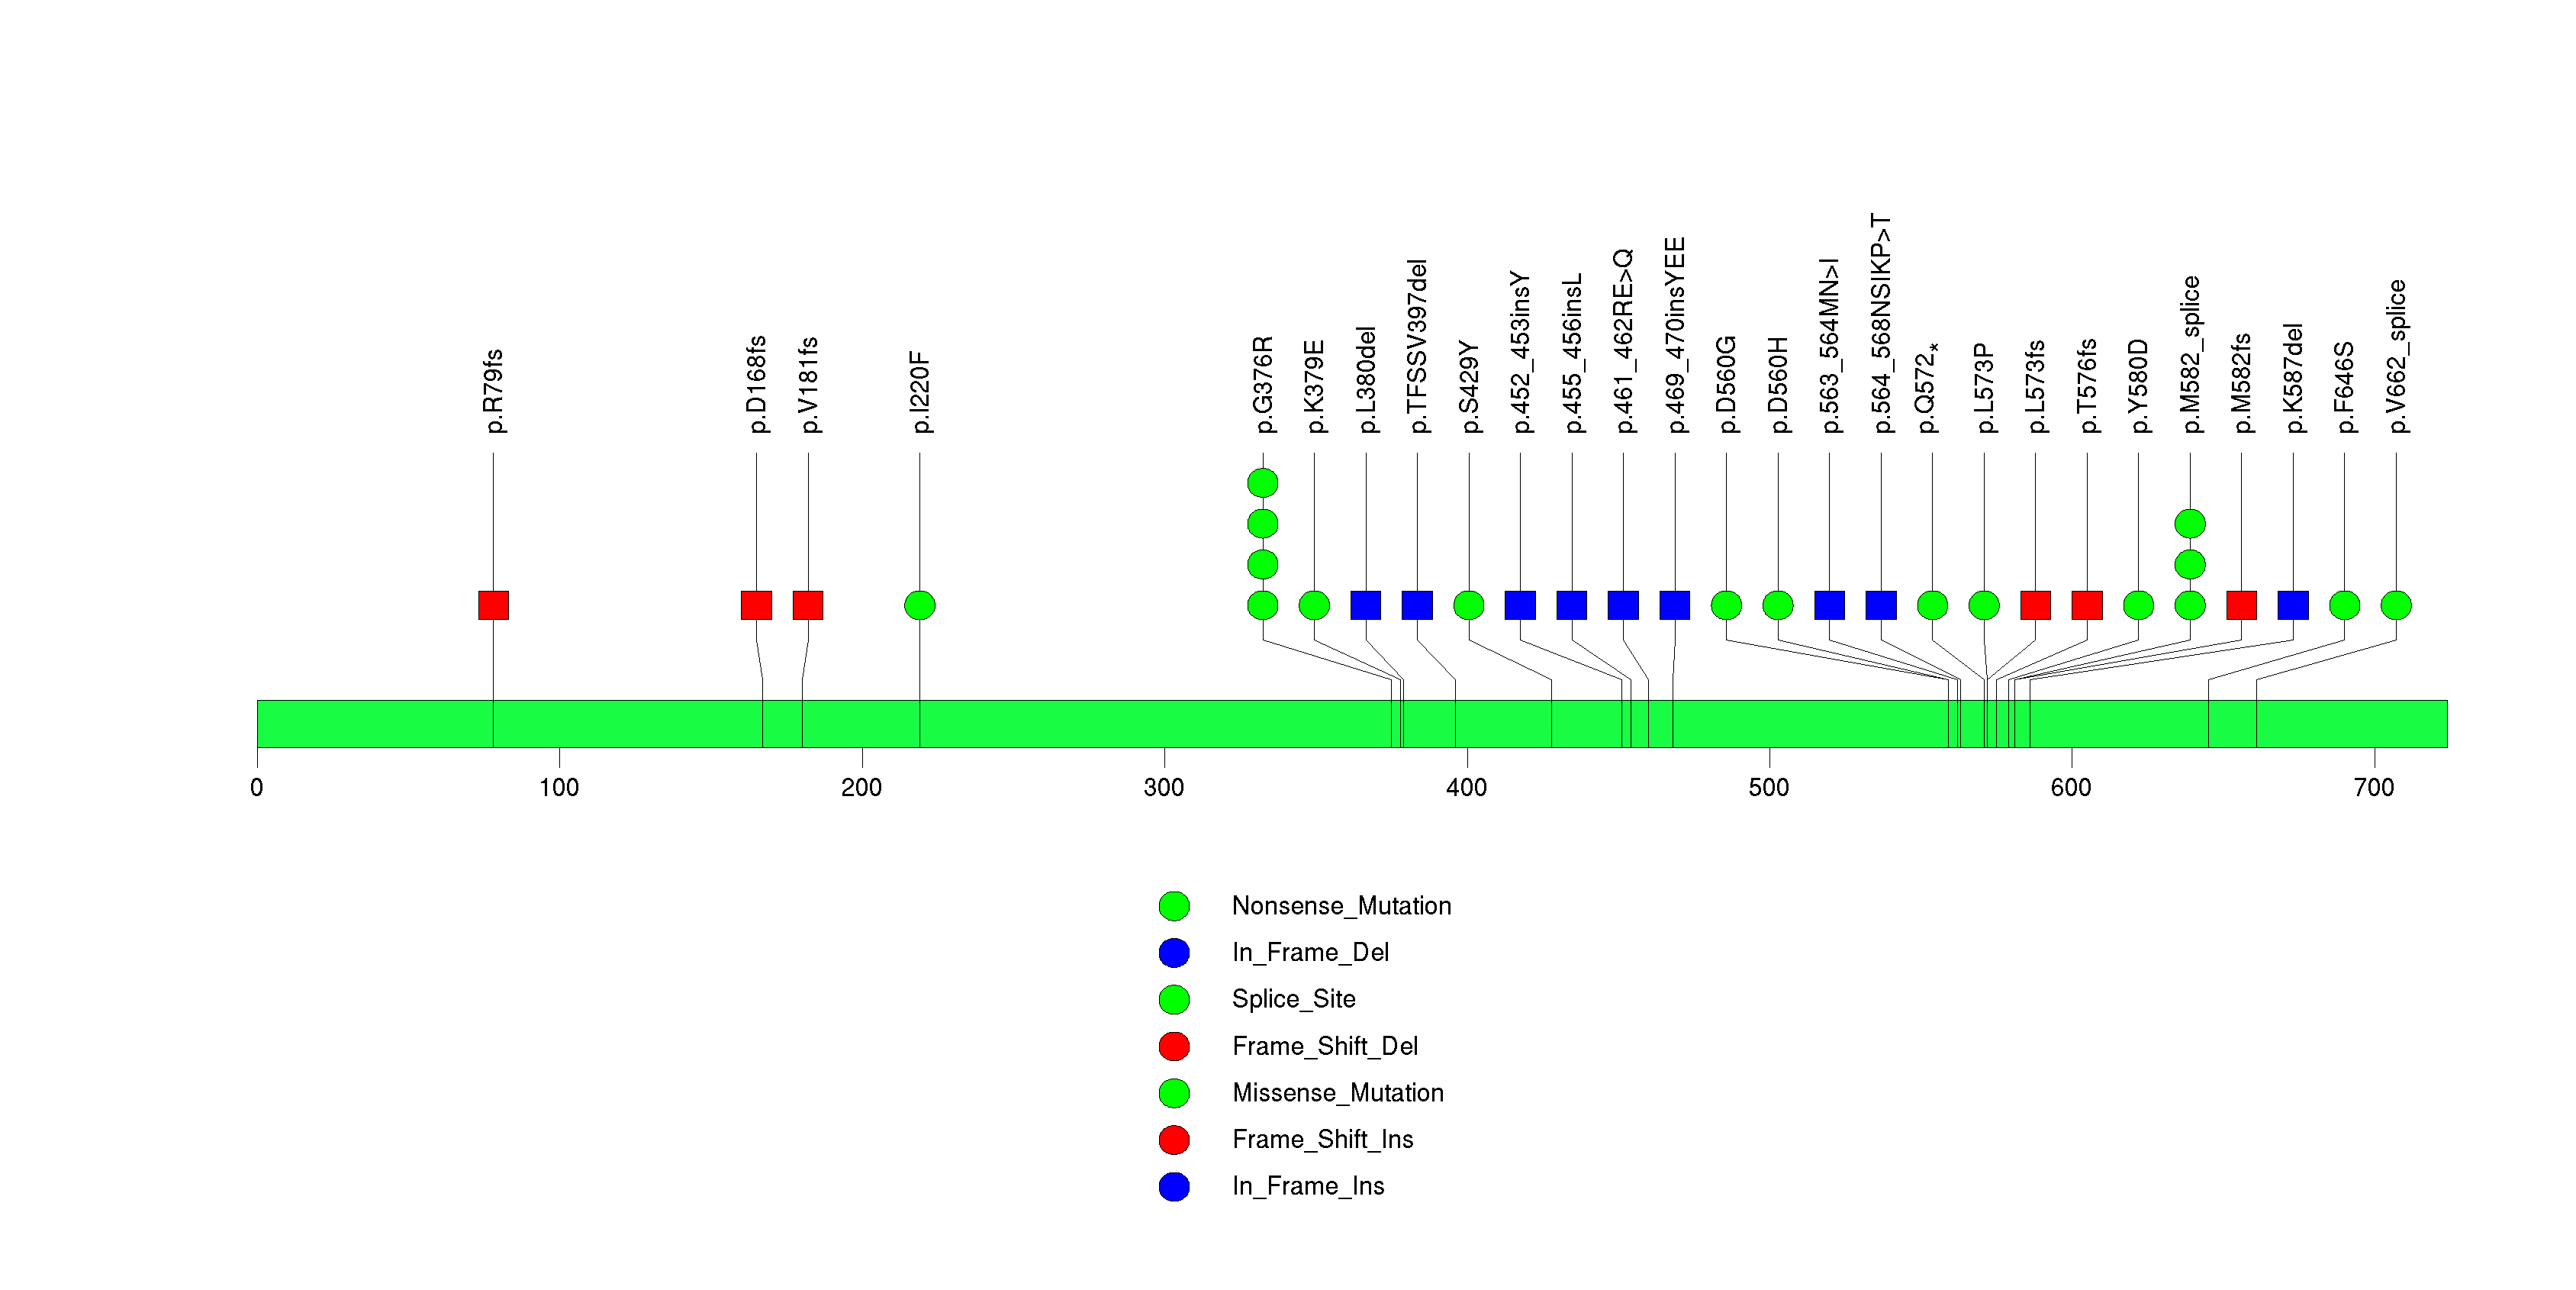
Figure S5. This figure depicts the distribution of mutations and mutation types across the RB1 significant gene.
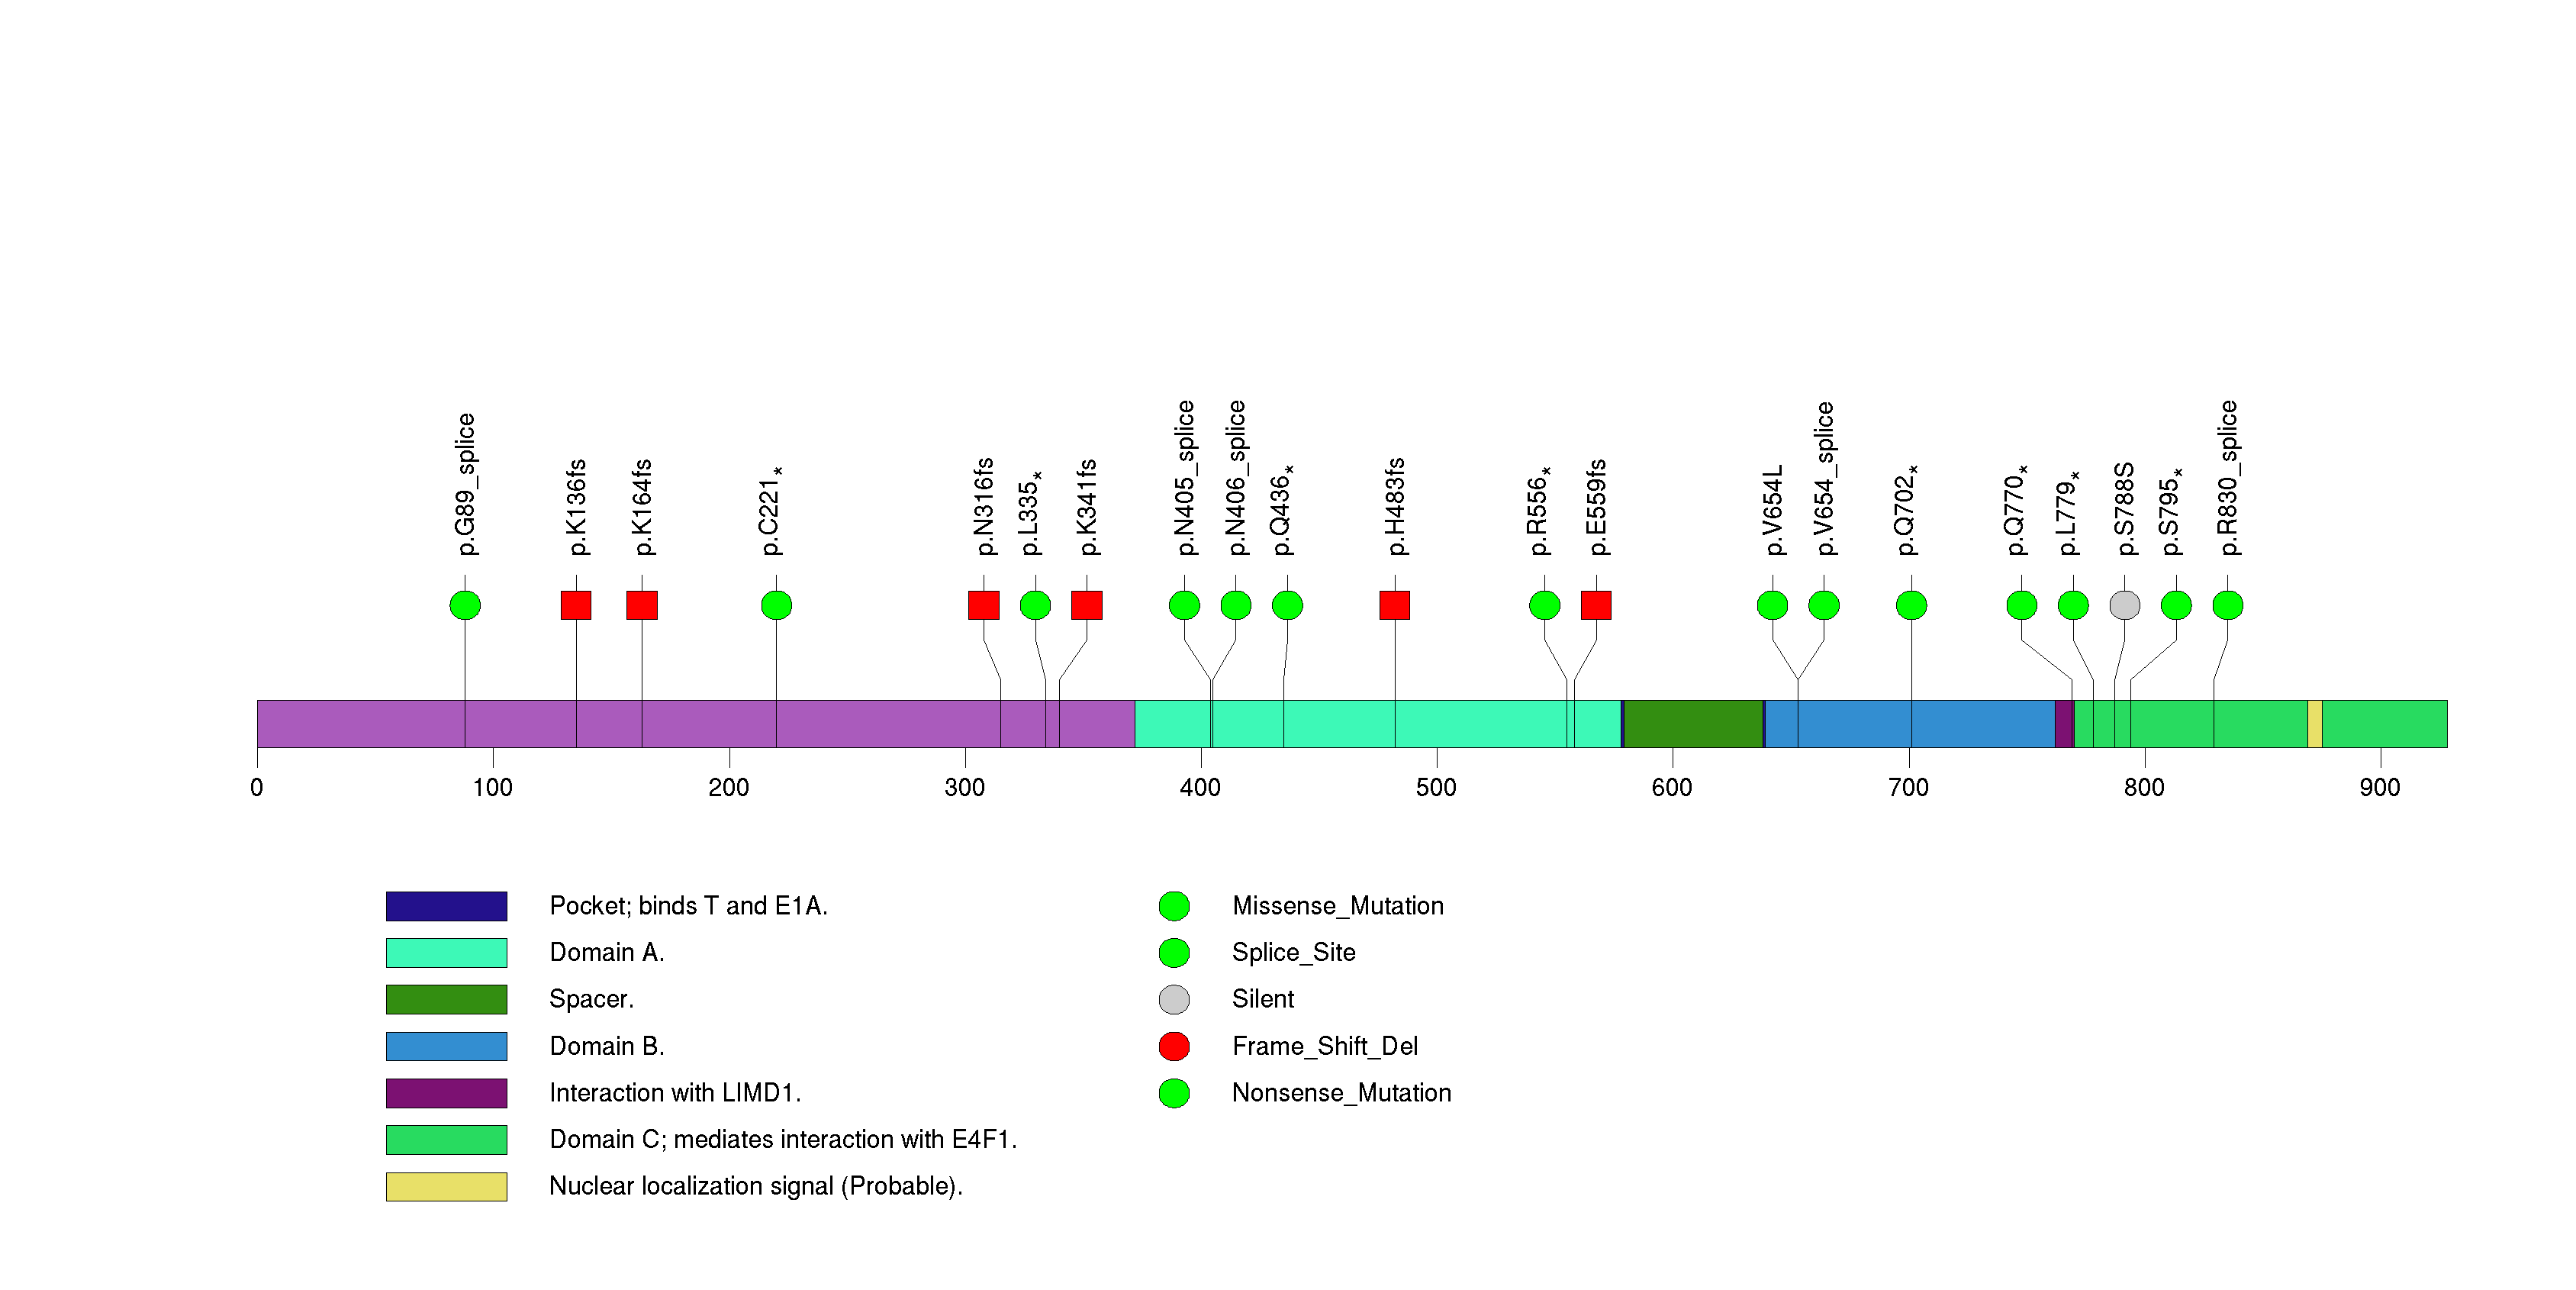
Figure S6. This figure depicts the distribution of mutations and mutation types across the NF1 significant gene.
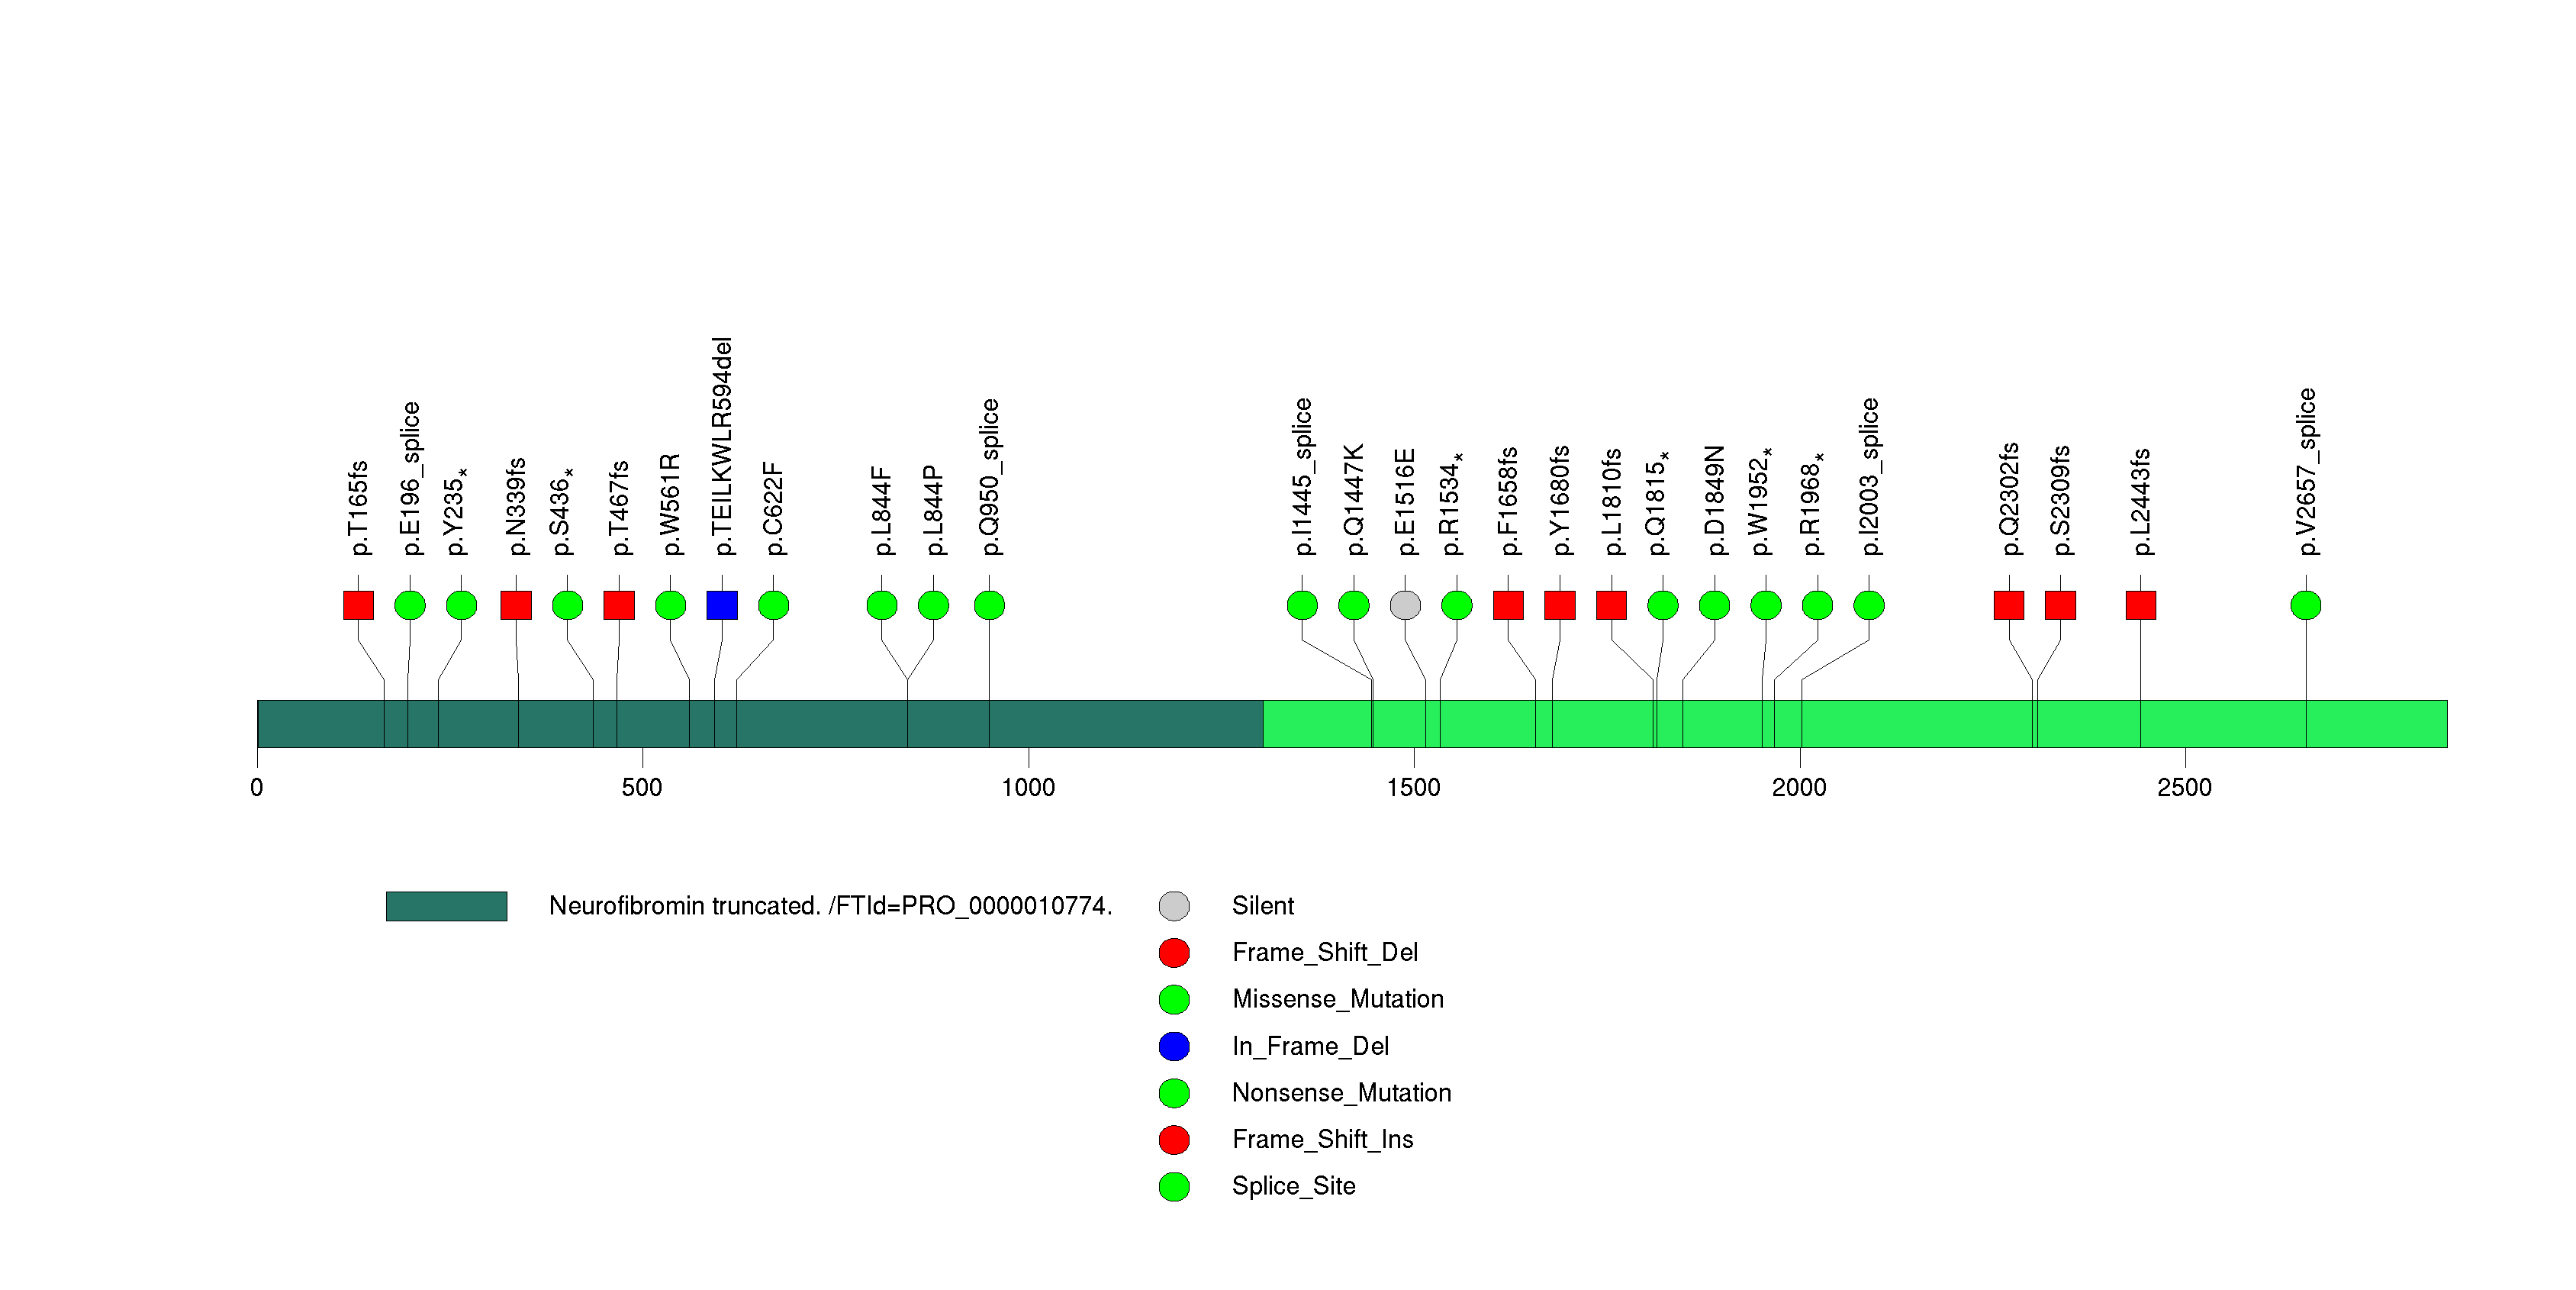
Figure S7. This figure depicts the distribution of mutations and mutation types across the IDH1 significant gene.
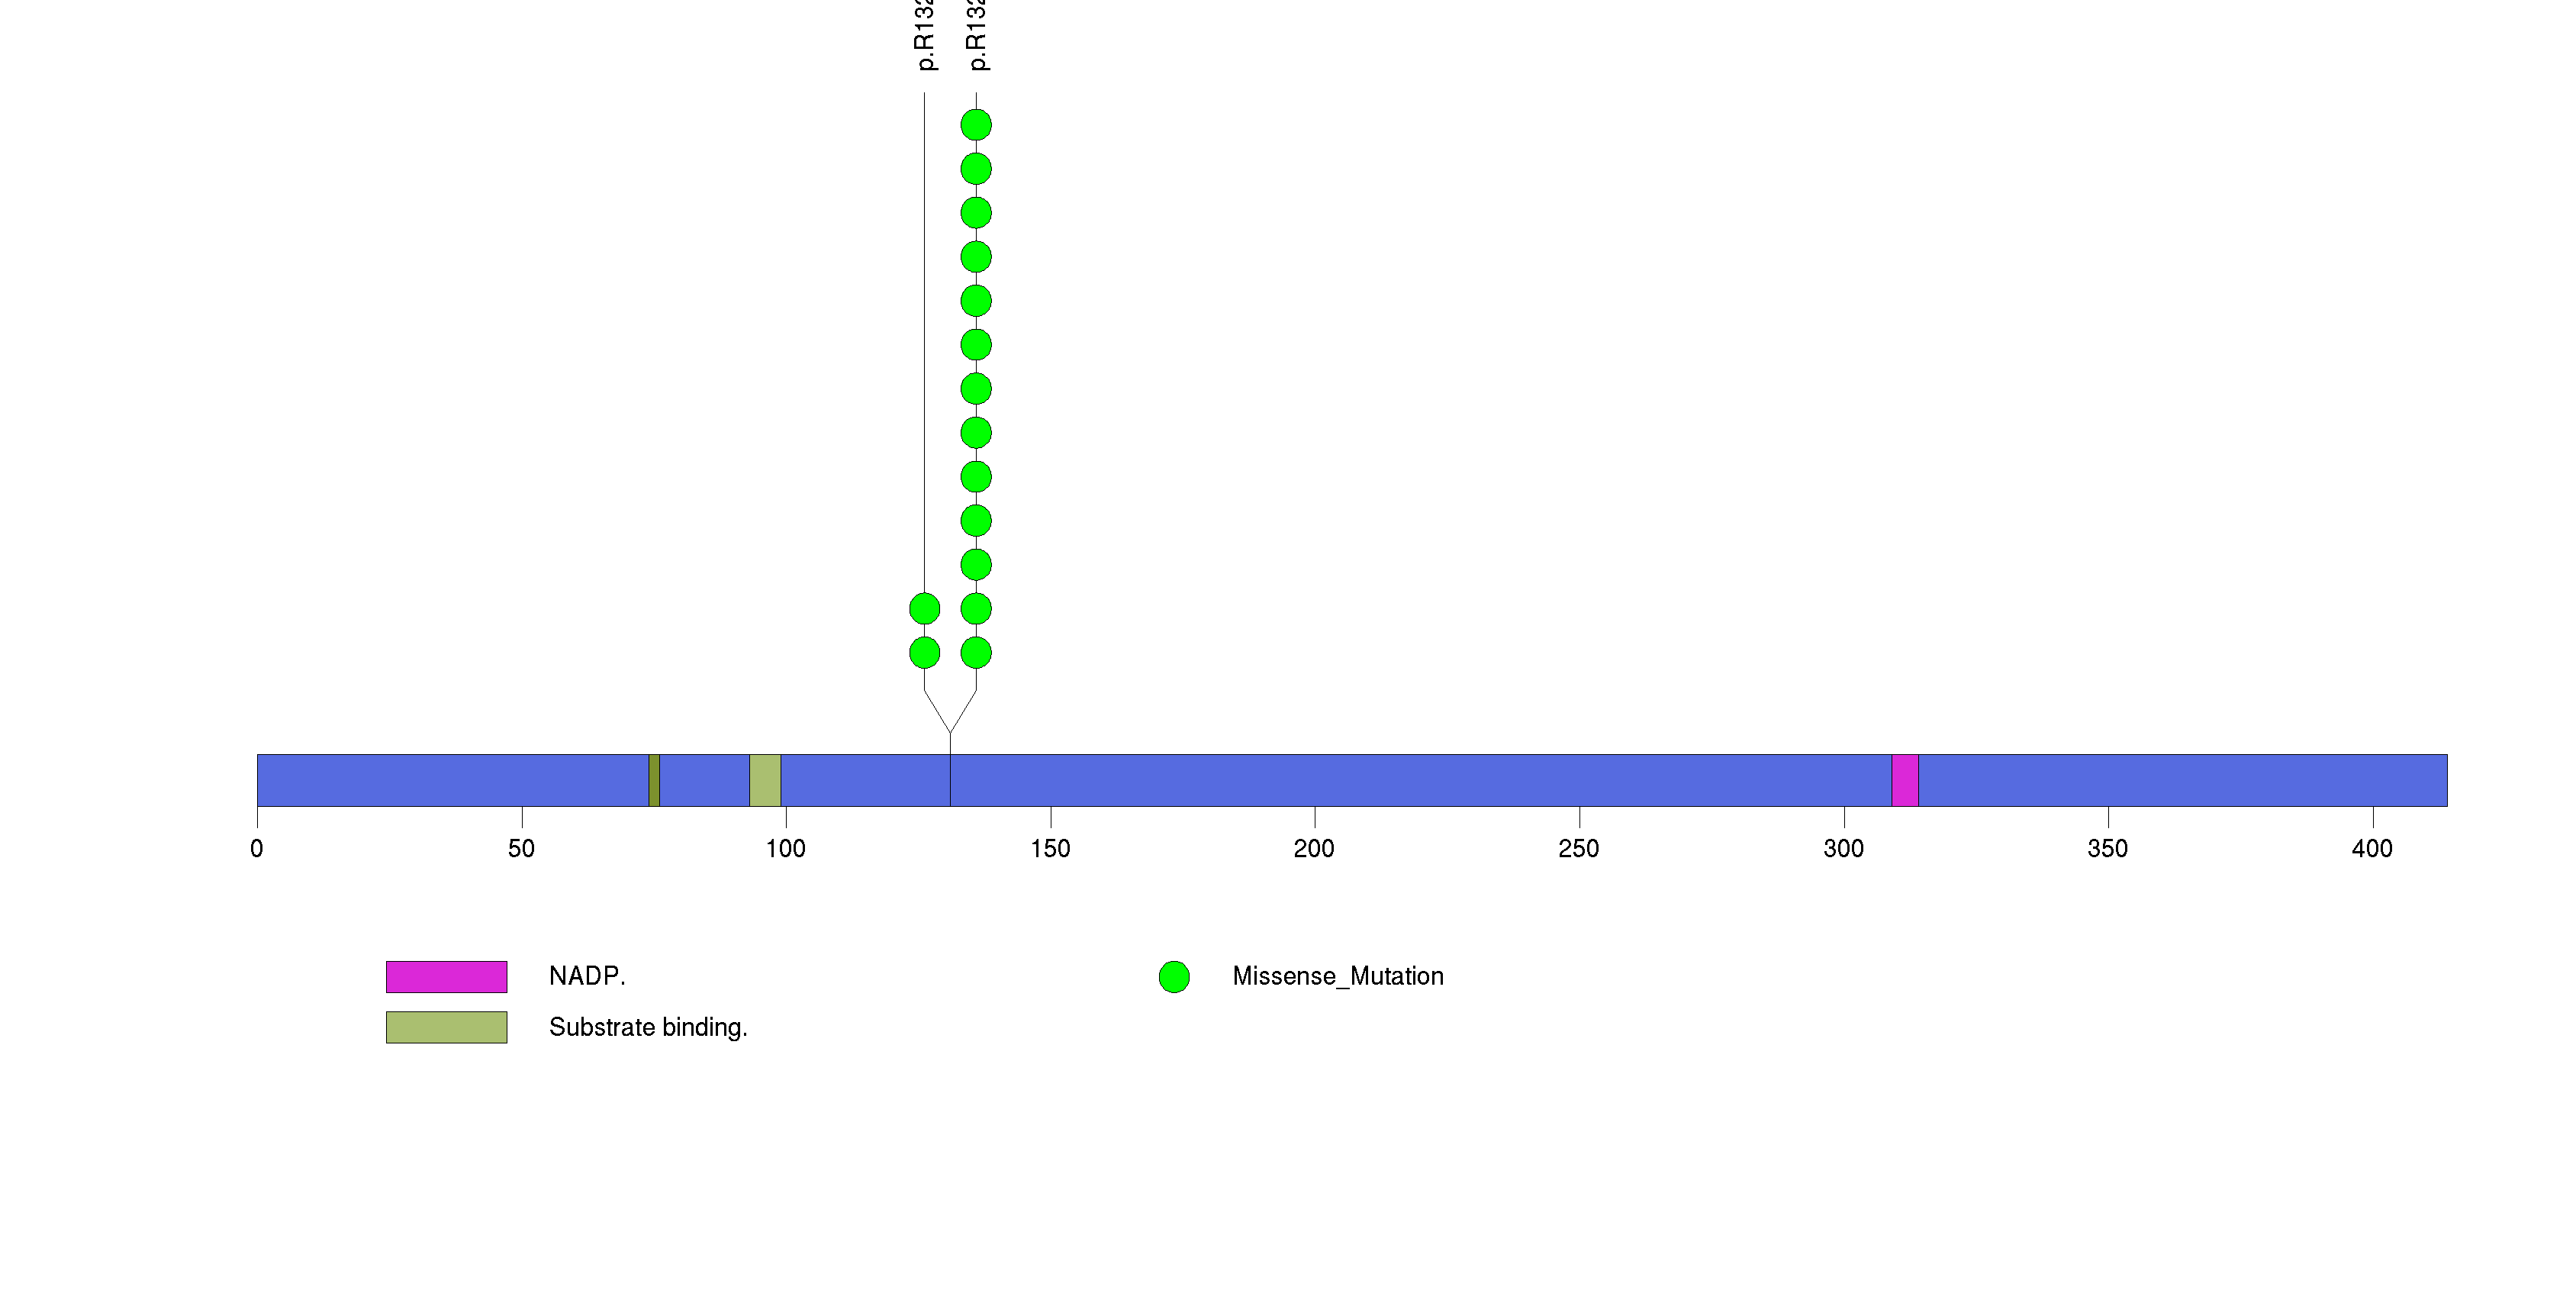
Figure S8. This figure depicts the distribution of mutations and mutation types across the SPTA1 significant gene.
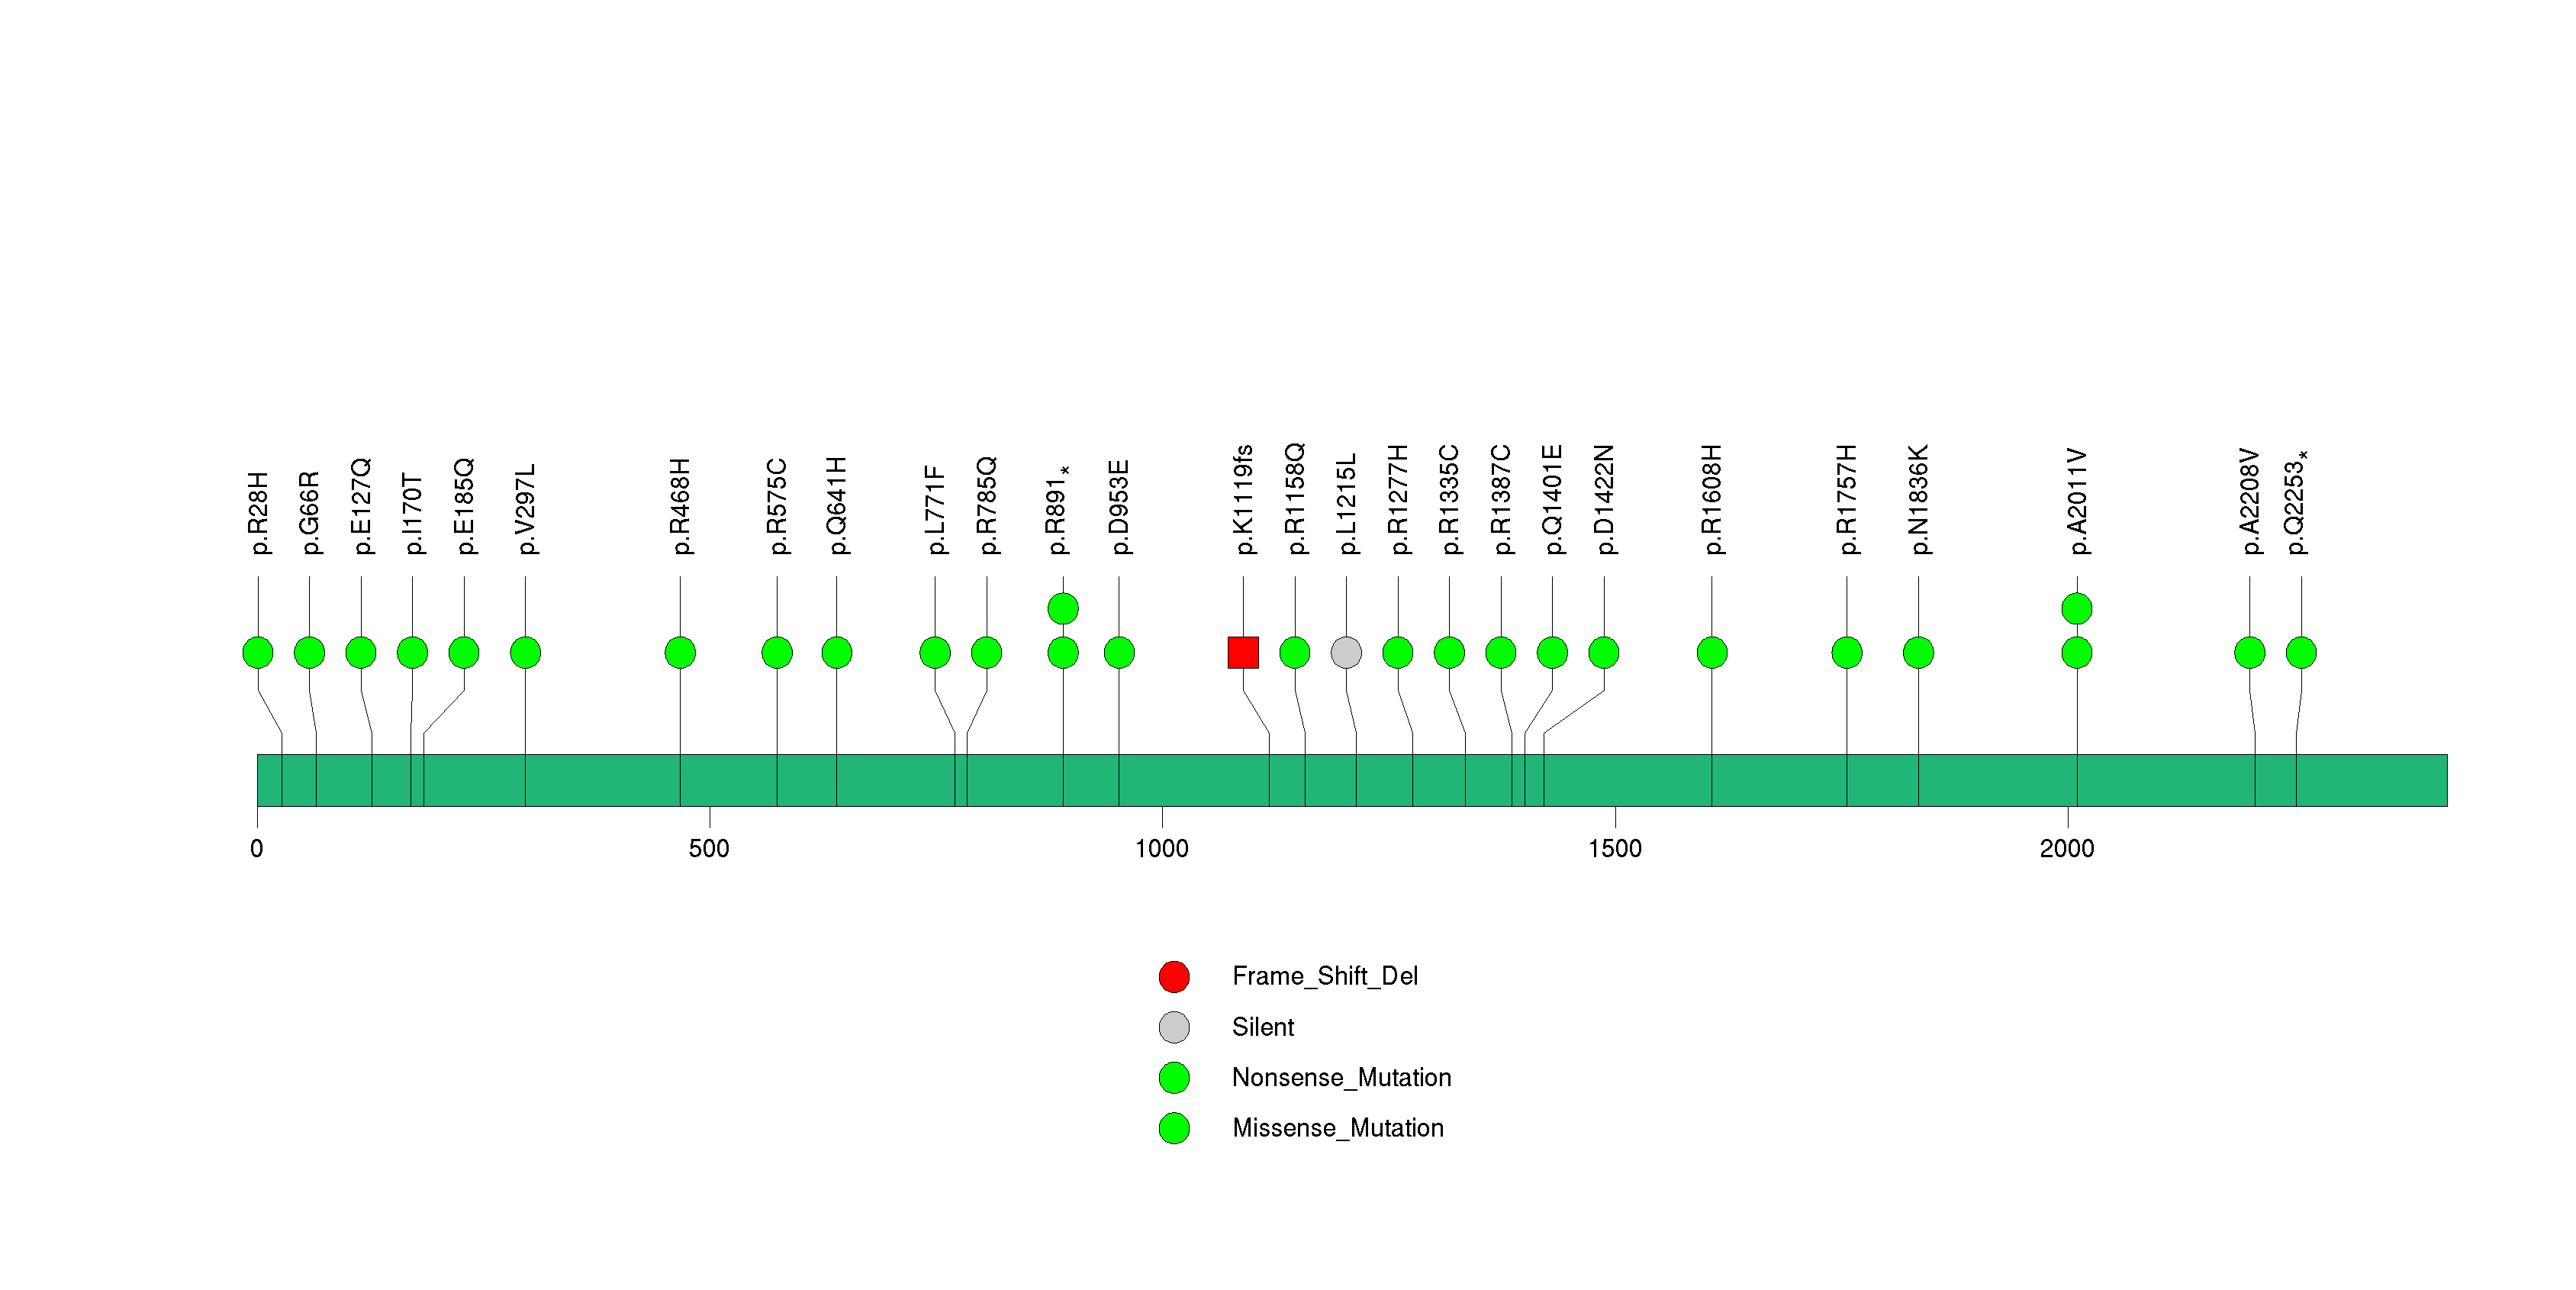
Figure S9. This figure depicts the distribution of mutations and mutation types across the PIK3CA significant gene.
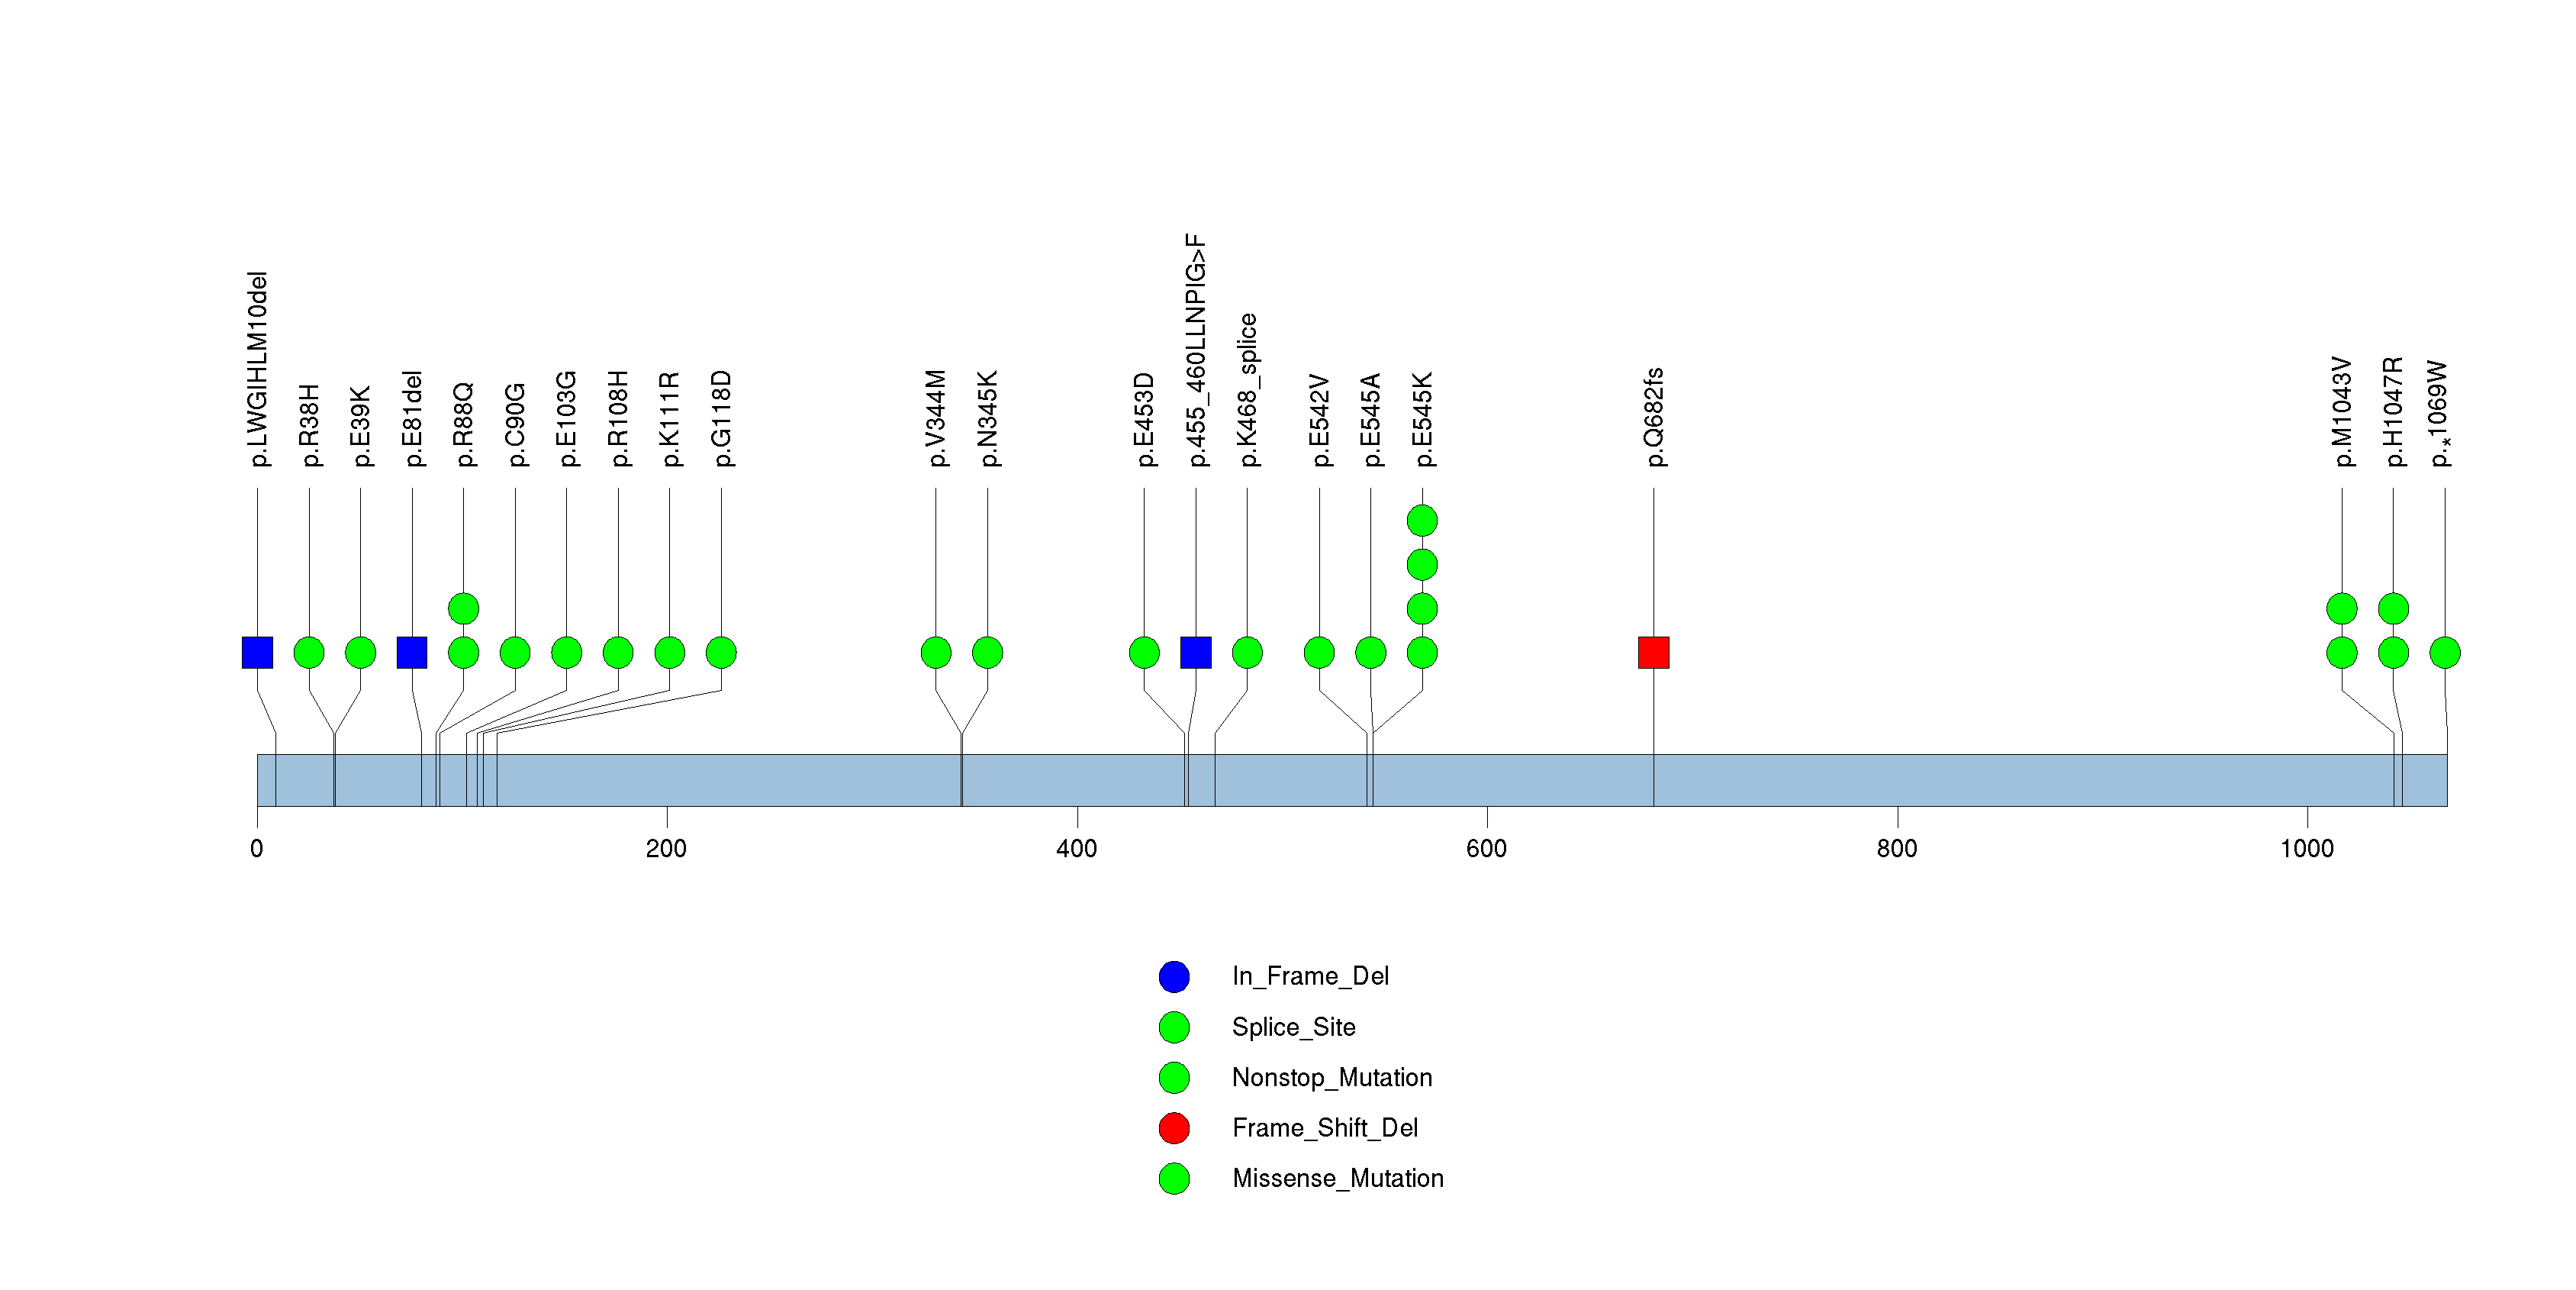
Figure S10. This figure depicts the distribution of mutations and mutation types across the GABRA6 significant gene.
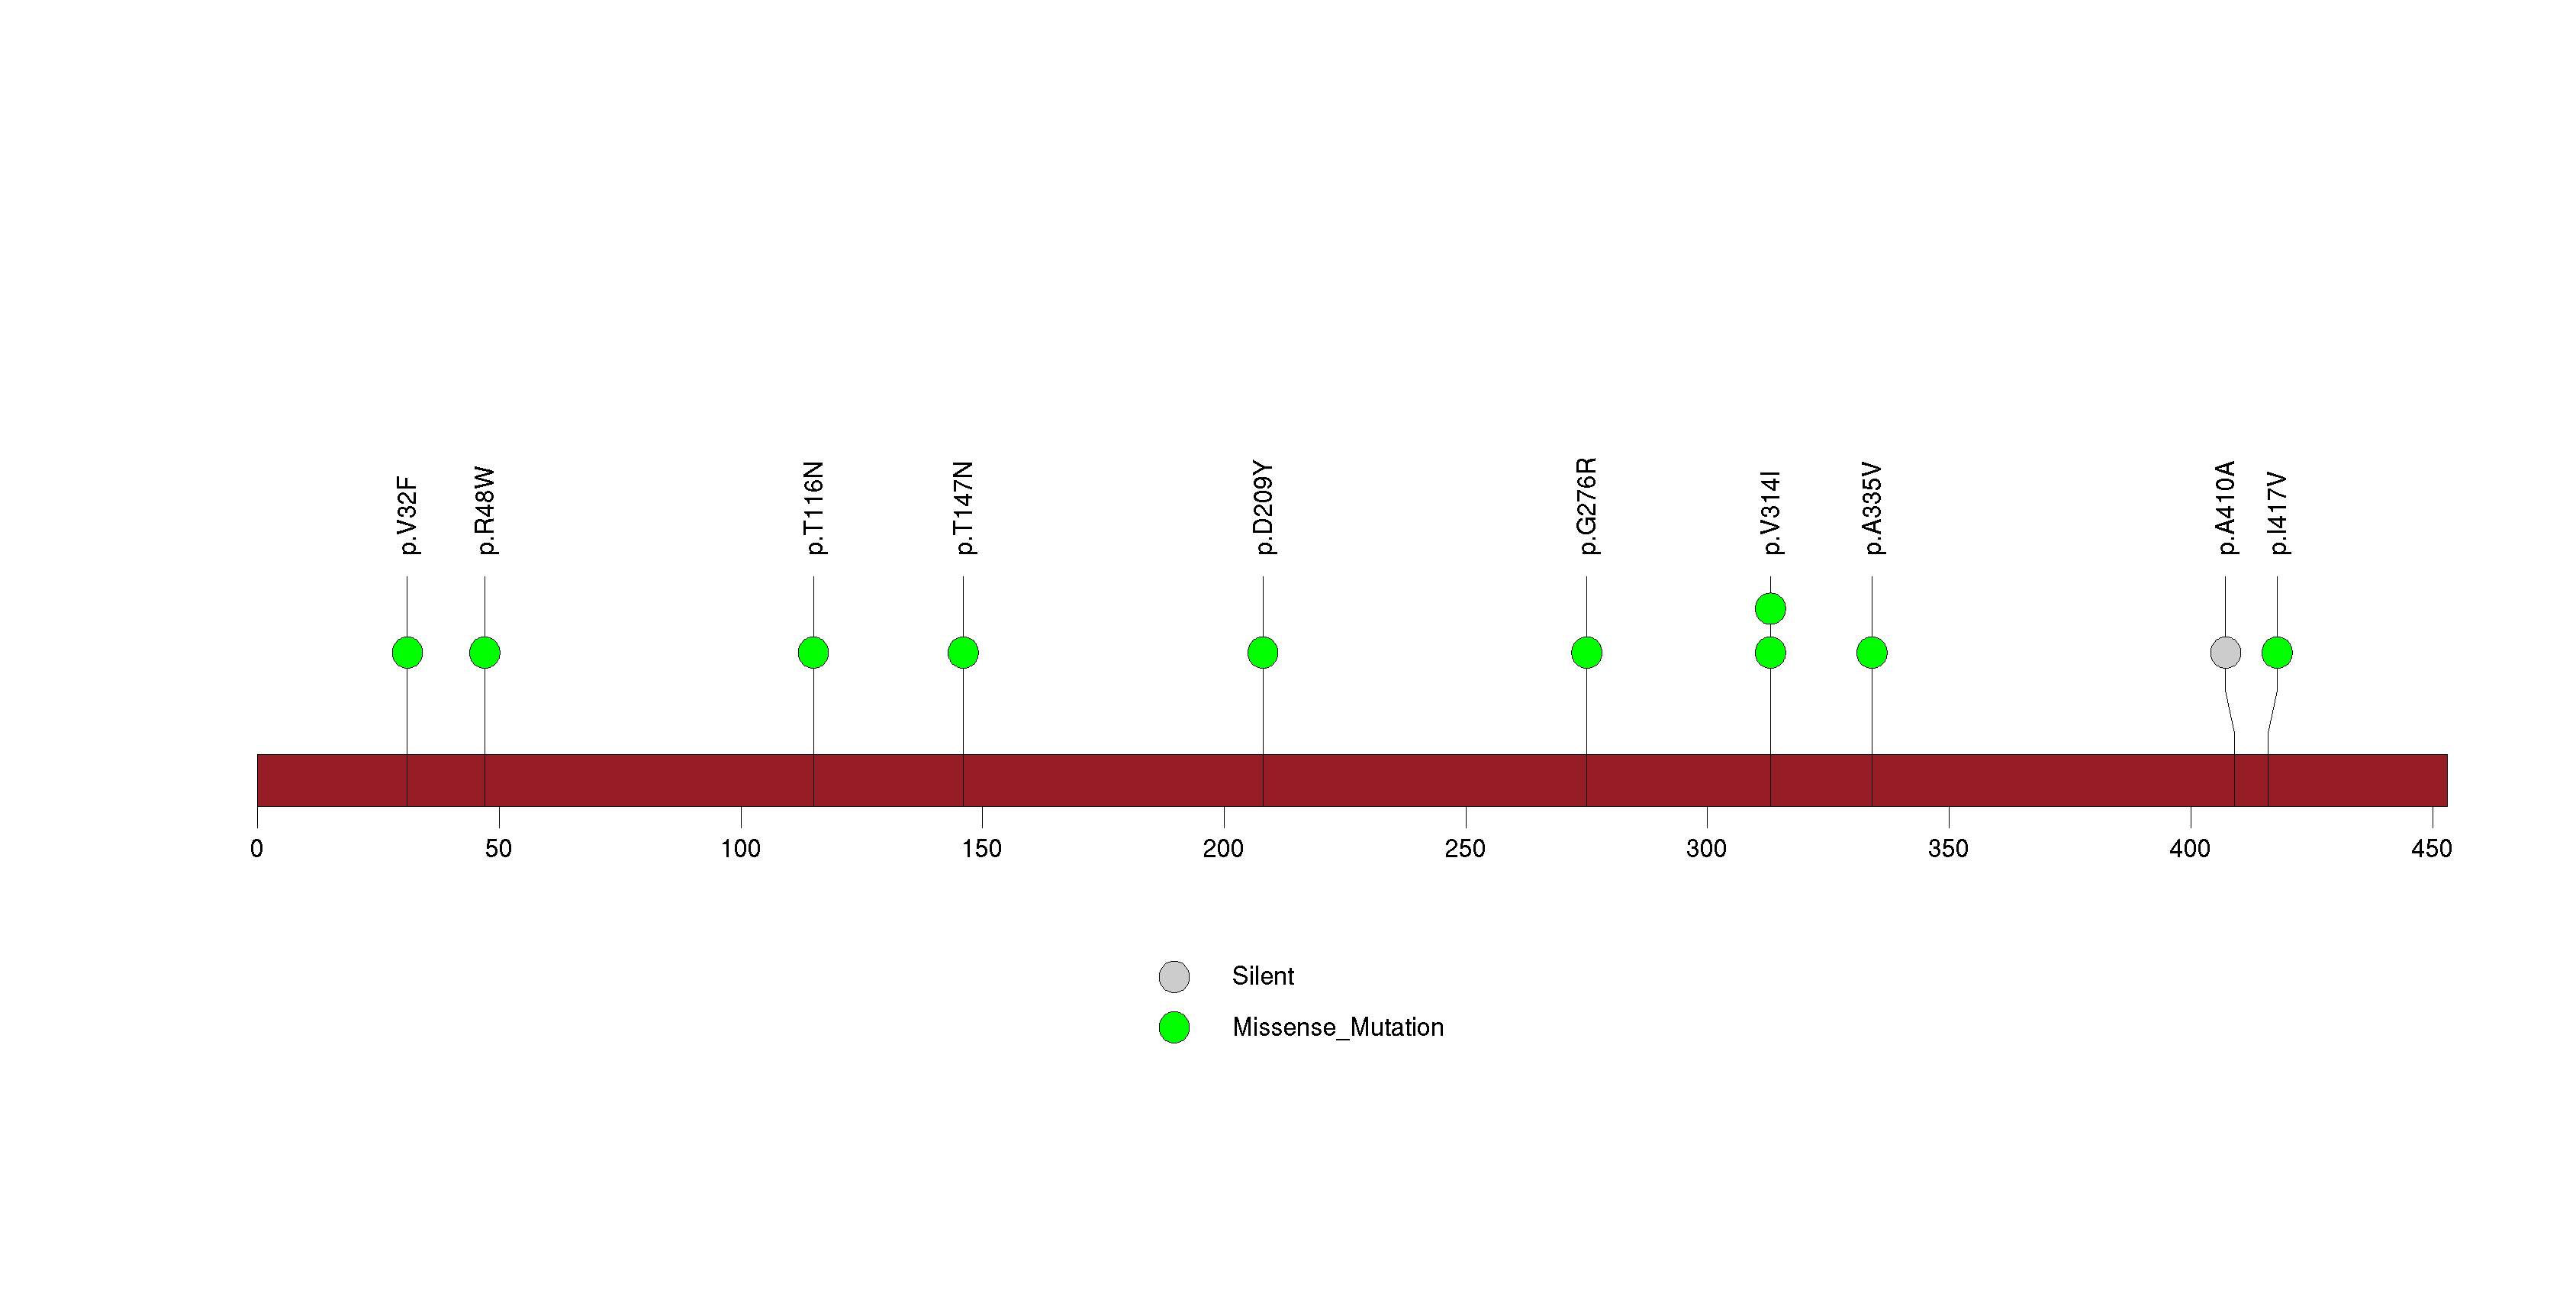
Figure S11. This figure depicts the distribution of mutations and mutation types across the FLG significant gene.
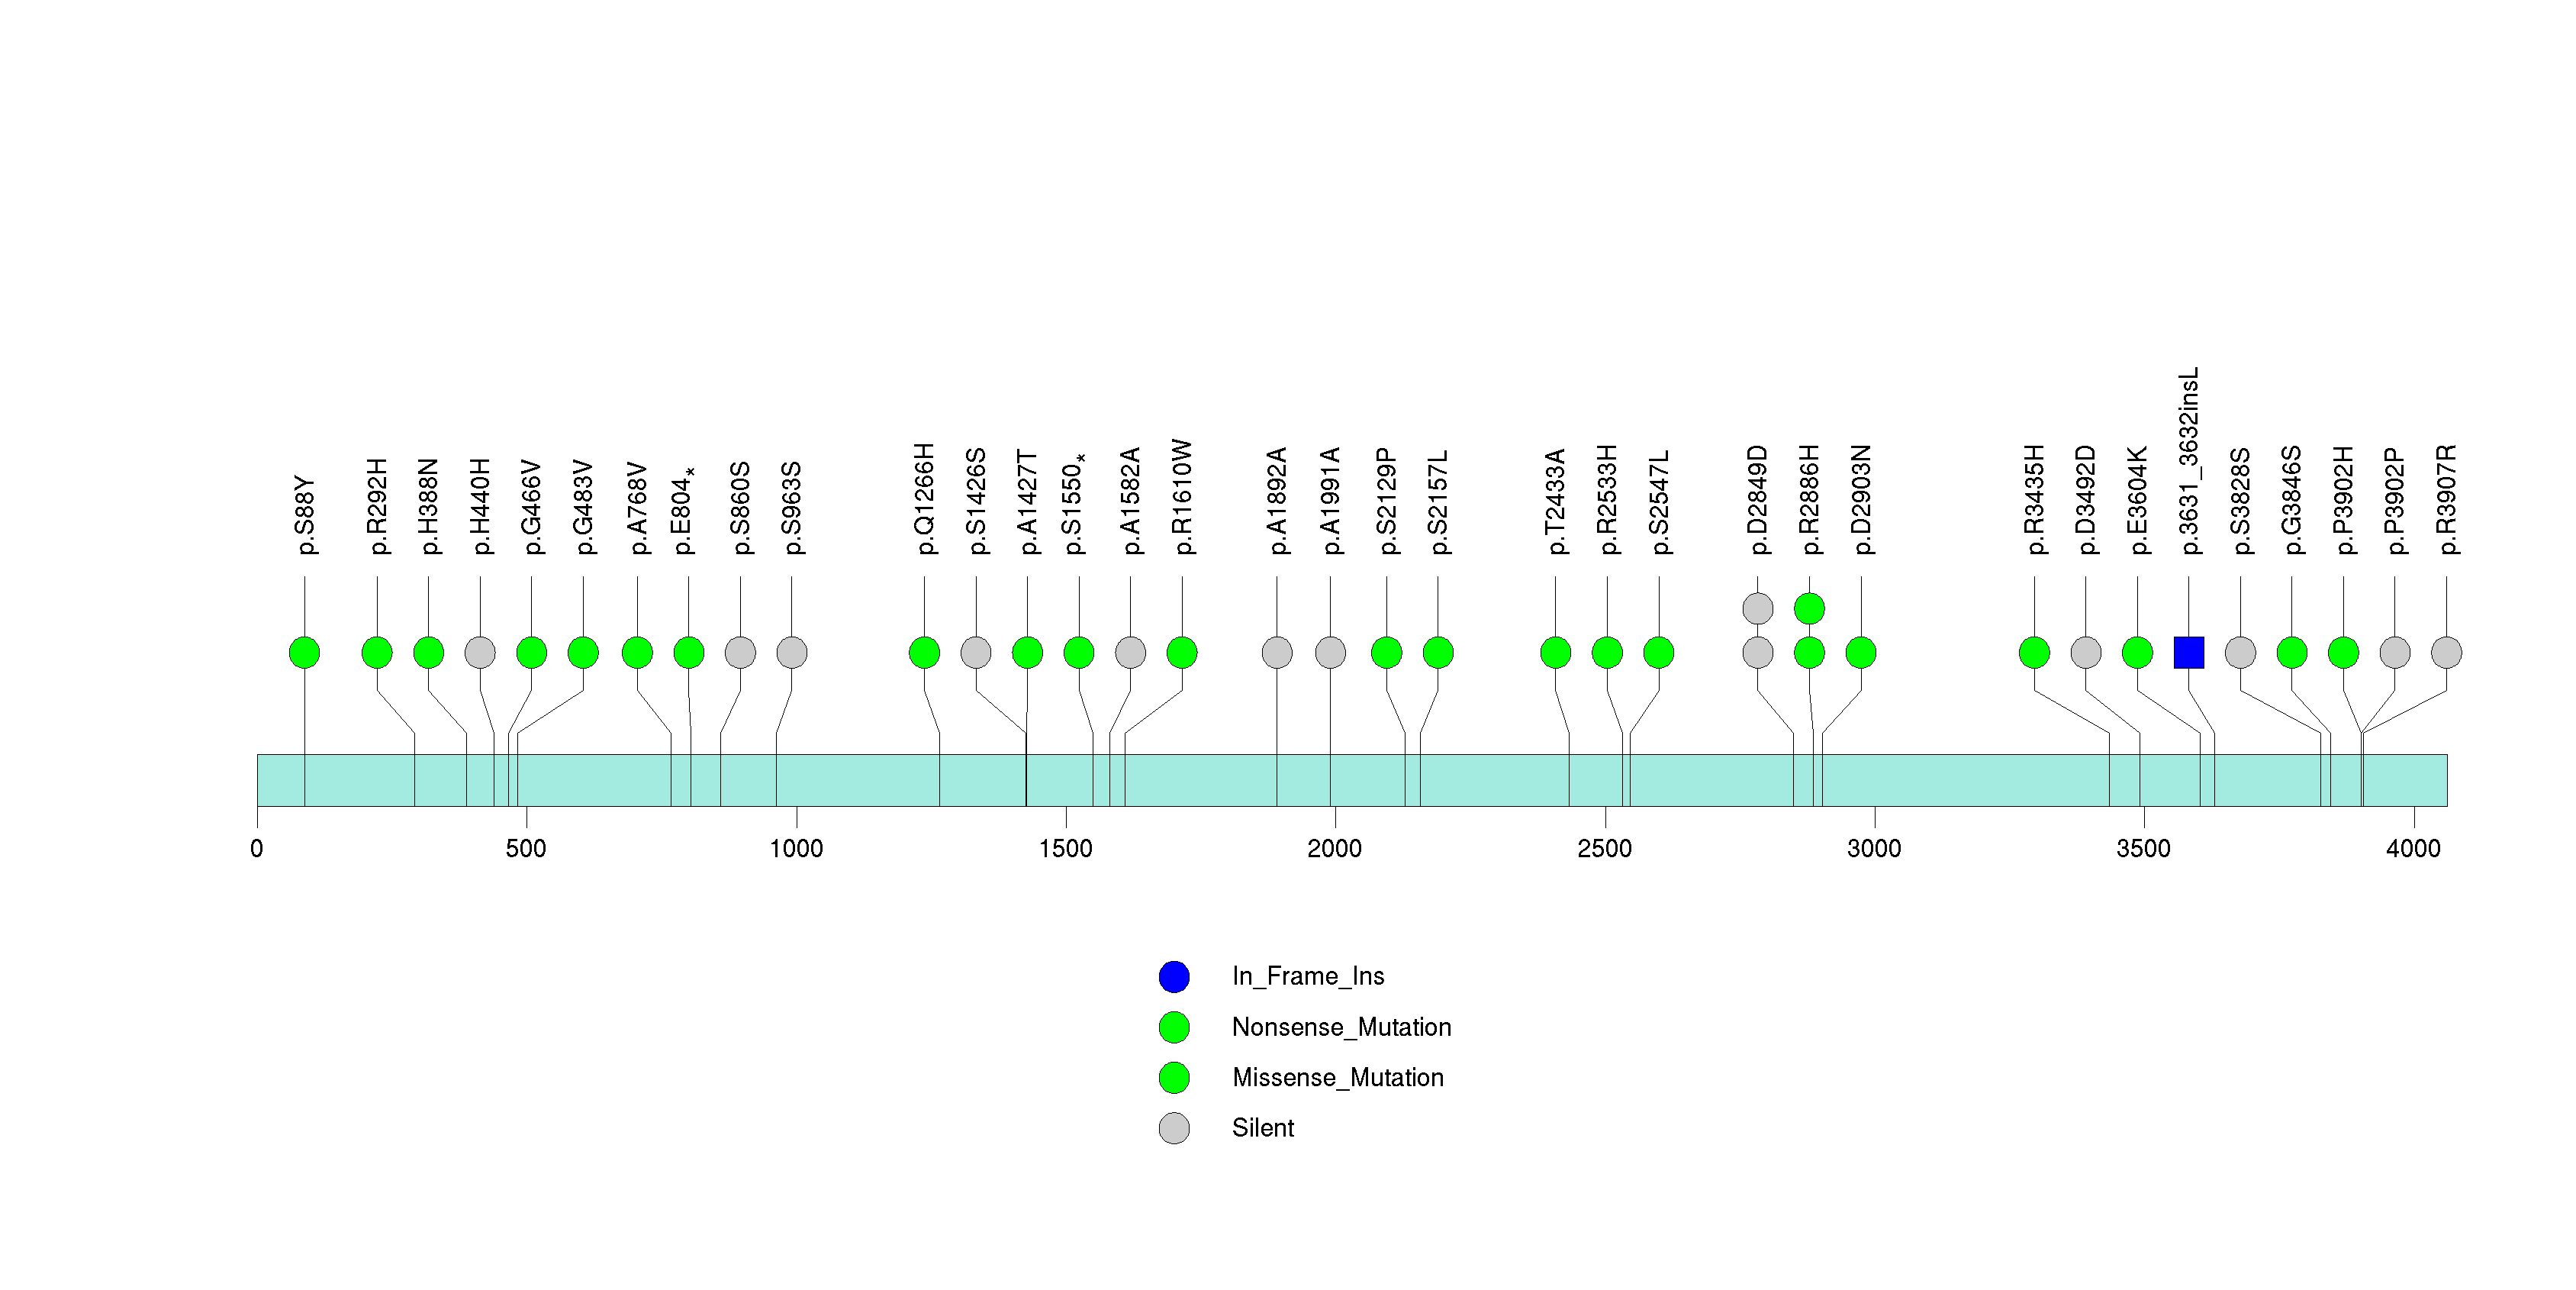
Figure S12. This figure depicts the distribution of mutations and mutation types across the RPL5 significant gene.
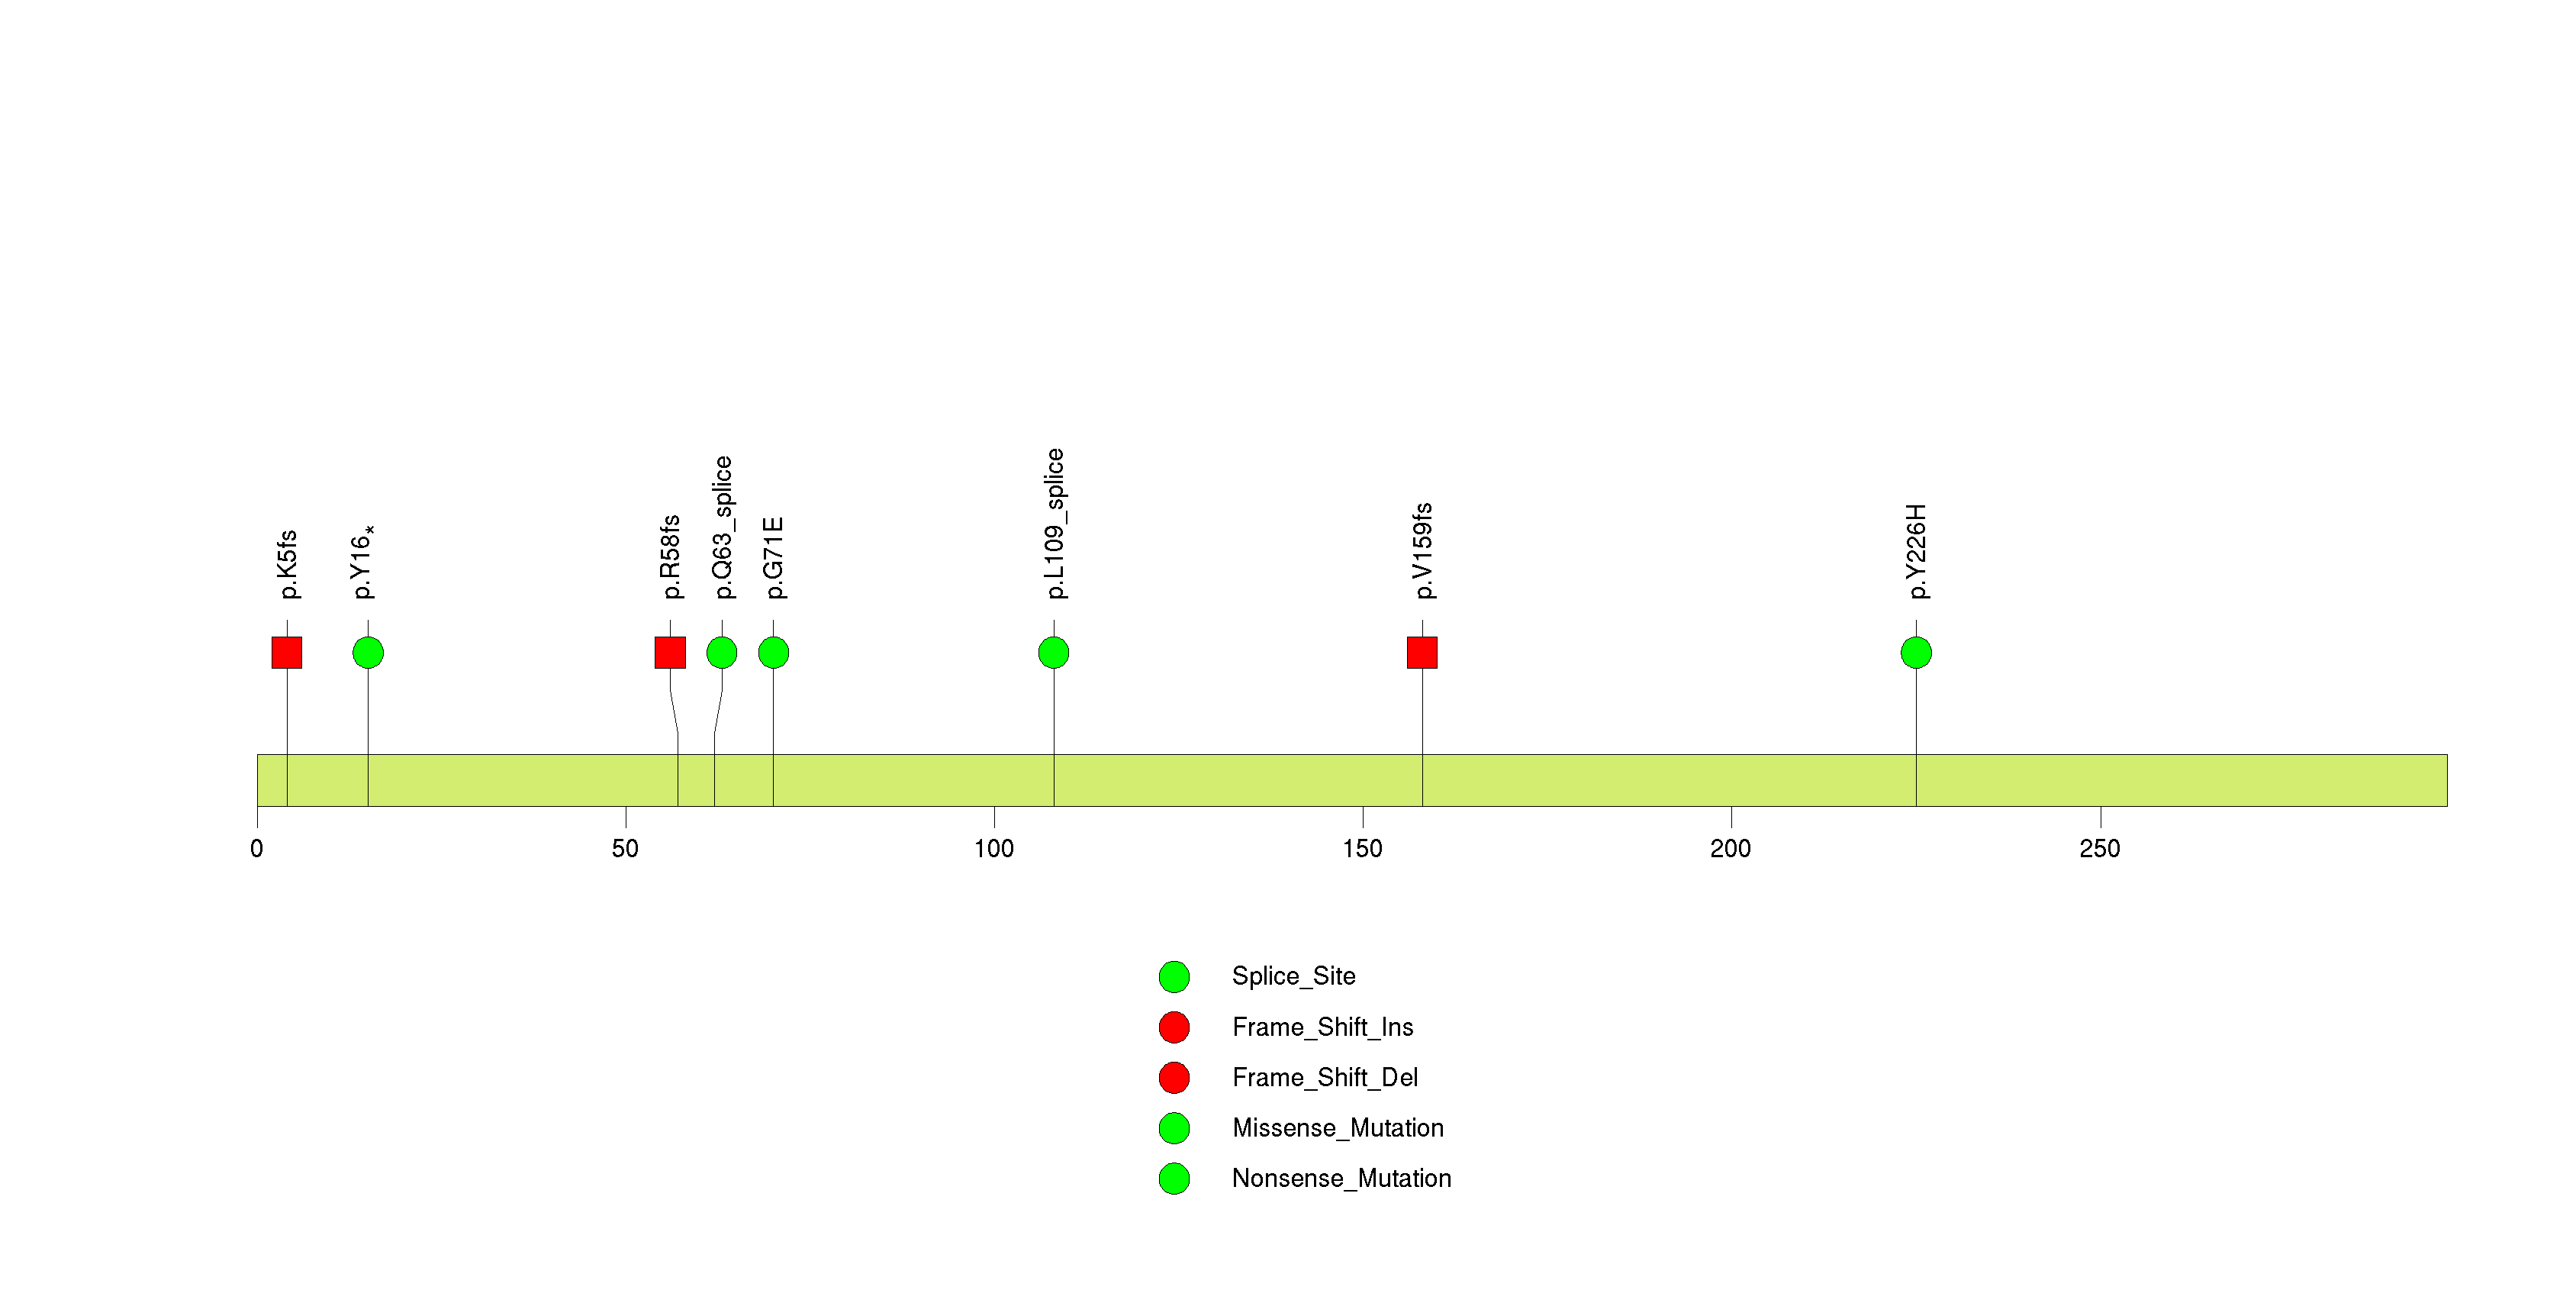
Figure S13. This figure depicts the distribution of mutations and mutation types across the KEL significant gene.
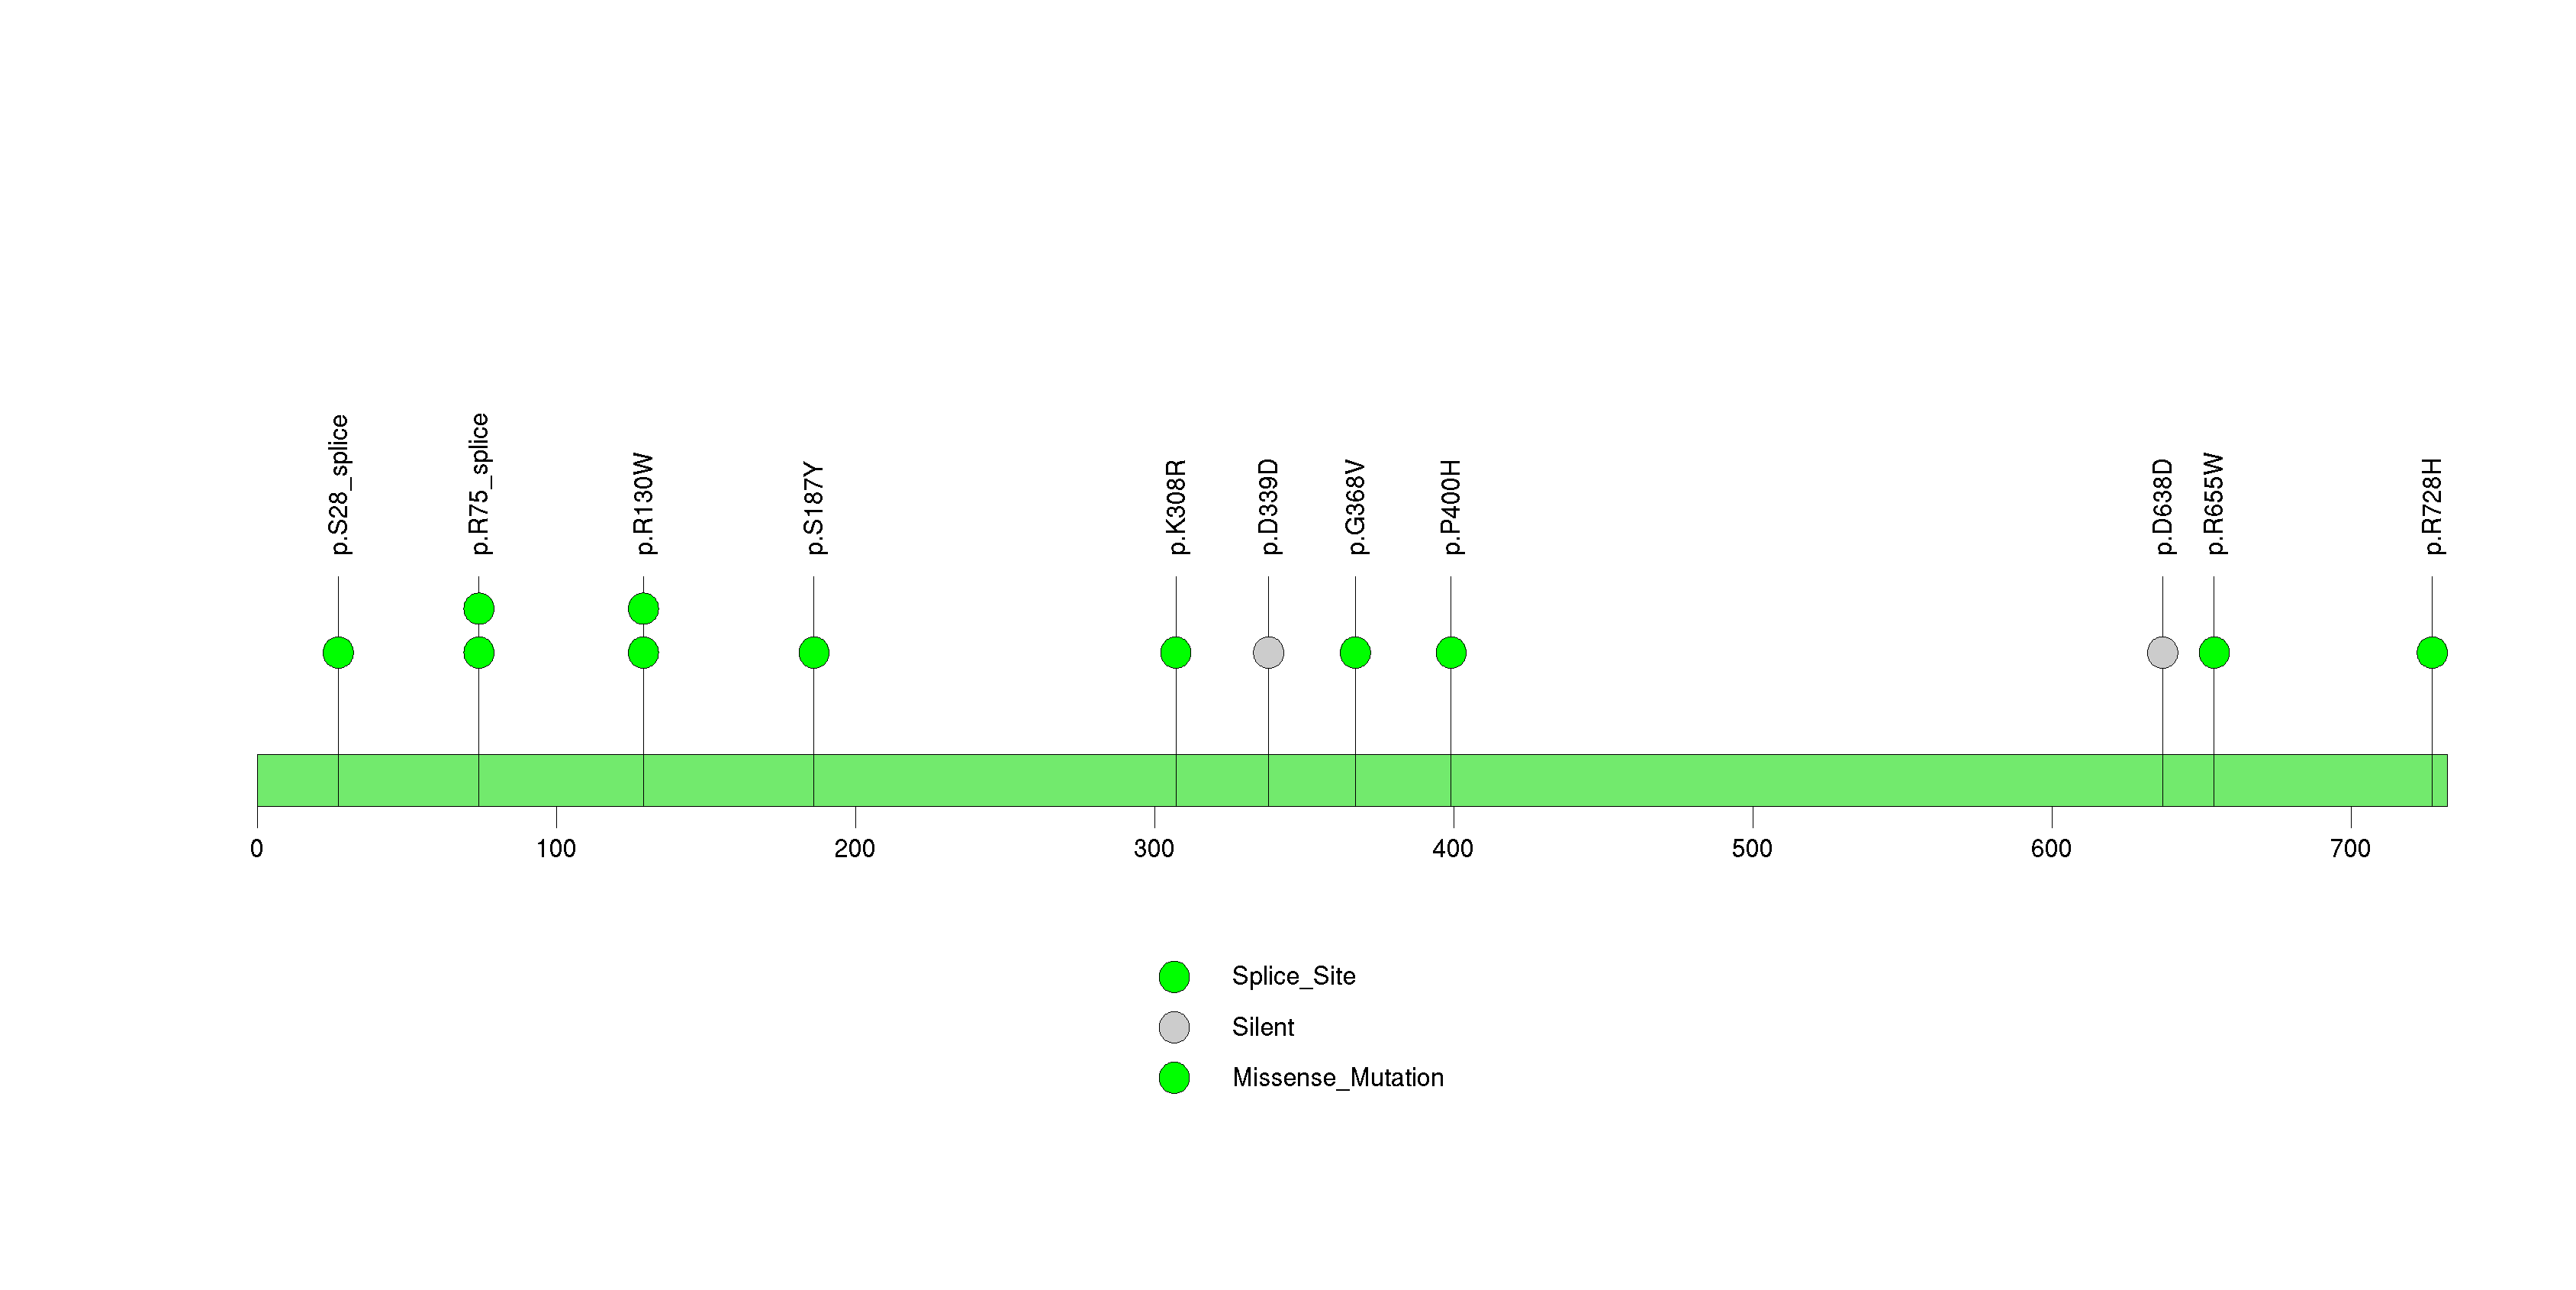
Figure S14. This figure depicts the distribution of mutations and mutation types across the RBM47 significant gene.
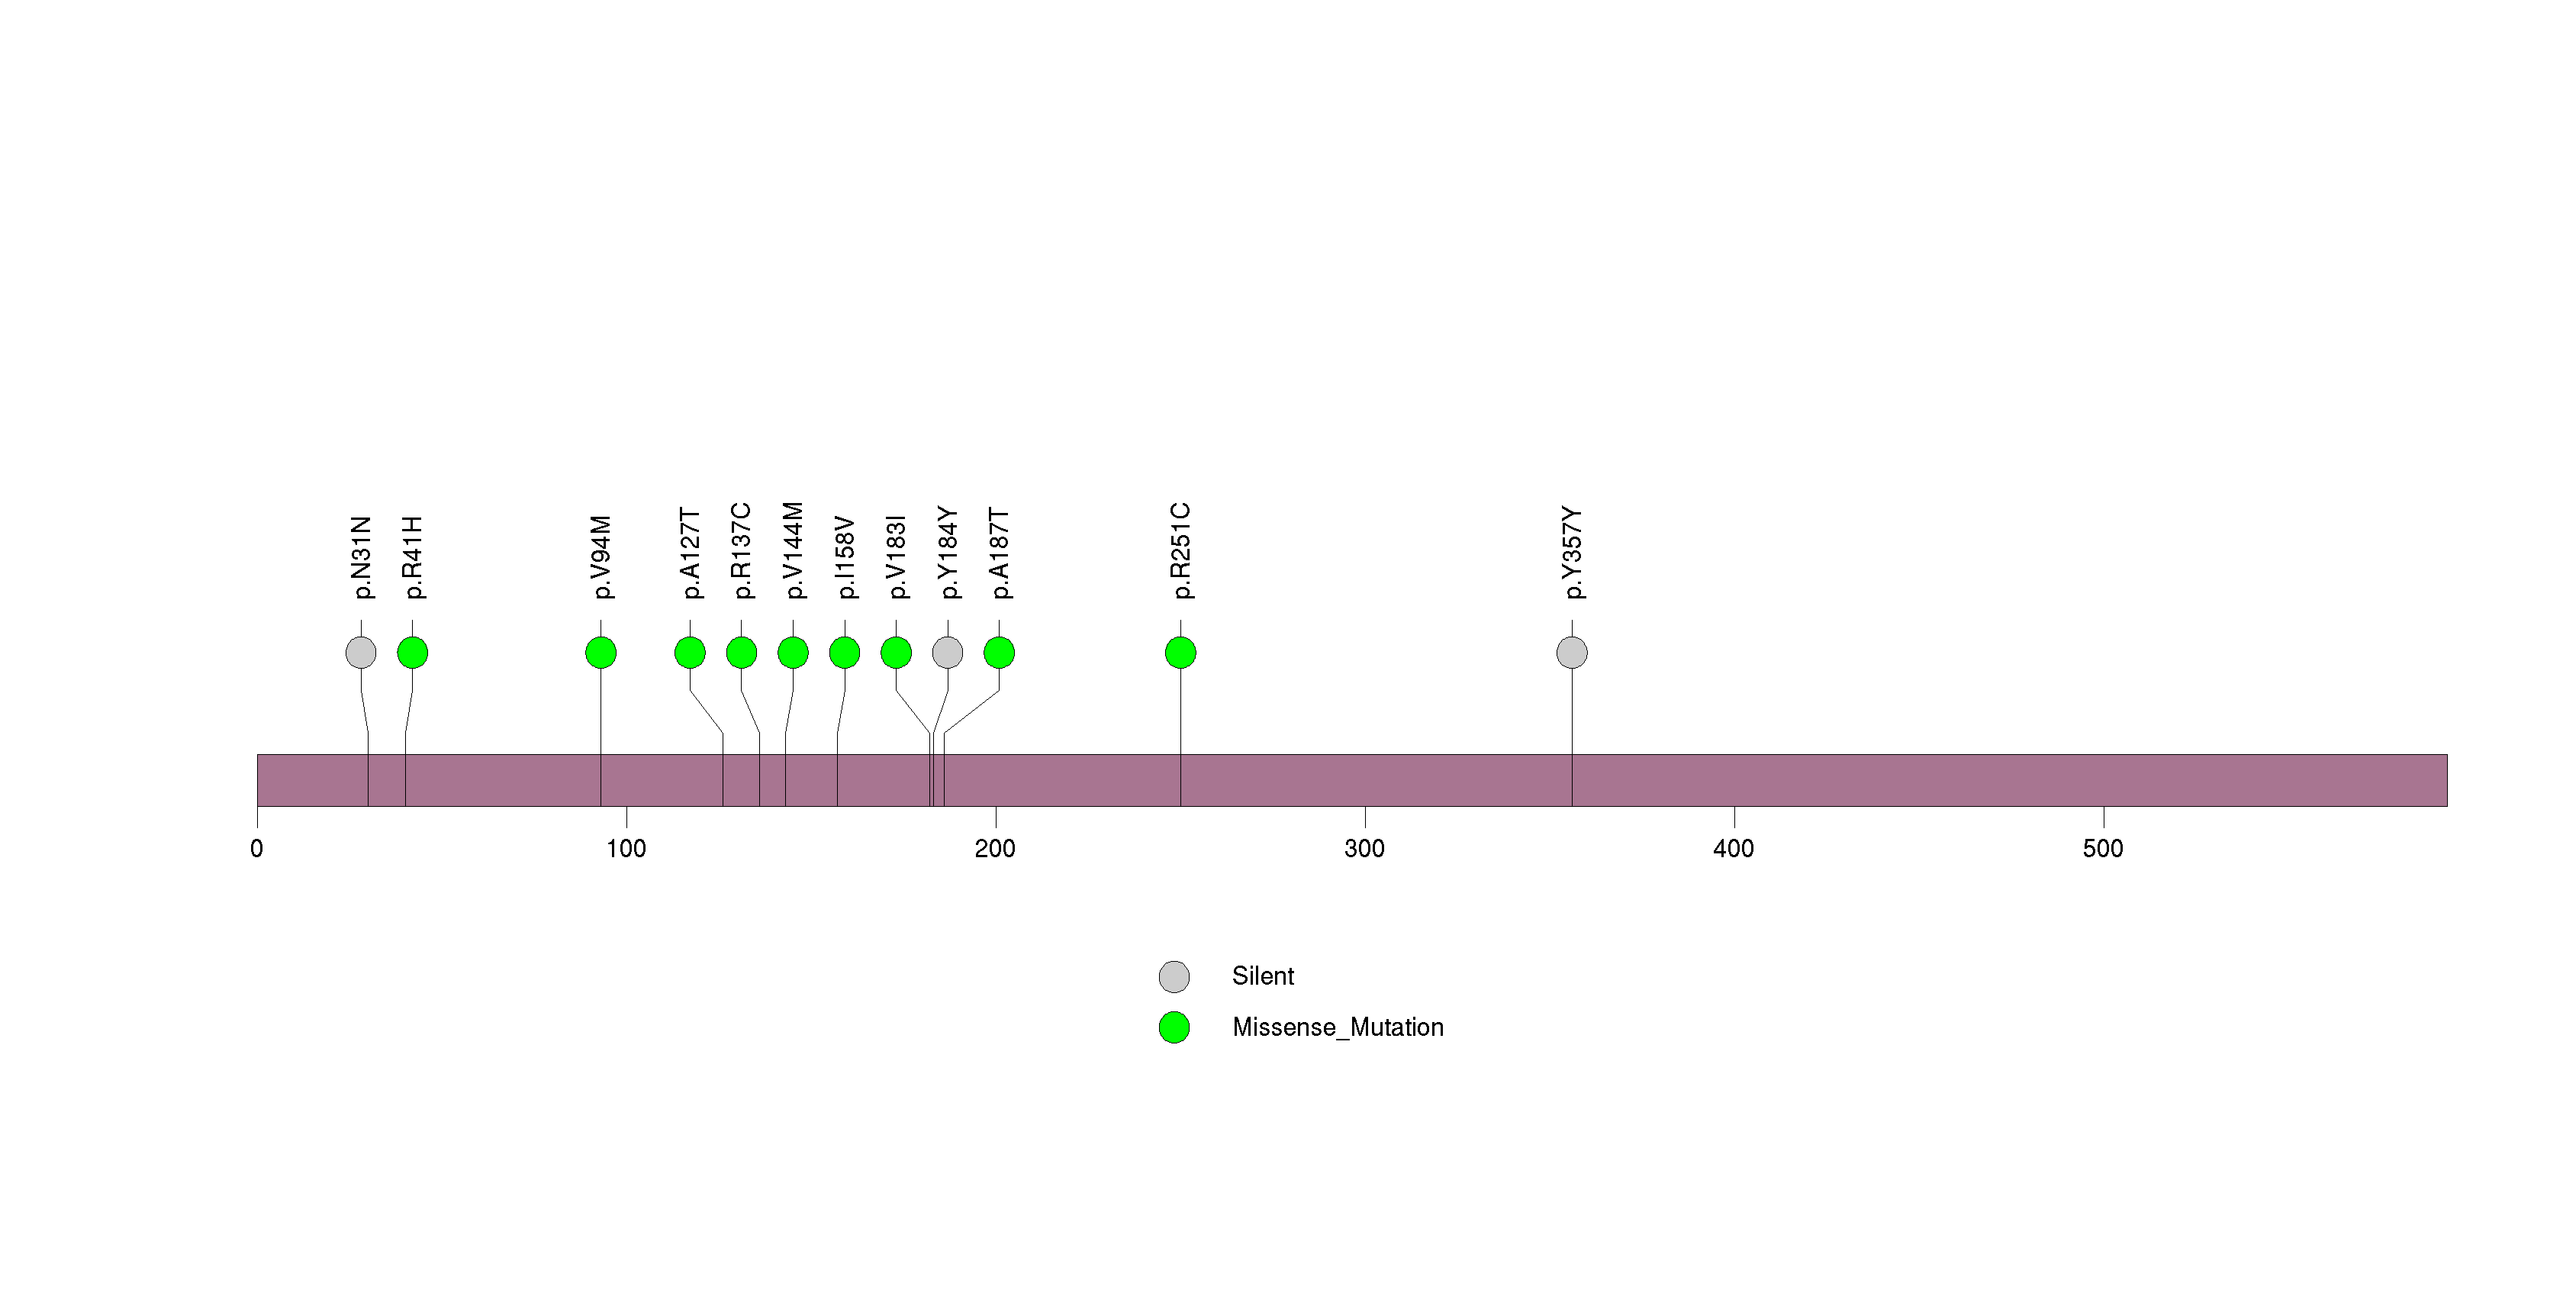
Figure S15. This figure depicts the distribution of mutations and mutation types across the PCLO significant gene.
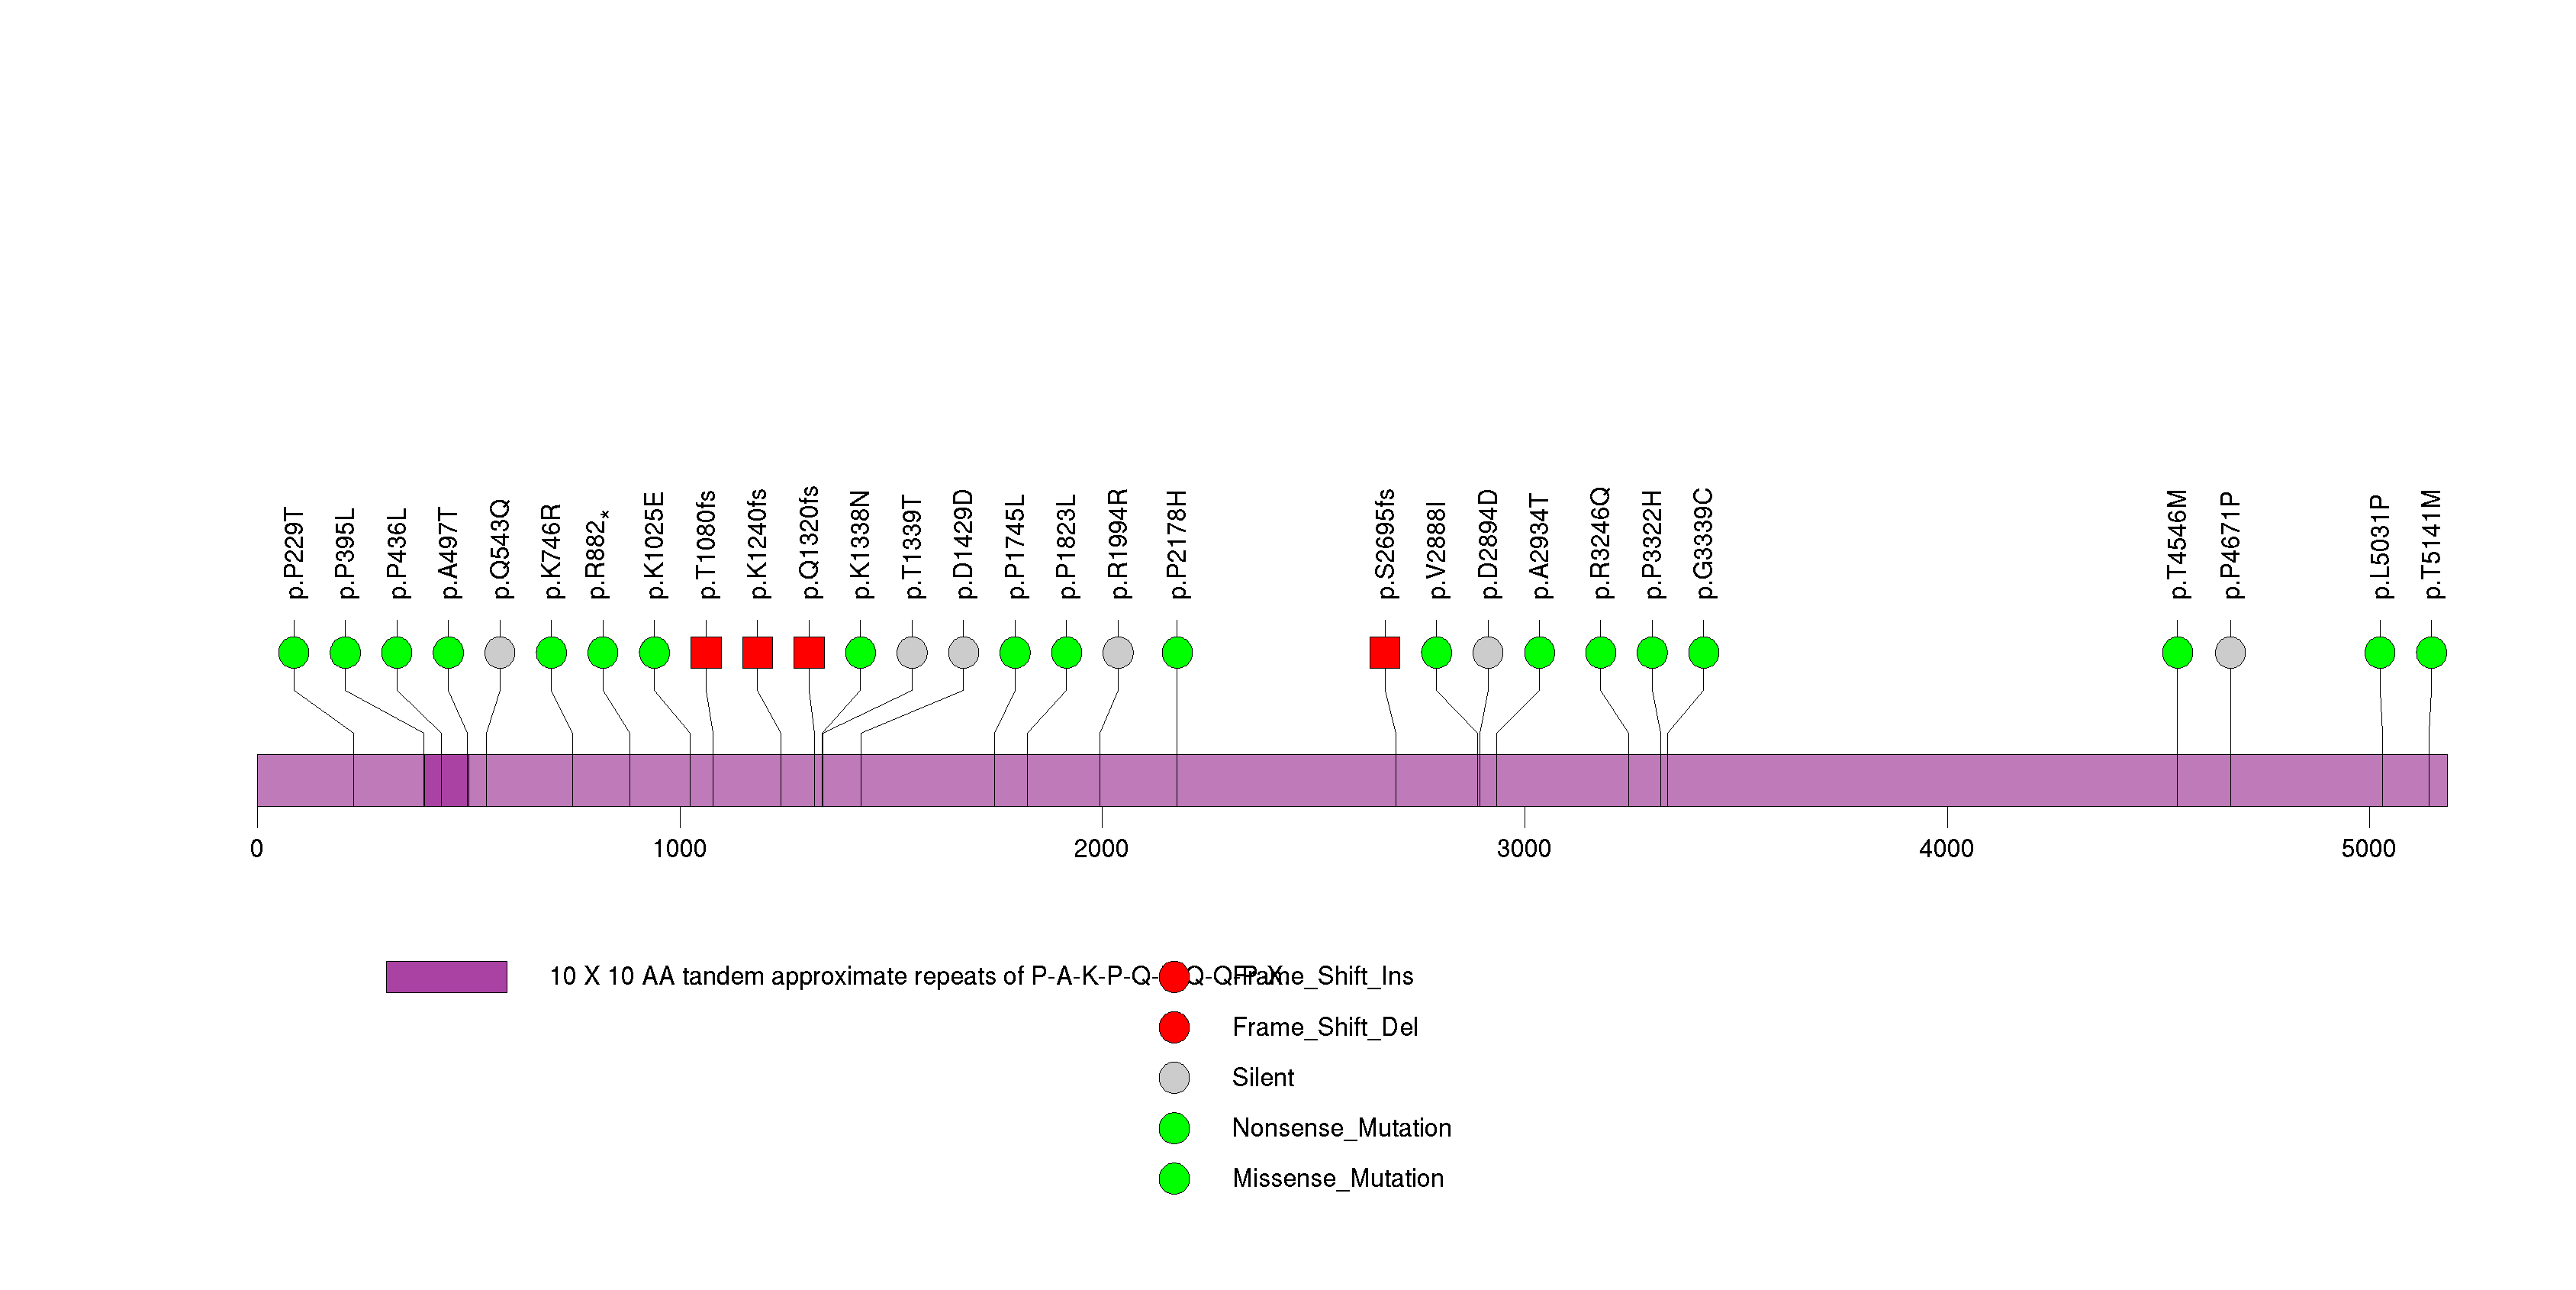
Figure S16. This figure depicts the distribution of mutations and mutation types across the TCHH significant gene.
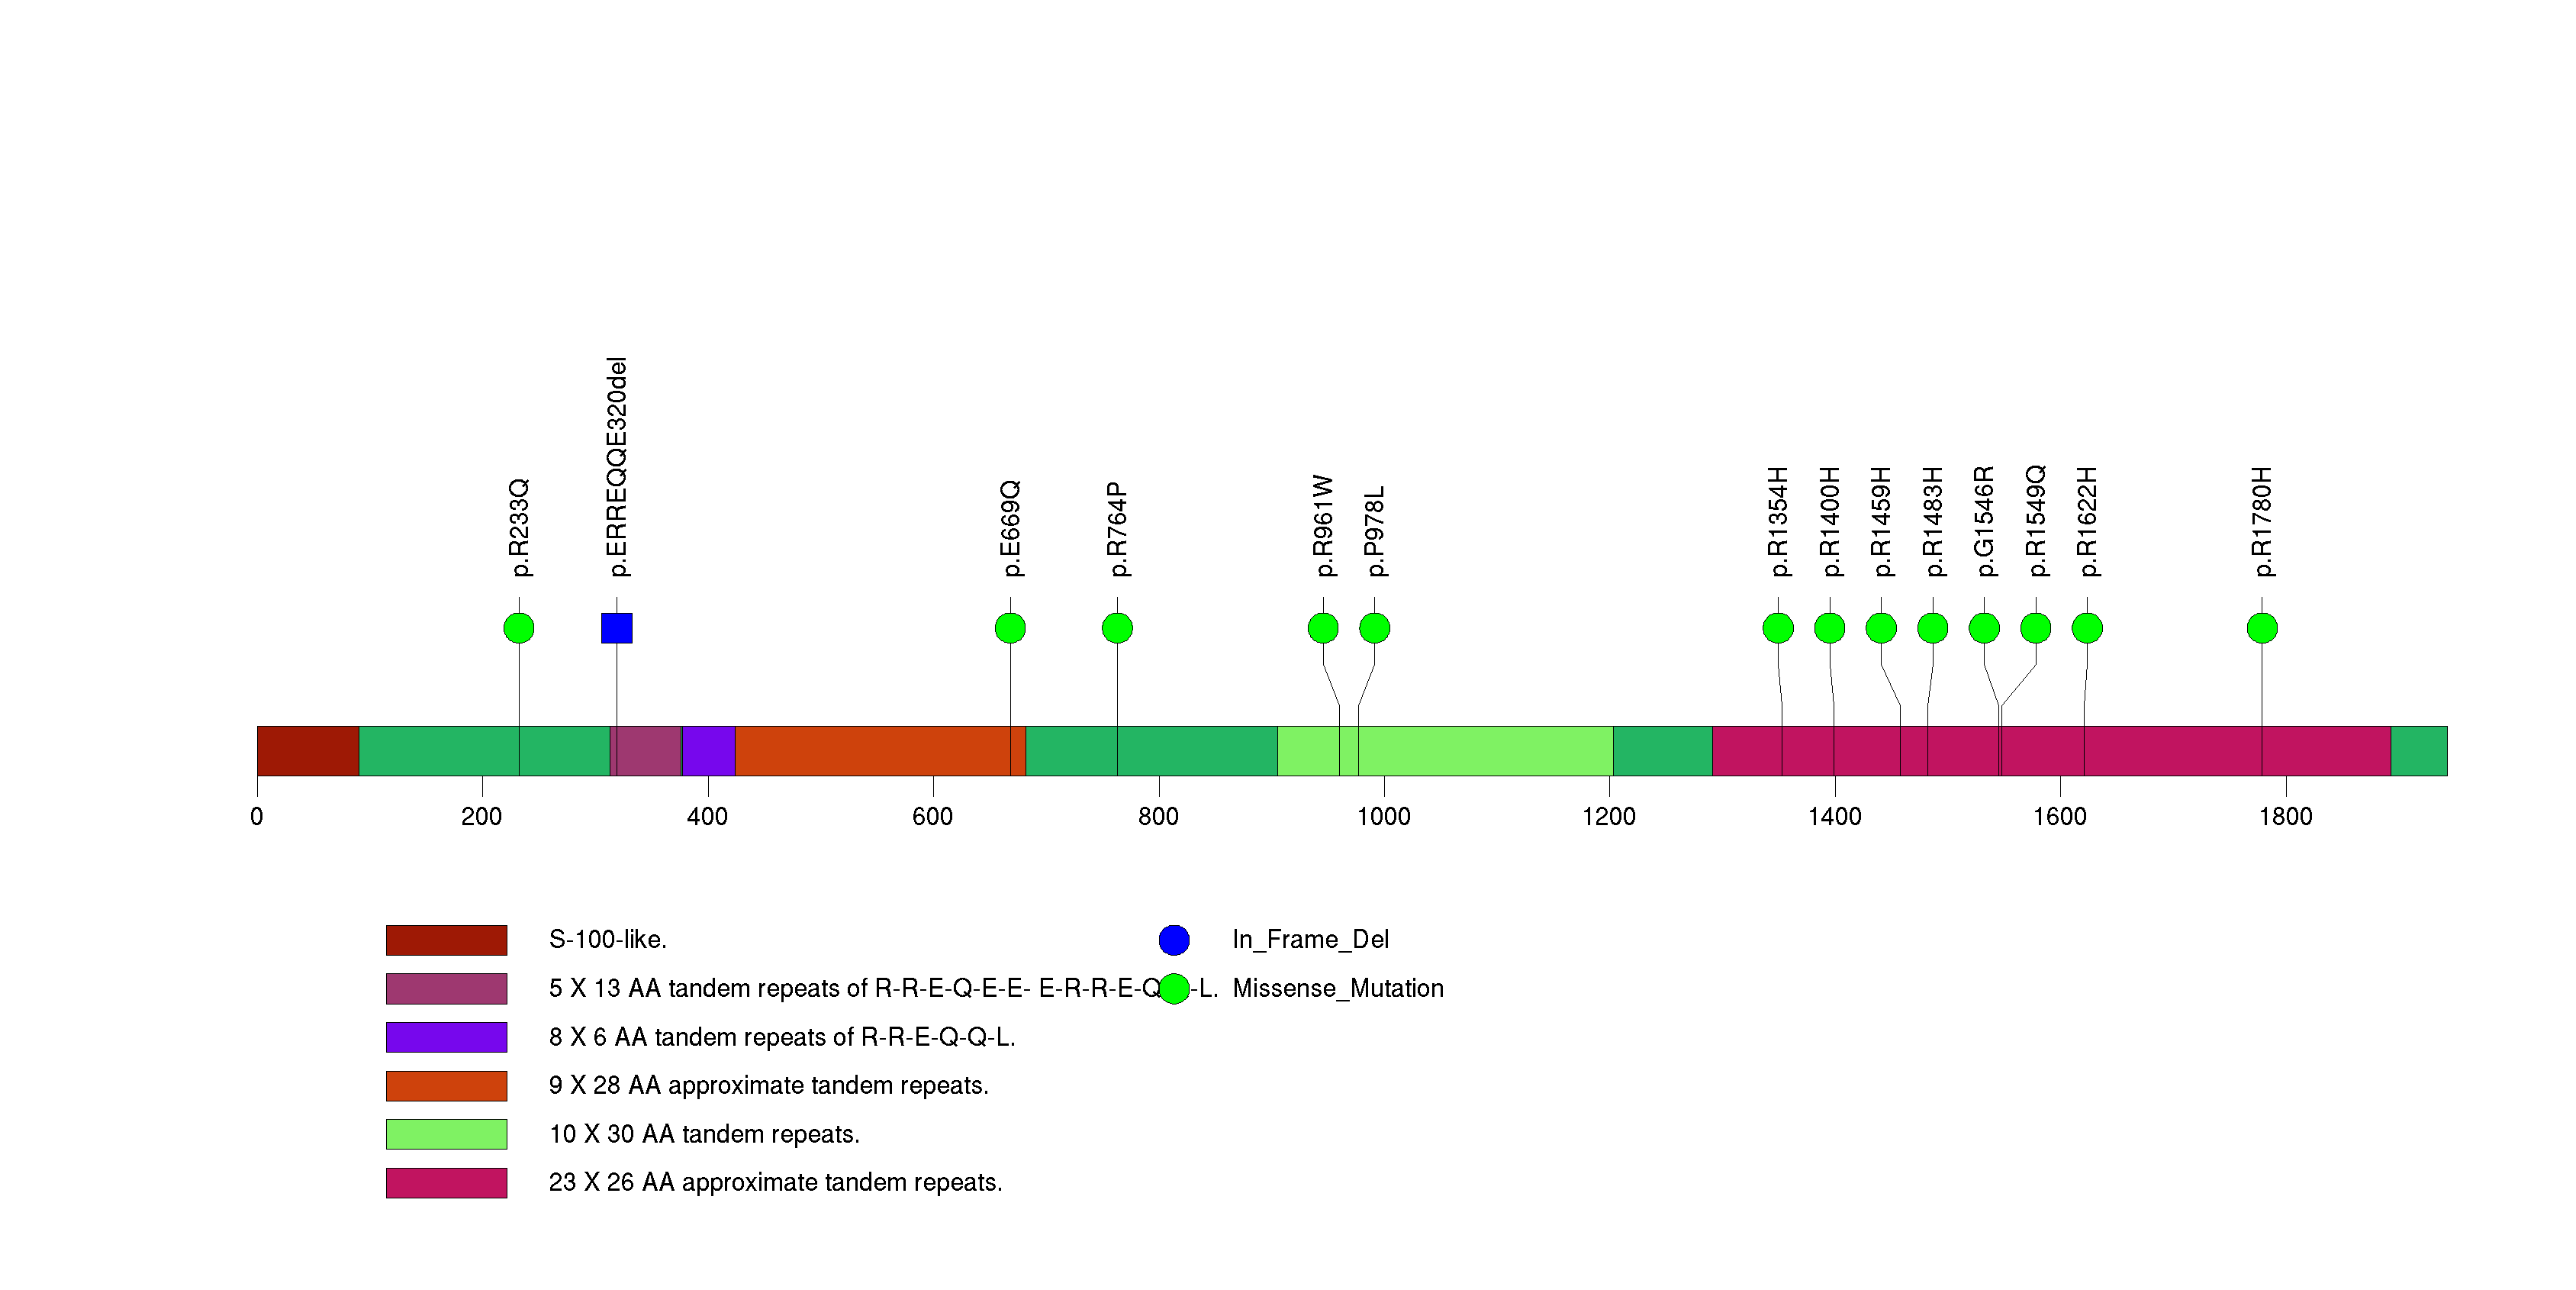
Figure S17. This figure depicts the distribution of mutations and mutation types across the SEMA3C significant gene.
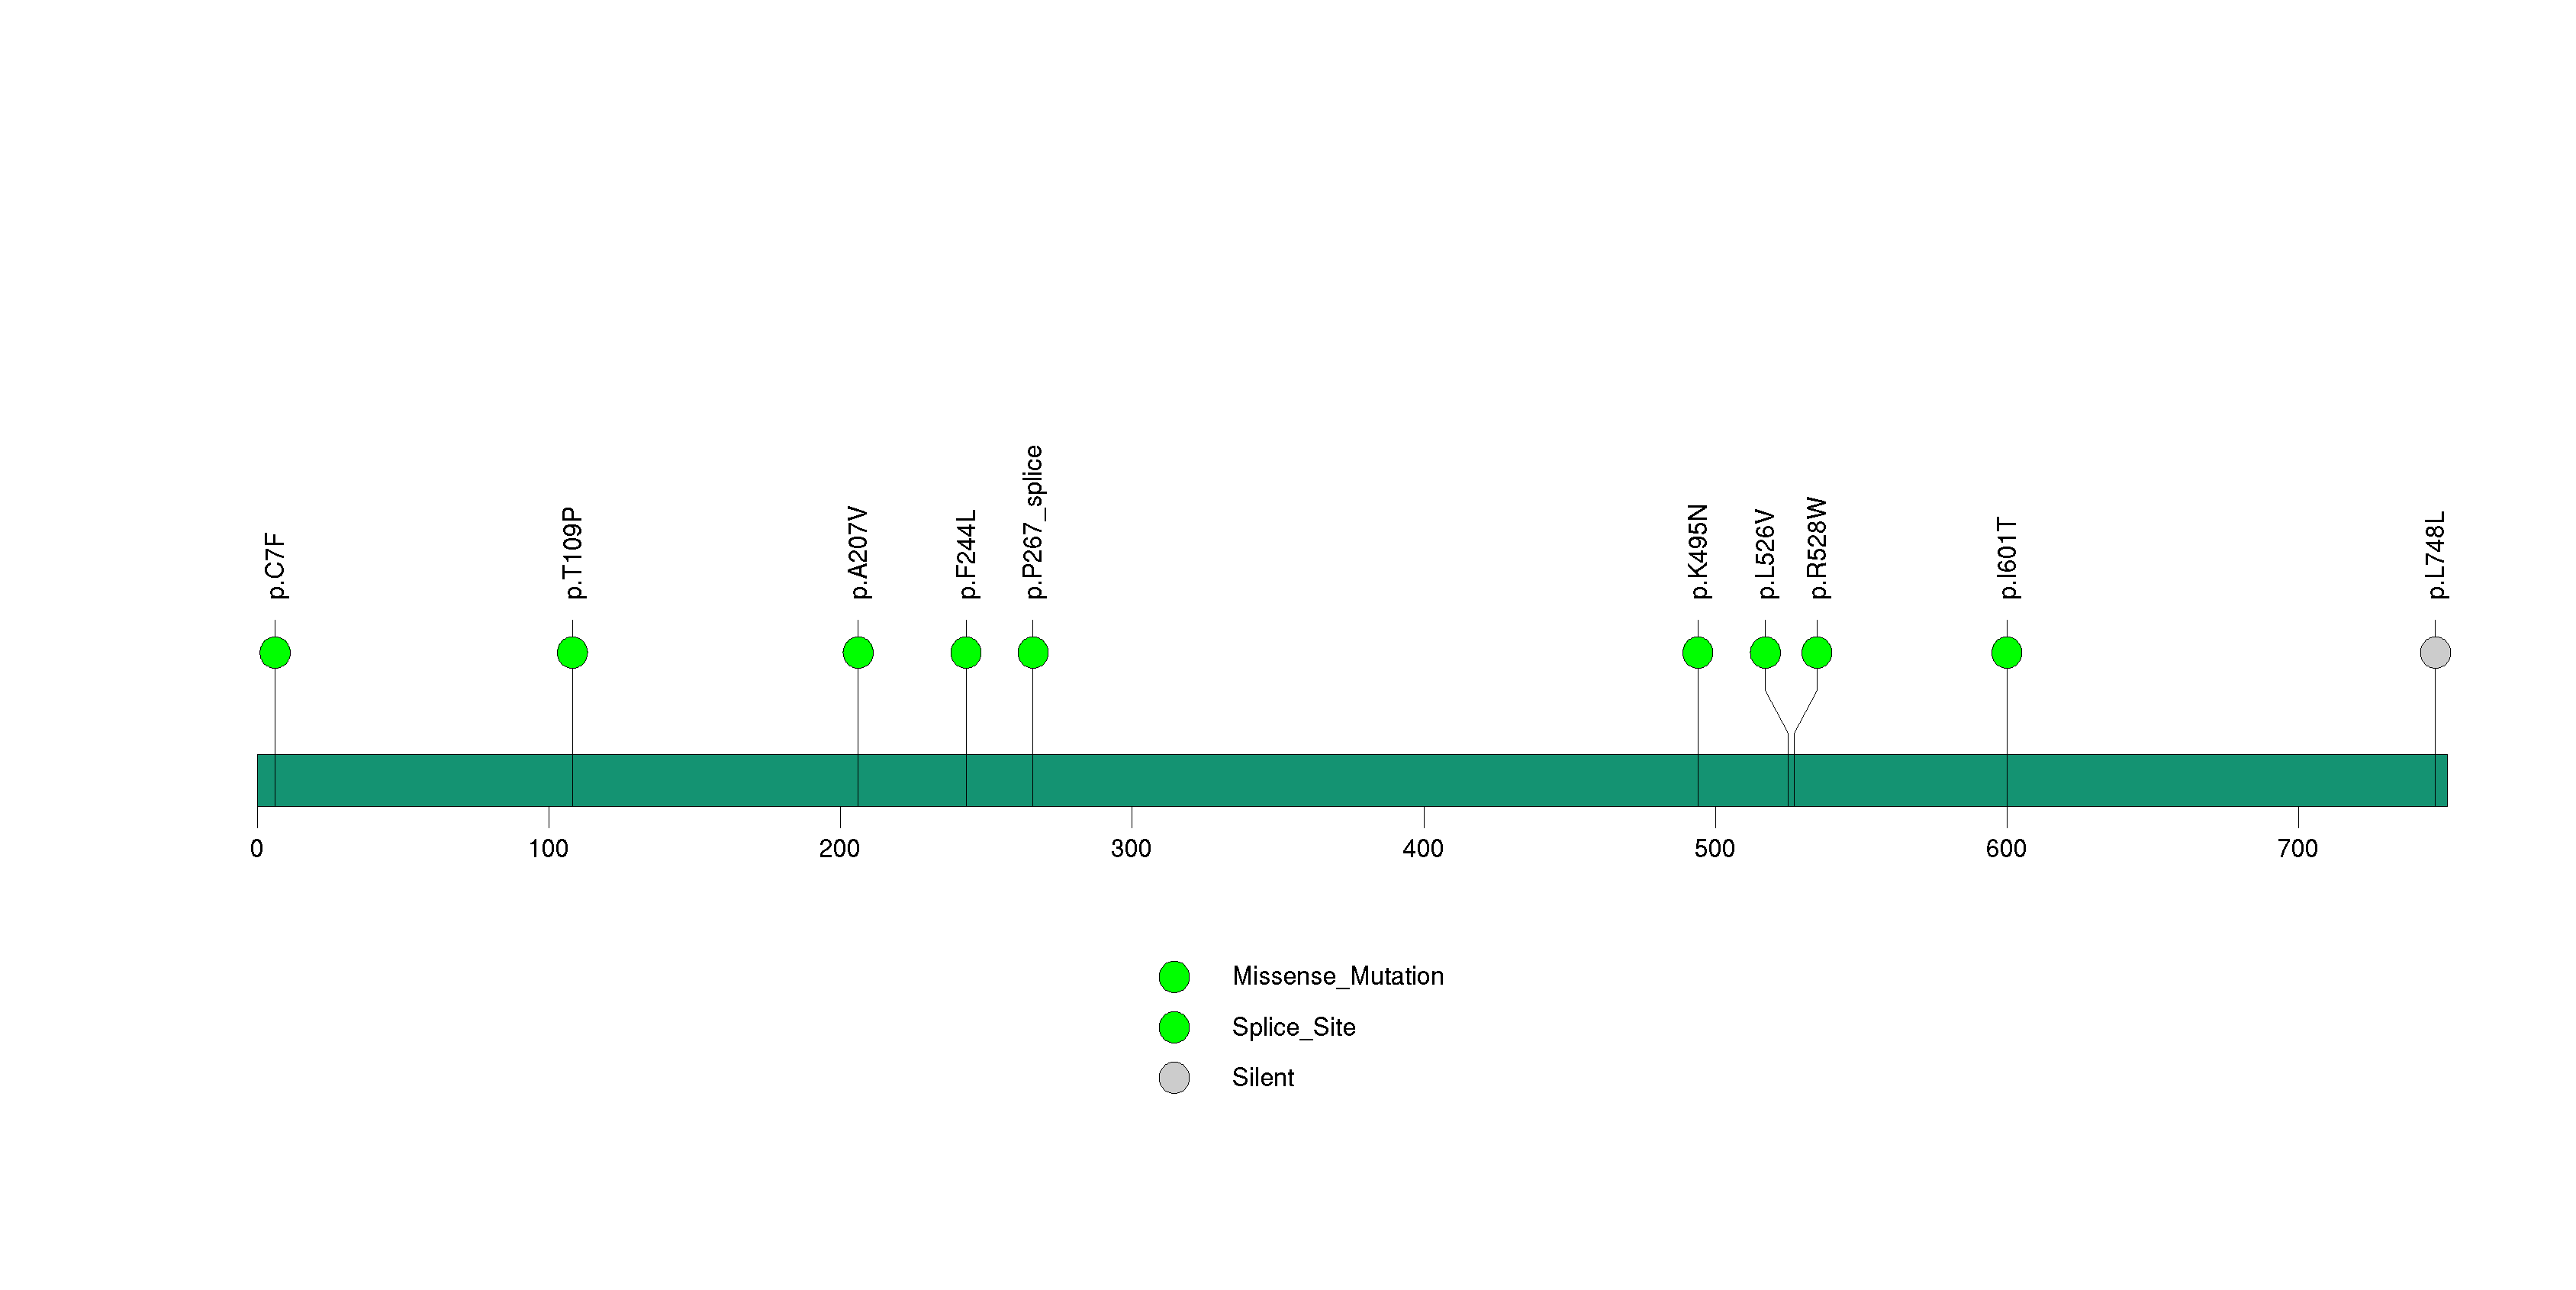
Figure S18. This figure depicts the distribution of mutations and mutation types across the OR8K3 significant gene.
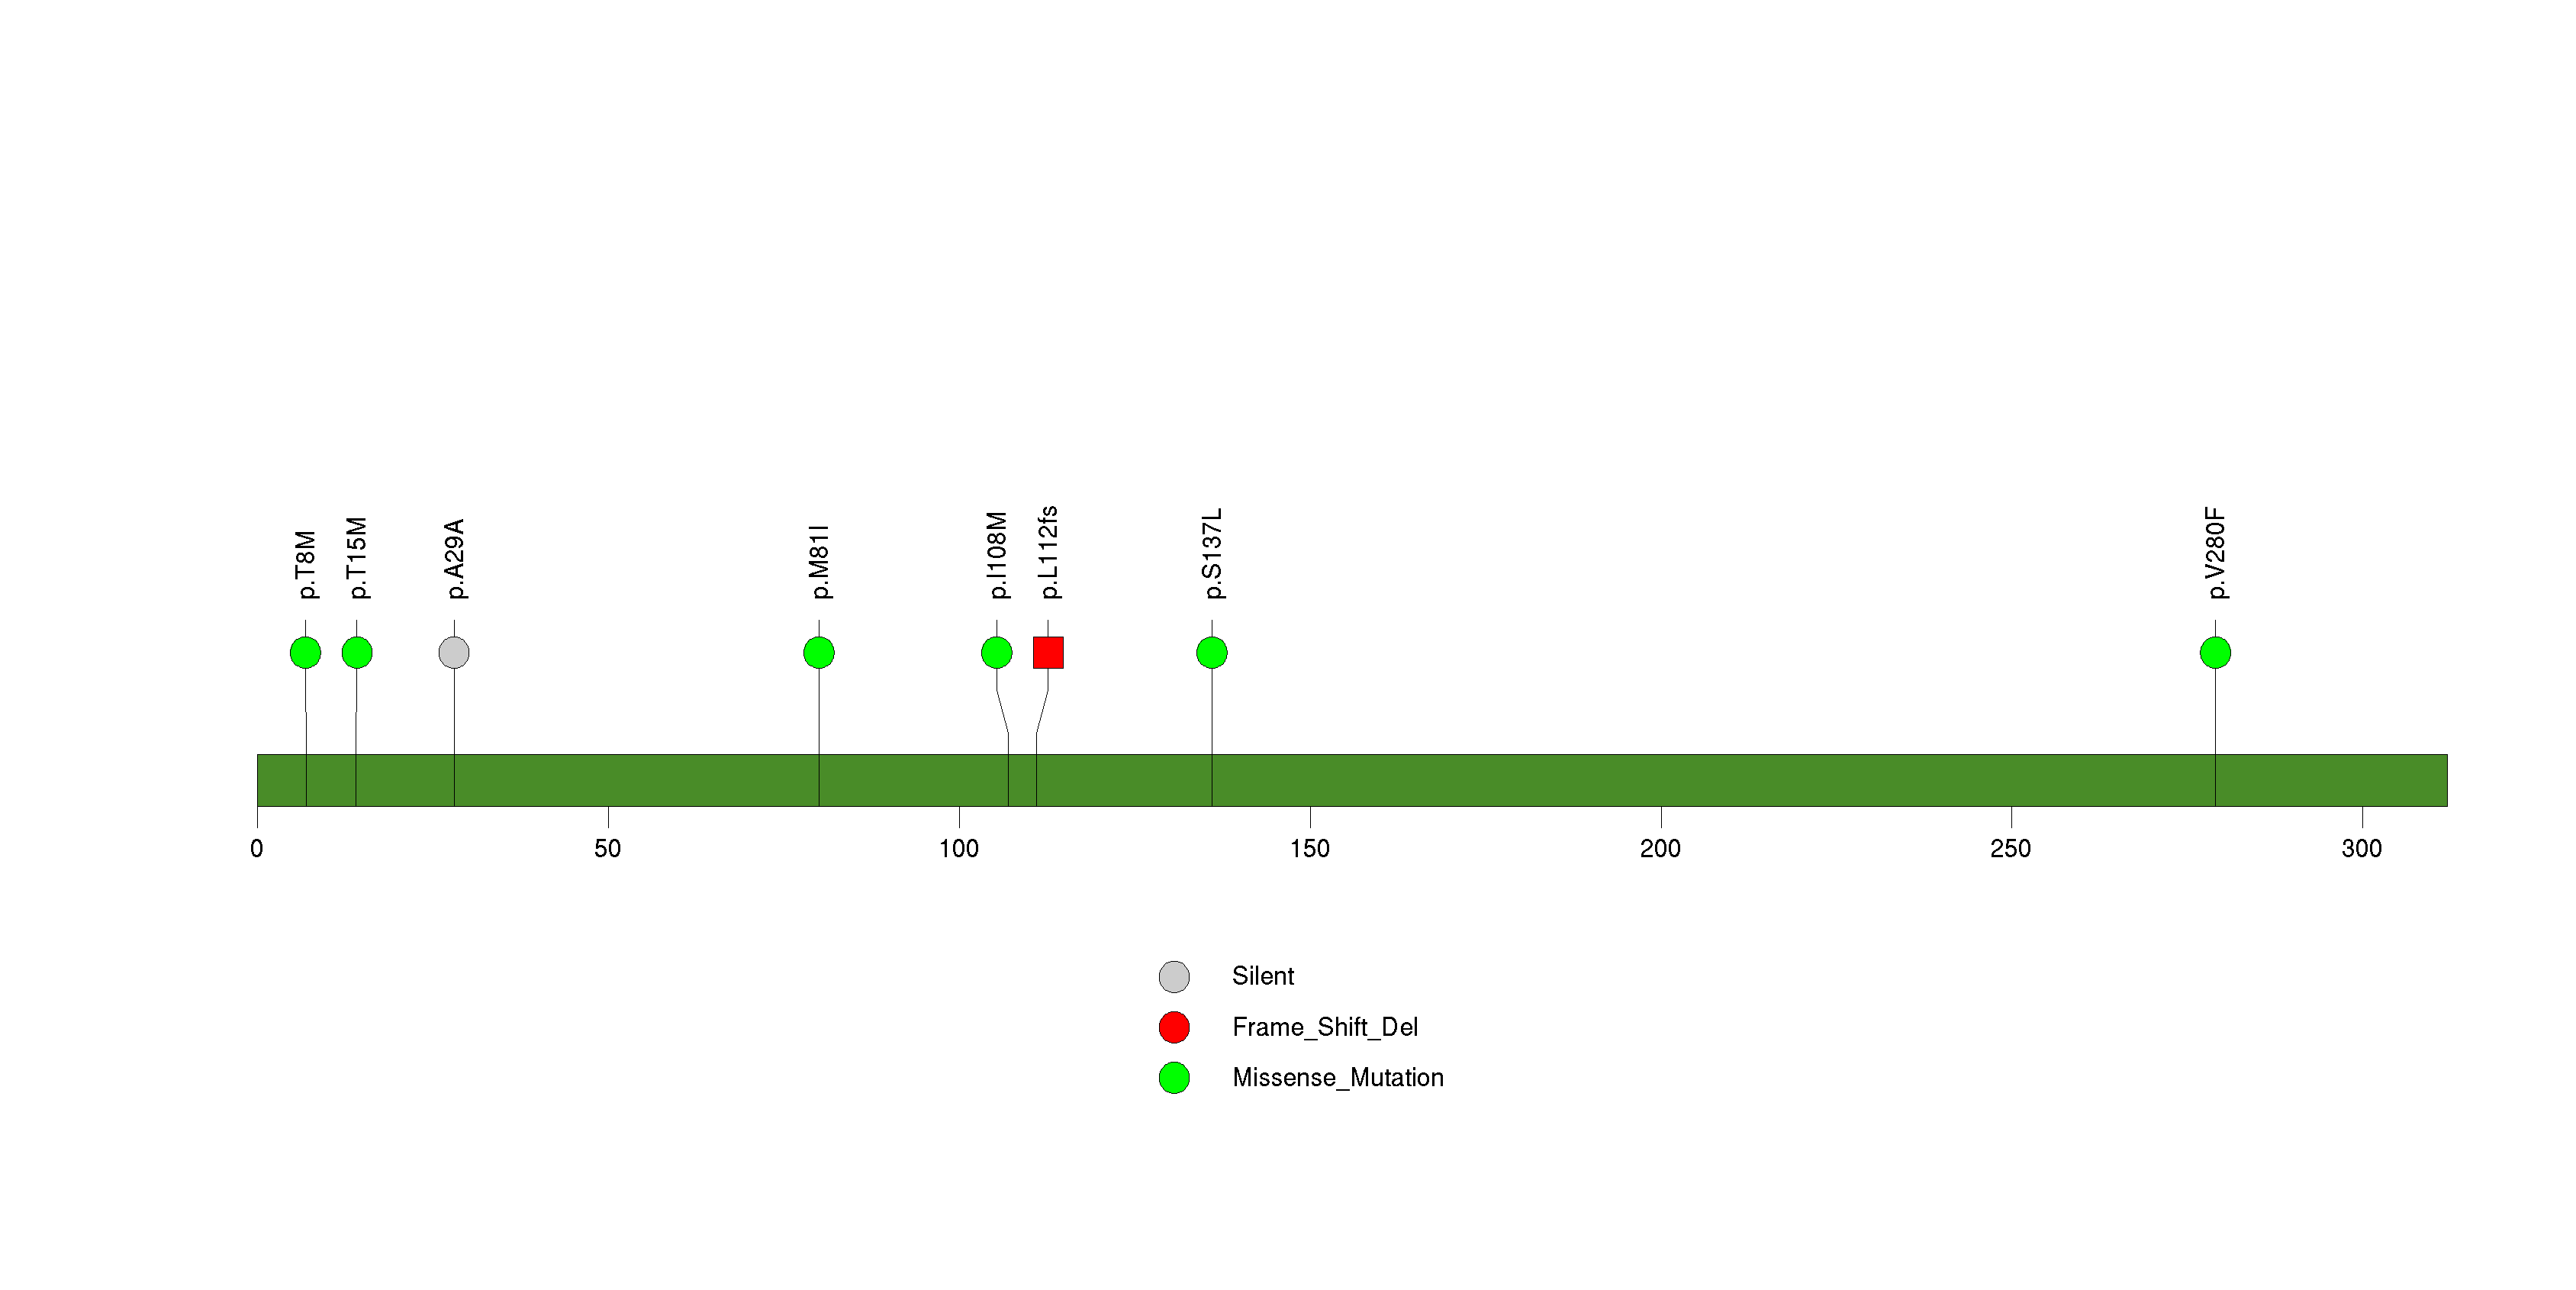
Figure S19. This figure depicts the distribution of mutations and mutation types across the RYR2 significant gene.
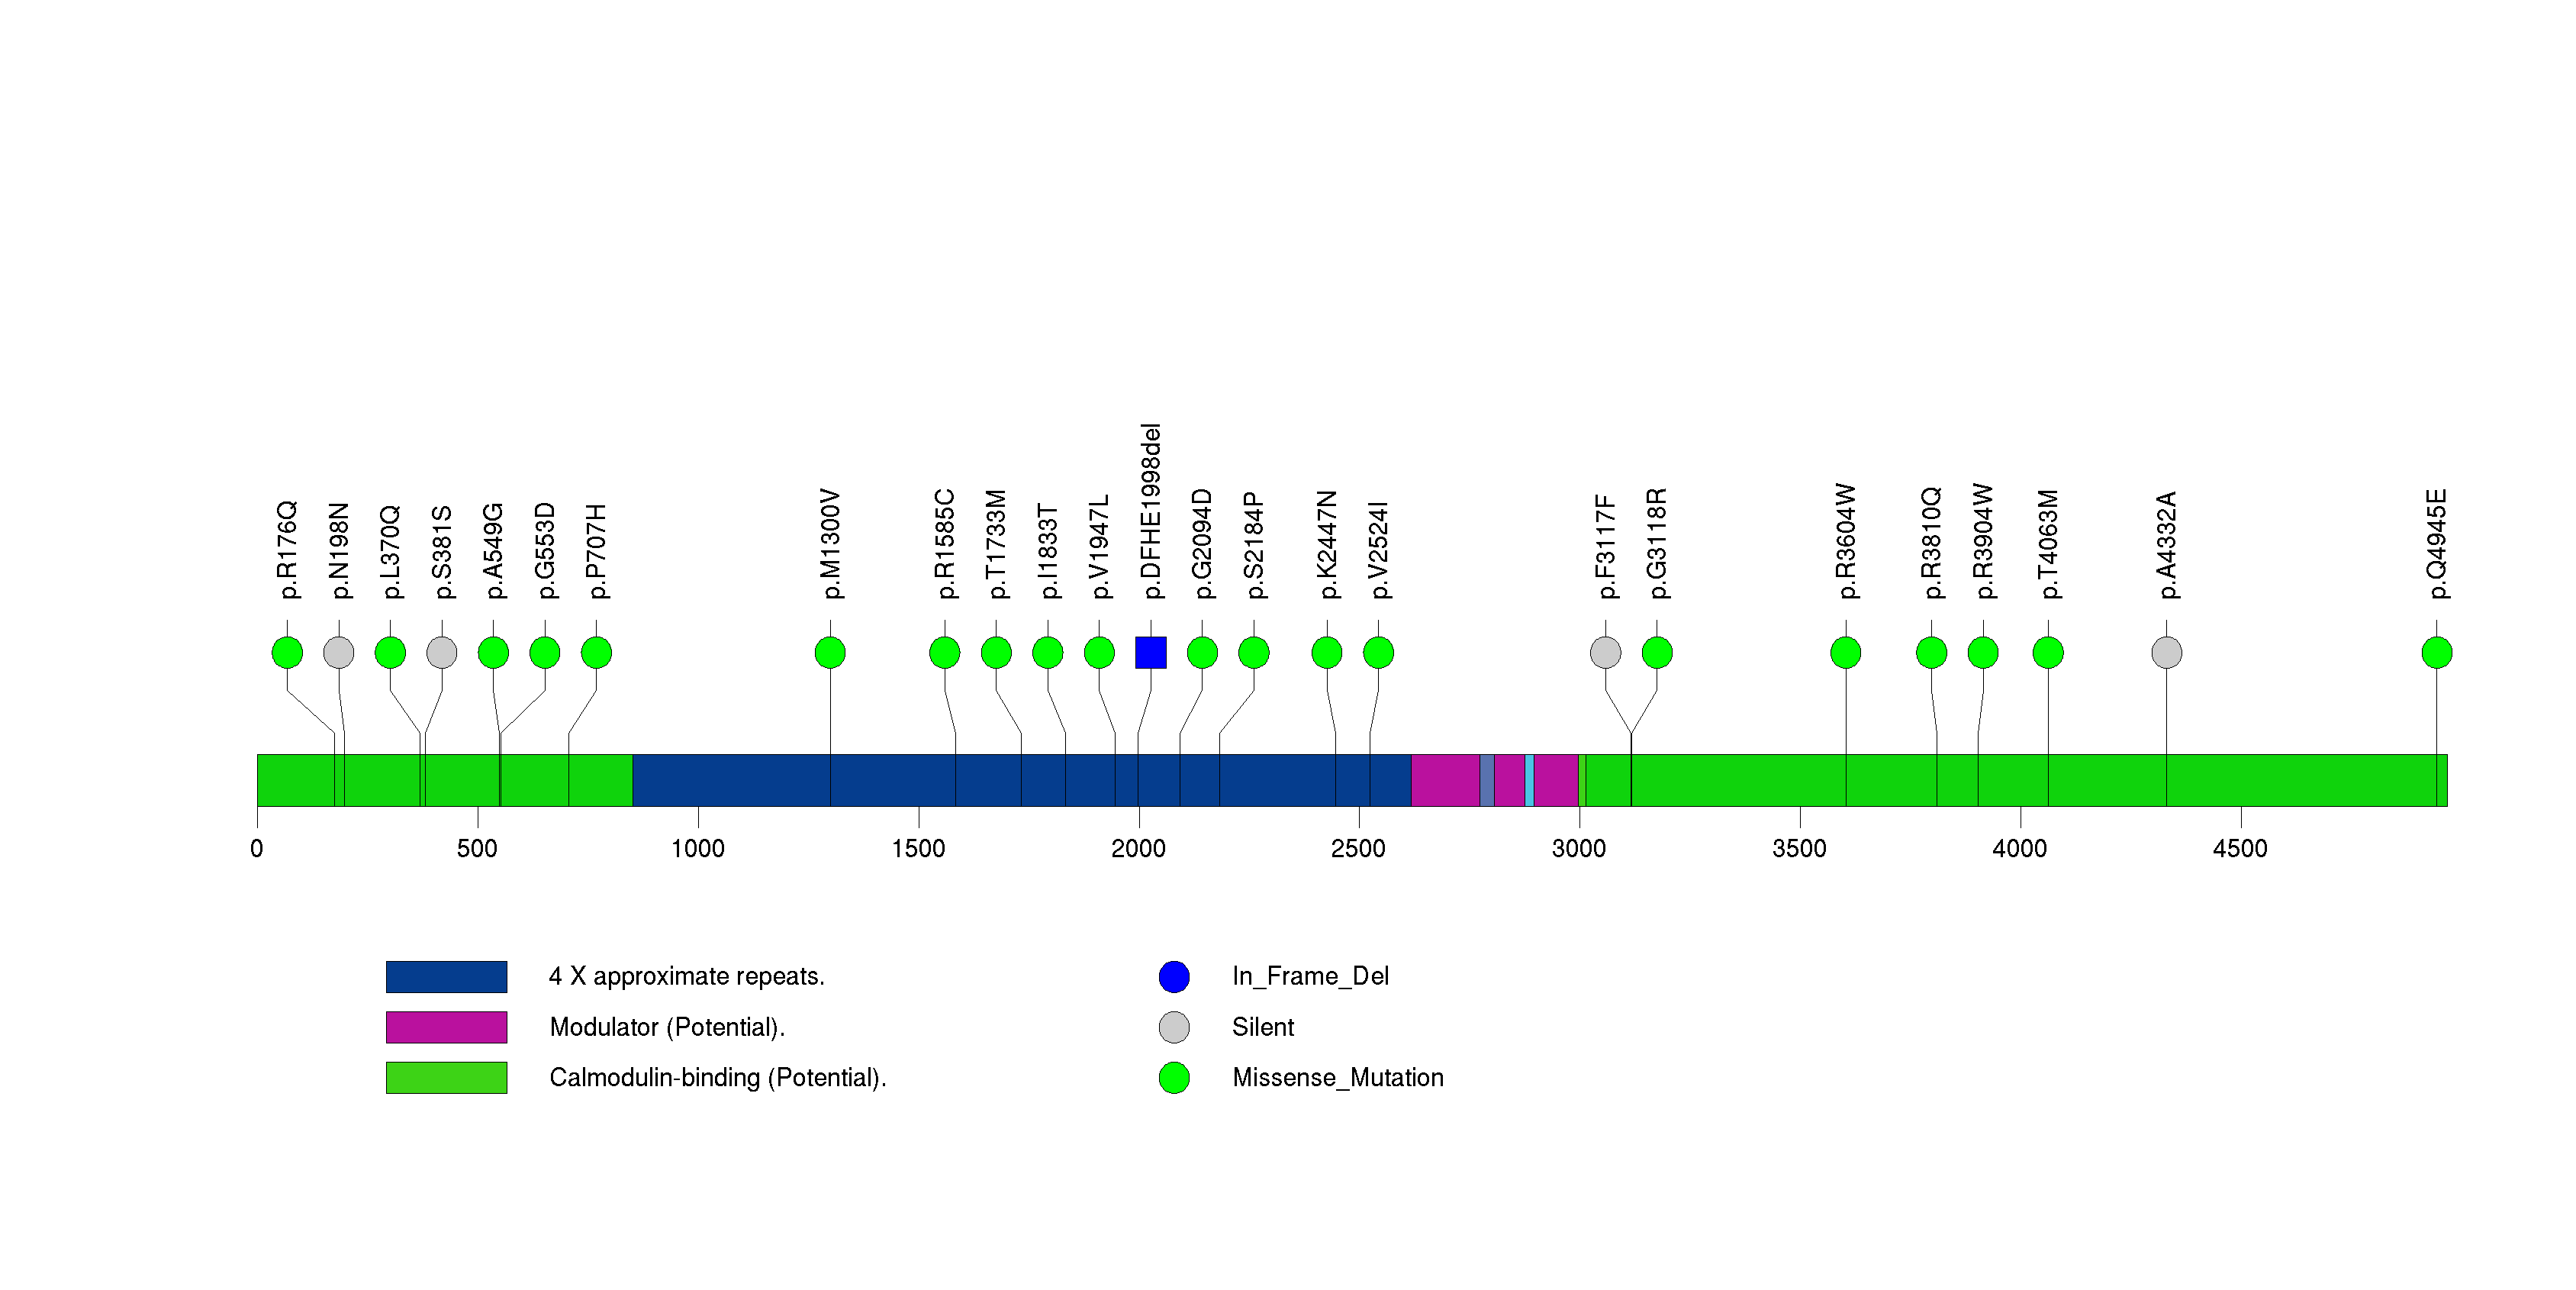
Figure S20. This figure depicts the distribution of mutations and mutation types across the TPTE2 significant gene.
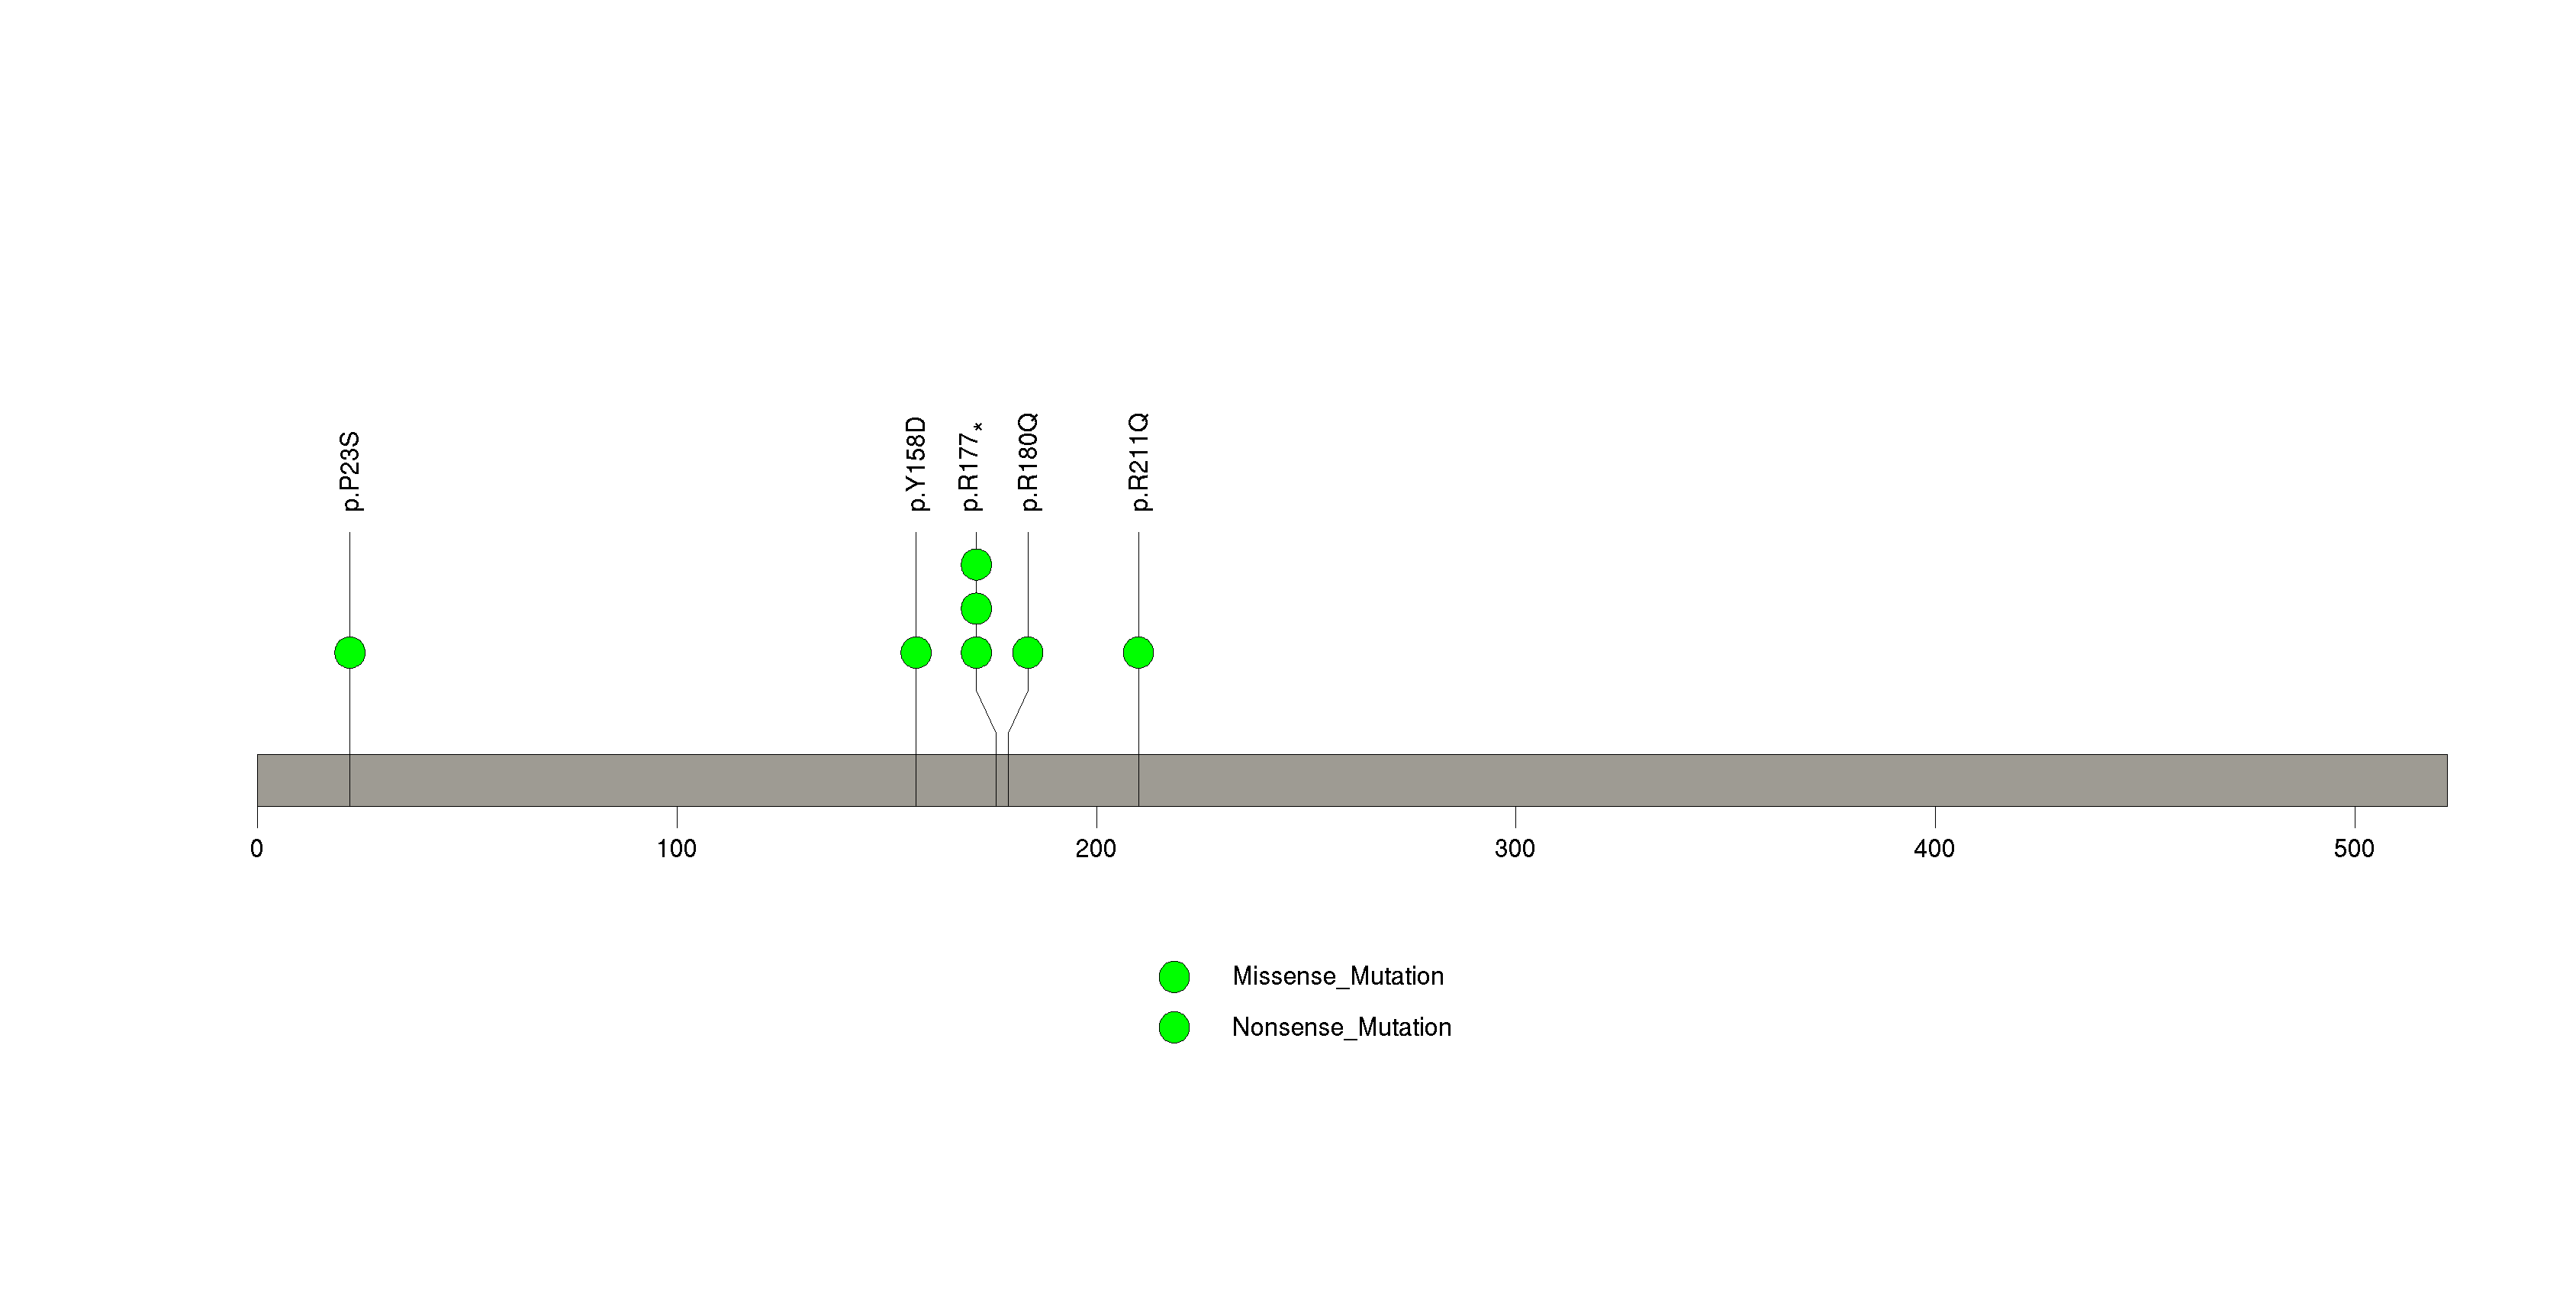
Figure S21. This figure depicts the distribution of mutations and mutation types across the LZTR1 significant gene.
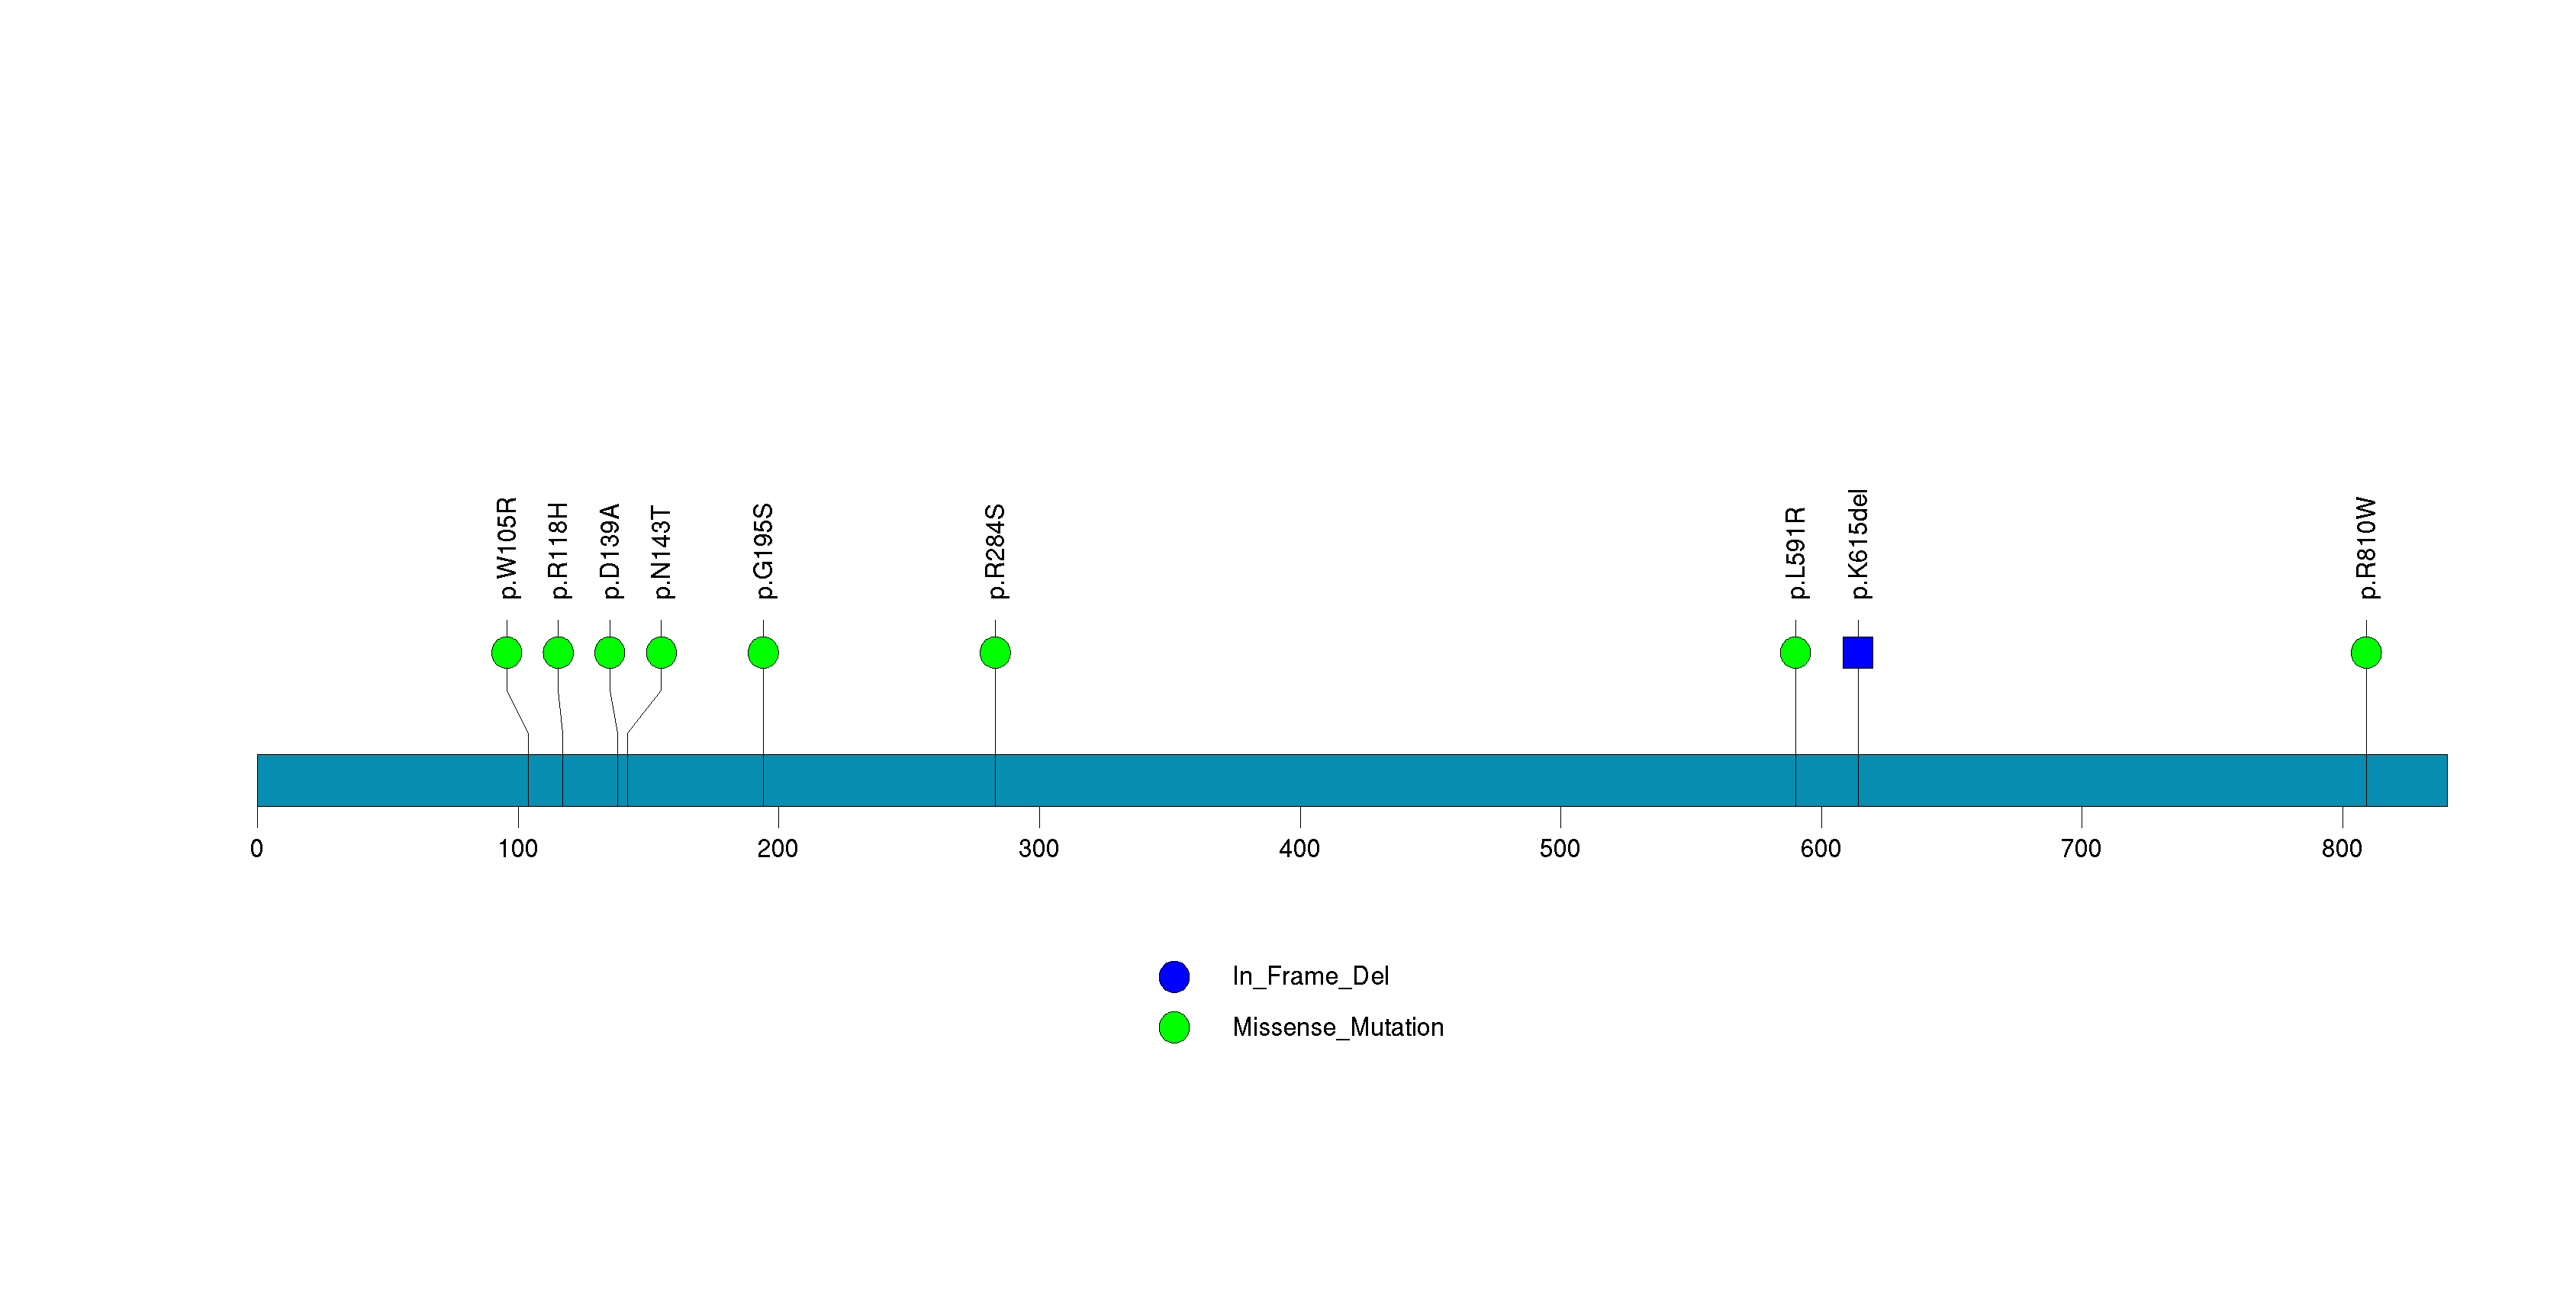
Figure S22. This figure depicts the distribution of mutations and mutation types across the DCAF12L2 significant gene.
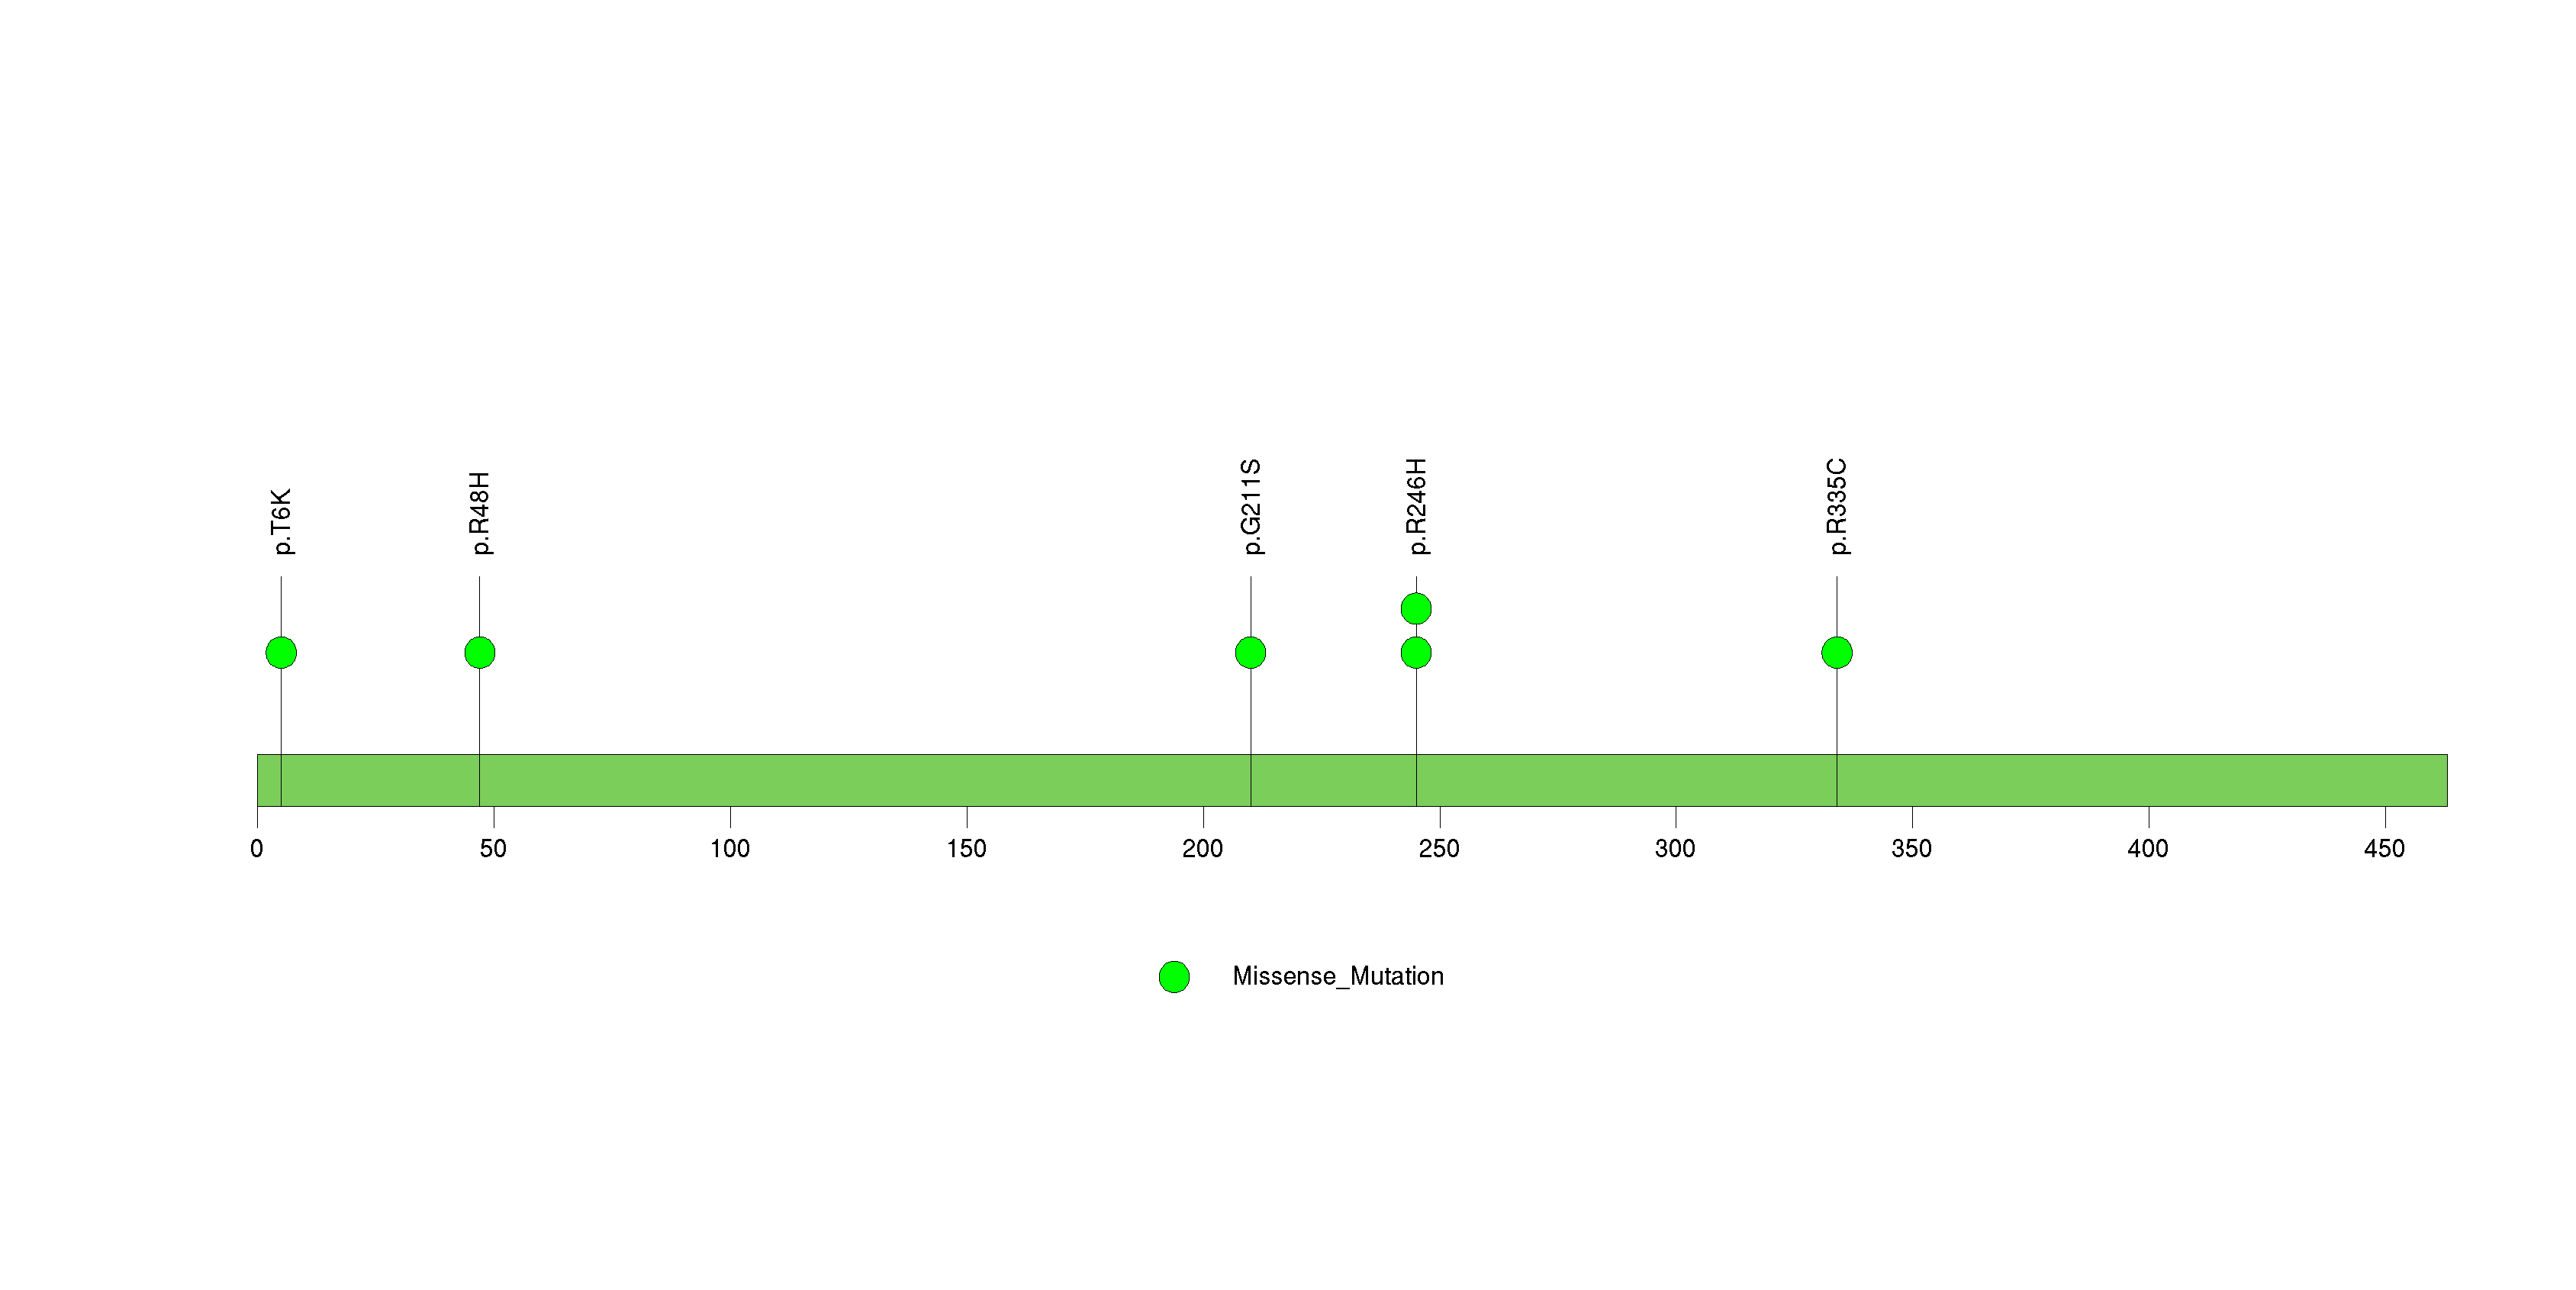
Figure S23. This figure depicts the distribution of mutations and mutation types across the RIMS2 significant gene.
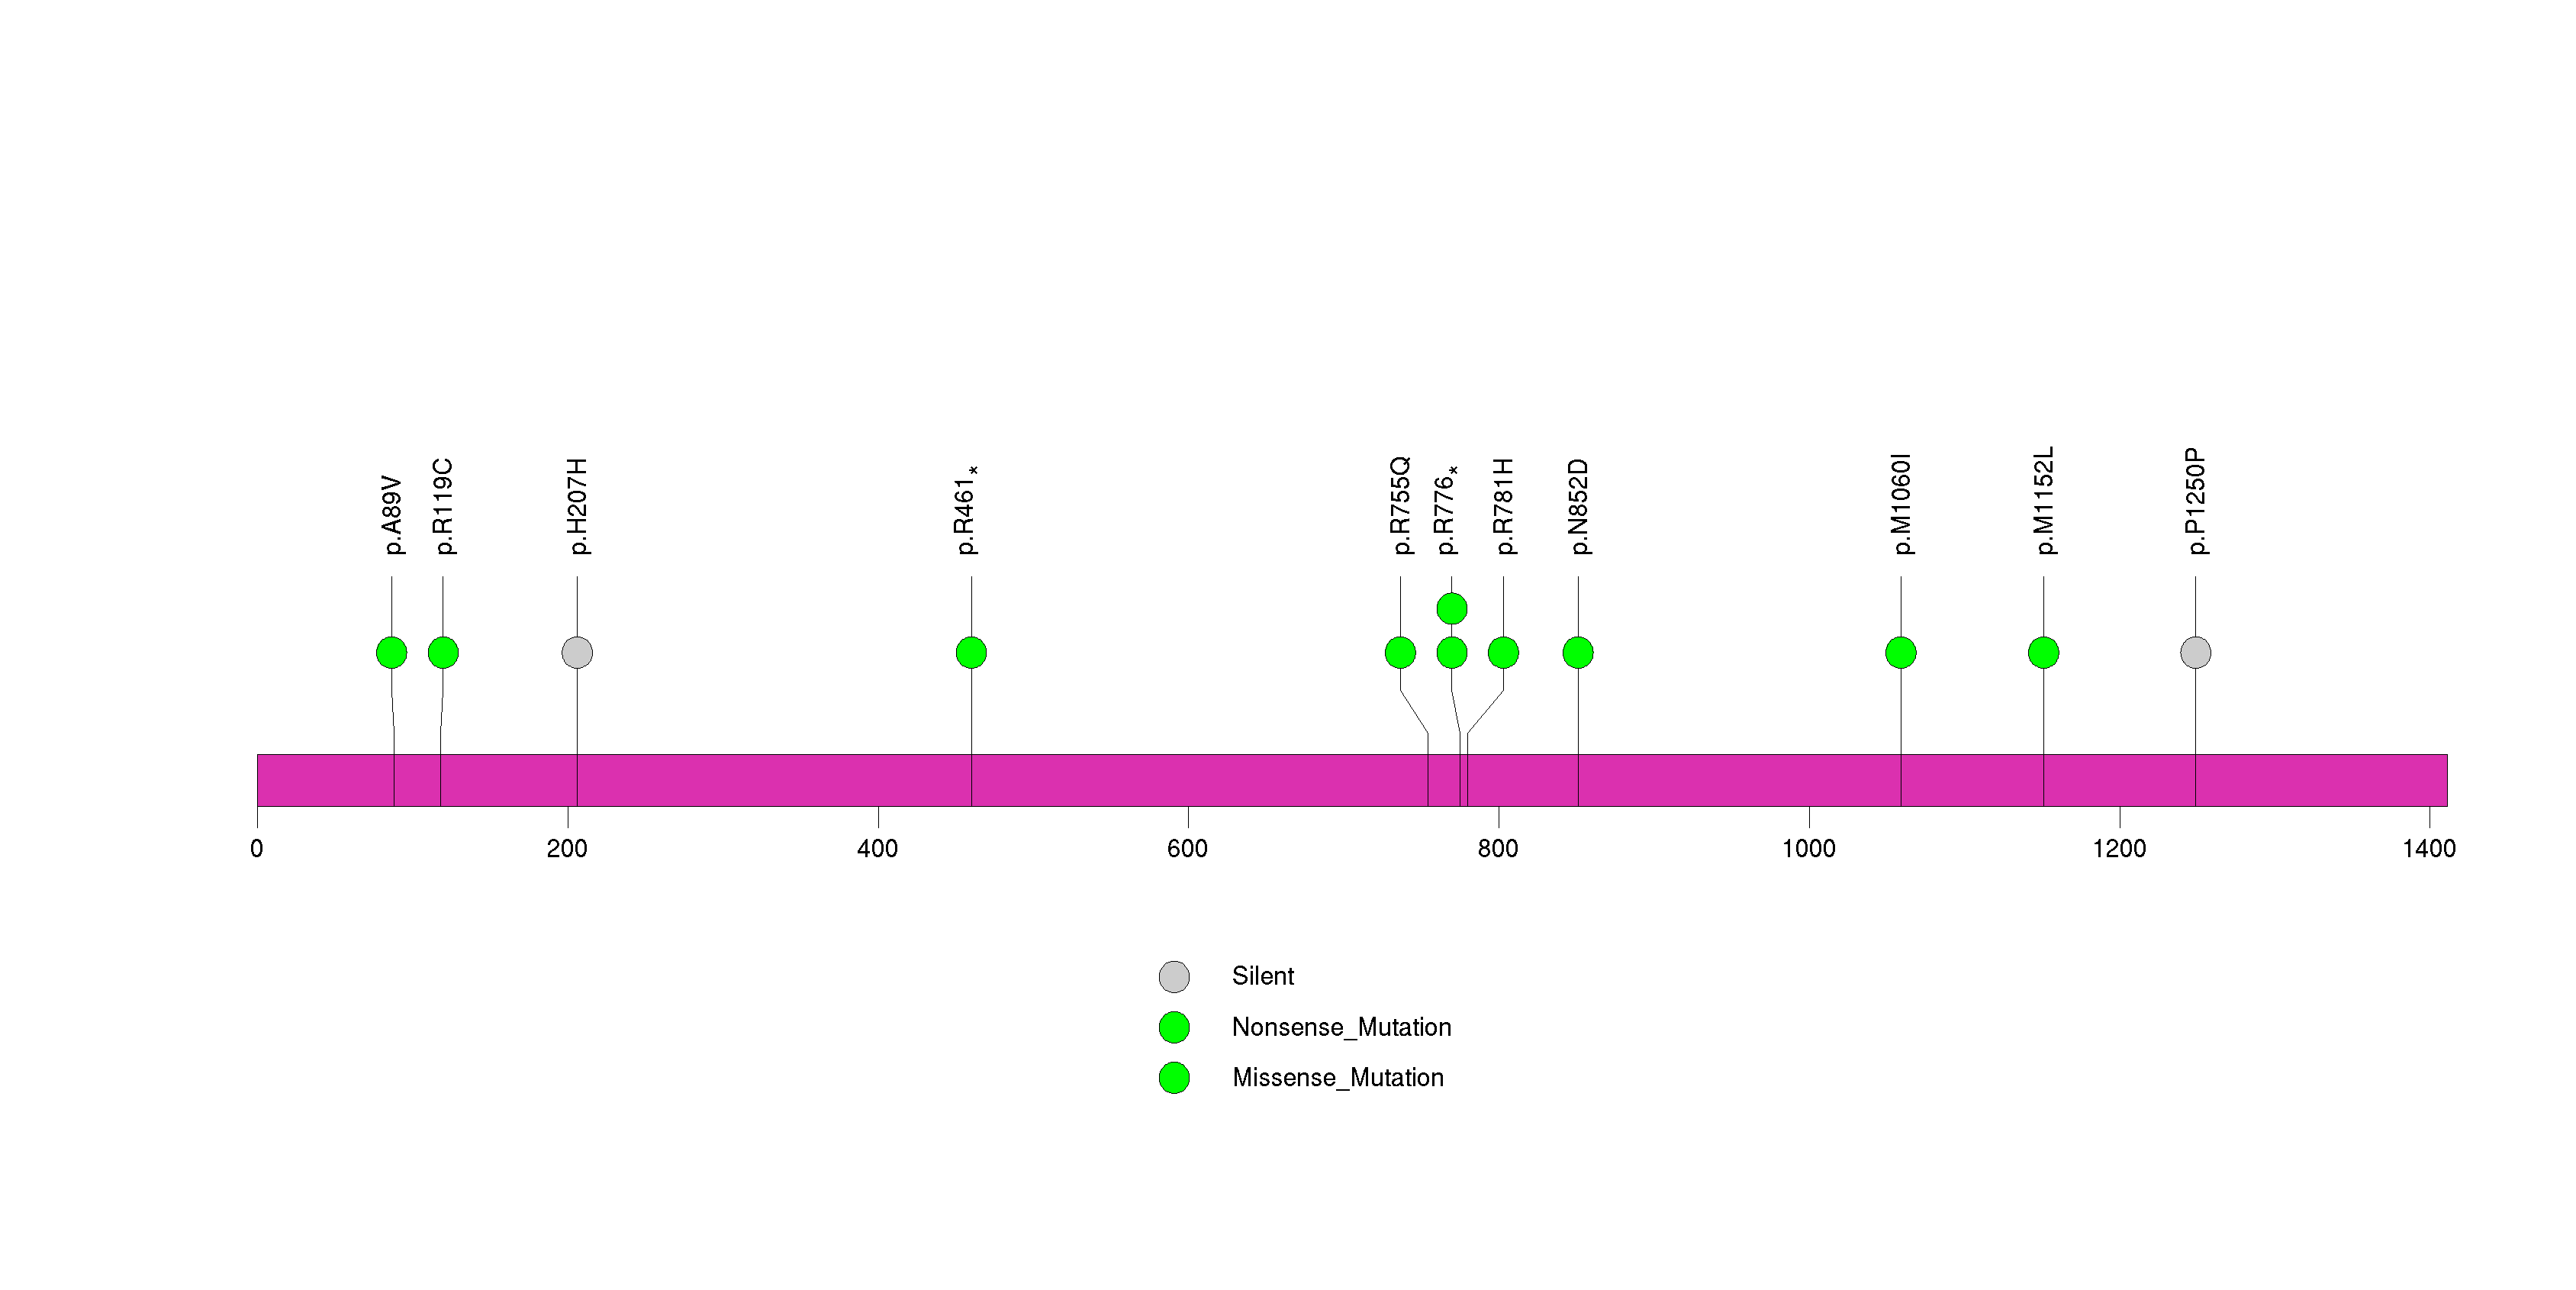
Figure S24. This figure depicts the distribution of mutations and mutation types across the PSPH significant gene.
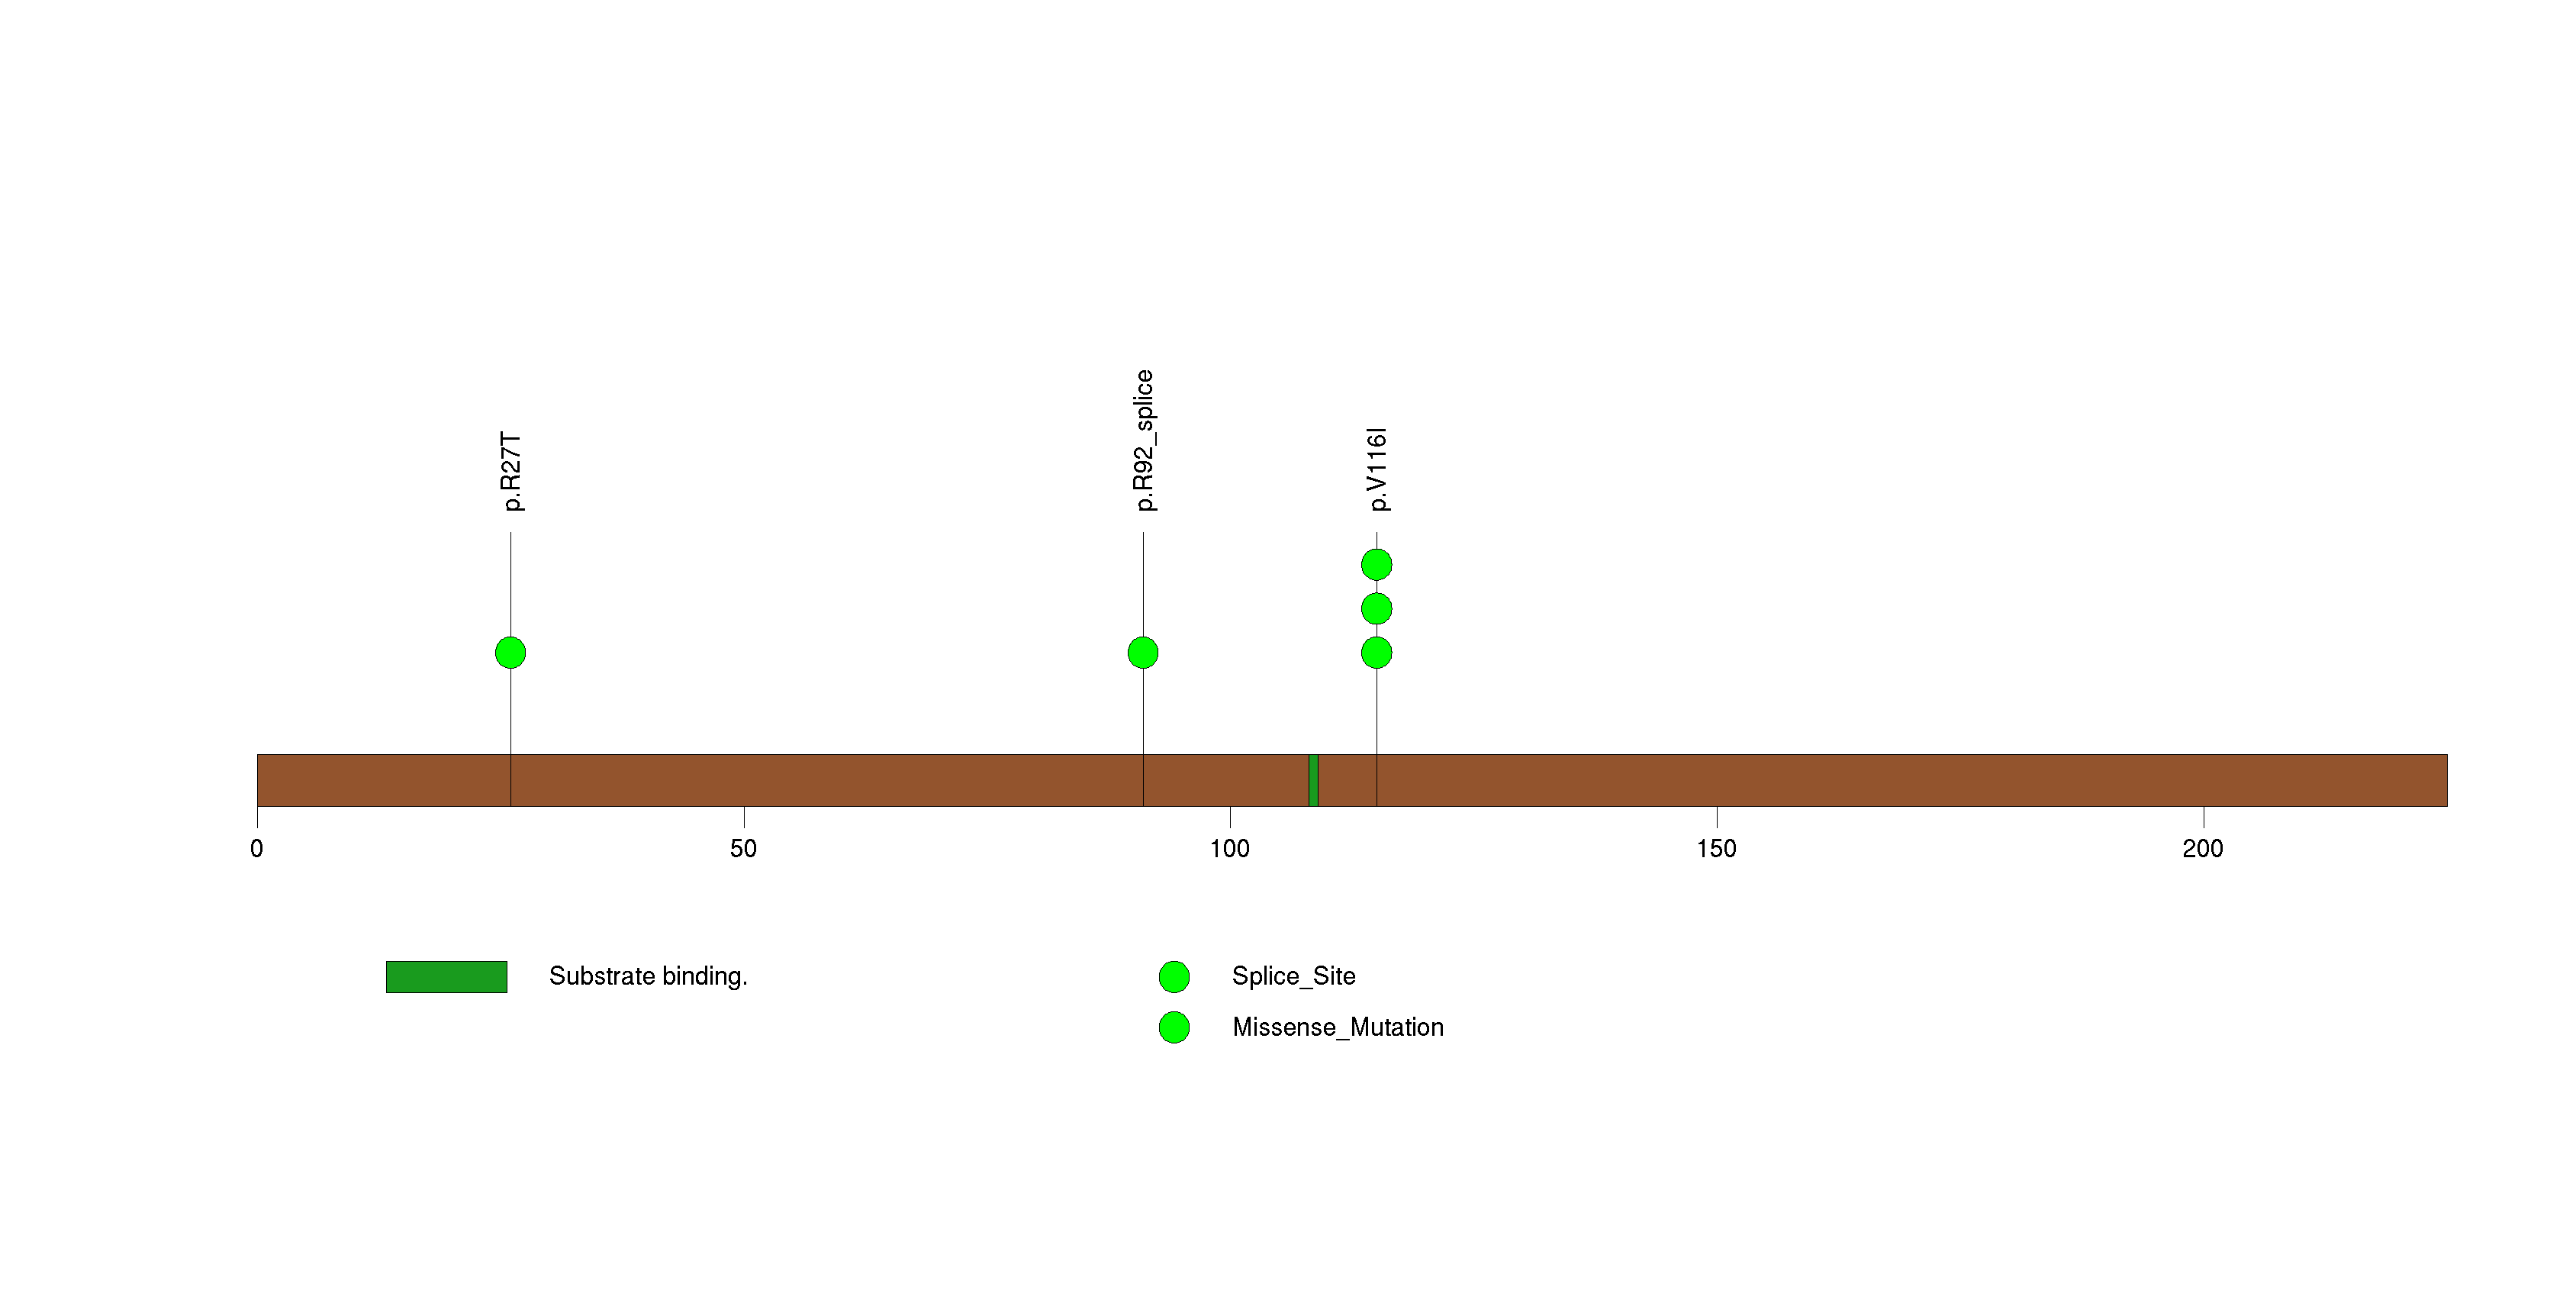
Figure S25. This figure depicts the distribution of mutations and mutation types across the PDGFRA significant gene.
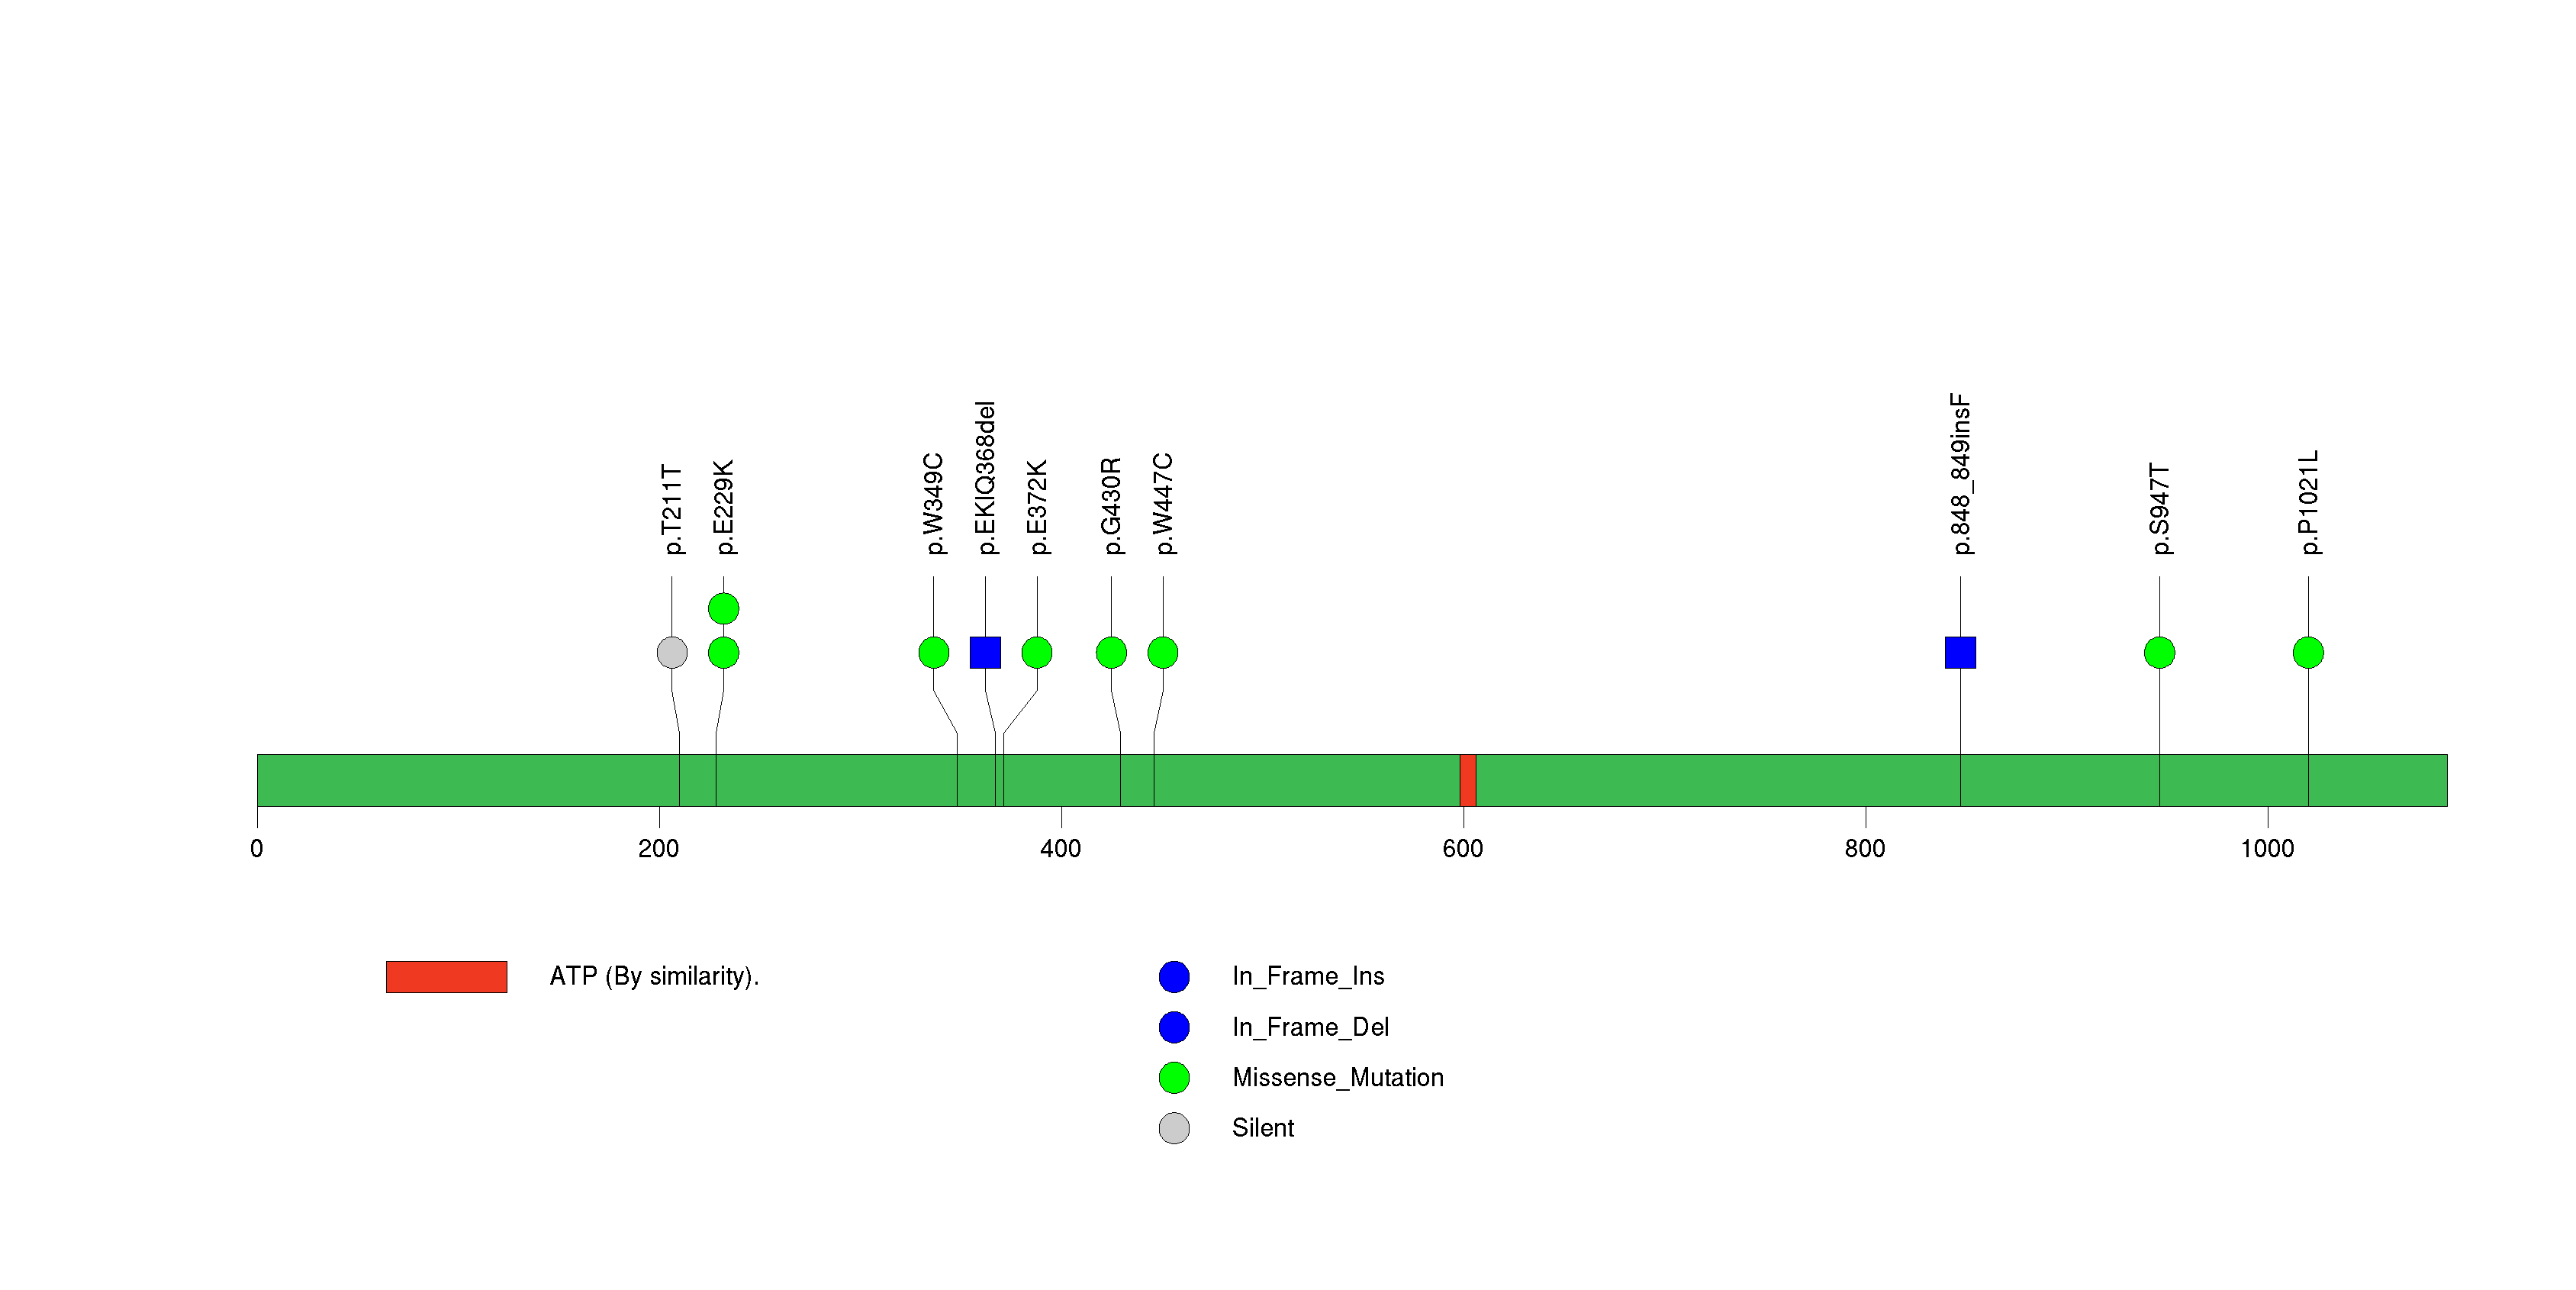
Figure S26. This figure depicts the distribution of mutations and mutation types across the SPRYD5 significant gene.
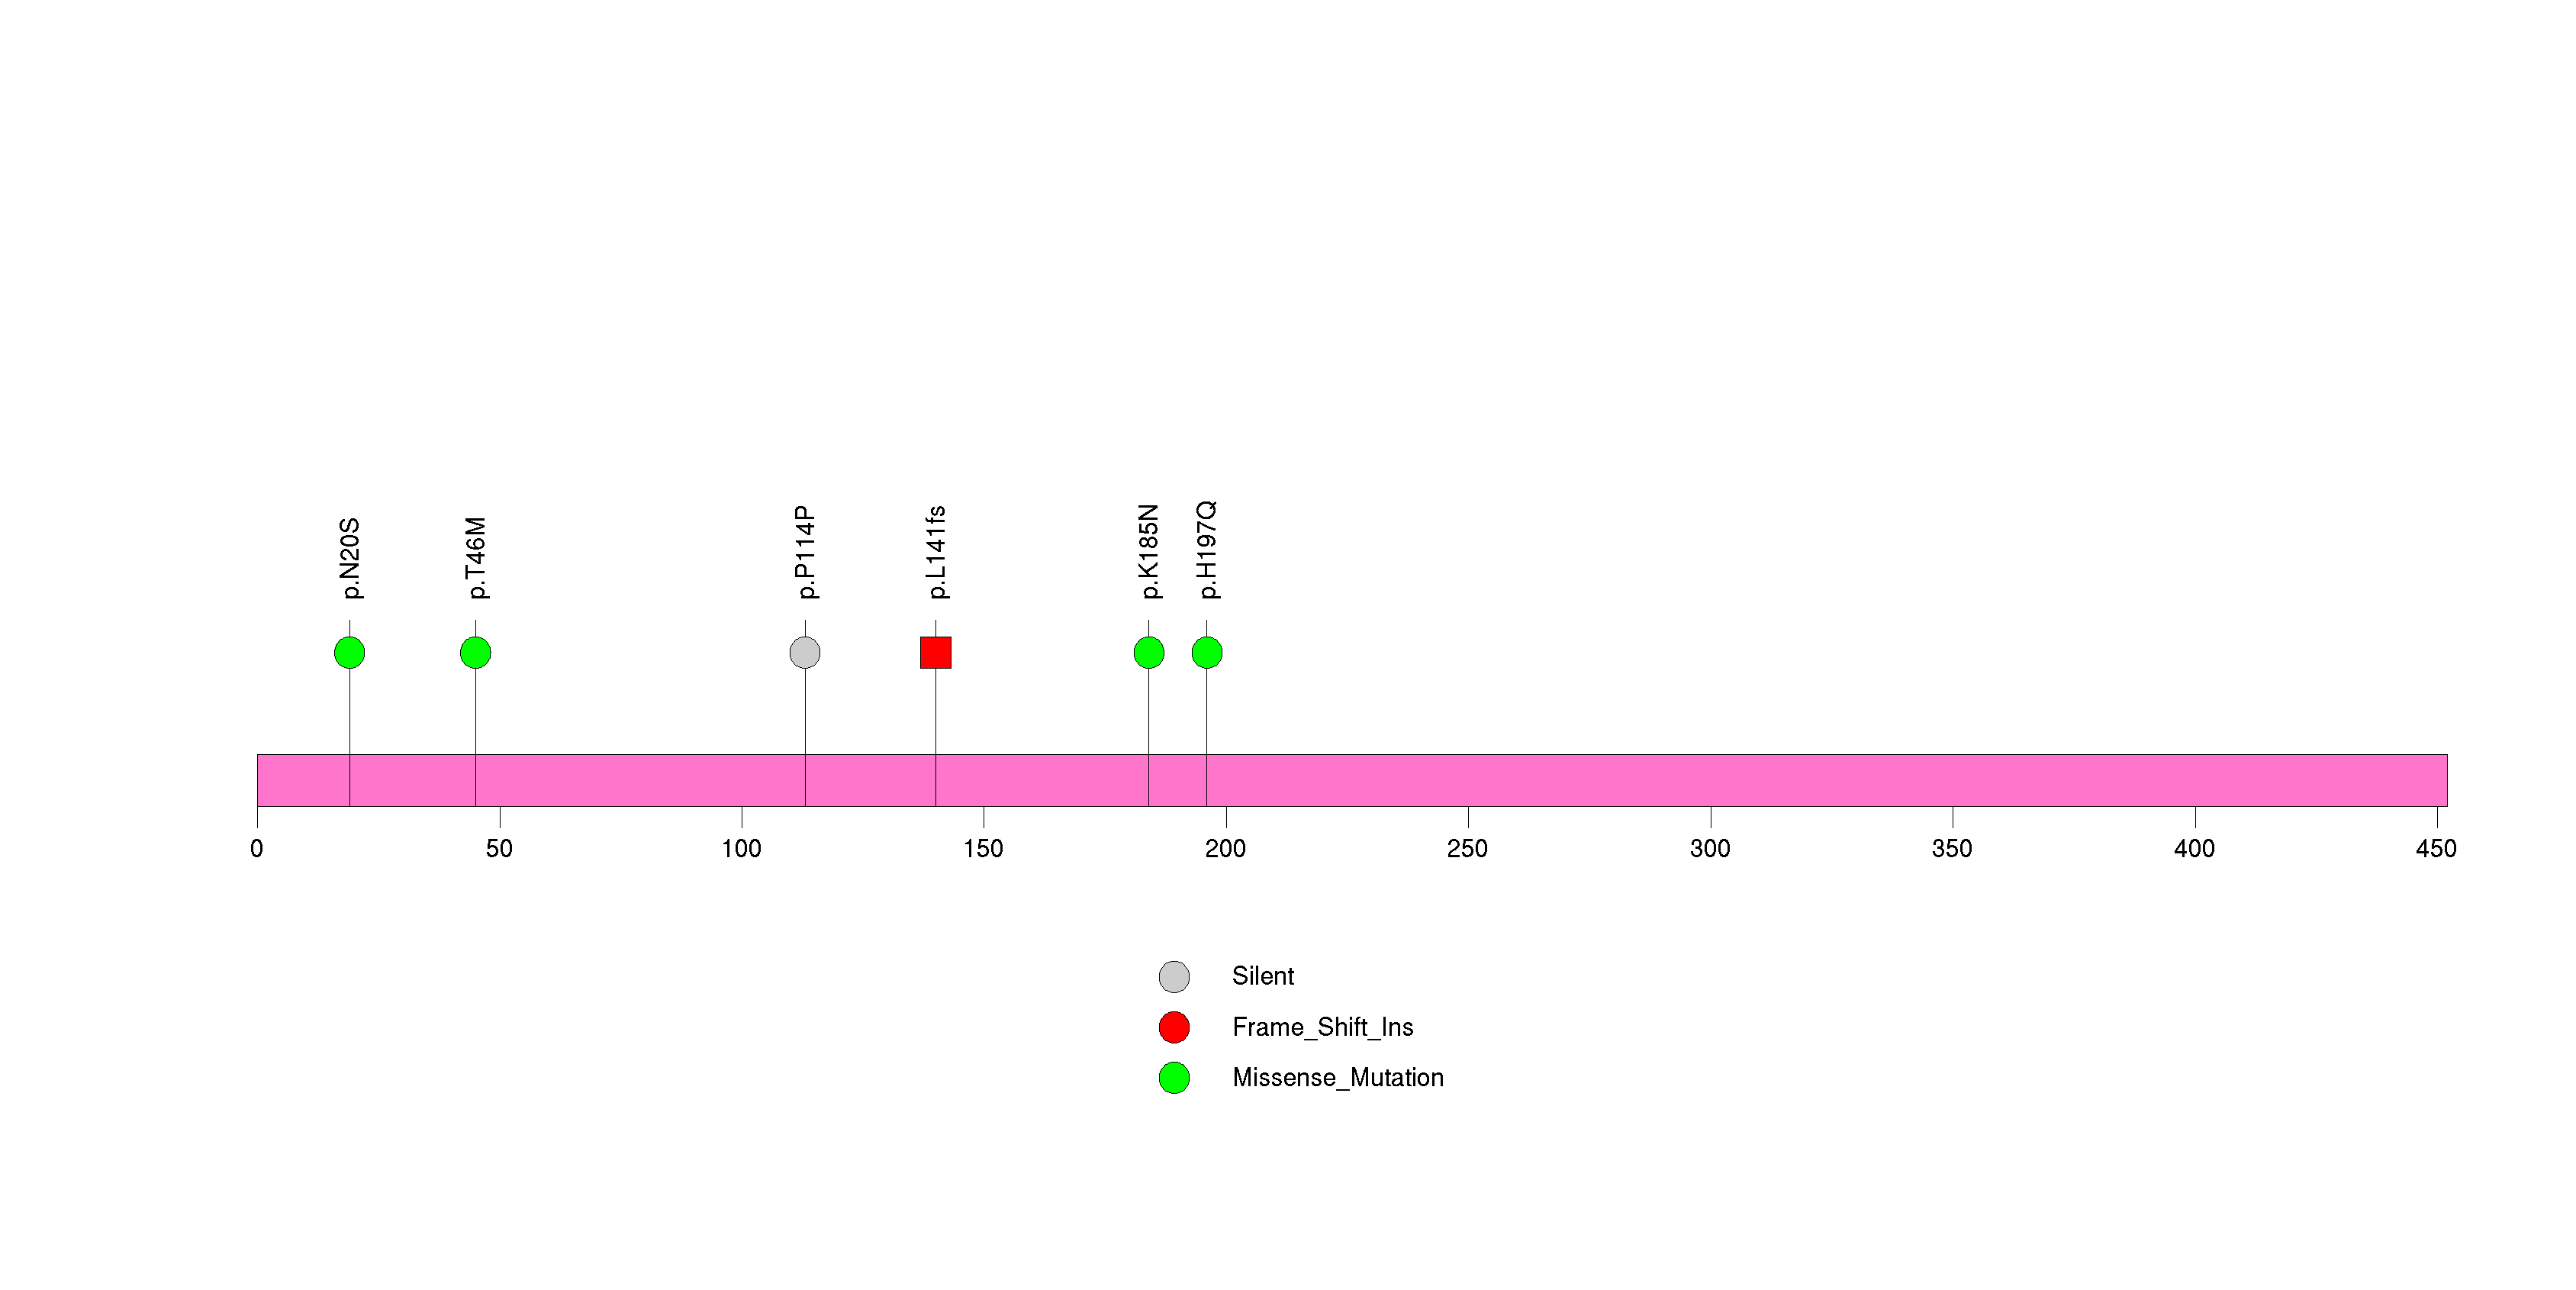
Figure S27. This figure depicts the distribution of mutations and mutation types across the LRFN5 significant gene.
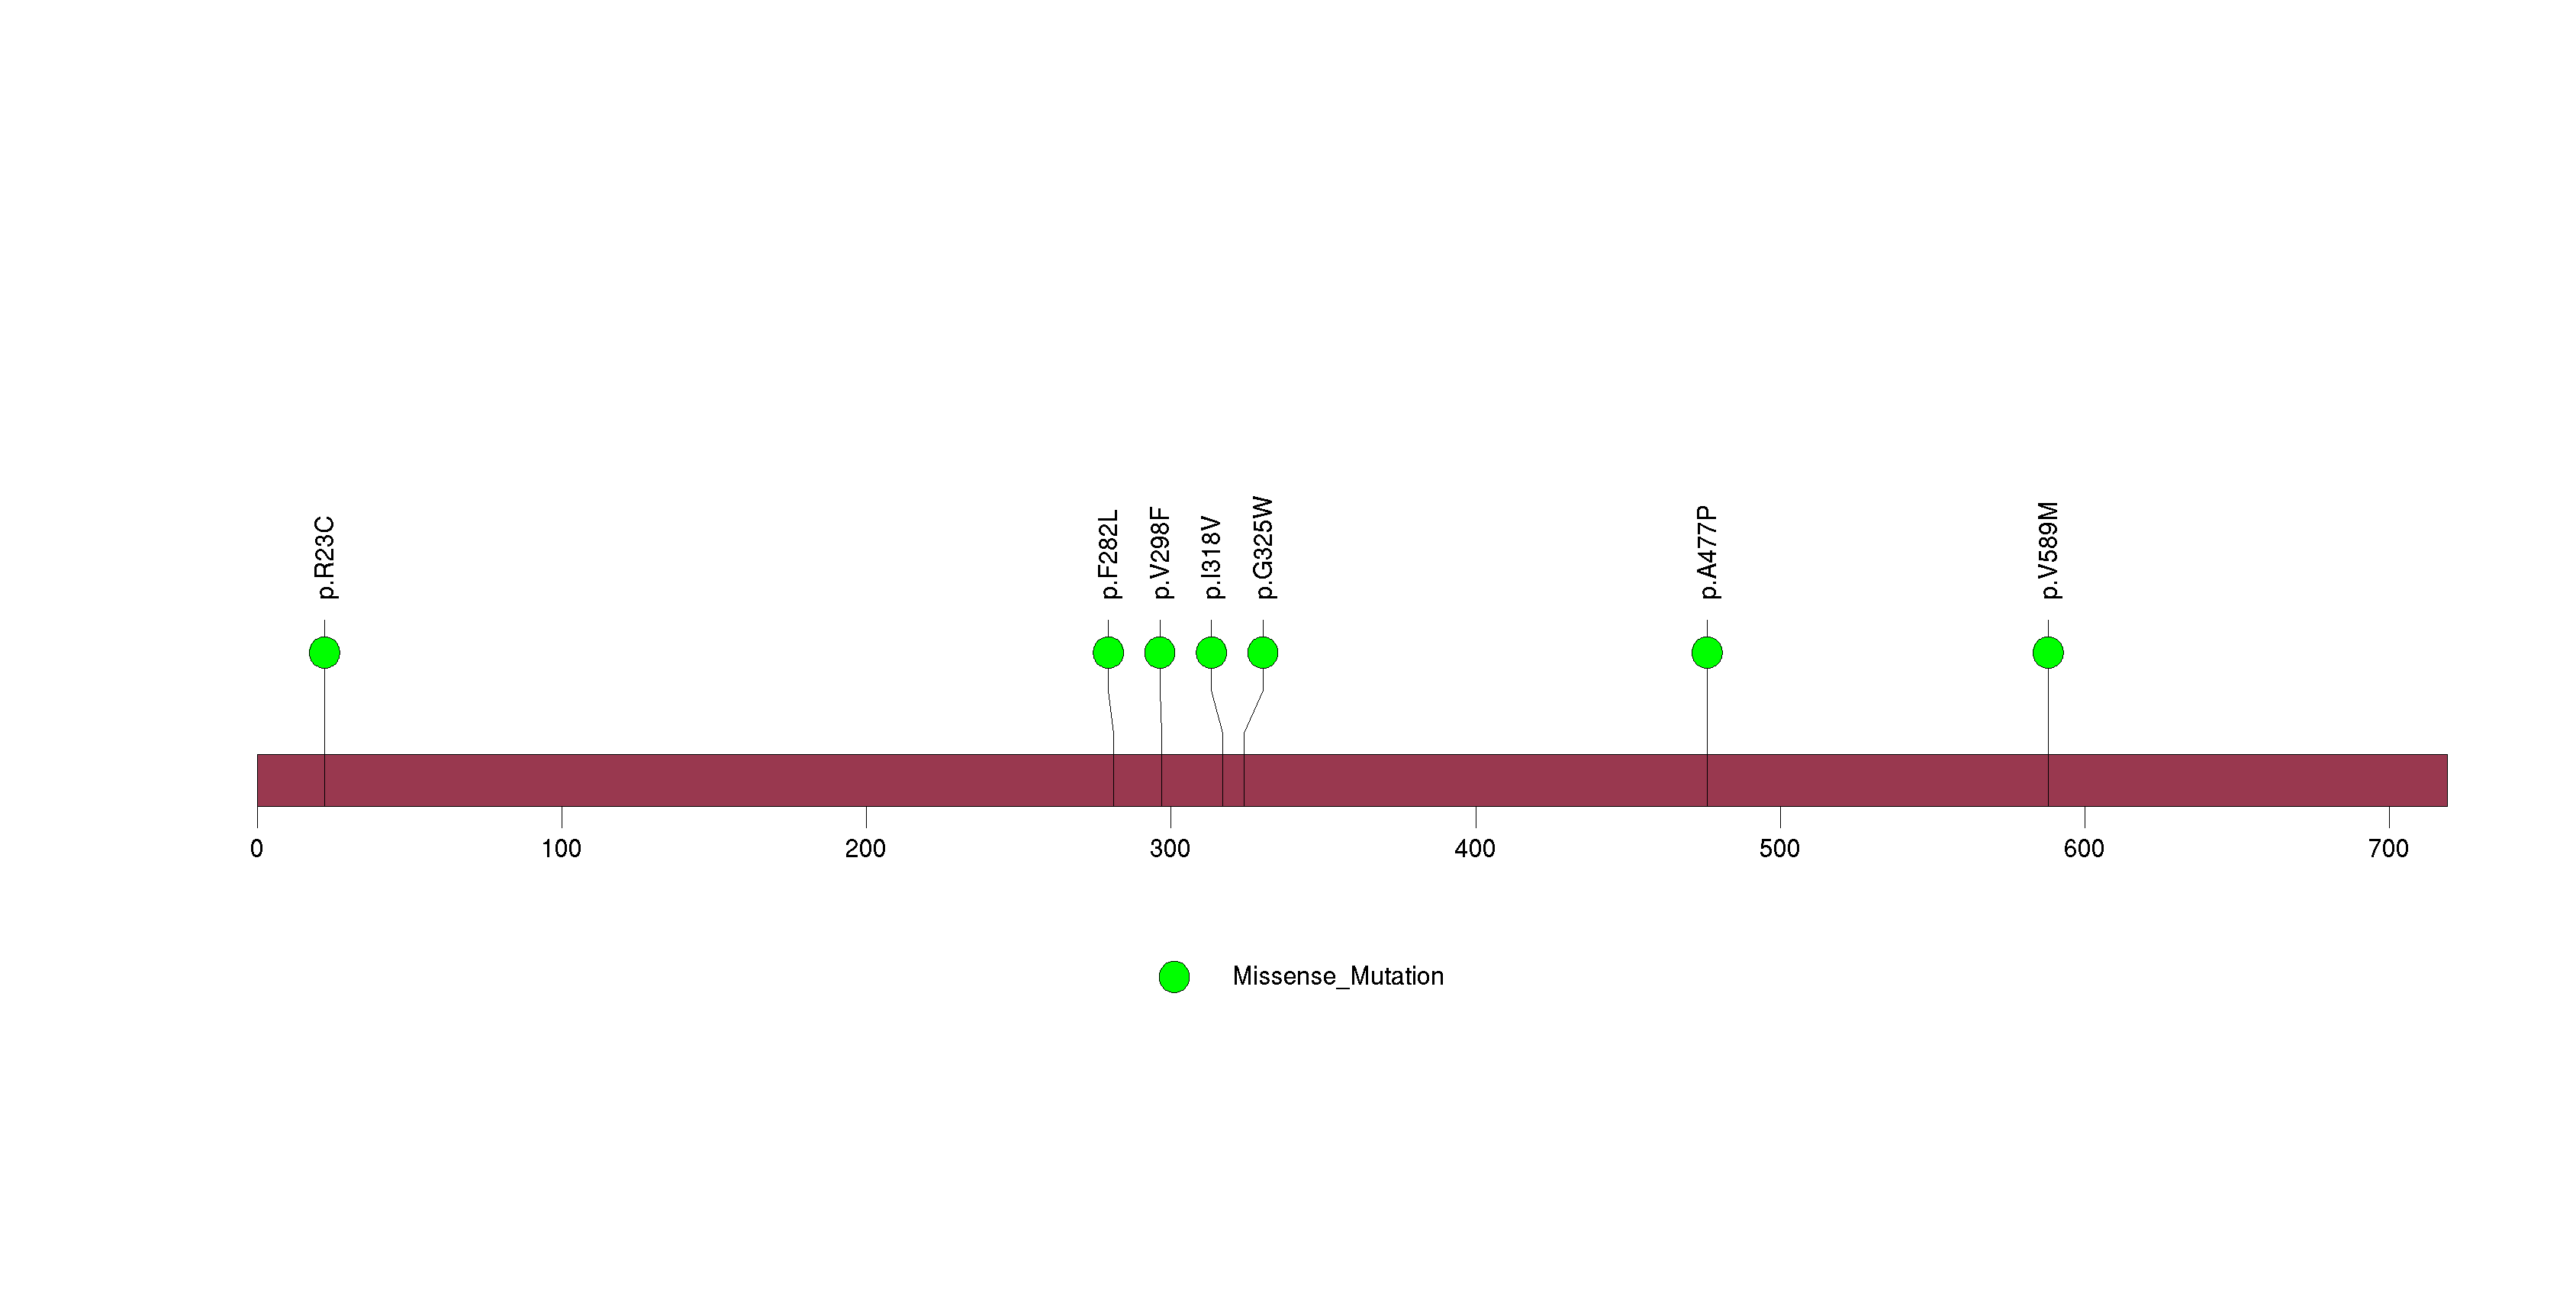
Figure S28. This figure depicts the distribution of mutations and mutation types across the MUC16 significant gene.
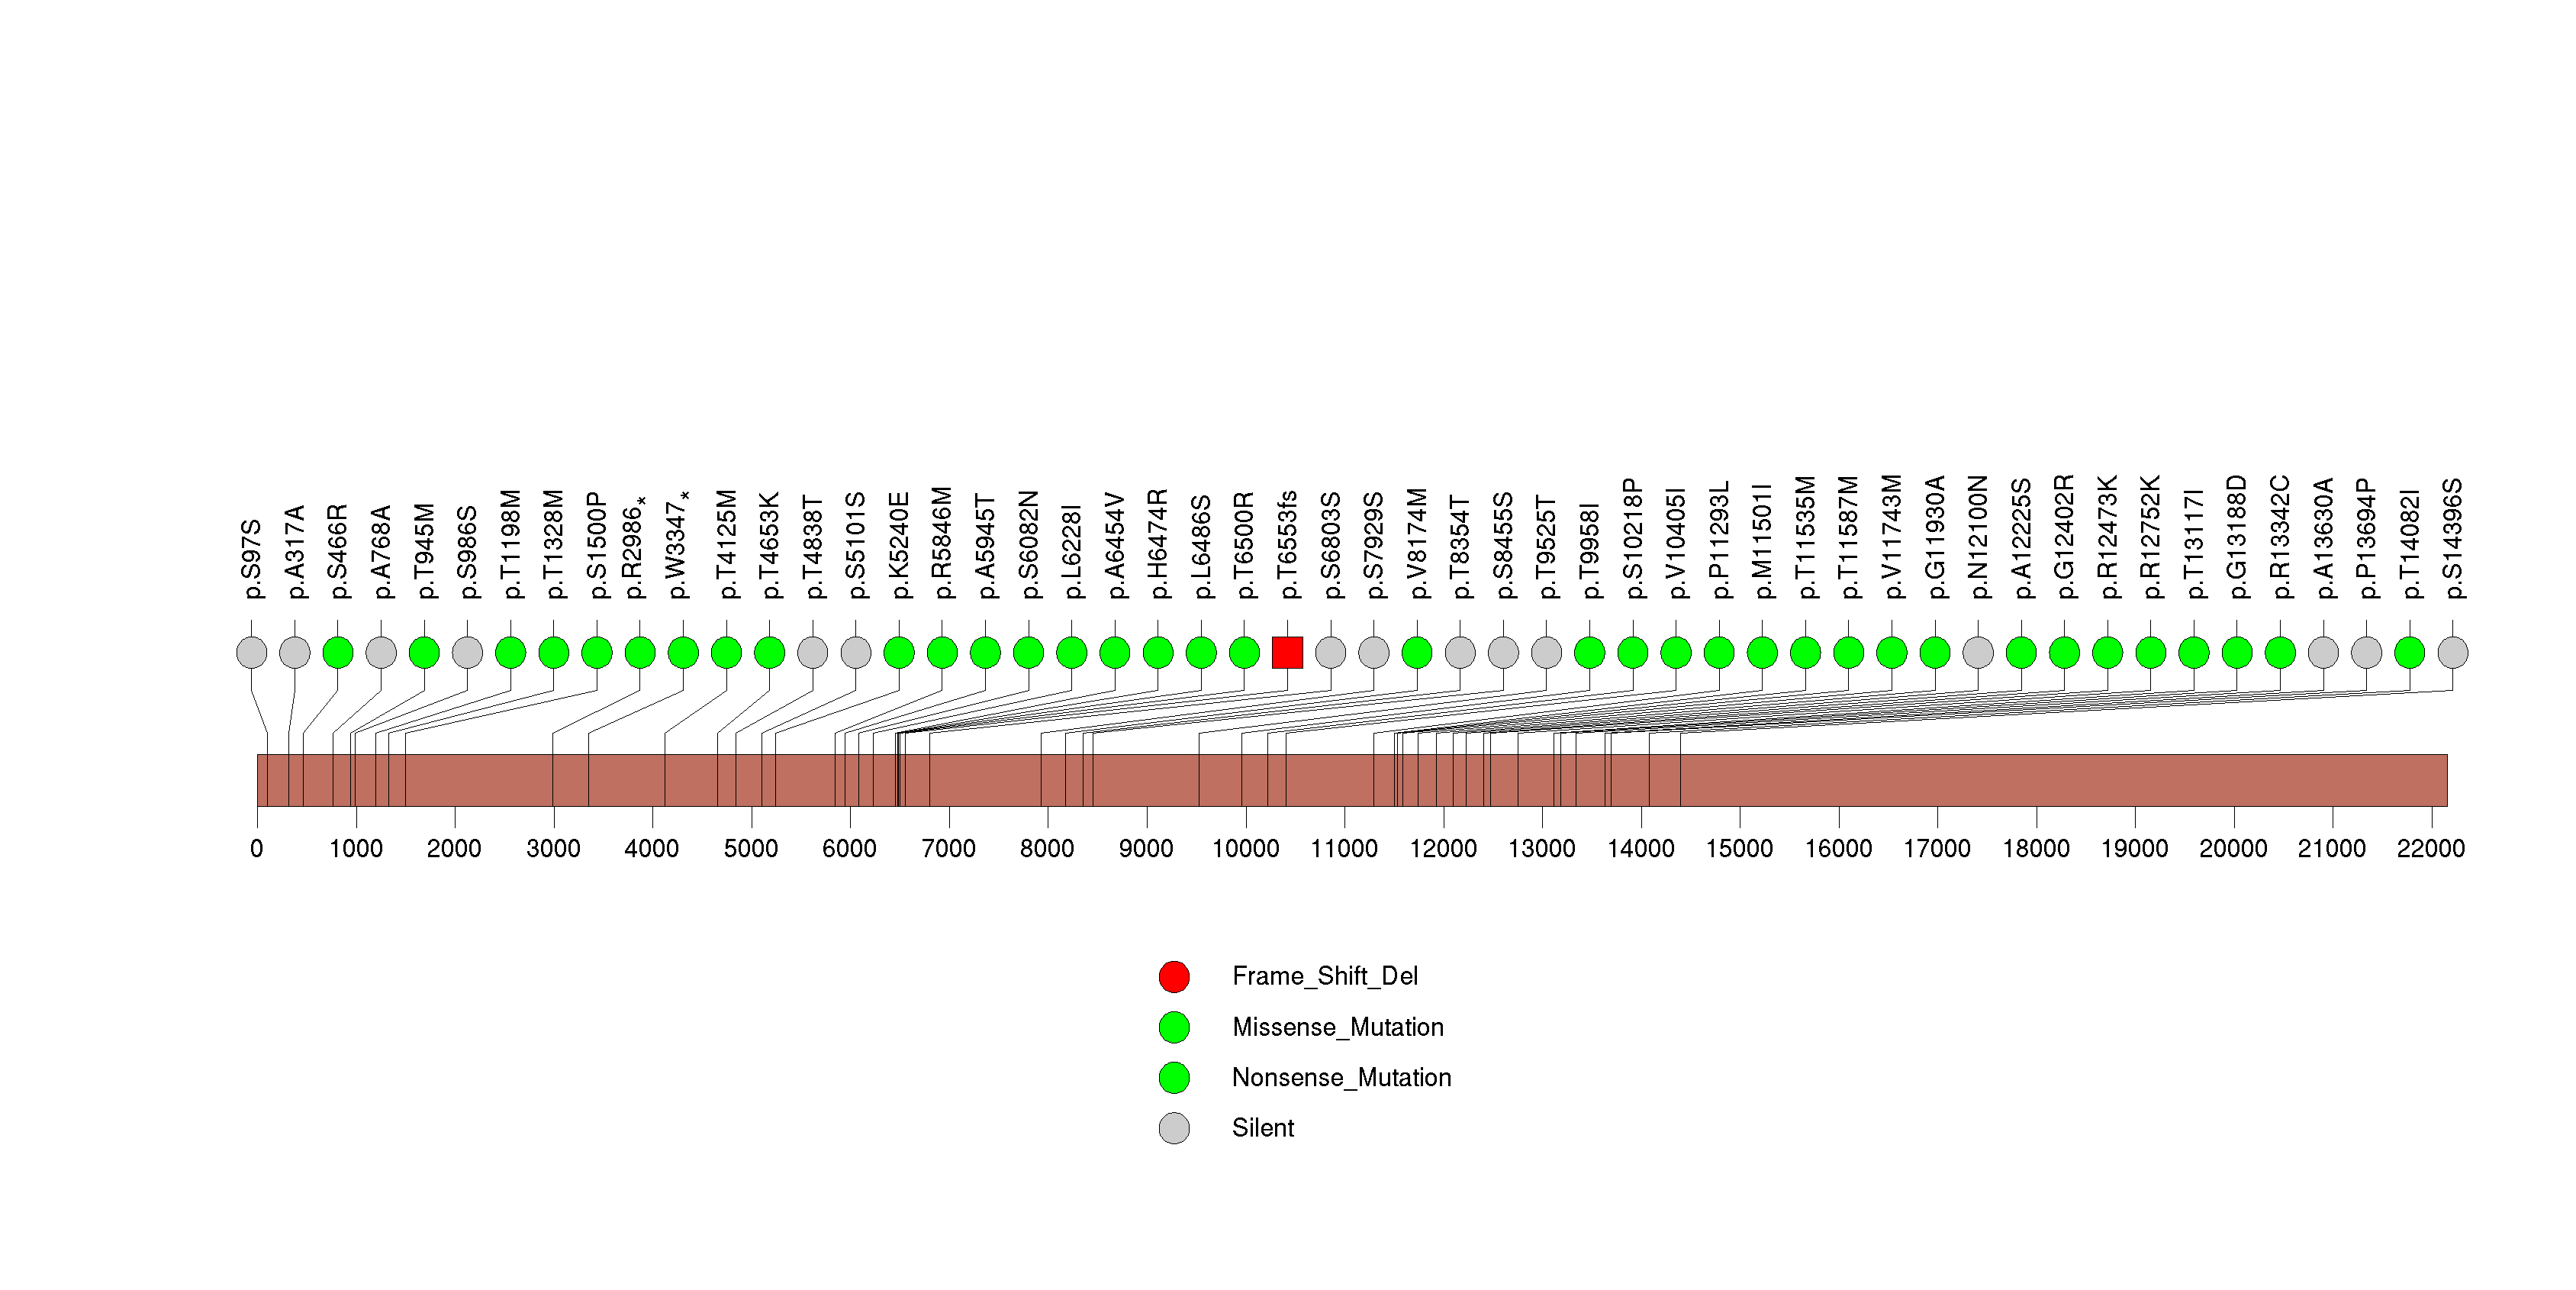
Figure S29. This figure depicts the distribution of mutations and mutation types across the CALN1 significant gene.
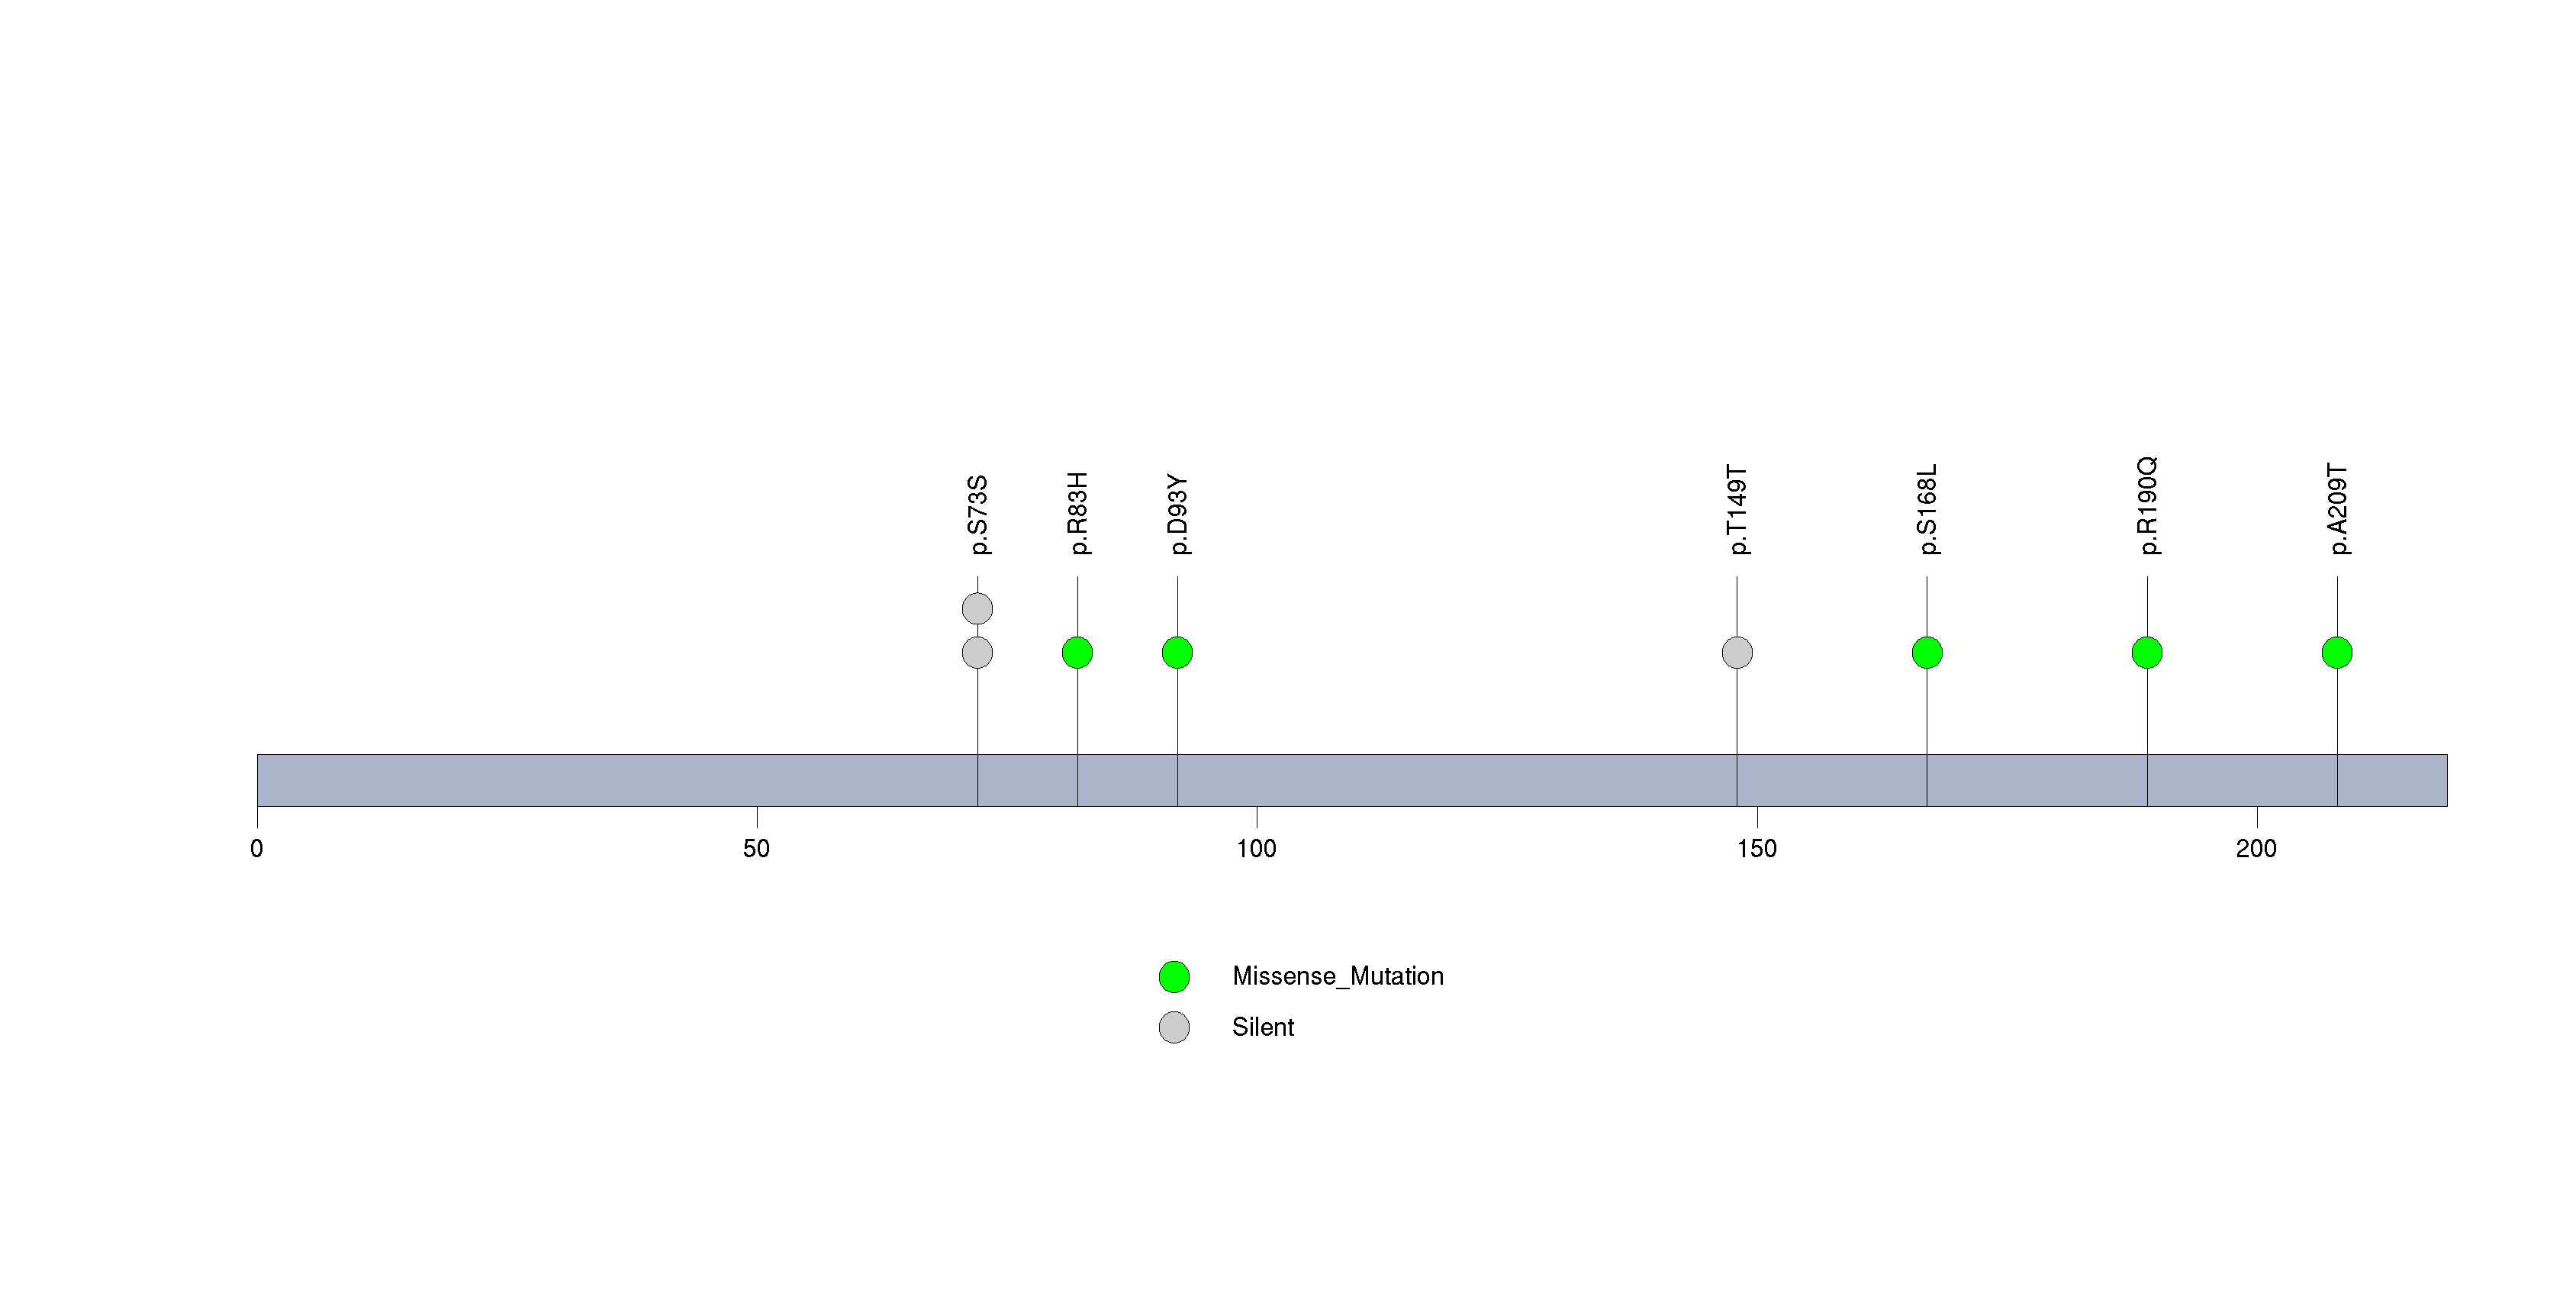
Figure S30. This figure depicts the distribution of mutations and mutation types across the HCN1 significant gene.
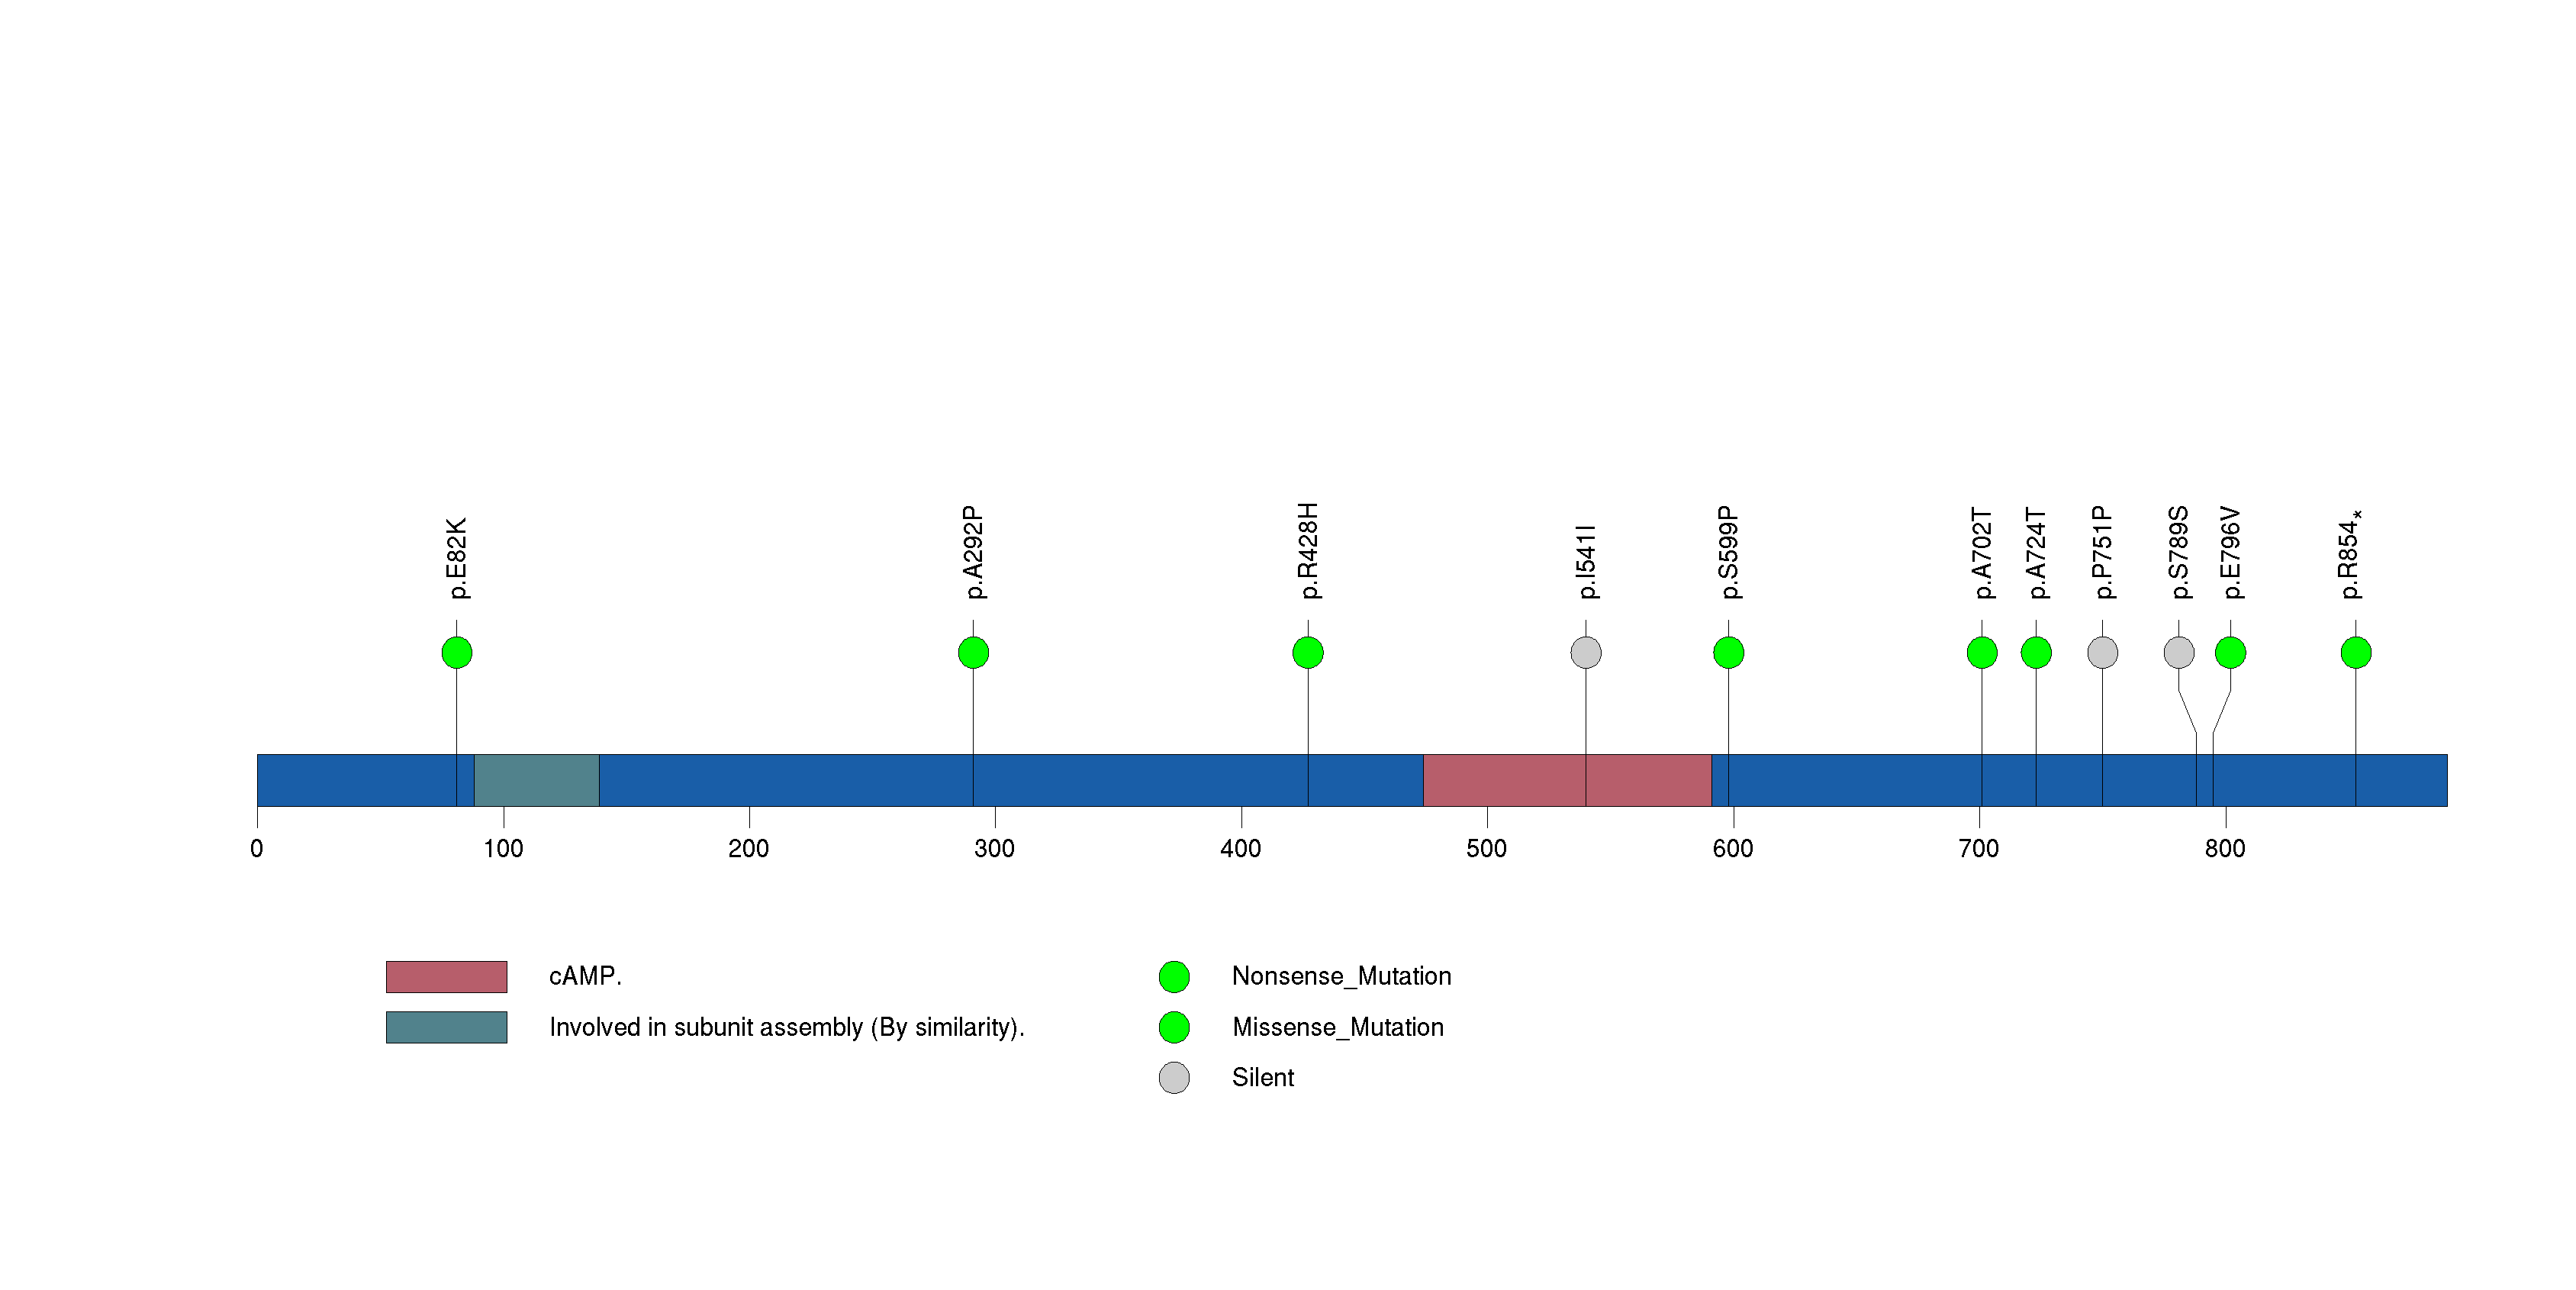
Figure S31. This figure depicts the distribution of mutations and mutation types across the KIF2B significant gene.
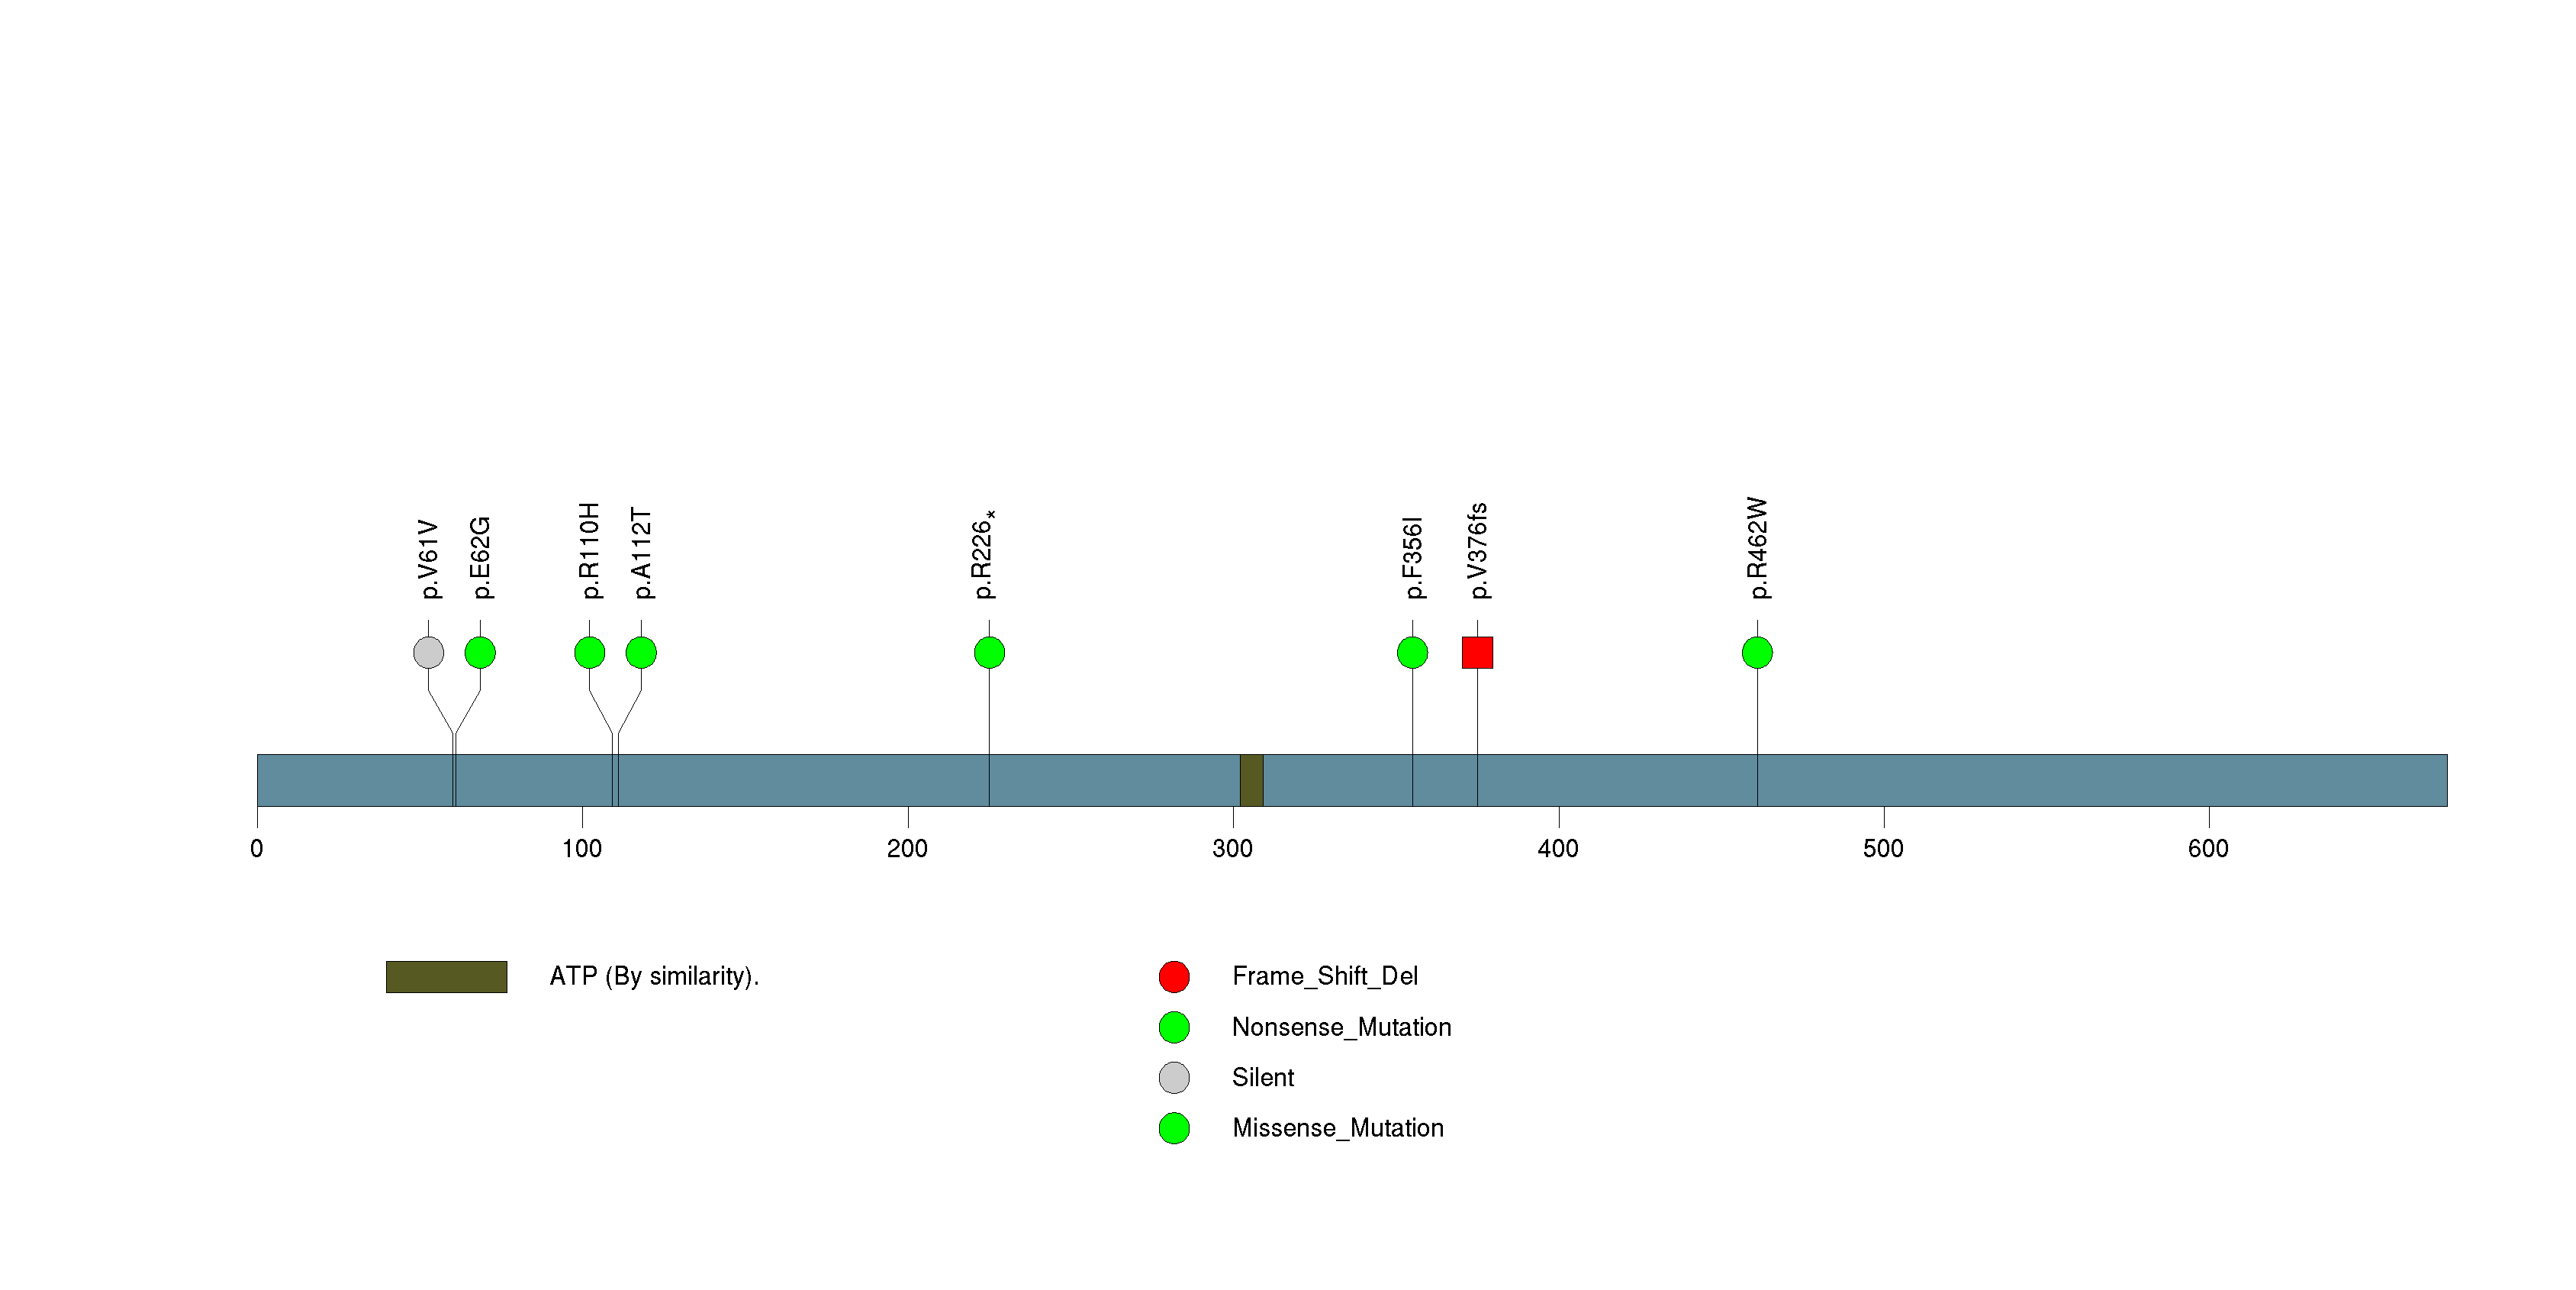
Figure S32. This figure depicts the distribution of mutations and mutation types across the MUC17 significant gene.
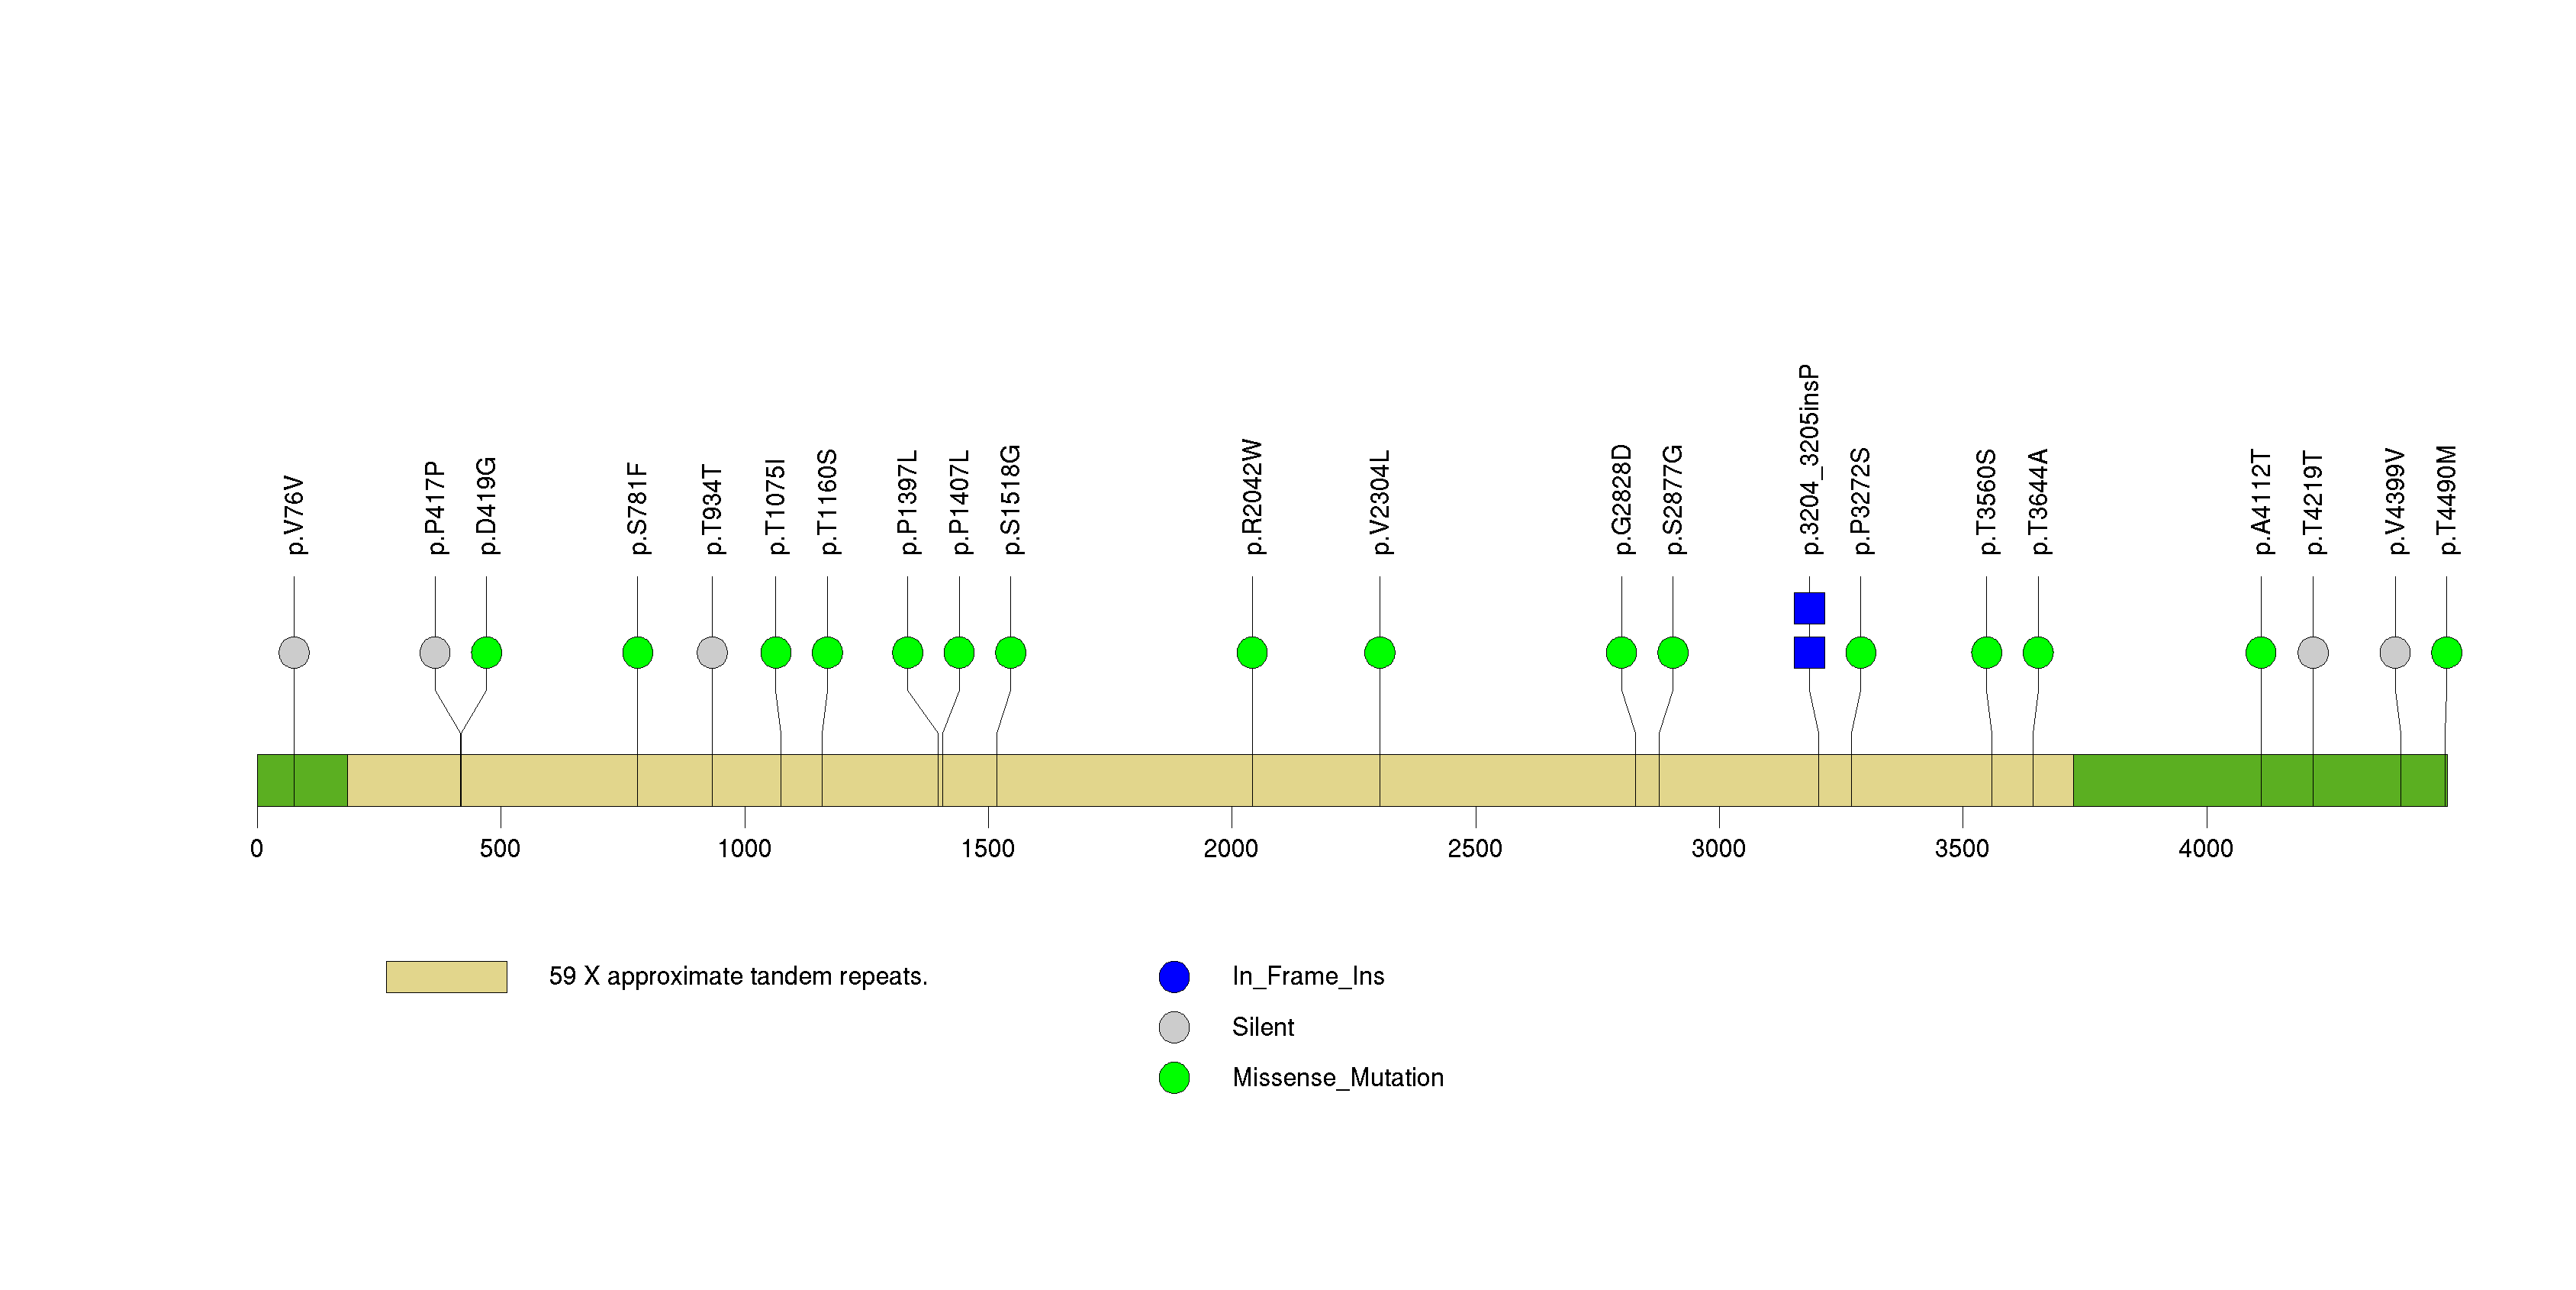
Figure S33. This figure depicts the distribution of mutations and mutation types across the AZGP1 significant gene.
In this analysis, COSMIC is used as a filter to increase power by restricting the territory of each gene. Cosmic version: v48.
Table 4. Get Full Table Significantly mutated genes (COSMIC territory only). To access the database please go to: COSMIC. Number of significant genes found: 0. Number of genes displayed: 10
| rank | gene | description | n | cos | n_cos | N_cos | cos_ev | p | q |
|---|---|---|---|---|---|---|---|---|---|
| 1 | A4GNT | alpha-1,4-N-acetylglucosaminyltransferase | 0 | 0 | 0 | 0 | 0 | 1 | 1 |
| 2 | AACS | acetoacetyl-CoA synthetase | 2 | 0 | 0 | 0 | 0 | 1 | 1 |
| 3 | ABCA9 | ATP-binding cassette, sub-family A (ABC1), member 9 | 2 | 0 | 0 | 0 | 0 | 1 | 1 |
| 4 | ABCC10 | ATP-binding cassette, sub-family C (CFTR/MRP), member 10 | 0 | 0 | 0 | 0 | 0 | 1 | 1 |
| 5 | ABCF2 | ATP-binding cassette, sub-family F (GCN20), member 2 | 1 | 0 | 0 | 0 | 0 | 1 | 1 |
| 6 | ABHD2 | abhydrolase domain containing 2 | 0 | 0 | 0 | 0 | 0 | 1 | 1 |
| 7 | ABHD4 | abhydrolase domain containing 4 | 0 | 0 | 0 | 0 | 0 | 1 | 1 |
| 8 | ACADS | acyl-Coenzyme A dehydrogenase, C-2 to C-3 short chain | 4 | 0 | 0 | 0 | 0 | 1 | 1 |
| 9 | ACOT11 | acyl-CoA thioesterase 11 | 1 | 0 | 0 | 0 | 0 | 1 | 1 |
| 10 | ACRBP | acrosin binding protein | 0 | 0 | 0 | 0 | 0 | 1 | 1 |
Note:
n - number of (nonsilent) mutations in this gene across the individual set.
cos = number of unique mutated sites in this gene in COSMIC
n_cos = overlap between n and cos.
N_cos = number of individuals times cos.
cos_ev = total evidence: number of reports in COSMIC for mutations seen in this gene.
p = p-value for seeing the observed amount of overlap in this gene)
q = q-value, False Discovery Rate (Benjamini-Hochberg procedure)
Table 5. Get Full Table Genes with Clustered Mutations
| num | gene | desc | n | mindist | nmuts0 | nmuts3 | nmuts12 | npairs0 | npairs3 | npairs12 |
|---|---|---|---|---|---|---|---|---|---|---|
| 1678 | DST | dystonin | 5 | 0 | 3 | 3 | 3 | 3 | 3 | 3 |
Note:
n - number of mutations in this gene in the individual set.
mindist - distance (in aa) between closest pair of mutations in this gene
npairs3 - how many pairs of mutations are within 3 aa of each other.
npairs12 - how many pairs of mutations are within 12 aa of each other.
Table 6. Get Full Table A Ranked List of Significantly Mutated Genesets. (Source: MSigDB GSEA Cannonical Pathway Set).Number of significant genesets found: 190. Number of genesets displayed: 10
| rank | geneset | description | genes | N_genes | mut_tally | N | n | npat | nsite | nsil | n1 | n2 | n3 | n4 | n5 | n6 | p | q |
|---|---|---|---|---|---|---|---|---|---|---|---|---|---|---|---|---|---|---|
| 1 | HSA04510_FOCAL_ADHESION | Genes involved in focal adhesion | ACTB, ACTG1, ACTN1, ACTN2, ACTN3, ACTN4, AKT1, AKT2, AKT3, ARHGAP5, BAD, BCAR1, BCL2, BIRC2, BIRC3, BIRC4, BRAF, CAPN2, CAV1, CAV2, CAV3, CCND1, CCND2, CCND3, CDC42, CHAD, COL11A1, COL11A2, COL1A1, COL1A2, COL2A1, COL3A1, COL4A1, COL4A2, COL4A4, COL4A6, COL5A1, COL5A2, COL5A3, COL6A1, COL6A2, COL6A3, COL6A6, COMP, CRK, CRKL, CTNNB1, DIAPH1, DOCK1, EGF, EGFR, ELK1, ERBB2, FARP2, FIGF, FLNA, FLNB, FLNC, FLT1, FN1, FYN, GRB2, GRLF1, GSK3B, HGF, HRAS, IBSP, IGF1, IGF1R, ILK, ITGA1, ITGA10, ITGA11, ITGA2, ITGA2B, ITGA3, ITGA4, ITGA5, ITGA6, ITGA7, ITGA8, ITGA9, ITGAV, ITGB1, ITGB3, ITGB4, ITGB5, ITGB6, ITGB7, ITGB8, JUN, KDR, LAMA1, LAMA2, LAMA3, LAMA4, LAMA5, LAMB1, LAMB2, LAMB3, LAMB4, LAMC1, LAMC2, LAMC3, LOC653852, MAP2K1, MAPK1, MAPK10, MAPK3, MAPK8, MAPK9, MET, MLCK, MRCL3, MRLC2, MYL2, MYL5, MYL7, MYL8P, MYL9, MYLC2PL, MYLK, MYLK2, MYLPF, PAK1, PAK2, PAK3, PAK4, PAK6, PAK7, PARVA, PARVB, PARVG, PDGFA, PDGFB, PDGFC, PDGFD, PDGFRA, PDGFRB, PDPK1, PGF, PIK3CA, PIK3CB, PIK3CD, PIK3CG, PIK3R1, PIK3R2, PIK3R3, PIK3R5, PIP5K1C, PPP1CA, PPP1CB, PPP1CC, PPP1R12A, PRKCA, PRKCB1, PRKCG, PTEN, PTK2, PXN, RAC1, RAC2, RAC3, RAF1, RAP1A, RAP1B, RAPGEF1, RELN, RHOA, ROCK1, ROCK2, SHC1, SHC2, SHC3, SHC4, SOS1, SOS2, SPP1, SRC, THBS1, THBS2, THBS3, THBS4, TLN1, TLN2, TNC, TNN, TNR, TNXB, VASP, VAV1, VAV2, VAV3, VCL, VEGFA, VEGFB, VEGFC, VTN, VWF, ZYX | 191 | ACTN1(2), ACTN3(1), AKT1(1), ARHGAP5(3), BCL2(2), BIRC3(1), BRAF(5), CAV3(1), CCND2(1), CCND3(1), COL11A1(1), COL11A2(5), COL1A1(1), COL1A2(9), COL2A1(1), COL3A1(4), COL4A1(1), COL4A2(1), COL4A4(5), COL4A6(2), COL5A1(1), COL5A2(1), COL5A3(1), COL6A3(13), COL6A6(5), CRKL(1), DOCK1(1), EGF(3), EGFR(73), ELK1(2), ERBB2(1), FIGF(2), FLNB(1), FLNC(3), FLT1(5), FN1(2), FYN(1), GRLF1(1), GSK3B(1), HGF(1), IGF1(2), IGF1R(2), ITGA1(2), ITGA10(2), ITGA11(1), ITGA2(1), ITGA2B(1), ITGA3(1), ITGA4(3), ITGA5(1), ITGA7(2), ITGA8(1), ITGA9(1), ITGAV(1), ITGB1(1), ITGB3(1), ITGB4(2), ITGB6(2), ITGB7(1), ITGB8(1), KDR(6), LAMA1(3), LAMA2(6), LAMA3(4), LAMA4(1), LAMA5(5), LAMB1(2), LAMB3(3), LAMB4(3), LAMC1(1), LAMC3(3), MAP2K1(1), MAPK1(1), MAPK3(1), MAPK8(1), MET(1), MYLK(2), PAK1(1), PAK3(1), PAK4(3), PDGFD(1), PDGFRA(10), PDGFRB(2), PIK3CA(28), PIK3CB(4), PIK3CG(5), PIK3R1(32), PIK3R2(3), PIK3R3(1), PIK3R5(3), PRKCA(1), PRKCG(2), PTEN(69), PXN(1), RAF1(1), RELN(12), ROCK1(1), ROCK2(1), SHC4(1), SOS1(3), SRC(2), THBS3(1), THBS4(1), TLN2(2), TNC(1), TNN(2), TNXB(2), VASP(1), VAV1(3), VAV2(2), VAV3(1), VEGFA(2), VEGFB(1), VWF(5), ZYX(2) | 160724111 | 454 | 215 | 393 | 89 | 117 | 134 | 73 | 27 | 103 | 0 | <1.00e-15 | <3.24e-14 |
| 2 | HSA04012_ERBB_SIGNALING_PATHWAY | Genes involved in ErbB signaling pathway | ABL1, ABL2, AKT1, AKT2, AKT3, ARAF, AREG, BAD, BRAF, BTC, CAMK2A, CAMK2B, CAMK2D, CAMK2G, CBL, CBLB, CBLC, CDKN1A, CDKN1B, CRK, CRKL, EGF, EGFR, EIF4EBP1, ELK1, ERBB2, ERBB3, ERBB4, EREG, FRAP1, GAB1, GRB2, GSK3B, HBEGF, HRAS, JUN, KRAS, MAP2K1, MAP2K2, MAP2K4, MAP2K7, MAPK1, MAPK10, MAPK3, MAPK8, MAPK9, MYC, NCK1, NCK2, NRAS, NRG1, NRG2, NRG3, NRG4, PAK1, PAK2, PAK3, PAK4, PAK6, PAK7, PIK3CA, PIK3CB, PIK3CD, PIK3CG, PIK3R1, PIK3R2, PIK3R3, PIK3R5, PLCG1, PLCG2, PRKCA, PRKCB1, PRKCG, PTK2, RAF1, RPS6KB1, RPS6KB2, SHC1, SHC2, SHC3, SHC4, SOS1, SOS2, SRC, STAT5A, STAT5B, TGFA | 85 | ABL1(1), ABL2(1), AKT1(1), BRAF(5), CAMK2A(1), CBL(1), CBLB(1), CDKN1A(1), CRKL(1), EGF(3), EGFR(73), ELK1(2), ERBB2(1), ERBB4(1), GSK3B(1), KRAS(2), MAP2K1(1), MAPK1(1), MAPK3(1), MAPK8(1), MYC(1), PAK1(1), PAK3(1), PAK4(3), PIK3CA(28), PIK3CB(4), PIK3CG(5), PIK3R1(32), PIK3R2(3), PIK3R3(1), PIK3R5(3), PLCG1(6), PLCG2(2), PRKCA(1), PRKCG(2), RAF1(1), SHC4(1), SOS1(3), SRC(2), STAT5B(1), TGFA(3) | 44683890 | 204 | 142 | 155 | 25 | 73 | 48 | 32 | 11 | 40 | 0 | <1.00e-15 | <3.24e-14 |
| 3 | ST_FAS_SIGNALING_PATHWAY | The Fas receptor induces apoptosis and NF-kB activation when bound to Fas ligand. | ADPRT, ALG2, BAK1, BAX, BFAR, BIRC4, BTK, CAD, CASP10, CASP3, CASP8, CASP8AP2, CD7, CDK2AP1, CSNK1A1, DAXX, DEDD, DEDD2, DFFA, DIABLO, EGFR, EPHB2, FADD, FAF1, FAIM2, FREQ, HRB, HSPB1, IL1A, IL8, MAP2K4, MAP2K7, MAP3K1, MAP3K5, MAPK1, MAPK10, MAPK8, MAPK8IP1, MAPK8IP2, MAPK8IP3, MAPK9, MCP, MET, NFAT5, NFKB1, NFKB2, NFKBIA, NFKBIB, NFKBIE, NFKBIL1, NFKBIL2, NR0B2, PFN1, PFN2, PTPN13, RALBP1, RIPK1, ROCK1, SMPD1, TNFRSF6, TNFRSF6B, TP53, TPX2, TRAF2, TUFM, VIL2 | 59 | CAD(1), CASP8AP2(1), DAXX(2), DEDD(1), DEDD2(1), EGFR(73), EPHB2(1), FAF1(1), IL1A(1), MAP3K1(2), MAP3K5(1), MAPK1(1), MAPK8(1), MAPK8IP1(1), MAPK8IP2(2), MAPK8IP3(2), MET(1), NFKB1(1), NFKB2(1), NFKBIA(1), NFKBIE(2), NFKBIL2(2), NR0B2(1), PTPN13(1), RALBP1(1), RIPK1(1), ROCK1(1), TP53(69), TPX2(2) | 31809563 | 176 | 127 | 121 | 13 | 66 | 51 | 20 | 12 | 27 | 0 | <1.00e-15 | <3.24e-14 |
| 4 | HSA00562_INOSITOL_PHOSPHATE_METABOLISM | Genes involved in inositol phosphate metabolism | CARKL, FN3K, IMPA1, IMPA2, INPP1, INPP4A, INPP4B, INPP5A, INPP5B, INPP5E, INPPL1, IPMK, ISYNA1, ITGB1BP3, ITPK1, ITPKA, ITPKB, MINPP1, MIOX, OCRL, PI4KA, PI4KB, PIB5PA, PIK3C3, PIK3CA, PIK3CB, PIK3CD, PIK3CG, PIP4K2A, PIP4K2B, PIP4K2C, PIP5K1A, PIP5K1B, PIP5K1C, PIP5K3, PLCB1, PLCB2, PLCB3, PLCB4, PLCD1, PLCD3, PLCD4, PLCE1, PLCG1, PLCG2, PLCZ1, PTEN, PTPMT1, SKIP, SYNJ1, SYNJ2 | 47 | INPP1(1), INPP4B(1), INPP5A(1), INPP5B(1), INPP5E(1), INPPL1(3), OCRL(2), PI4KB(2), PIK3CA(28), PIK3CB(4), PIK3CG(5), PIP4K2C(3), PIP5K1B(2), PLCB1(1), PLCB2(3), PLCB4(1), PLCD1(1), PLCE1(2), PLCG1(6), PLCG2(2), PLCZ1(1), PTEN(69), SYNJ2(2) | 32143184 | 142 | 114 | 126 | 16 | 30 | 26 | 26 | 11 | 49 | 0 | <1.00e-15 | <3.24e-14 |
| 5 | HSA04370_VEGF_SIGNALING_PATHWAY | Genes involved in VEGF signaling pathway | AKT1, AKT2, AKT3, BAD, CASP9, CDC42, CHP, HRAS, KDR, KRAS, MAP2K1, MAP2K2, MAPK1, MAPK11, MAPK12, MAPK13, MAPK14, MAPK3, MAPKAPK2, MAPKAPK3, NFAT5, NFATC1, NFATC2, NFATC3, NFATC4, NOS3, NRAS, PIK3CA, PIK3CB, PIK3CD, PIK3CG, PIK3R1, PIK3R2, PIK3R3, PIK3R5, PLA2G10, PLA2G12A, PLA2G12B, PLA2G1B, PLA2G2A, PLA2G2D, PLA2G2E, PLA2G2F, PLA2G3, PLA2G4A, PLA2G5, PLA2G6, PLCG1, PLCG2, PPP3CA, PPP3CB, PPP3CC, PPP3R1, PPP3R2, PRKCA, PRKCB1, PRKCG, PTGS2, PTK2, PXN, RAC1, RAC2, RAC3, RAF1, SH2D2A, SHC2, SPHK1, SPHK2, SRC, VEGFA | 69 | AKT1(1), CASP9(1), KDR(6), KRAS(2), MAP2K1(1), MAPK1(1), MAPK13(1), MAPK3(1), NFATC2(2), NFATC4(2), NOS3(4), PIK3CA(28), PIK3CB(4), PIK3CG(5), PIK3R1(32), PIK3R2(3), PIK3R3(1), PIK3R5(3), PLA2G2F(1), PLA2G3(1), PLA2G4A(2), PLA2G6(1), PLCG1(6), PLCG2(2), PPP3CB(1), PPP3R2(1), PRKCA(1), PRKCG(2), PXN(1), RAF1(1), SRC(2), VEGFA(2) | 31232956 | 122 | 97 | 111 | 17 | 23 | 34 | 18 | 12 | 35 | 0 | <1.00e-15 | <3.24e-14 |
| 6 | PPARAPATHWAY | Peroxisome proliferators regulate gene expression via PPAR/RXR heterodimers which bind to peroxisome-proliferator response elements (PPREs). | ACOX1, APOA1, APOA2, CD36, CITED2, CPT1B, CREBBP, DUSP1, DUT, EHHADH, EP300, FABP1, FAT, FRA8B, HSD17B4, HSPA1A, HSPCA, INS, JUN, LPL, MAPK1, MAPK3, ME1, MRPL11, MYC, NCOA1, NCOR1, NCOR2, NFKBIA, NOS2A, NR0B2, NR1H3, NR2F1, NRIP1, PDGFA, PIK3CA, PIK3R1, PPARA, PPARBP, PPARGC1, PRKACB, PRKACG, PRKAR1A, PRKAR1B, PRKAR2A, PRKAR2B, PRKCA, PRKCB1, PTGS2, RB1, RELA, RXRA, SP1, SRA1, STAT5A, STAT5B, TNF | 48 | CREBBP(4), EHHADH(1), HSD17B4(1), MAPK1(1), MAPK3(1), MYC(1), NCOA1(1), NCOR1(1), NCOR2(1), NFKBIA(1), NR0B2(1), NR1H3(1), NRIP1(1), PIK3CA(28), PIK3R1(32), PPARA(1), PRKAR1B(1), PRKAR2B(1), PRKCA(1), RB1(20), RXRA(2), STAT5B(1) | 26846850 | 103 | 92 | 93 | 11 | 16 | 15 | 10 | 9 | 53 | 0 | <1.00e-15 | <3.24e-14 |
| 7 | HSA04150_MTOR_SIGNALING_PATHWAY | Genes involved in mTOR signaling pathway | AKT1, AKT2, AKT3, BRAF, CAB39, DDIT4, EIF4B, EIF4EBP1, FIGF, FRAP1, GBL, HIF1A, IGF1, INS, KIAA1303, LYK5, MAPK1, MAPK3, PDPK1, PGF, PIK3CA, PIK3CB, PIK3CD, PIK3CG, PIK3R1, PIK3R2, PIK3R3, PIK3R5, PRKAA1, PRKAA2, RHEB, RICTOR, RPS6, RPS6KA1, RPS6KA2, RPS6KA3, RPS6KA6, RPS6KB1, RPS6KB2, STK11, TSC1, TSC2, ULK1, ULK2, ULK3, VEGFA, VEGFB, VEGFC | 44 | AKT1(1), BRAF(5), EIF4B(1), FIGF(2), IGF1(2), MAPK1(1), MAPK3(1), PIK3CA(28), PIK3CB(4), PIK3CG(5), PIK3R1(32), PIK3R2(3), PIK3R3(1), PIK3R5(3), RICTOR(2), RPS6KA2(2), RPS6KA3(1), RPS6KA6(2), TSC2(2), ULK2(1), VEGFA(2), VEGFB(1) | 22950463 | 102 | 86 | 88 | 11 | 21 | 24 | 16 | 10 | 31 | 0 | <1.00e-15 | <3.24e-14 |
| 8 | APOPTOSIS | APAF1, BAD, BAK1, BCL2L7P1, BAX, BCL2, BCL2L1, BCL2L11, BID, BIRC2, BIRC3, BIRC4, BIRC5, BNIP3L, CASP1, CASP10, CASP1, COPl, CASP2, CASP3, CASP4, CASP6, CASP7, CASP8, CASP9, CHUK, CYCS, DFFA, DFFB, FADD, FAS, FASLG, GZMB, HELLS, HRK, IKBKB, IKBKG, IRF1, IRF2, IRF3, IRF4, IRF5, IRF6, IRF7, JUN, LTA, MAP2K4, MAP3K1, MAPK10, MDM2, MYC, NFKB1, NFKBIA, NFKBIB, NFKBIE, PRF1, RELA, RIPK1, TNF, TNFRSF10B, TNFRSF1A, TNFRSF1B, TNFRSF21, TNFRSF25, TNFRSF25, PLEKHG5, TNFSF10, TP53, TP73, TRADD, TRAF1, TRAF2, TRAF3 | 66 | BCL2(2), BIRC3(1), CASP1(1), CASP9(1), CHUK(1), IKBKB(1), IRF1(1), IRF2(1), IRF4(2), IRF5(1), IRF6(2), MAP3K1(2), MDM2(2), MYC(1), NFKB1(1), NFKBIA(1), NFKBIE(2), PLEKHG5(1), RIPK1(1), TNFRSF1A(1), TNFSF10(2), TP53(69) | 24836757 | 97 | 79 | 76 | 9 | 22 | 34 | 10 | 8 | 23 | 0 | <1.00e-15 | <3.24e-14 | |
| 9 | FCER1PATHWAY | In mast cells, Fc epsilon receptor 1 activates BTK, PKC, and the MAP kinase pathway to promote degranulation and arachnidonic acid release. | BTK, CALM1, CALM2, CALM3, ELK1, FCER1A, FCER1G, FOS, GRB2, HRAS, JUN, LYN, MAP2K1, MAP2K4, MAP2K7, MAP3K1, MAPK1, MAPK3, MAPK8, NFATC1, NFATC2, NFATC3, NFATC4, PAK2, PIK3CA, PIK3R1, PLA2G4A, PLCG1, PPP3CA, PPP3CB, PPP3CC, PRKCB1, RAF1, SHC1, SOS1, SYK, SYT1, VAV1 | 37 | ELK1(2), FCER1A(1), FOS(1), LYN(2), MAP2K1(1), MAP3K1(2), MAPK1(1), MAPK3(1), MAPK8(1), NFATC2(2), NFATC4(2), PIK3CA(28), PIK3R1(32), PLA2G4A(2), PLCG1(6), PPP3CB(1), RAF1(1), SOS1(3), VAV1(3) | 18589718 | 92 | 79 | 82 | 9 | 17 | 17 | 18 | 10 | 30 | 0 | <1.00e-15 | <3.24e-14 |
| 10 | AT1RPATHWAY | Binding of angiotensin II to AT1-R activates Ca2+ signaling and the JNK pathway. | AGT, AGTR1, ATF2, CALM1, CALM2, CALM3, EGFR, ELK1, GNAQ, GRB2, HRAS, JUN, MAP2K1, MAP2K2, MAP2K4, MAP3K1, MAPK1, MAPK3, MAPK8, MEF2A, MEF2B, MEF2C, MEF2D, PAK1, PRKCA, PRKCB1, PTK2, PTK2B, RAC1, RAF1, SHC1, SOS1, SRC, SYT1 | 33 | AGTR1(1), EGFR(73), ELK1(2), MAP2K1(1), MAP3K1(2), MAPK1(1), MAPK3(1), MAPK8(1), MEF2A(2), MEF2D(1), PAK1(1), PRKCA(1), PTK2B(2), RAF1(1), SOS1(3), SRC(2) | 14612734 | 95 | 78 | 61 | 9 | 49 | 21 | 14 | 3 | 8 | 0 | <1.00e-15 | <3.24e-14 |
Table 7. Get Full Table A Ranked List of Significantly Mutated Genesets (Excluding Significantly Mutated Genes). Number of significant genesets found: 16. Number of genesets displayed: 10
| rank | geneset | description | genes | N_genes | mut_tally | N | n | npat | nsite | nsil | n1 | n2 | n3 | n4 | n5 | n6 | p | q |
|---|---|---|---|---|---|---|---|---|---|---|---|---|---|---|---|---|---|---|
| 1 | DCPATHWAY | Dendritic cells internalize and present antigen, after which they migrate to lymphocyte-rich tissues and induce T and B cell differentiation. | ANPEP, CD2, CD33, CD5, CD7, CSF2, IFNA1, IFNB1, IFNG, IL10, IL12A, IL12B, IL13, IL3, IL4, IL5, ITGAX, TLR2, TLR4, TLR7, TLR9, TNFRSF5 | 21 | ANPEP(2), CD2(1), CD33(4), CD5(2), CSF2(2), IFNB1(1), IFNG(2), IL12B(1), IL3(1), ITGAX(6), TLR2(3), TLR4(1), TLR7(3), TLR9(2) | 8029007 | 31 | 31 | 31 | 8 | 2 | 20 | 4 | 1 | 4 | 0 | 3.9e-07 | 0.00024 |
| 2 | HSA04640_HEMATOPOIETIC_CELL_LINEAGE | Genes involved in hematopoietic cell lineage | ANPEP, CD14, CD19, CD1A, CD1B, CD1C, CD1D, CD1E, CD2, CD22, CD24, CD33, CD34, CD36, CD37, CD38, CD3D, CD3E, CD3G, CD4, CD44, CD5, CD55, CD59, CD7, CD8A, CD8B, CD9, CR1, CR2, CSF1, CSF1R, CSF2, CSF2RA, CSF3, CSF3R, DNTT, EPO, EPOR, FCER2, FCGR1A, FLT3, FLT3LG, GP1BA, GP1BB, GP5, GP9, GYPA, HLA-DRA, HLA-DRB1, HLA-DRB3, HLA-DRB4, HLA-DRB5, IL11, IL11RA, IL1A, IL1B, IL1R1, IL1R2, IL2RA, IL3, IL3RA, IL4, IL4R, IL5, IL5RA, IL6, IL6R, IL7, IL7R, IL9R, ITGA1, ITGA2, ITGA2B, ITGA3, ITGA4, ITGA5, ITGA6, ITGAM, ITGB3, KIT, KITLG, MME, MS4A1, TFRC, THPO, TNF, TPO | 81 | ANPEP(2), CD19(1), CD1B(1), CD1D(3), CD1E(2), CD2(1), CD22(3), CD33(4), CD37(1), CD38(1), CD3E(2), CD3G(1), CD44(3), CD5(2), CD55(1), CD59(1), CR2(3), CSF1R(1), CSF2(2), DNTT(1), EPO(1), FCER2(1), FLT3(4), HLA-DRA(1), IL1A(1), IL1B(1), IL1R1(2), IL3(1), IL4R(4), IL5RA(1), IL6(1), IL7(1), IL7R(1), ITGA1(2), ITGA2(1), ITGA2B(1), ITGA3(1), ITGA4(3), ITGA5(1), ITGAM(4), ITGB3(1), KIT(3), KITLG(1), MME(1), THPO(1), TPO(3) | 34897969 | 79 | 70 | 78 | 28 | 18 | 36 | 9 | 2 | 14 | 0 | 0.00011 | 0.034 |
| 3 | HSA04650_NATURAL_KILLER_CELL_MEDIATED_CYTOTOXICITY | Genes involved in natural killer cell mediated cytotoxicity | ARAF, BID, BRAF, CASP3, CD244, CD247, CD48, CHP, CSF2, FAS, FASLG, FCER1G, FCGR3A, FCGR3B, FYN, GRB2, GZMB, HCST, HLA-A, HLA-B, HLA-C, HLA-E, HLA-G, HRAS, ICAM1, ICAM2, IFNA1, IFNA10, IFNA13, IFNA14, IFNA16, IFNA17, IFNA2, IFNA21, IFNA4, IFNA5, IFNA6, IFNA7, IFNA8, IFNAR1, IFNAR2, IFNB1, IFNG, IFNGR1, IFNGR2, ITGAL, ITGB2, KIR2DL1, KIR2DL2, KIR2DL3, KIR2DL4, KIR2DL5A, KIR2DS1, KIR2DS2, KIR3DL1, KIR3DL2, KLRC1, KLRC2, KLRC3, KLRD1, KLRK1, KRAS, LAT, LCK, LCP2, LOC652578, MAP2K1, MAP2K2, MAPK1, MAPK3, MICA, MICB, NCR1, NCR2, NCR3, NFAT5, NFATC1, NFATC2, NFATC3, NFATC4, NRAS, PAK1, PIK3CA, PIK3CB, PIK3CD, PIK3CG, PIK3R1, PIK3R2, PIK3R3, PIK3R5, PLCG1, PLCG2, PPP3CA, PPP3CB, PPP3CC, PPP3R1, PPP3R2, PRF1, PRKCA, PRKCB1, PRKCG, PTK2B, PTPN11, PTPN6, RAC1, RAC2, RAC3, RAF1, SH2D1A, SH2D1B, SH3BP2, SHC1, SHC2, SHC3, SHC4, SOS1, SOS2, SYK, TNF, TNFRSF10A, TNFRSF10B, TNFRSF10C, TNFRSF10D, TNFSF10, TYROBP, ULBP1, ULBP2, ULBP3, VAV1, VAV2, VAV3, ZAP70 | 123 | BRAF(5), CD244(1), CSF2(2), FYN(1), ICAM1(1), ICAM2(1), IFNA10(4), IFNA21(1), IFNB1(1), IFNG(2), IFNGR2(3), ITGB2(4), KIR2DL1(2), KIR2DL3(1), KIR2DL4(1), KIR3DL1(3), KLRC3(2), KLRD1(1), KLRK1(1), KRAS(2), MAP2K1(1), MAPK1(1), MAPK3(1), NCR1(1), NFATC2(2), NFATC4(2), PAK1(1), PIK3CB(4), PIK3CG(5), PIK3R2(3), PIK3R3(1), PIK3R5(3), PLCG1(6), PLCG2(2), PPP3CB(1), PPP3R2(1), PRKCA(1), PRKCG(2), PTK2B(2), PTPN11(4), RAF1(1), SH2D1A(1), SH2D1B(1), SHC4(1), SOS1(3), TNFSF10(2), ULBP1(1), VAV1(3), VAV2(2), VAV3(1), ZAP70(3) | 47276775 | 102 | 78 | 95 | 34 | 30 | 30 | 19 | 9 | 14 | 0 | 0.00024 | 0.049 |
| 4 | ERYTHPATHWAY | Erythropoietin selectively stimulates erythrocyte differentiation from CFU-GEMM cells in bone marrow. | CCL3, CSF2, CSF3, EPO, FLT3, IGF1, IL11, IL1A, IL3, IL6, IL9, KITLG, TGFB1, TGFB2, TGFB3 | 15 | CCL3(1), CSF2(2), EPO(1), FLT3(4), IGF1(2), IL1A(1), IL3(1), IL6(1), KITLG(1) | 3629573 | 14 | 14 | 14 | 1 | 1 | 6 | 5 | 0 | 2 | 0 | 0.00043 | 0.053 |
| 5 | TH1TH2PATHWAY | Helper T subtype Th1 produces pro-inflammatory cytokines that stimulate phagocytosis, while Th2 cells promote antibody production and activate eosinophils. | CD28, CD86, HLA-DRA, HLA-DRB1, IFNG, IFNGR1, IFNGR2, IL12A, IL12B, IL12RB1, IL12RB2, IL18, IL18R1, IL2, IL2RA, IL4, IL4R, TNFRSF5, TNFSF5 | 17 | CD28(1), CD86(2), HLA-DRA(1), IFNG(2), IFNGR2(3), IL12B(1), IL12RB1(2), IL12RB2(1), IL18R1(2), IL4R(4) | 5517896 | 19 | 18 | 19 | 4 | 3 | 8 | 3 | 2 | 3 | 0 | 0.00052 | 0.053 |
| 6 | TOLLPATHWAY | Toll-like receptors are activated by bacterial lipoproteins, lipopolysaccharides, and other surface molecules, and activate pro-inflammatory factors such as NF-kB. | CD14, CHUK, ELK1, FOS, IKBKB, IKBKG, IRAK1, JUN, LY96, MAP2K3, MAP2K4, MAP2K6, MAP3K1, MAP3K14, MAP3K7, MAP3K7IP1, MAP3K7IP2, MAPK14, MAPK8, MYD88, NFKB1, NFKBIA, PGLYRP, PPARA, PRKR, RELA, SITPEC, TIRAP, TLR10, TLR2, TLR3, TLR4, TLR6, TLR7, TLR9, TOLLIP, TRAF6 | 31 | CHUK(1), ELK1(2), FOS(1), IKBKB(1), IRAK1(2), LY96(2), MAP2K3(3), MAP3K1(2), MAP3K7(2), MAPK8(1), NFKB1(1), NFKBIA(1), PPARA(1), TLR10(2), TLR2(3), TLR3(1), TLR4(1), TLR6(5), TLR7(3), TLR9(2), TRAF6(1) | 15827389 | 38 | 37 | 38 | 9 | 9 | 16 | 5 | 2 | 6 | 0 | 0.00052 | 0.053 |
| 7 | HSA04610_COMPLEMENT_AND_COAGULATION_CASCADES | Genes involved in complement and coagulation cascades | A2M, BDKRB1, BDKRB2, C1QA, C1QB, C1QC, C1R, C1S, C2, C3, C3AR1, C4A, C4B, C4BPA, C4BPB, C5, C5AR1, C6, C7, C8A, C8B, C8G, C9, CD46, CD55, CD59, CFB, CFD, CFH, CFI, CPB2, CR1, CR2, F10, F11, F12, F13A1, F13B, F2, F2R, F3, F5, F7, F8, F9, FGA, FGB, FGG, KLKB1, KNG1, MASP1, MASP2, MBL2, PLAT, PLAU, PLAUR, PLG, PROC, PROS1, SERPINA1, SERPINA5, SERPINC1, SERPIND1, SERPINE1, SERPINF2, SERPING1, TFPI, THBD, VWF | 67 | A2M(3), BDKRB1(1), C1QC(1), C1S(2), C2(2), C3(3), C4BPB(1), C5(1), C5AR1(3), C6(1), C8A(1), C8B(3), C9(2), CD46(2), CD55(1), CD59(1), CFB(1), CFH(2), CFI(1), CR2(3), F10(1), F13A1(3), F2(2), F5(4), F8(6), F9(4), FGA(4), FGB(2), FGG(3), KLKB1(1), KNG1(2), MASP2(1), MBL2(1), PLAT(1), PLG(2), SERPINA5(1), SERPINC1(1), SERPING1(2), VWF(5) | 39287991 | 81 | 70 | 81 | 25 | 24 | 29 | 14 | 2 | 12 | 0 | 0.00066 | 0.055 |
| 8 | HSA00472_D_ARGININE_AND_D_ORNITHINE_METABOLISM | Genes involved in D-arginine and D-ornithine metabolism | DAO | 1 | DAO(4) | 312623 | 4 | 4 | 4 | 0 | 2 | 2 | 0 | 0 | 0 | 0 | 0.00071 | 0.055 |
| 9 | ST_DIFFERENTIATION_PATHWAY_IN_PC12_CELLS | Rat-derived PC12 cells respond to nerve growth factor (NGF) and PACAP to differentiate into neuronal cells. | AKT1, ASAH1, ATF1, BRAF, CAMP, CREB1, CREB3, CREB5, CREBBP, CRKL, DAG1, EGR1, EGR2, EGR3, EGR4, ELK1, FRS2, GAS, GNAQ, GRF2, JUN, MAP1B, MAP2K4, MAP2K7, MAPK1, MAPK10, MAPK3, MAPK8, MAPK8IP1, MAPK8IP2, MAPK8IP3, MAPK9, NTRK1, OPN1LW, PACAP, PIK3C2G, PIK3CA, PIK3CD, PIK3R1, PTPN11, RPS6KA3, SH2B, SHC1, SRC, TERF2IP, TH, TUBA3 | 40 | AKT1(1), BRAF(5), CREB1(1), CREBBP(4), CRKL(1), DAG1(2), EGR1(3), EGR2(1), EGR3(1), ELK1(2), MAP1B(2), MAPK1(1), MAPK3(1), MAPK8(1), MAPK8IP1(1), MAPK8IP2(2), MAPK8IP3(2), NTRK1(1), PIK3C2G(6), PTPN11(4), RPS6KA3(1), SRC(2), TERF2IP(1) | 20692311 | 46 | 42 | 42 | 14 | 12 | 14 | 6 | 4 | 10 | 0 | 0.00095 | 0.065 |
| 10 | BADPATHWAY | When phosphorylated, BAD is inhibited by sequestration; when non-phosphorylated, it promotes apoptosis by inactivating pro-survival BCL-XL and BCL-2. | ADCY1, AKT1, BAD, BAX, BCL2, BCL2L1, CSF2RB, IGF1, IGF1R, IL3, IL3RA, KIT, KITLG, PIK3CA, PIK3R1, PRKACB, PRKACG, PRKAR1A, PRKAR1B, PRKAR2A, PRKAR2B, YWHAH | 19 | ADCY1(3), AKT1(1), BCL2(2), CSF2RB(2), IGF1(2), IGF1R(2), IL3(1), KIT(3), KITLG(1), PRKAR1B(1), PRKAR2B(1), YWHAH(1) | 7358109 | 20 | 20 | 20 | 4 | 4 | 7 | 5 | 1 | 3 | 0 | 0.0012 | 0.068 |
In brief, we tabulate the number of mutations and the number of covered bases for each gene. The counts are broken down by mutation context category: four context categories that are discovered by MutSig, and one for indel and 'null' mutations, which include indels, nonsense mutations, splice-site mutations, and non-stop (read-through) mutations. For each gene, we calculate the probability of seeing the observed constellation of mutations, i.e. the product P1 x P2 x ... x Pm, or a more extreme one, given the background mutation rates calculated across the dataset. [1]
This is an experimental feature. The full results of the analysis summarized in this report can be downloaded from the TCGA Data Coordination Center.