(All_Metastatic cohort)
This pipeline computes the correlation between significant copy number variation (cnv focal) genes and selected clinical features.
Testing the association between copy number variation 51 arm-level results and 8 clinical features across 173 patients, one significant finding detected with Q value < 0.25.
-
Amp Peak 8(6p25.1) cnv correlated to 'Time to Death'.
Table 1. Get Full Table Overview of the association between significant copy number variation of 51 arm-level results and 8 clinical features. Shown in the table are P values (Q values). Thresholded by Q value < 0.25, one significant finding detected.
|
Clinical Features |
Time to Death |
AGE |
PRIMARY SITE OF DISEASE |
GENDER |
DISTANT METASTASIS |
LYMPH NODE METASTASIS |
TUMOR STAGECODE |
NEOPLASM DISEASESTAGE |
||
| nCNV (%) | nWild-Type | logrank test | t-test | Fisher's exact test | Fisher's exact test | Chi-square test | Chi-square test | t-test | Chi-square test | |
| Amp Peak 8(6p25 1) | 101 (58%) | 72 |
0.000567 (0.202) |
0.018 (1.00) |
0.203 (1.00) |
0.874 (1.00) |
0.542 (1.00) |
0.0487 (1.00) |
0.556 (1.00) |
|
| Amp Peak 1(1p12) | 51 (29%) | 122 |
0.0284 (1.00) |
0.583 (1.00) |
0.4 (1.00) |
0.61 (1.00) |
0.703 (1.00) |
0.282 (1.00) |
0.289 (1.00) |
|
| Amp Peak 2(1q21 3) | 90 (52%) | 83 |
0.521 (1.00) |
0.97 (1.00) |
0.263 (1.00) |
1 (1.00) |
0.447 (1.00) |
0.259 (1.00) |
0.899 (1.00) |
|
| Amp Peak 3(1q44) | 92 (53%) | 81 |
0.95 (1.00) |
0.886 (1.00) |
0.256 (1.00) |
0.532 (1.00) |
0.472 (1.00) |
0.34 (1.00) |
0.655 (1.00) |
|
| Amp Peak 4(3p13) | 42 (24%) | 131 |
0.287 (1.00) |
0.0604 (1.00) |
0.163 (1.00) |
0.204 (1.00) |
0.611 (1.00) |
0.825 (1.00) |
0.277 (1.00) |
|
| Amp Peak 5(4q12) | 32 (18%) | 141 |
0.388 (1.00) |
0.281 (1.00) |
0.442 (1.00) |
0.55 (1.00) |
0.443 (1.00) |
0.791 (1.00) |
0.791 (1.00) |
|
| Amp Peak 6(5p15 33) | 48 (28%) | 125 |
0.0448 (1.00) |
0.331 (1.00) |
0.132 (1.00) |
1 (1.00) |
0.574 (1.00) |
0.322 (1.00) |
0.334 (1.00) |
|
| Amp Peak 7(5q35 3) | 22 (13%) | 151 |
0.283 (1.00) |
0.162 (1.00) |
0.12 (1.00) |
0.252 (1.00) |
0.11 (1.00) |
0.72 (1.00) |
0.427 (1.00) |
|
| Amp Peak 9(6q12) | 37 (21%) | 136 |
0.294 (1.00) |
0.68 (1.00) |
0.585 (1.00) |
0.705 (1.00) |
0.725 (1.00) |
0.271 (1.00) |
0.192 (1.00) |
|
| Amp Peak 10(7p22 3) | 96 (55%) | 77 |
0.159 (1.00) |
0.756 (1.00) |
0.749 (1.00) |
0.348 (1.00) |
0.277 (1.00) |
0.395 (1.00) |
0.191 (1.00) |
|
| Amp Peak 11(7q34) | 99 (57%) | 74 |
0.83 (1.00) |
0.343 (1.00) |
0.549 (1.00) |
0.433 (1.00) |
0.328 (1.00) |
0.249 (1.00) |
0.0169 (1.00) |
|
| Amp Peak 12(8q11 21) | 70 (40%) | 103 |
0.321 (1.00) |
0.104 (1.00) |
0.326 (1.00) |
0.753 (1.00) |
0.135 (1.00) |
0.846 (1.00) |
0.733 (1.00) |
|
| Amp Peak 13(8q24 21) | 82 (47%) | 91 |
0.792 (1.00) |
0.198 (1.00) |
0.453 (1.00) |
0.64 (1.00) |
0.208 (1.00) |
0.936 (1.00) |
0.88 (1.00) |
|
| Amp Peak 14(9p24 1) | 13 (8%) | 160 |
0.935 (1.00) |
0.869 (1.00) |
0.0575 (1.00) |
0.568 (1.00) |
0.0294 (1.00) |
0.371 (1.00) |
0.0933 (1.00) |
|
| Amp Peak 15(11q13 3) | 29 (17%) | 144 |
0.593 (1.00) |
0.199 (1.00) |
0.531 (1.00) |
0.213 (1.00) |
0.798 (1.00) |
0.571 (1.00) |
0.787 (1.00) |
|
| Amp Peak 16(11q13 4) | 28 (16%) | 145 |
0.733 (1.00) |
0.622 (1.00) |
0.519 (1.00) |
0.291 (1.00) |
0.565 (1.00) |
0.312 (1.00) |
0.835 (1.00) |
|
| Amp Peak 17(12q14 1) | 30 (17%) | 143 |
0.97 (1.00) |
0.423 (1.00) |
0.777 (1.00) |
1 (1.00) |
0.604 (1.00) |
0.217 (1.00) |
0.0704 (1.00) |
|
| Amp Peak 18(12q15) | 24 (14%) | 149 |
0.582 (1.00) |
0.379 (1.00) |
0.687 (1.00) |
0.501 (1.00) |
0.838 (1.00) |
0.0548 (1.00) |
0.12 (1.00) |
|
| Amp Peak 19(15q24 3) | 58 (34%) | 115 |
0.862 (1.00) |
0.544 (1.00) |
0.825 (1.00) |
1 (1.00) |
0.511 (1.00) |
0.27 (1.00) |
0.0479 (1.00) |
|
| Amp Peak 20(17q25 3) | 66 (38%) | 107 |
0.865 (1.00) |
0.0124 (1.00) |
1 (1.00) |
0.152 (1.00) |
0.812 (1.00) |
0.542 (1.00) |
0.652 (1.00) |
|
| Amp Peak 21(19p13 2) | 34 (20%) | 139 |
0.674 (1.00) |
0.792 (1.00) |
0.517 (1.00) |
0.438 (1.00) |
0.00193 (0.688) |
0.73 (1.00) |
0.342 (1.00) |
|
| Amp Peak 22(20q13 2) | 90 (52%) | 83 |
0.52 (1.00) |
0.197 (1.00) |
0.423 (1.00) |
0.435 (1.00) |
0.208 (1.00) |
0.687 (1.00) |
0.0667 (1.00) |
|
| Amp Peak 23(22q13 2) | 79 (46%) | 94 |
0.553 (1.00) |
0.982 (1.00) |
0.445 (1.00) |
1 (1.00) |
0.999 (1.00) |
0.311 (1.00) |
0.585 (1.00) |
|
| Amp Peak 24(Xq28) | 30 (17%) | 143 |
0.422 (1.00) |
0.255 (1.00) |
0.556 (1.00) |
0.0982 (1.00) |
0.597 (1.00) |
0.907 (1.00) |
0.663 (1.00) |
|
| Del Peak 1(1p36 31) | 46 (27%) | 127 |
0.541 (1.00) |
0.679 (1.00) |
0.584 (1.00) |
0.159 (1.00) |
0.102 (1.00) |
0.583 (1.00) |
0.855 (1.00) |
|
| Del Peak 2(1p22 1) | 46 (27%) | 127 |
0.969 (1.00) |
0.0166 (1.00) |
0.277 (1.00) |
1 (1.00) |
0.102 (1.00) |
0.393 (1.00) |
0.361 (1.00) |
|
| Del Peak 3(2q37 3) | 44 (25%) | 129 |
0.384 (1.00) |
0.312 (1.00) |
0.15 (1.00) |
0.37 (1.00) |
0.0637 (1.00) |
0.641 (1.00) |
0.456 (1.00) |
|
| Del Peak 4(3q23) | 24 (14%) | 149 |
0.563 (1.00) |
0.135 (1.00) |
1 (1.00) |
0.261 (1.00) |
0.00274 (0.974) |
0.582 (1.00) |
0.251 (1.00) |
|
| Del Peak 5(4q22 1) | 35 (20%) | 138 |
0.542 (1.00) |
0.0309 (1.00) |
0.0689 (1.00) |
0.119 (1.00) |
0.0413 (1.00) |
0.164 (1.00) |
0.372 (1.00) |
|
| Del Peak 6(4q34 3) | 44 (25%) | 129 |
0.373 (1.00) |
0.155 (1.00) |
0.0847 (1.00) |
0.0192 (1.00) |
0.102 (1.00) |
0.902 (1.00) |
0.125 (1.00) |
|
| Del Peak 7(5q11 2) | 54 (31%) | 119 |
0.322 (1.00) |
0.269 (1.00) |
0.485 (1.00) |
0.738 (1.00) |
0.204 (1.00) |
0.668 (1.00) |
0.499 (1.00) |
|
| Del Peak 8(5q31 3) | 69 (40%) | 104 |
0.161 (1.00) |
0.825 (1.00) |
0.736 (1.00) |
0.751 (1.00) |
0.354 (1.00) |
0.589 (1.00) |
0.835 (1.00) |
|
| Del Peak 9(6q26) | 104 (60%) | 69 |
0.0429 (1.00) |
0.158 (1.00) |
0.231 (1.00) |
0.634 (1.00) |
0.812 (1.00) |
0.285 (1.00) |
0.91 (1.00) |
|
| Del Peak 10(8p23 3) | 42 (24%) | 131 |
0.113 (1.00) |
0.0978 (1.00) |
0.156 (1.00) |
0.146 (1.00) |
0.554 (1.00) |
0.286 (1.00) |
0.422 (1.00) |
|
| Del Peak 11(9p23) | 121 (70%) | 52 |
0.136 (1.00) |
0.901 (1.00) |
0.208 (1.00) |
0.311 (1.00) |
0.192 (1.00) |
0.351 (1.00) |
0.495 (1.00) |
|
| Del Peak 12(9p21 3) | 137 (79%) | 36 |
0.233 (1.00) |
0.46 (1.00) |
0.187 (1.00) |
0.178 (1.00) |
0.622 (1.00) |
0.275 (1.00) |
0.595 (1.00) |
|
| Del Peak 13(10p15 3) | 92 (53%) | 81 |
0.136 (1.00) |
0.18 (1.00) |
0.121 (1.00) |
0.349 (1.00) |
0.396 (1.00) |
0.611 (1.00) |
0.876 (1.00) |
|
| Del Peak 14(10q23 31) | 107 (62%) | 66 |
0.436 (1.00) |
0.0421 (1.00) |
0.123 (1.00) |
0.0065 (1.00) |
0.589 (1.00) |
0.87 (1.00) |
0.612 (1.00) |
|
| Del Peak 15(10q26 3) | 107 (62%) | 66 |
0.964 (1.00) |
0.00584 (1.00) |
0.0151 (1.00) |
0.0065 (1.00) |
0.216 (1.00) |
0.948 (1.00) |
0.814 (1.00) |
|
| Del Peak 16(11q23 3) | 101 (58%) | 72 |
0.637 (1.00) |
0.416 (1.00) |
0.0578 (1.00) |
0.429 (1.00) |
0.802 (1.00) |
0.0117 (1.00) |
0.215 (1.00) |
|
| Del Peak 17(12p13 31) | 23 (13%) | 150 |
0.298 (1.00) |
0.206 (1.00) |
0.783 (1.00) |
0.65 (1.00) |
0.516 (1.00) |
0.238 (1.00) |
0.551 (1.00) |
|
| Del Peak 18(12q23 3) | 38 (22%) | 135 |
0.76 (1.00) |
0.453 (1.00) |
0.247 (1.00) |
0.452 (1.00) |
0.479 (1.00) |
0.18 (1.00) |
0.996 (1.00) |
|
| Del Peak 19(12q24 33) | 39 (23%) | 134 |
0.964 (1.00) |
0.588 (1.00) |
0.242 (1.00) |
0.351 (1.00) |
0.554 (1.00) |
0.182 (1.00) |
0.82 (1.00) |
|
| Del Peak 20(13q34) | 42 (24%) | 131 |
0.919 (1.00) |
0.796 (1.00) |
0.155 (1.00) |
0.469 (1.00) |
0.00845 (1.00) |
0.157 (1.00) |
0.0897 (1.00) |
|
| Del Peak 21(14q32 2) | 58 (34%) | 115 |
0.202 (1.00) |
0.669 (1.00) |
0.608 (1.00) |
0.741 (1.00) |
0.193 (1.00) |
0.51 (1.00) |
0.0918 (1.00) |
|
| Del Peak 22(15q13 3) | 40 (23%) | 133 |
0.612 (1.00) |
0.665 (1.00) |
0.749 (1.00) |
0.361 (1.00) |
0.568 (1.00) |
0.566 (1.00) |
0.737 (1.00) |
|
| Del Peak 23(15q15 3) | 39 (23%) | 134 |
0.345 (1.00) |
0.858 (1.00) |
0.631 (1.00) |
0.191 (1.00) |
0.554 (1.00) |
0.808 (1.00) |
0.74 (1.00) |
|
| Del Peak 24(16p13 3) | 32 (18%) | 141 |
0.62 (1.00) |
0.187 (1.00) |
0.2 (1.00) |
0.0728 (1.00) |
0.77 (1.00) |
0.21 (1.00) |
0.706 (1.00) |
|
| Del Peak 25(16q12 1) | 58 (34%) | 115 |
0.936 (1.00) |
0.634 (1.00) |
0.149 (1.00) |
0.252 (1.00) |
0.646 (1.00) |
0.759 (1.00) |
0.289 (1.00) |
|
| Del Peak 26(16q24 3) | 62 (36%) | 111 |
0.472 (1.00) |
0.306 (1.00) |
0.28 (1.00) |
0.199 (1.00) |
0.629 (1.00) |
0.093 (1.00) |
0.0994 (1.00) |
|
| Del Peak 27(19p13 3) | 53 (31%) | 120 |
0.442 (1.00) |
0.911 (1.00) |
0.186 (1.00) |
0.31 (1.00) |
0.18 (1.00) |
0.819 (1.00) |
0.607 (1.00) |
P value = 0.000567 (logrank test), Q value = 0.2
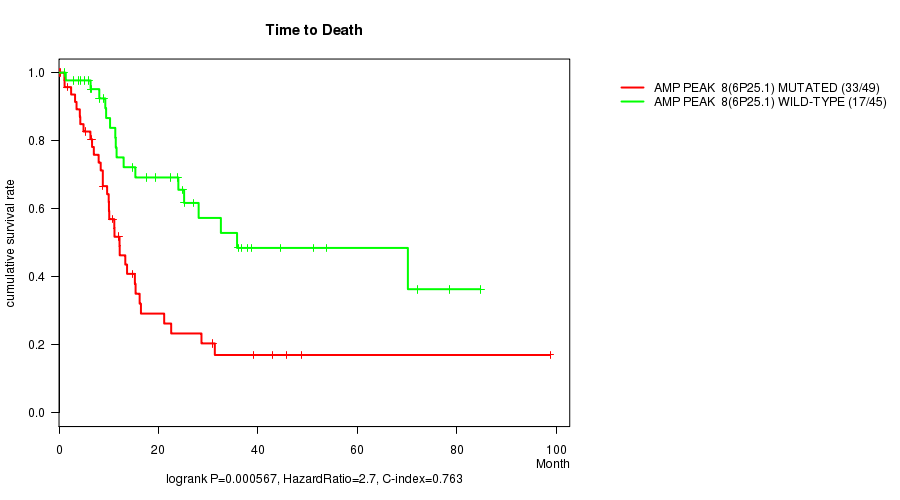
Table S1. Gene #8: 'Amp Peak 8(6p25.1) mutation analysis' versus Clinical Feature #1: 'Time to Death'
| nPatients | nDeath | Duration Range (Median), Month | |
|---|---|---|---|
| ALL | 94 | 50 | 0.1 - 98.8 (11.5) |
| AMP PEAK 8(6P25.1) MUTATED | 49 | 33 | 0.1 - 98.8 (10.0) |
| AMP PEAK 8(6P25.1) WILD-TYPE | 45 | 17 | 1.0 - 84.7 (17.6) |
Figure S1. Get High-res Image Gene #8: 'Amp Peak 8(6p25.1) mutation analysis' versus Clinical Feature #1: 'Time to Death'
-
Mutation data file = all_lesions.conf_99.cnv.cluster.txt
-
Clinical data file = SKCM-All_Metastatic.clin.merged.picked.txt
-
Number of patients = 173
-
Number of significantly arm-level cnvs = 51
-
Number of selected clinical features = 8
-
Exclude genes that fewer than K tumors have mutations, K = 3
For survival clinical features, the Kaplan-Meier survival curves of tumors with and without gene mutations were plotted and the statistical significance P values were estimated by logrank test (Bland and Altman 2004) using the 'survdiff' function in R
For continuous numerical clinical features, two-tailed Student's t test with unequal variance (Lehmann and Romano 2005) was applied to compare the clinical values between tumors with and without gene mutations using 't.test' function in R
For binary or multi-class clinical features (nominal or ordinal), two-tailed Fisher's exact tests (Fisher 1922) were used to estimate the P values using the 'fisher.test' function in R
For multi-class clinical features (nominal or ordinal), Chi-square tests (Greenwood and Nikulin 1996) were used to estimate the P values using the 'chisq.test' function in R
For multiple hypothesis correction, Q value is the False Discovery Rate (FDR) analogue of the P value (Benjamini and Hochberg 1995), defined as the minimum FDR at which the test may be called significant. We used the 'Benjamini and Hochberg' method of 'p.adjust' function in R to convert P values into Q values.
This is an experimental feature. The full results of the analysis summarized in this report can be downloaded from the TCGA Data Coordination Center.