(All_Metastatic cohort)
This pipeline uses various statistical tests to identify genes whose promoter methylation levels correlated to selected clinical features.
Testing the association between 17129 genes and 7 clinical features across 168 samples, statistically thresholded by Q value < 0.05, 7 clinical features related to at least one genes.
-
1 gene correlated to 'Time to Death'.
-
NR4A3
-
7 genes correlated to 'AGE'.
-
ITGA8 , PTX3 , RSPO4 , SHANK1 , TRPV4 , ...
-
241 genes correlated to 'PRIMARY.SITE.OF.DISEASE'.
-
DAZAP1 , TCF3 , IRAK4 , PUS7L , TCF25 , ...
-
1 gene correlated to 'GENDER'.
-
DDX43
-
248 genes correlated to 'DISTANT.METASTASIS'.
-
SELT , LMF1 , FAM186A , LDHAL6B , CCNG1 , ...
-
50 genes correlated to 'LYMPH.NODE.METASTASIS'.
-
NGLY1 , C6ORF162 , LIMK2 , AP2S1 , C17ORF63 , ...
-
8 genes correlated to 'NEOPLASM.DISEASESTAGE'.
-
TTN , POLE4 , ZNF587 , RAD21L1 , C4ORF3 , ...
Complete statistical result table is provided in Supplement Table 1
Table 1. Get Full Table This table shows the clinical features, statistical methods used, and the number of genes that are significantly associated with each clinical feature at Q value < 0.05.
| Clinical feature | Statistical test | Significant genes | Associated with | Associated with | ||
|---|---|---|---|---|---|---|
| Time to Death | Cox regression test | N=1 | shorter survival | N=0 | longer survival | N=1 |
| AGE | Spearman correlation test | N=7 | older | N=7 | younger | N=0 |
| PRIMARY SITE OF DISEASE | ANOVA test | N=241 | ||||
| GENDER | t test | N=1 | male | N=0 | female | N=1 |
| DISTANT METASTASIS | ANOVA test | N=248 | ||||
| LYMPH NODE METASTASIS | ANOVA test | N=50 | ||||
| NEOPLASM DISEASESTAGE | ANOVA test | N=8 |
Table S1. Basic characteristics of clinical feature: 'Time to Death'
| Time to Death | Duration (Months) | 0.2-357.4 (median=47.5) |
| censored | N = 81 | |
| death | N = 84 | |
| Significant markers | N = 1 | |
| associated with shorter survival | 0 | |
| associated with longer survival | 1 |
Table S2. Get Full Table List of one gene significantly associated with 'Time to Death' by Cox regression test
| HazardRatio | Wald_P | Q | C_index | |
|---|---|---|---|---|
| NR4A3 | 0.08 | 1.586e-06 | 0.027 | 0.334 |
Figure S1. Get High-res Image As an example, this figure shows the association of NR4A3 to 'Time to Death'. four curves present the cumulative survival rates of 4 quartile subsets of patients. P value = 1.59e-06 with univariate Cox regression analysis using continuous log-2 expression values.
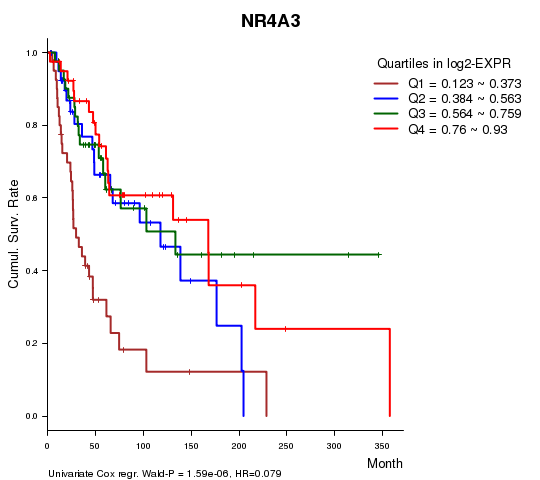
Table S3. Basic characteristics of clinical feature: 'AGE'
| AGE | Mean (SD) | 55.92 (16) |
| Significant markers | N = 7 | |
| pos. correlated | 7 | |
| neg. correlated | 0 |
Table S4. Get Full Table List of 7 genes significantly correlated to 'AGE' by Spearman correlation test
| SpearmanCorr | corrP | Q | |
|---|---|---|---|
| ITGA8 | 0.4068 | 4.881e-08 | 0.000836 |
| PTX3 | 0.4035 | 6.408e-08 | 0.0011 |
| RSPO4 | 0.3758 | 5.59e-07 | 0.00957 |
| SHANK1 | 0.37 | 8.581e-07 | 0.0147 |
| TRPV4 | 0.3689 | 9.339e-07 | 0.016 |
| CTAGE5 | 0.358 | 2.035e-06 | 0.0348 |
| MCHR1 | 0.3539 | 2.707e-06 | 0.0463 |
Figure S2. Get High-res Image As an example, this figure shows the association of ITGA8 to 'AGE'. P value = 4.88e-08 with Spearman correlation analysis. The straight line presents the best linear regression.
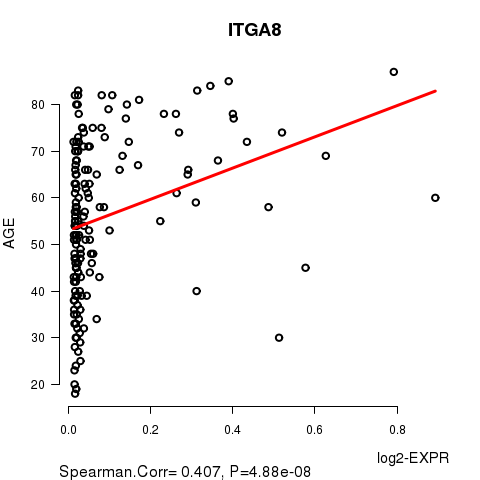
Table S5. Basic characteristics of clinical feature: 'PRIMARY.SITE.OF.DISEASE'
| PRIMARY.SITE.OF.DISEASE | Labels | N |
| DISTANT METASTASIS | 25 | |
| PRIMARY TUMOR | 1 | |
| REGIONAL CUTANEOUS OR SUBCUTANEOUS TISSUE (INCLUDES SATELLITE AND IN-TRANSIT METASTASIS) | 32 | |
| REGIONAL LYMPH NODE | 110 | |
| Significant markers | N = 241 |
Table S6. Get Full Table List of top 10 genes differentially expressed by 'PRIMARY.SITE.OF.DISEASE'
| ANOVA_P | Q | |
|---|---|---|
| DAZAP1 | 1.44e-106 | 2.47e-102 |
| TCF3 | 3.169e-51 | 5.43e-47 |
| IRAK4 | 8.746e-50 | 1.5e-45 |
| PUS7L | 8.746e-50 | 1.5e-45 |
| TCF25 | 1.921e-46 | 3.29e-42 |
| AMY2B | 5.344e-43 | 9.15e-39 |
| NCRNA00175 | 3.823e-42 | 6.55e-38 |
| TUBGCP6 | 2.041e-39 | 3.49e-35 |
| JPH3 | 1.034e-36 | 1.77e-32 |
| ACRV1 | 1.312e-33 | 2.25e-29 |
Figure S3. Get High-res Image As an example, this figure shows the association of DAZAP1 to 'PRIMARY.SITE.OF.DISEASE'. P value = 1.44e-106 with ANOVA analysis.
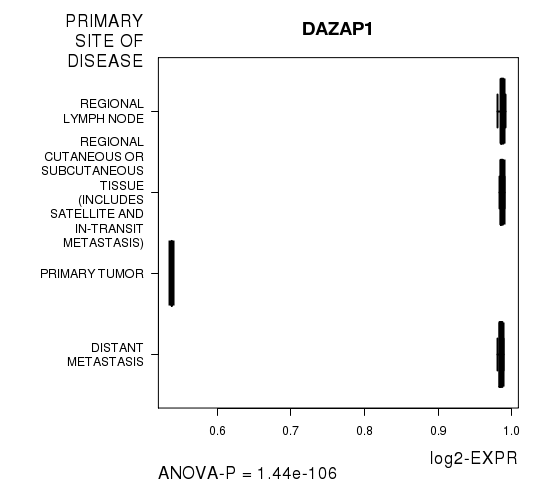
Table S7. Basic characteristics of clinical feature: 'GENDER'
| GENDER | Labels | N |
| FEMALE | 65 | |
| MALE | 103 | |
| Significant markers | N = 1 | |
| Higher in MALE | 0 | |
| Higher in FEMALE | 1 |
Table S8. Get Full Table List of one gene differentially expressed by 'GENDER'
| T(pos if higher in 'MALE') | ttestP | Q | AUC | |
|---|---|---|---|---|
| DDX43 | -4.94 | 1.914e-06 | 0.0328 | 0.7289 |
Figure S4. Get High-res Image As an example, this figure shows the association of DDX43 to 'GENDER'. P value = 1.91e-06 with T-test analysis.
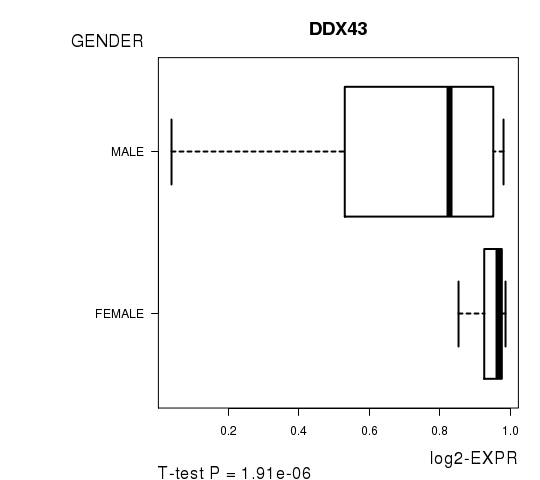
Table S9. Basic characteristics of clinical feature: 'DISTANT.METASTASIS'
| DISTANT.METASTASIS | Labels | N |
| M0 | 145 | |
| M1 | 2 | |
| M1A | 2 | |
| M1B | 2 | |
| M1C | 2 | |
| Significant markers | N = 248 |
Table S10. Get Full Table List of top 10 genes differentially expressed by 'DISTANT.METASTASIS'
| ANOVA_P | Q | |
|---|---|---|
| SELT | 1.308e-21 | 2.24e-17 |
| LMF1 | 4.98e-21 | 8.53e-17 |
| FAM186A | 7.522e-21 | 1.29e-16 |
| LDHAL6B | 7.709e-21 | 1.32e-16 |
| CCNG1 | 1.642e-20 | 2.81e-16 |
| RASA2 | 1.03e-19 | 1.76e-15 |
| C10ORF88 | 2.823e-19 | 4.83e-15 |
| ACSS1 | 5.263e-18 | 9.01e-14 |
| MDM1 | 4.519e-17 | 7.74e-13 |
| PSMA5 | 1.808e-16 | 3.09e-12 |
Figure S5. Get High-res Image As an example, this figure shows the association of SELT to 'DISTANT.METASTASIS'. P value = 1.31e-21 with ANOVA analysis.
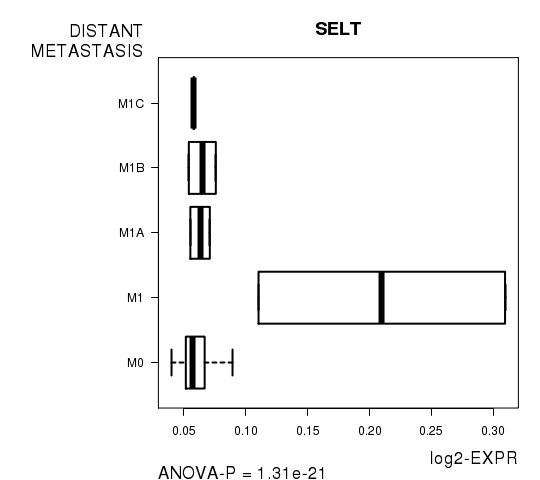
Table S11. Basic characteristics of clinical feature: 'LYMPH.NODE.METASTASIS'
| LYMPH.NODE.METASTASIS | Labels | N |
| N0 | 94 | |
| N1 | 2 | |
| N1A | 6 | |
| N1B | 15 | |
| N2 | 1 | |
| N2A | 4 | |
| N2B | 10 | |
| N2C | 5 | |
| N3 | 15 | |
| NX | 2 | |
| Significant markers | N = 50 |
Table S12. Get Full Table List of top 10 genes differentially expressed by 'LYMPH.NODE.METASTASIS'
| ANOVA_P | Q | |
|---|---|---|
| NGLY1 | 2.374e-62 | 4.07e-58 |
| C6ORF162 | 8.021e-39 | 1.37e-34 |
| LIMK2 | 2.75e-36 | 4.71e-32 |
| AP2S1 | 2.627e-27 | 4.5e-23 |
| C17ORF63 | 1.171e-23 | 2.01e-19 |
| NOS1 | 1.906e-22 | 3.26e-18 |
| CSRP2BP | 7.661e-19 | 1.31e-14 |
| GPR44 | 9.696e-17 | 1.66e-12 |
| NHEDC1 | 2.101e-16 | 3.6e-12 |
| RRAGA | 1.921e-14 | 3.29e-10 |
Figure S6. Get High-res Image As an example, this figure shows the association of NGLY1 to 'LYMPH.NODE.METASTASIS'. P value = 2.37e-62 with ANOVA analysis.
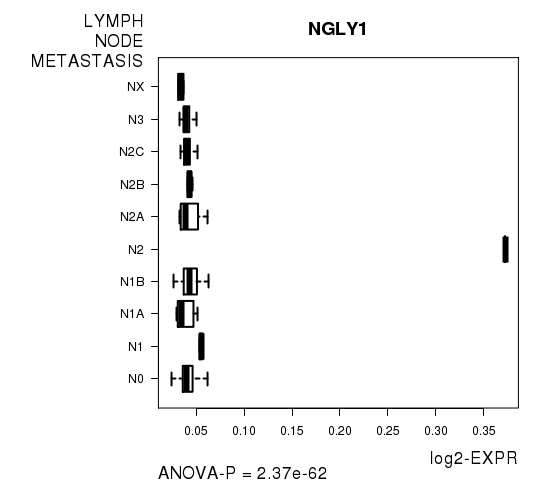
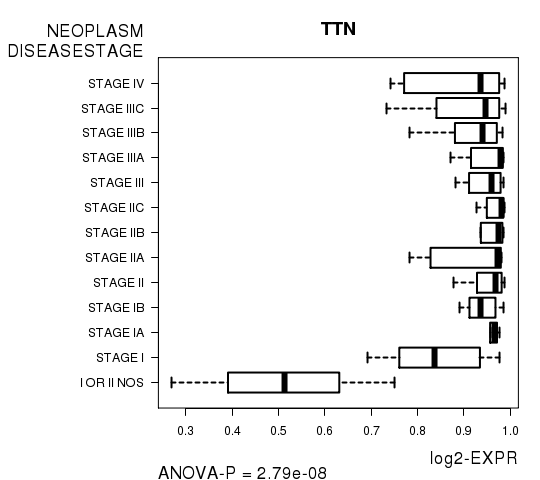
Table S13. Basic characteristics of clinical feature: 'NEOPLASM.DISEASESTAGE'
| NEOPLASM.DISEASESTAGE | Labels | N |
| I OR II NOS | 3 | |
| STAGE I | 17 | |
| STAGE IA | 10 | |
| STAGE IB | 14 | |
| STAGE II | 19 | |
| STAGE IIA | 8 | |
| STAGE IIB | 10 | |
| STAGE IIC | 8 | |
| STAGE III | 8 | |
| STAGE IIIA | 5 | |
| STAGE IIIB | 17 | |
| STAGE IIIC | 22 | |
| STAGE IV | 6 | |
| Significant markers | N = 8 |
Table S14. Get Full Table List of 8 genes differentially expressed by 'NEOPLASM.DISEASESTAGE'
| ANOVA_P | Q | |
|---|---|---|
| TTN | 2.791e-08 | 0.000478 |
| POLE4 | 1.569e-07 | 0.00269 |
| ZNF587 | 2.055e-07 | 0.00352 |
| RAD21L1 | 5.511e-07 | 0.00944 |
| C4ORF3 | 6.158e-07 | 0.0105 |
| GRAMD1B | 1.111e-06 | 0.019 |
| MME | 1.414e-06 | 0.0242 |
| UBE2I | 2.051e-06 | 0.0351 |
Figure S7. Get High-res Image As an example, this figure shows the association of TTN to 'NEOPLASM.DISEASESTAGE'. P value = 2.79e-08 with ANOVA analysis.
-
Expresson data file = SKCM-All_Metastatic.meth.for_correlation.filtered_data.txt
-
Clinical data file = SKCM-All_Metastatic.clin.merged.picked.txt
-
Number of patients = 168
-
Number of genes = 17129
-
Number of clinical features = 7
For survival clinical features, Wald's test in univariate Cox regression analysis with proportional hazards model (Andersen and Gill 1982) was used to estimate the P values using the 'coxph' function in R. Kaplan-Meier survival curves were plot using the four quartile subgroups of patients based on expression levels
For continuous numerical clinical features, Spearman's rank correlation coefficients (Spearman 1904) and two-tailed P values were estimated using 'cor.test' function in R
For multi-class clinical features (ordinal or nominal), one-way analysis of variance (Howell 2002) was applied to compare the log2-expression levels between different clinical classes using 'anova' function in R
For two-class clinical features, two-tailed Student's t test with unequal variance (Lehmann and Romano 2005) was applied to compare the log2-expression levels between the two clinical classes using 't.test' function in R
For multiple hypothesis correction, Q value is the False Discovery Rate (FDR) analogue of the P value (Benjamini and Hochberg 1995), defined as the minimum FDR at which the test may be called significant. We used the 'Benjamini and Hochberg' method of 'p.adjust' function in R to convert P values into Q values.
This is an experimental feature. The full results of the analysis summarized in this report can be downloaded from the TCGA Data Coordination Center.