(All_Primary cohort)
This pipeline computes the correlation between significant arm-level copy number variations (cnvs) and subtypes.
Testing the association between copy number variation 47 arm-level results and 8 molecular subtypes across 46 patients, 3 significant findings detected with Q value < 0.25.
-
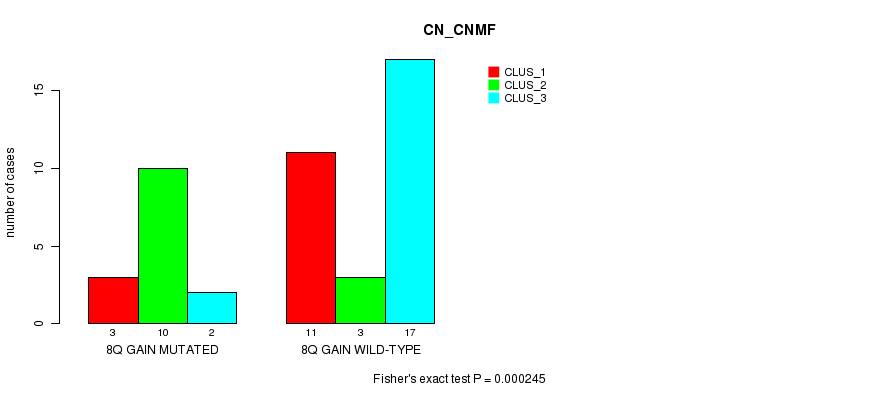
8q gain cnv correlated to 'CN_CNMF'.
-
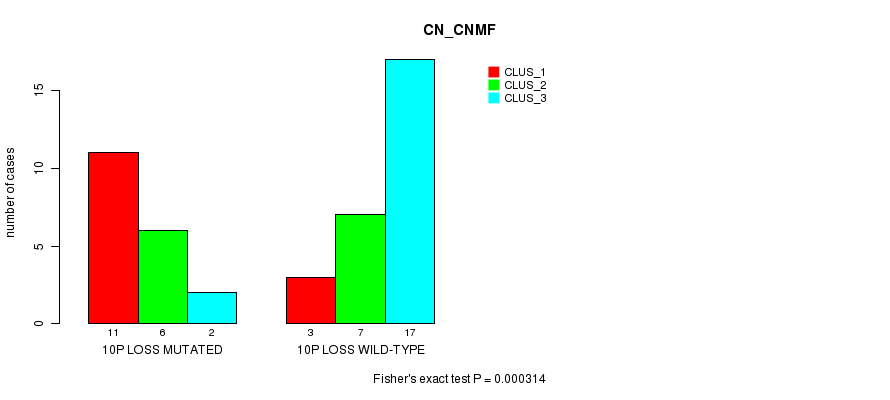
10p loss cnv correlated to 'CN_CNMF'.
-
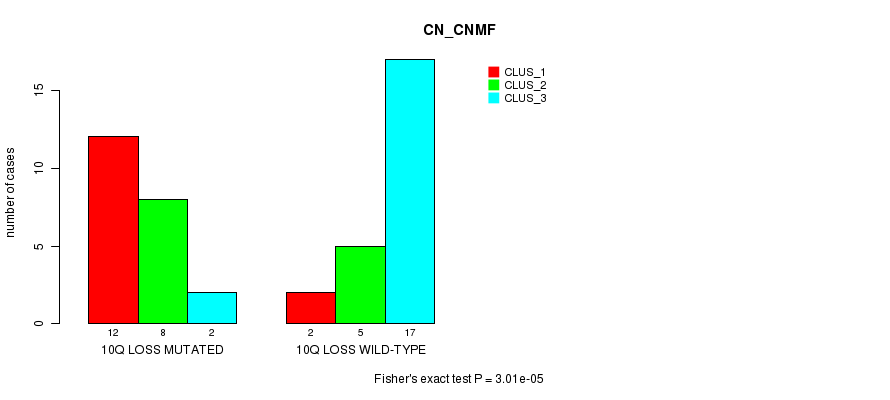
10q loss cnv correlated to 'CN_CNMF'.
Table 1. Get Full Table Overview of the association between significant copy number variation of 47 arm-level results and 8 molecular subtypes. Shown in the table are P values (Q values). Thresholded by Q value < 0.25, 3 significant findings detected.
|
Molecular subtypes |
CN CNMF |
METHLYATION CNMF |
RPPA CNMF |
RPPA CHIERARCHICAL |
MRNASEQ CNMF |
MRNASEQ CHIERARCHICAL |
MIRSEQ CNMF |
MIRSEQ CHIERARCHICAL |
||
| nCNV (%) | nWild-Type | Fisher's exact test | Chi-square test | Fisher's exact test | Fisher's exact test | Fisher's exact test | Fisher's exact test | Fisher's exact test | Fisher's exact test | |
| 8q gain | 15 (33%) | 31 |
0.000245 (0.0831) |
0.882 (1.00) |
0.814 (1.00) |
0.814 (1.00) |
1 (1.00) |
0.608 (1.00) |
0.546 (1.00) |
0.916 (1.00) |
| 10p loss | 19 (41%) | 27 |
0.000314 (0.106) |
0.508 (1.00) |
0.0867 (1.00) |
0.0867 (1.00) |
1 (1.00) |
1 (1.00) |
0.0752 (1.00) |
1 (1.00) |
| 10q loss | 22 (48%) | 24 |
3.01e-05 (0.0102) |
0.0417 (1.00) |
0.0867 (1.00) |
0.0867 (1.00) |
0.755 (1.00) |
0.804 (1.00) |
0.0377 (1.00) |
0.406 (1.00) |
| 1p gain | 5 (11%) | 41 |
0.852 (1.00) |
0.771 (1.00) |
0.4 (1.00) |
0.4 (1.00) |
0.635 (1.00) |
0.754 (1.00) |
0.652 (1.00) |
1 (1.00) |
| 1q gain | 12 (26%) | 34 |
0.0623 (1.00) |
0.47 (1.00) |
1 (1.00) |
1 (1.00) |
0.494 (1.00) |
0.461 (1.00) |
1 (1.00) |
0.755 (1.00) |
| 3p gain | 3 (7%) | 43 |
1 (1.00) |
0.474 (1.00) |
0.574 (1.00) |
0.574 (1.00) |
0.282 (1.00) |
0.631 (1.00) |
1 (1.00) |
0.0973 (1.00) |
| 3q gain | 3 (7%) | 43 |
1 (1.00) |
0.474 (1.00) |
0.574 (1.00) |
0.574 (1.00) |
0.282 (1.00) |
0.631 (1.00) |
1 (1.00) |
0.0973 (1.00) |
| 4p gain | 3 (7%) | 43 |
0.614 (1.00) |
0.421 (1.00) |
0.282 (1.00) |
0.631 (1.00) |
1 (1.00) |
1 (1.00) |
||
| 5p gain | 7 (15%) | 39 |
0.447 (1.00) |
0.39 (1.00) |
0.296 (1.00) |
0.296 (1.00) |
1 (1.00) |
0.814 (1.00) |
1 (1.00) |
0.868 (1.00) |
| 5q gain | 3 (7%) | 43 |
0.614 (1.00) |
0.866 (1.00) |
1 (1.00) |
1 (1.00) |
1 (1.00) |
0.406 (1.00) |
||
| 6p gain | 14 (30%) | 32 |
0.0276 (1.00) |
0.00944 (1.00) |
1 (1.00) |
1 (1.00) |
0.737 (1.00) |
0.305 (1.00) |
0.0977 (1.00) |
0.184 (1.00) |
| 6q gain | 3 (7%) | 43 |
0.354 (1.00) |
0.866 (1.00) |
0.133 (1.00) |
0.212 (1.00) |
||||
| 7p gain | 19 (41%) | 27 |
0.93 (1.00) |
0.147 (1.00) |
0.277 (1.00) |
0.277 (1.00) |
1 (1.00) |
0.886 (1.00) |
0.543 (1.00) |
0.582 (1.00) |
| 7q gain | 18 (39%) | 28 |
0.743 (1.00) |
0.117 (1.00) |
0.53 (1.00) |
0.53 (1.00) |
1 (1.00) |
0.886 (1.00) |
0.759 (1.00) |
0.923 (1.00) |
| 8p gain | 7 (15%) | 39 |
0.257 (1.00) |
0.525 (1.00) |
0.302 (1.00) |
0.302 (1.00) |
0.695 (1.00) |
0.331 (1.00) |
1 (1.00) |
0.124 (1.00) |
| 13q gain | 4 (9%) | 42 |
0.207 (1.00) |
0.104 (1.00) |
0.621 (1.00) |
0.344 (1.00) |
0.326 (1.00) |
1 (1.00) |
||
| 18p gain | 7 (15%) | 39 |
0.526 (1.00) |
0.88 (1.00) |
0.789 (1.00) |
0.789 (1.00) |
0.0346 (1.00) |
0.0903 (1.00) |
1 (1.00) |
0.868 (1.00) |
| 18q gain | 8 (17%) | 38 |
0.554 (1.00) |
0.628 (1.00) |
0.296 (1.00) |
0.296 (1.00) |
0.229 (1.00) |
0.519 (1.00) |
0.705 (1.00) |
0.889 (1.00) |
| 20p gain | 9 (20%) | 37 |
0.516 (1.00) |
0.447 (1.00) |
0.474 (1.00) |
0.474 (1.00) |
0.446 (1.00) |
0.0807 (1.00) |
0.469 (1.00) |
0.702 (1.00) |
| 20q gain | 11 (24%) | 35 |
0.281 (1.00) |
0.821 (1.00) |
0.474 (1.00) |
0.474 (1.00) |
0.494 (1.00) |
0.157 (1.00) |
0.503 (1.00) |
0.556 (1.00) |
| 21q gain | 3 (7%) | 43 |
0.614 (1.00) |
0.474 (1.00) |
1 (1.00) |
0.14 (1.00) |
0.236 (1.00) |
0.795 (1.00) |
||
| 22q gain | 5 (11%) | 41 |
1 (1.00) |
0.581 (1.00) |
0.15 (1.00) |
0.15 (1.00) |
0.621 (1.00) |
0.344 (1.00) |
1 (1.00) |
0.828 (1.00) |
| 2p loss | 5 (11%) | 41 |
0.0277 (1.00) |
0.581 (1.00) |
0.0545 (1.00) |
0.0545 (1.00) |
1 (1.00) |
0.414 (1.00) |
0.652 (1.00) |
0.611 (1.00) |
| 2q loss | 4 (9%) | 42 |
0.0878 (1.00) |
0.515 (1.00) |
0.15 (1.00) |
0.15 (1.00) |
0.621 (1.00) |
0.344 (1.00) |
0.326 (1.00) |
0.667 (1.00) |
| 4p loss | 7 (15%) | 39 |
0.781 (1.00) |
0.161 (1.00) |
0.695 (1.00) |
1 (1.00) |
0.689 (1.00) |
1 (1.00) |
||
| 4q loss | 9 (20%) | 37 |
0.178 (1.00) |
0.134 (1.00) |
0.763 (1.00) |
0.763 (1.00) |
1 (1.00) |
1 (1.00) |
0.267 (1.00) |
0.797 (1.00) |
| 5q loss | 6 (13%) | 40 |
0.4 (1.00) |
0.246 (1.00) |
1 (1.00) |
1 (1.00) |
0.67 (1.00) |
0.539 (1.00) |
||
| 6q loss | 15 (33%) | 31 |
0.0322 (1.00) |
0.598 (1.00) |
0.289 (1.00) |
0.289 (1.00) |
0.735 (1.00) |
0.158 (1.00) |
0.752 (1.00) |
0.66 (1.00) |
| 8p loss | 11 (24%) | 35 |
0.158 (1.00) |
0.821 (1.00) |
0.632 (1.00) |
0.632 (1.00) |
0.46 (1.00) |
0.624 (1.00) |
1 (1.00) |
0.239 (1.00) |
| 8q loss | 5 (11%) | 41 |
0.0277 (1.00) |
0.285 (1.00) |
1 (1.00) |
1 (1.00) |
0.652 (1.00) |
0.828 (1.00) |
||
| 9p loss | 25 (54%) | 21 |
0.00574 (1.00) |
0.00121 (0.406) |
0.305 (1.00) |
0.305 (1.00) |
1 (1.00) |
0.7 (1.00) |
0.0157 (1.00) |
0.00933 (1.00) |
| 9q loss | 15 (33%) | 31 |
0.377 (1.00) |
0.0633 (1.00) |
1 (1.00) |
1 (1.00) |
0.752 (1.00) |
0.678 (1.00) |
0.226 (1.00) |
0.0538 (1.00) |
| 11p loss | 8 (17%) | 38 |
0.251 (1.00) |
0.421 (1.00) |
0.432 (1.00) |
0.432 (1.00) |
0.688 (1.00) |
0.351 (1.00) |
0.443 (1.00) |
0.524 (1.00) |
| 11q loss | 10 (22%) | 36 |
0.145 (1.00) |
0.112 (1.00) |
1 (1.00) |
1 (1.00) |
0.276 (1.00) |
0.2 (1.00) |
0.476 (1.00) |
0.894 (1.00) |
| 12p loss | 6 (13%) | 40 |
1 (1.00) |
0.145 (1.00) |
0.15 (1.00) |
0.15 (1.00) |
0.386 (1.00) |
0.102 (1.00) |
0.396 (1.00) |
0.409 (1.00) |
| 12q loss | 8 (17%) | 38 |
1 (1.00) |
0.409 (1.00) |
0.4 (1.00) |
0.4 (1.00) |
1 (1.00) |
0.69 (1.00) |
0.443 (1.00) |
0.524 (1.00) |
| 13q loss | 7 (15%) | 39 |
0.781 (1.00) |
0.705 (1.00) |
0.229 (1.00) |
0.519 (1.00) |
0.689 (1.00) |
0.287 (1.00) |
||
| 14q loss | 6 (13%) | 40 |
0.0217 (1.00) |
0.00442 (1.00) |
1 (1.00) |
0.354 (1.00) |
0.396 (1.00) |
0.0506 (1.00) |
||
| 16p loss | 3 (7%) | 43 |
0.257 (1.00) |
0.134 (1.00) |
0.545 (1.00) |
0.229 (1.00) |
0.592 (1.00) |
0.406 (1.00) |
||
| 16q loss | 13 (28%) | 33 |
0.547 (1.00) |
0.0228 (1.00) |
1 (1.00) |
1 (1.00) |
0.484 (1.00) |
0.145 (1.00) |
0.501 (1.00) |
0.319 (1.00) |
| 17p loss | 8 (17%) | 38 |
1 (1.00) |
0.864 (1.00) |
0.688 (1.00) |
0.835 (1.00) |
0.705 (1.00) |
0.209 (1.00) |
||
| 17q loss | 5 (11%) | 41 |
0.0912 (1.00) |
0.668 (1.00) |
0.635 (1.00) |
0.754 (1.00) |
0.652 (1.00) |
0.828 (1.00) |
||
| 18p loss | 5 (11%) | 41 |
0.588 (1.00) |
0.39 (1.00) |
0.635 (1.00) |
0.754 (1.00) |
0.652 (1.00) |
0.828 (1.00) |
||
| 18q loss | 4 (9%) | 42 |
0.809 (1.00) |
0.206 (1.00) |
1 (1.00) |
1 (1.00) |
1 (1.00) |
1 (1.00) |
||
| 19q loss | 3 (7%) | 43 |
0.772 (1.00) |
0.474 (1.00) |
0.545 (1.00) |
0.421 (1.00) |
0.236 (1.00) |
0.406 (1.00) |
||
| 21q loss | 6 (13%) | 40 |
0.343 (1.00) |
0.744 (1.00) |
0.632 (1.00) |
0.632 (1.00) |
0.344 (1.00) |
0.3 (1.00) |
1 (1.00) |
0.724 (1.00) |
| 22q loss | 5 (11%) | 41 |
0.716 (1.00) |
0.39 (1.00) |
1 (1.00) |
1 (1.00) |
1 (1.00) |
0.154 (1.00) |
P value = 0.000245 (Fisher's exact test), Q value = 0.083
Table S1. Gene #13: '8q gain mutation analysis' versus Clinical Feature #1: 'CN_CNMF'
| nPatients | CLUS_1 | CLUS_2 | CLUS_3 |
|---|---|---|---|
| ALL | 14 | 13 | 19 |
| 8Q GAIN MUTATED | 3 | 10 | 2 |
| 8Q GAIN WILD-TYPE | 11 | 3 | 17 |
Figure S1. Get High-res Image Gene #13: '8q gain mutation analysis' versus Clinical Feature #1: 'CN_CNMF'
P value = 0.000314 (Fisher's exact test), Q value = 0.11
Table S2. Gene #31: '10p loss mutation analysis' versus Clinical Feature #1: 'CN_CNMF'
| nPatients | CLUS_1 | CLUS_2 | CLUS_3 |
|---|---|---|---|
| ALL | 14 | 13 | 19 |
| 10P LOSS MUTATED | 11 | 6 | 2 |
| 10P LOSS WILD-TYPE | 3 | 7 | 17 |
Figure S2. Get High-res Image Gene #31: '10p loss mutation analysis' versus Clinical Feature #1: 'CN_CNMF'
P value = 3.01e-05 (Fisher's exact test), Q value = 0.01
Table S3. Gene #32: '10q loss mutation analysis' versus Clinical Feature #1: 'CN_CNMF'
| nPatients | CLUS_1 | CLUS_2 | CLUS_3 |
|---|---|---|---|
| ALL | 14 | 13 | 19 |
| 10Q LOSS MUTATED | 12 | 8 | 2 |
| 10Q LOSS WILD-TYPE | 2 | 5 | 17 |
Figure S3. Get High-res Image Gene #32: '10q loss mutation analysis' versus Clinical Feature #1: 'CN_CNMF'
-
Mutation data file = broad_values_by_arm.mutsig.cluster.txt
-
Molecular subtypes file = SKCM-All_Primary.transferedmergedcluster.txt
-
Number of patients = 46
-
Number of significantly arm-level cnvs = 47
-
Number of molecular subtypes = 8
-
Exclude genes that fewer than K tumors have mutations, K = 3
For binary or multi-class clinical features (nominal or ordinal), two-tailed Fisher's exact tests (Fisher 1922) were used to estimate the P values using the 'fisher.test' function in R
For multi-class clinical features (nominal or ordinal), Chi-square tests (Greenwood and Nikulin 1996) were used to estimate the P values using the 'chisq.test' function in R
For multiple hypothesis correction, Q value is the False Discovery Rate (FDR) analogue of the P value (Benjamini and Hochberg 1995), defined as the minimum FDR at which the test may be called significant. We used the 'Benjamini and Hochberg' method of 'p.adjust' function in R to convert P values into Q values.
This is an experimental feature. The full results of the analysis summarized in this report can be downloaded from the TCGA Data Coordination Center.