(All_Primary cohort)
This report serves to describe the mutational landscape and properties of a given individual set, as well as rank genes and genesets according to mutational significance. MutSig v2.0 was used to generate the results found in this report.
-
Working with individual set: SKCM-All_Primary
-
Number of patients in set: 38
The input for this pipeline is a set of individuals with the following files associated for each:
-
An annotated .maf file describing the mutations called for the respective individual, and their properties.
-
A .wig file that contains information about the coverage of the sample.
-
MAF used for this analysis:SKCM-All_Primary.final_analysis_set.maf
-
Significantly mutated genes (q ≤ 0.1): 8
-
Mutations seen in COSMIC: 81
-
Significantly mutated genes in COSMIC territory: 5
-
Genes with clustered mutations (≤ 3 aa apart): 148
-
Significantly mutated genesets: 4
-
Significantly mutated genesets: (excluding sig. mutated genes):0
-
Read 38 MAFs of type "Broad"
-
Total number of mutations in input MAFs: 18327
-
After removing 1 mutations outside chr1-24: 18326
-
After removing 135 blacklisted mutations: 18191
-
After removing 368 noncoding mutations: 17823
-
Number of mutations before filtering: 17823
-
After removing 240 mutations outside gene set: 17583
-
After removing 3 mutations outside category set: 17580
Table 1. Get Full Table Table representing breakdown of mutations by type.
| type | count |
|---|---|
| Frame_Shift_Del | 101 |
| Frame_Shift_Ins | 36 |
| In_Frame_Del | 32 |
| In_Frame_Ins | 8 |
| Missense_Mutation | 10885 |
| Nonsense_Mutation | 682 |
| Nonstop_Mutation | 3 |
| Silent | 5642 |
| Splice_Site | 180 |
| Translation_Start_Site | 11 |
| Total | 17580 |
Table 2. Get Full Table A breakdown of mutation rates per category discovered for this individual set.
| category | n | N | rate | rate_per_mb | relative_rate | exp_ns_s_ratio |
|---|---|---|---|---|---|---|
| (C/T)p*C->T | 8028 | 304598383 | 0.000026 | 26 | 2.4 | 1.6 |
| (A/G)p*C->T | 970 | 255685633 | 3.8e-06 | 3.8 | 0.35 | 1.9 |
| A->G | 505 | 540676925 | 9.3e-07 | 0.93 | 0.086 | 2.3 |
| transver | 1391 | 1100960941 | 1.3e-06 | 1.3 | 0.12 | 5 |
| indel+null | 1041 | 1100960941 | 9.5e-07 | 0.95 | 0.087 | NaN |
| double_null | 3 | 1100960941 | 2.7e-09 | 0.0027 | 0.00025 | NaN |
| Total | 11938 | 1100960941 | 0.000011 | 11 | 1 | 3.5 |
The x axis represents the samples. The y axis represents the exons, one row per exon, and they are sorted by average coverage across samples. For exons with exactly the same average coverage, they are sorted next by the %GC of the exon. (The secondary sort is especially useful for the zero-coverage exons at the bottom).
Figure 1.
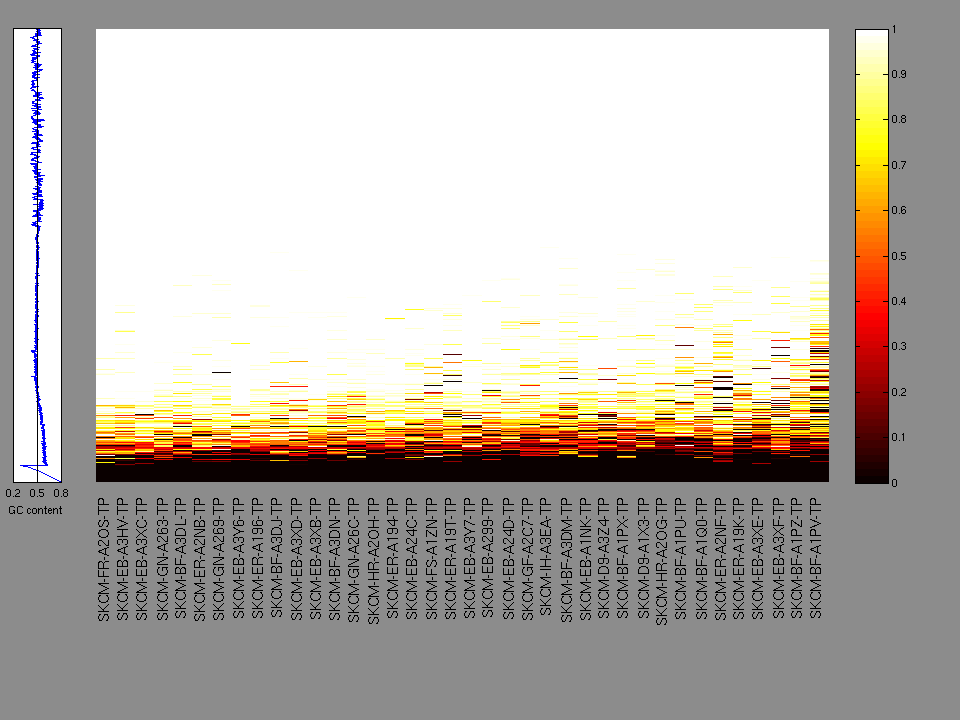
Figure 2. Patients counts and rates file used to generate this plot: SKCM-All_Primary.patients.counts_and_rates.txt
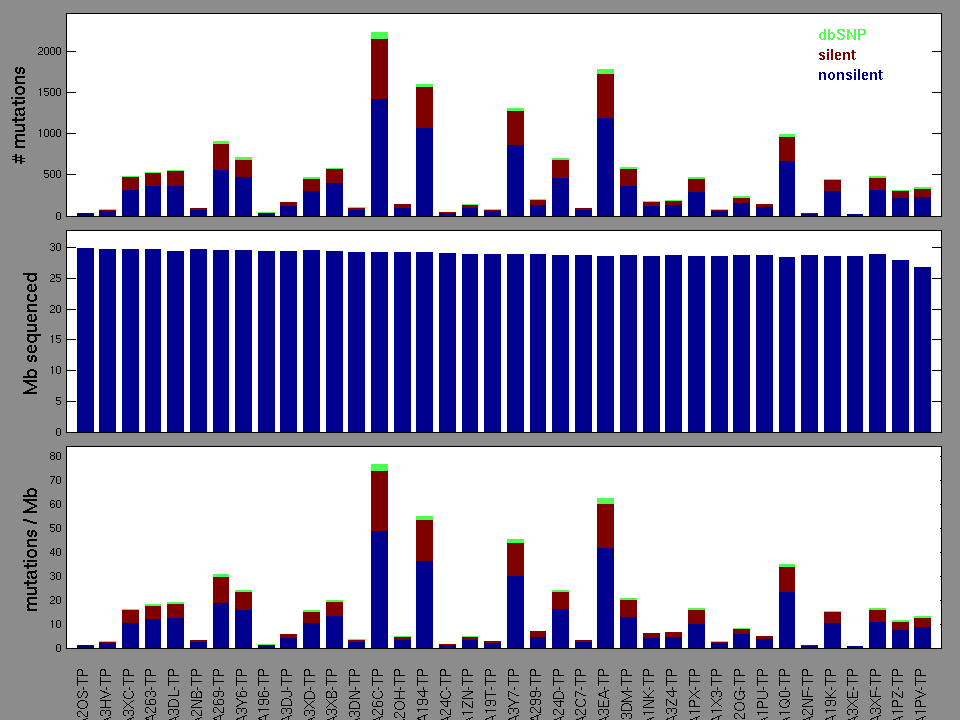
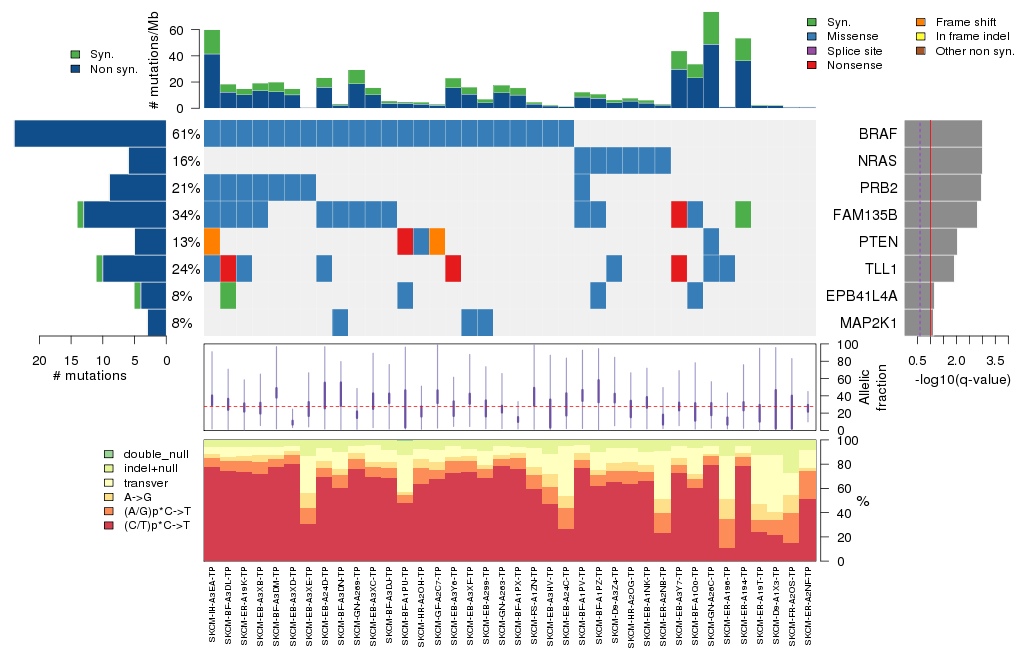
Figure 3. Get High-res Image The matrix in the center of the figure represents individual mutations in patient samples, color-coded by type of mutation, for the significantly mutated genes. The rate of synonymous and non-synonymous mutations is displayed at the top of the matrix. The barplot on the left of the matrix shows the number of mutations in each gene. The percentages represent the fraction of tumors with at least one mutation in the specified gene. The barplot to the right of the matrix displays the q-values for the most significantly mutated genes. The purple boxplots below the matrix (only displayed if required columns are present in the provided MAF) represent the distributions of allelic fractions observed in each sample. The plot at the bottom represents the base substitution distribution of individual samples, using the same categories that were used to calculate significance.
Column Descriptions:
-
N = number of sequenced bases in this gene across the individual set
-
n = number of (nonsilent) mutations in this gene across the individual set
-
npat = number of patients (individuals) with at least one nonsilent mutation
-
nsite = number of unique sites having a non-silent mutation
-
nsil = number of silent mutations in this gene across the individual set
-
n1 = number of nonsilent mutations of type: (C/T)p*C->T
-
n2 = number of nonsilent mutations of type: (A/G)p*C->T
-
n3 = number of nonsilent mutations of type: A->G
-
n4 = number of nonsilent mutations of type: transver
-
n5 = number of nonsilent mutations of type: indel+null
-
n6 = number of nonsilent mutations of type: double_null
-
p_classic = p-value for the observed amount of nonsilent mutations being elevated in this gene
-
p_ns_s = p-value for the observed nonsilent/silent ratio being elevated in this gene
-
p_cons = p-value for enrichment of mutations at evolutionarily most-conserved sites in gene
-
p_joint = p-value for clustering + conservation
-
p = p-value (overall)
-
q = q-value, False Discovery Rate (Benjamini-Hochberg procedure)
Table 3. Get Full Table A Ranked List of Significantly Mutated Genes. Number of significant genes found: 8. Number of genes displayed: 35. Click on a gene name to display its stick figure depicting the distribution of mutations and mutation types across the chosen gene (this feature may not be available for all significant genes).
| rank | gene | description | N | n | npat | nsite | nsil | n1 | n2 | n3 | n4 | n5 | n6 | p_classic | p_ns_s | p_cons | p_joint | p | q |
|---|---|---|---|---|---|---|---|---|---|---|---|---|---|---|---|---|---|---|---|
| 1 | BRAF | v-raf murine sarcoma viral oncogene homolog B1 | 84542 | 24 | 23 | 4 | 0 | 1 | 0 | 1 | 22 | 0 | 0 | 1.1e-15 | 0.0077 | 0.015 | 0 | <1.00e-15 | <9.03e-12 |
| 2 | NRAS | neuroblastoma RAS viral (v-ras) oncogene homolog | 22263 | 6 | 6 | 1 | 0 | 0 | 0 | 5 | 1 | 0 | 0 | 9.9e-12 | 0.12 | 0.28 | 0 | <1.00e-15 | <9.03e-12 |
| 3 | PRB2 | proline-rich protein BstNI subfamily 2 | 47532 | 9 | 8 | 7 | 0 | 7 | 0 | 0 | 2 | 0 | 0 | 3.9e-08 | 0.25 | 0.26 | 0.011 | 9.93e-09 | 5.98e-05 |
| 4 | FAM135B | family with sequence similarity 135, member B | 163134 | 13 | 13 | 12 | 1 | 9 | 0 | 0 | 3 | 1 | 0 | 1e-08 | 0.029 | 0.7 | 0.52 | 1.08e-07 | 0.000487 |
| 5 | PTEN | phosphatase and tensin homolog (mutated in multiple advanced cancers 1) | 43686 | 5 | 5 | 5 | 0 | 1 | 0 | 1 | 0 | 3 | 0 | 8.5e-07 | 0.32 | 0.95 | 0.16 | 2.24e-06 | 0.00807 |
| 6 | TLL1 | tolloid-like 1 | 115472 | 10 | 9 | 10 | 1 | 6 | 1 | 0 | 0 | 3 | 0 | 4.6e-07 | 0.19 | 0.72 | 0.45 | 3.43e-06 | 0.0103 |
| 7 | EPB41L4A | erythrocyte membrane protein band 4.1 like 4A | 76810 | 4 | 3 | 3 | 1 | 0 | 0 | 0 | 4 | 0 | 0 | 0.01 | 0.78 | 0.47 | 0.00019 | 2.68e-05 | 0.0691 |
| 8 | MAP2K1 | mitogen-activated protein kinase kinase 1 | 43395 | 3 | 3 | 1 | 0 | 3 | 0 | 0 | 0 | 0 | 0 | 0.0031 | 0.2 | 0.52 | 0.00073 | 3.18e-05 | 0.0719 |
| 9 | ZFHX4 | zinc finger homeobox 4 | 354049 | 12 | 11 | 12 | 1 | 6 | 2 | 1 | 3 | 0 | 0 | 0.000044 | 0.065 | 0.88 | 0.12 | 6.91e-05 | 0.129 |
| 10 | ARID2 | AT rich interactive domain 2 (ARID, RFX-like) | 208651 | 9 | 8 | 9 | 1 | 2 | 0 | 0 | 0 | 7 | 0 | 0.000018 | 0.32 | 0.36 | 0.31 | 7.16e-05 | 0.129 |
| 11 | PPP6C | protein phosphatase 6, catalytic subunit | 38199 | 5 | 5 | 4 | 0 | 4 | 0 | 0 | 0 | 1 | 0 | 0.000017 | 0.18 | 0.48 | 0.41 | 8.82e-05 | 0.132 |
| 12 | RUNDC3B | RUN domain containing 3B | 51634 | 4 | 4 | 4 | 0 | 3 | 0 | 0 | 1 | 0 | 0 | 0.0026 | 0.27 | 0.37 | 0.003 | 9.80e-05 | 0.132 |
| 13 | DMRT3 | doublesex and mab-3 related transcription factor 3 | 43306 | 3 | 3 | 3 | 0 | 2 | 0 | 0 | 0 | 1 | 0 | 0.002 | 0.22 | 0.79 | 0.0038 | 0.000100 | 0.132 |
| 14 | CFHR1 | complement factor H-related 1 | 32025 | 6 | 5 | 6 | 0 | 5 | 1 | 0 | 0 | 0 | 0 | 0.000031 | 0.26 | 0.27 | 0.27 | 0.000105 | 0.132 |
| 15 | OR52M1 | olfactory receptor, family 52, subfamily M, member 1 | 36275 | 4 | 4 | 4 | 0 | 3 | 0 | 0 | 1 | 0 | 0 | 0.00032 | 0.1 | 0.17 | 0.029 | 0.000116 | 0.132 |
| 16 | GLYAT | glycine-N-acyltransferase | 33932 | 4 | 4 | 4 | 0 | 2 | 0 | 0 | 0 | 2 | 0 | 0.000029 | 0.23 | 0.26 | 0.32 | 0.000117 | 0.132 |
| 17 | KRTAP4-7 | keratin associated protein 4-7 | 13851 | 2 | 2 | 1 | 1 | 0 | 0 | 2 | 0 | 0 | 0 | 0.00012 | 0.88 | 0.8 | 0.12 | 0.000166 | 0.171 |
| 18 | PIK3R1 | phosphoinositide-3-kinase, regulatory subunit 1 (alpha) | 89606 | 4 | 4 | 4 | 0 | 0 | 0 | 1 | 1 | 2 | 0 | 0.00033 | 0.32 | 0.38 | 0.046 | 0.000183 | 0.171 |
| 19 | ADCYAP1R1 | adenylate cyclase activating polypeptide 1 (pituitary) receptor type I | 54688 | 5 | 5 | 5 | 1 | 2 | 1 | 1 | 0 | 1 | 0 | 0.000026 | 0.24 | 0.31 | 0.59 | 0.000187 | 0.171 |
| 20 | KCNC2 | potassium voltage-gated channel, Shaw-related subfamily, member 2 | 62606 | 5 | 5 | 5 | 0 | 2 | 1 | 0 | 1 | 1 | 0 | 0.000051 | 0.11 | 0.22 | 0.31 | 0.000190 | 0.171 |
| 21 | FAM5C | family with sequence similarity 5, member C | 87218 | 8 | 7 | 8 | 2 | 5 | 0 | 0 | 3 | 0 | 0 | 0.000052 | 0.39 | 0.72 | 0.43 | 0.000260 | 0.222 |
| 22 | EZH2 | enhancer of zeste homolog 2 (Drosophila) | 86394 | 4 | 4 | 3 | 0 | 1 | 0 | 2 | 1 | 0 | 0 | 0.00047 | 0.27 | 0.38 | 0.049 | 0.000271 | 0.222 |
| 23 | CLVS1 | clavesin 1 | 41091 | 6 | 6 | 5 | 0 | 6 | 0 | 0 | 0 | 0 | 0 | 0.000029 | 0.052 | 0.4 | 0.83 | 0.000282 | 0.222 |
| 24 | TP53 | tumor protein p53 | 46527 | 4 | 4 | 4 | 0 | 1 | 1 | 0 | 0 | 2 | 0 | 0.00015 | 0.17 | 0.43 | 0.17 | 0.000301 | 0.227 |
| 25 | MORC1 | MORC family CW-type zinc finger 1 | 112715 | 5 | 5 | 4 | 0 | 3 | 0 | 1 | 0 | 1 | 0 | 0.0011 | 0.17 | 0.3 | 0.027 | 0.000336 | 0.242 |
| 26 | IL7R | interleukin 7 receptor | 53335 | 6 | 5 | 6 | 1 | 3 | 0 | 0 | 2 | 1 | 0 | 0.00024 | 0.29 | 0.14 | 0.13 | 0.000349 | 0.242 |
| 27 | HS6ST3 | heparan sulfate 6-O-sulfotransferase 3 | 40271 | 4 | 4 | 4 | 0 | 2 | 1 | 1 | 0 | 0 | 0 | 0.00038 | 0.13 | 0.71 | 0.086 | 0.000372 | 0.249 |
| 28 | CLIP1 | CAP-GLY domain containing linker protein 1 | 163332 | 5 | 4 | 3 | 0 | 4 | 0 | 0 | 0 | 1 | 0 | 0.016 | 0.13 | 0.95 | 0.0022 | 0.000396 | 0.255 |
| 29 | ZNF804A | zinc finger protein 804A | 137285 | 6 | 6 | 6 | 0 | 4 | 0 | 1 | 0 | 1 | 0 | 0.00041 | 0.17 | 1 | 0.093 | 0.000422 | 0.259 |
| 30 | NPHP1 | nephronophthisis 1 (juvenile) | 85394 | 4 | 4 | 3 | 0 | 0 | 2 | 0 | 0 | 2 | 0 | 0.00026 | 0.28 | 0.77 | 0.15 | 0.000430 | 0.259 |
| 31 | GALNTL2 | UDP-N-acetyl-alpha-D-galactosamine:polypeptide N-acetylgalactosaminyltransferase-like 2 | 74245 | 4 | 4 | 4 | 1 | 2 | 1 | 0 | 0 | 1 | 0 | 0.00072 | 0.31 | 0.63 | 0.056 | 0.000453 | 0.264 |
| 32 | OR5T3 | olfactory receptor, family 5, subfamily T, member 3 | 38603 | 4 | 4 | 4 | 1 | 2 | 1 | 0 | 1 | 0 | 0 | 0.000062 | 0.39 | 0.76 | 0.72 | 0.000488 | 0.269 |
| 33 | GRM8 | glutamate receptor, metabotropic 8 | 105539 | 7 | 6 | 7 | 0 | 3 | 1 | 2 | 0 | 1 | 0 | 0.000058 | 0.047 | 0.48 | 0.77 | 0.000491 | 0.269 |
| 34 | CAPN13 | calpain 13 | 62498 | 6 | 6 | 6 | 1 | 5 | 0 | 1 | 0 | 0 | 0 | 0.00014 | 0.18 | 0.15 | 0.34 | 0.000520 | 0.276 |
| 35 | OR10A7 | olfactory receptor, family 10, subfamily A, member 7 | 34863 | 3 | 3 | 3 | 0 | 0 | 2 | 0 | 0 | 1 | 0 | 0.00012 | 0.53 | 0.22 | 0.46 | 0.000599 | 0.303 |
Figure S1. This figure depicts the distribution of mutations and mutation types across the BRAF significant gene.
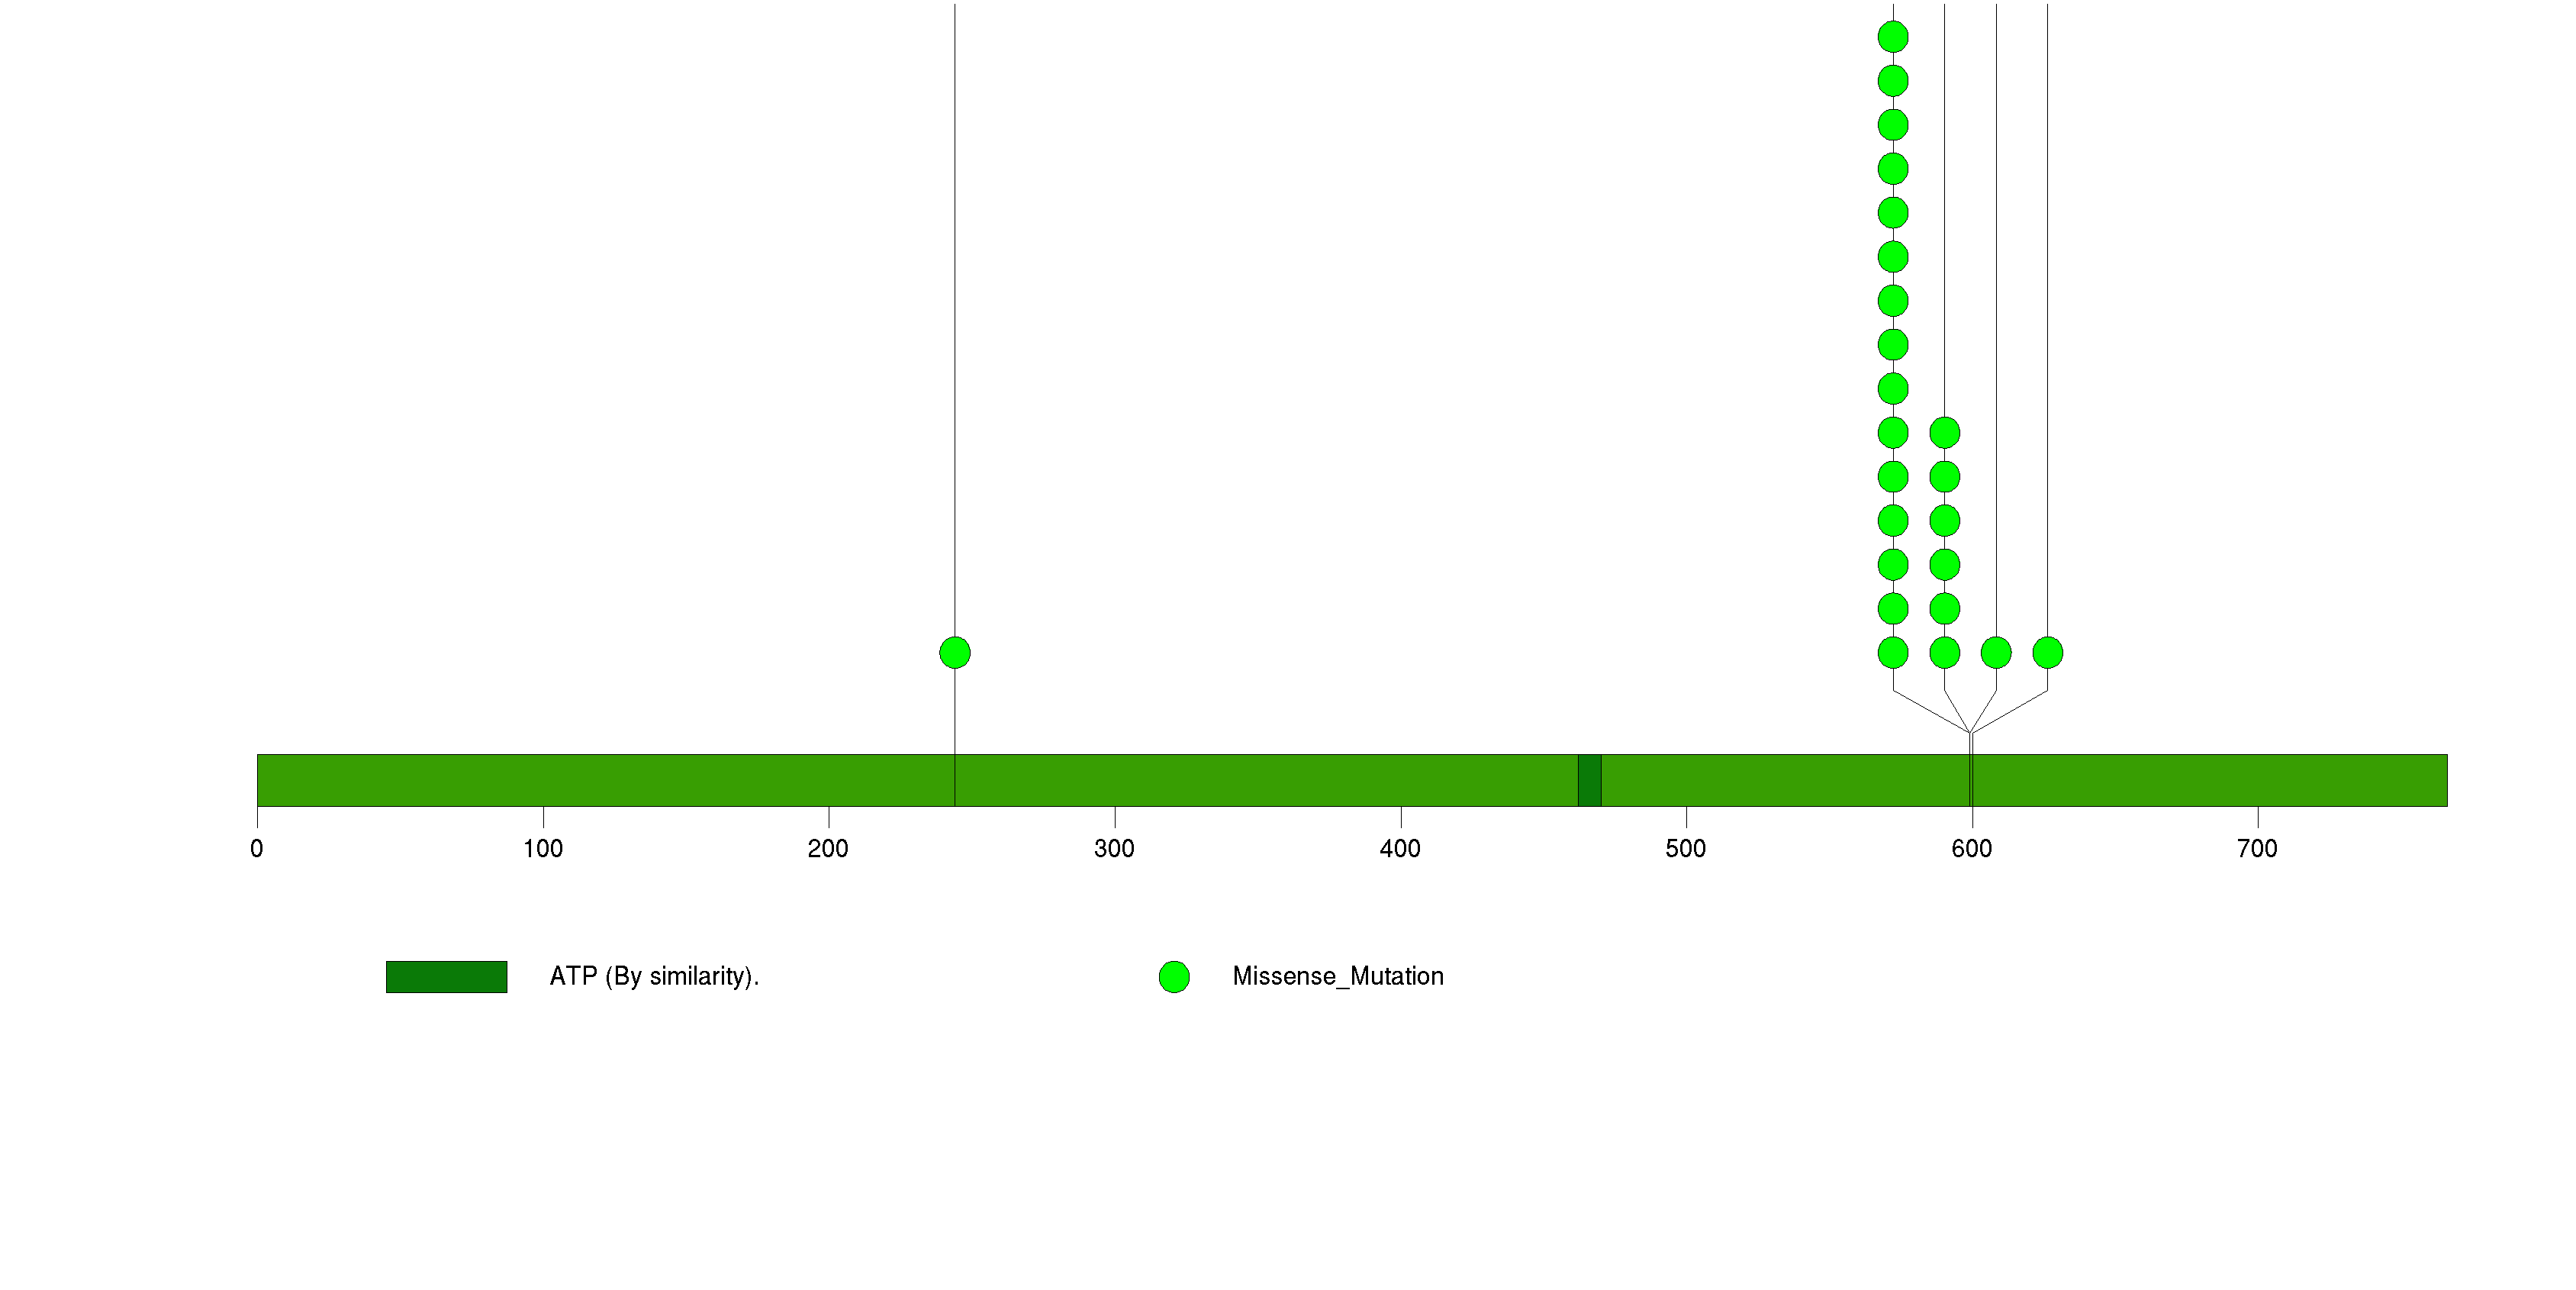
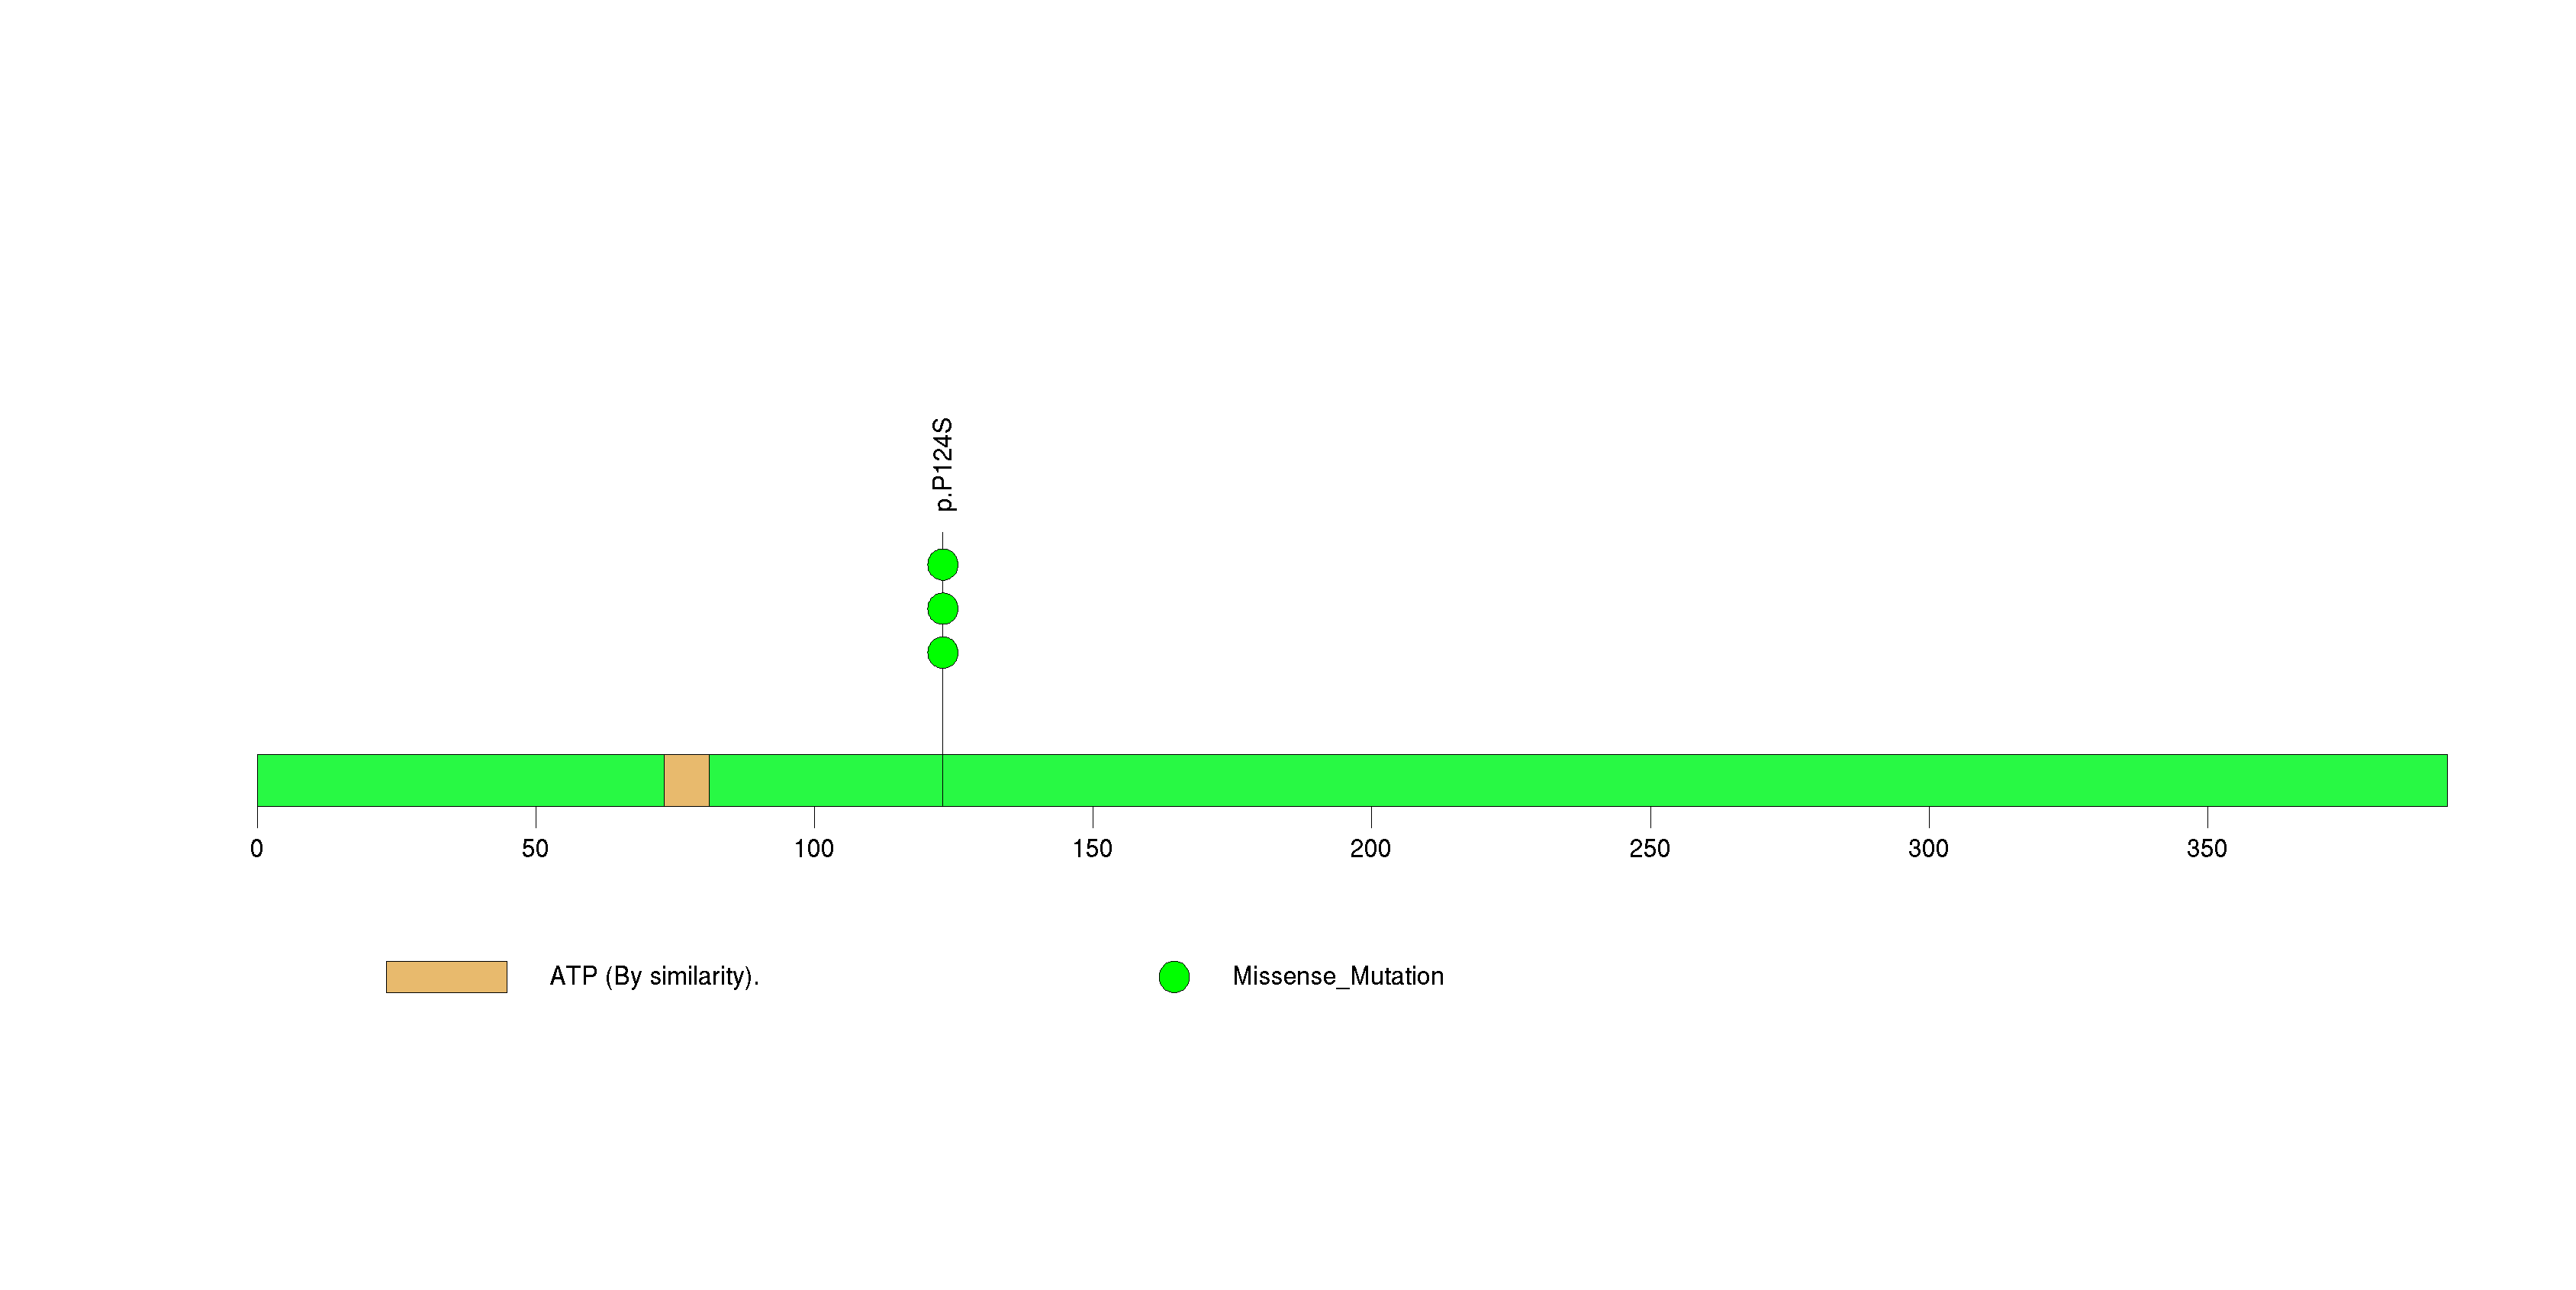
Figure S2. This figure depicts the distribution of mutations and mutation types across the NRAS significant gene.
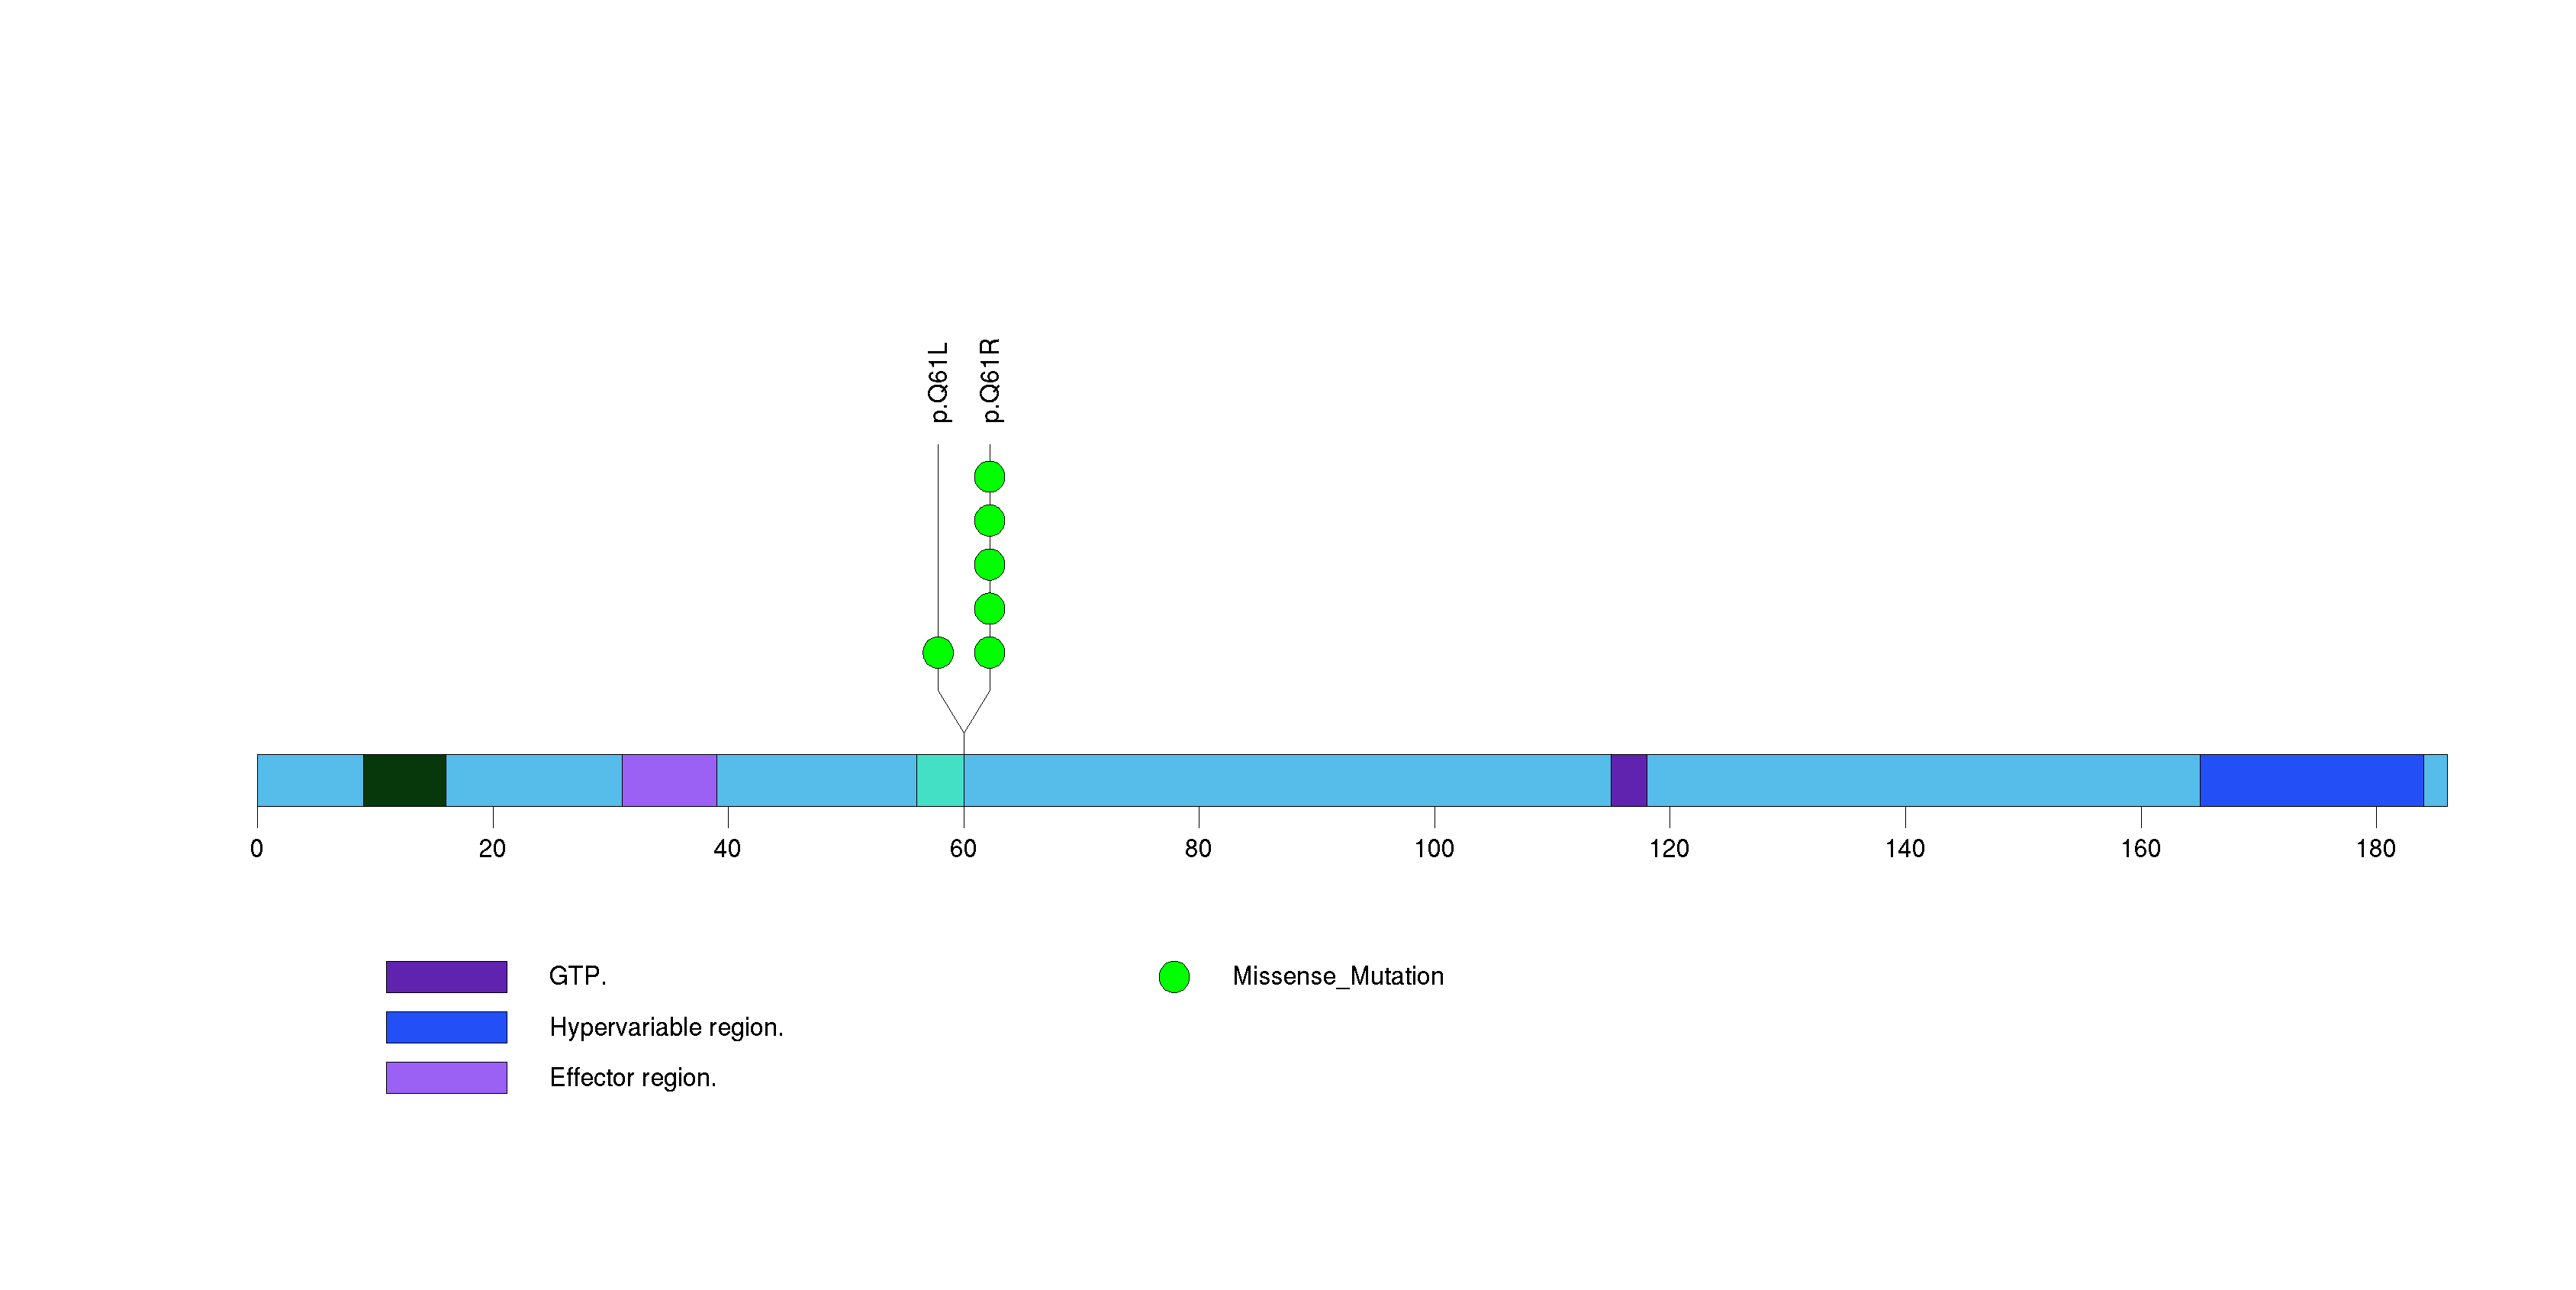
Figure S3. This figure depicts the distribution of mutations and mutation types across the FAM135B significant gene.
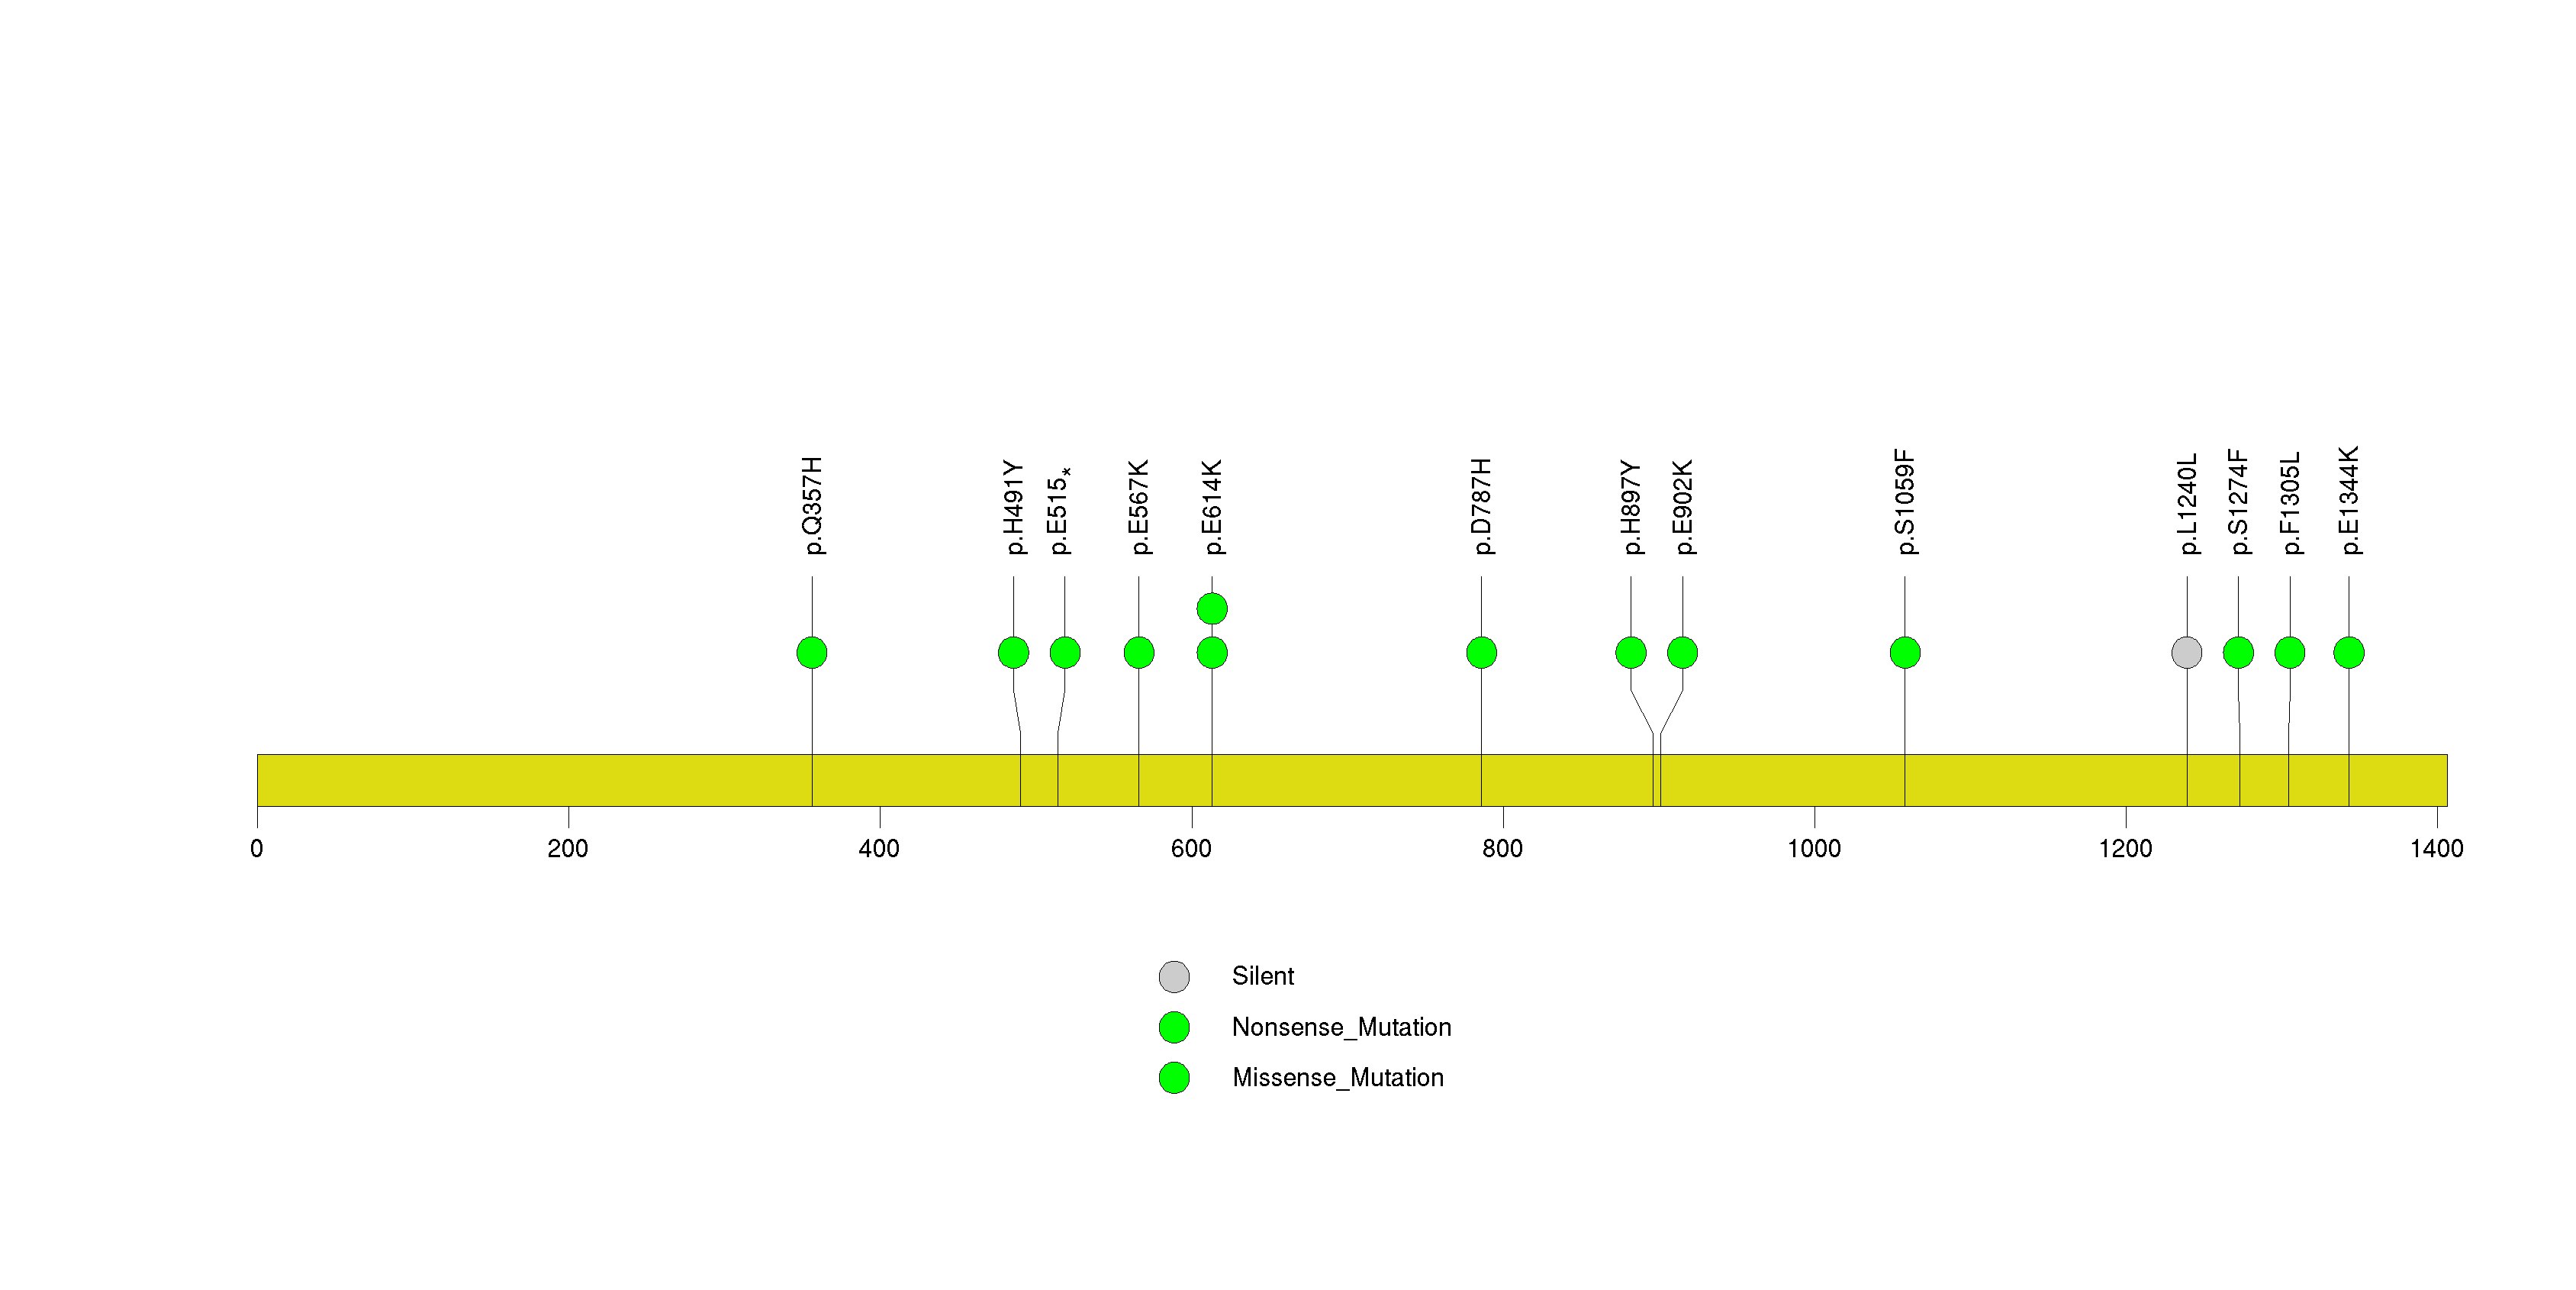
Figure S4. This figure depicts the distribution of mutations and mutation types across the PTEN significant gene.
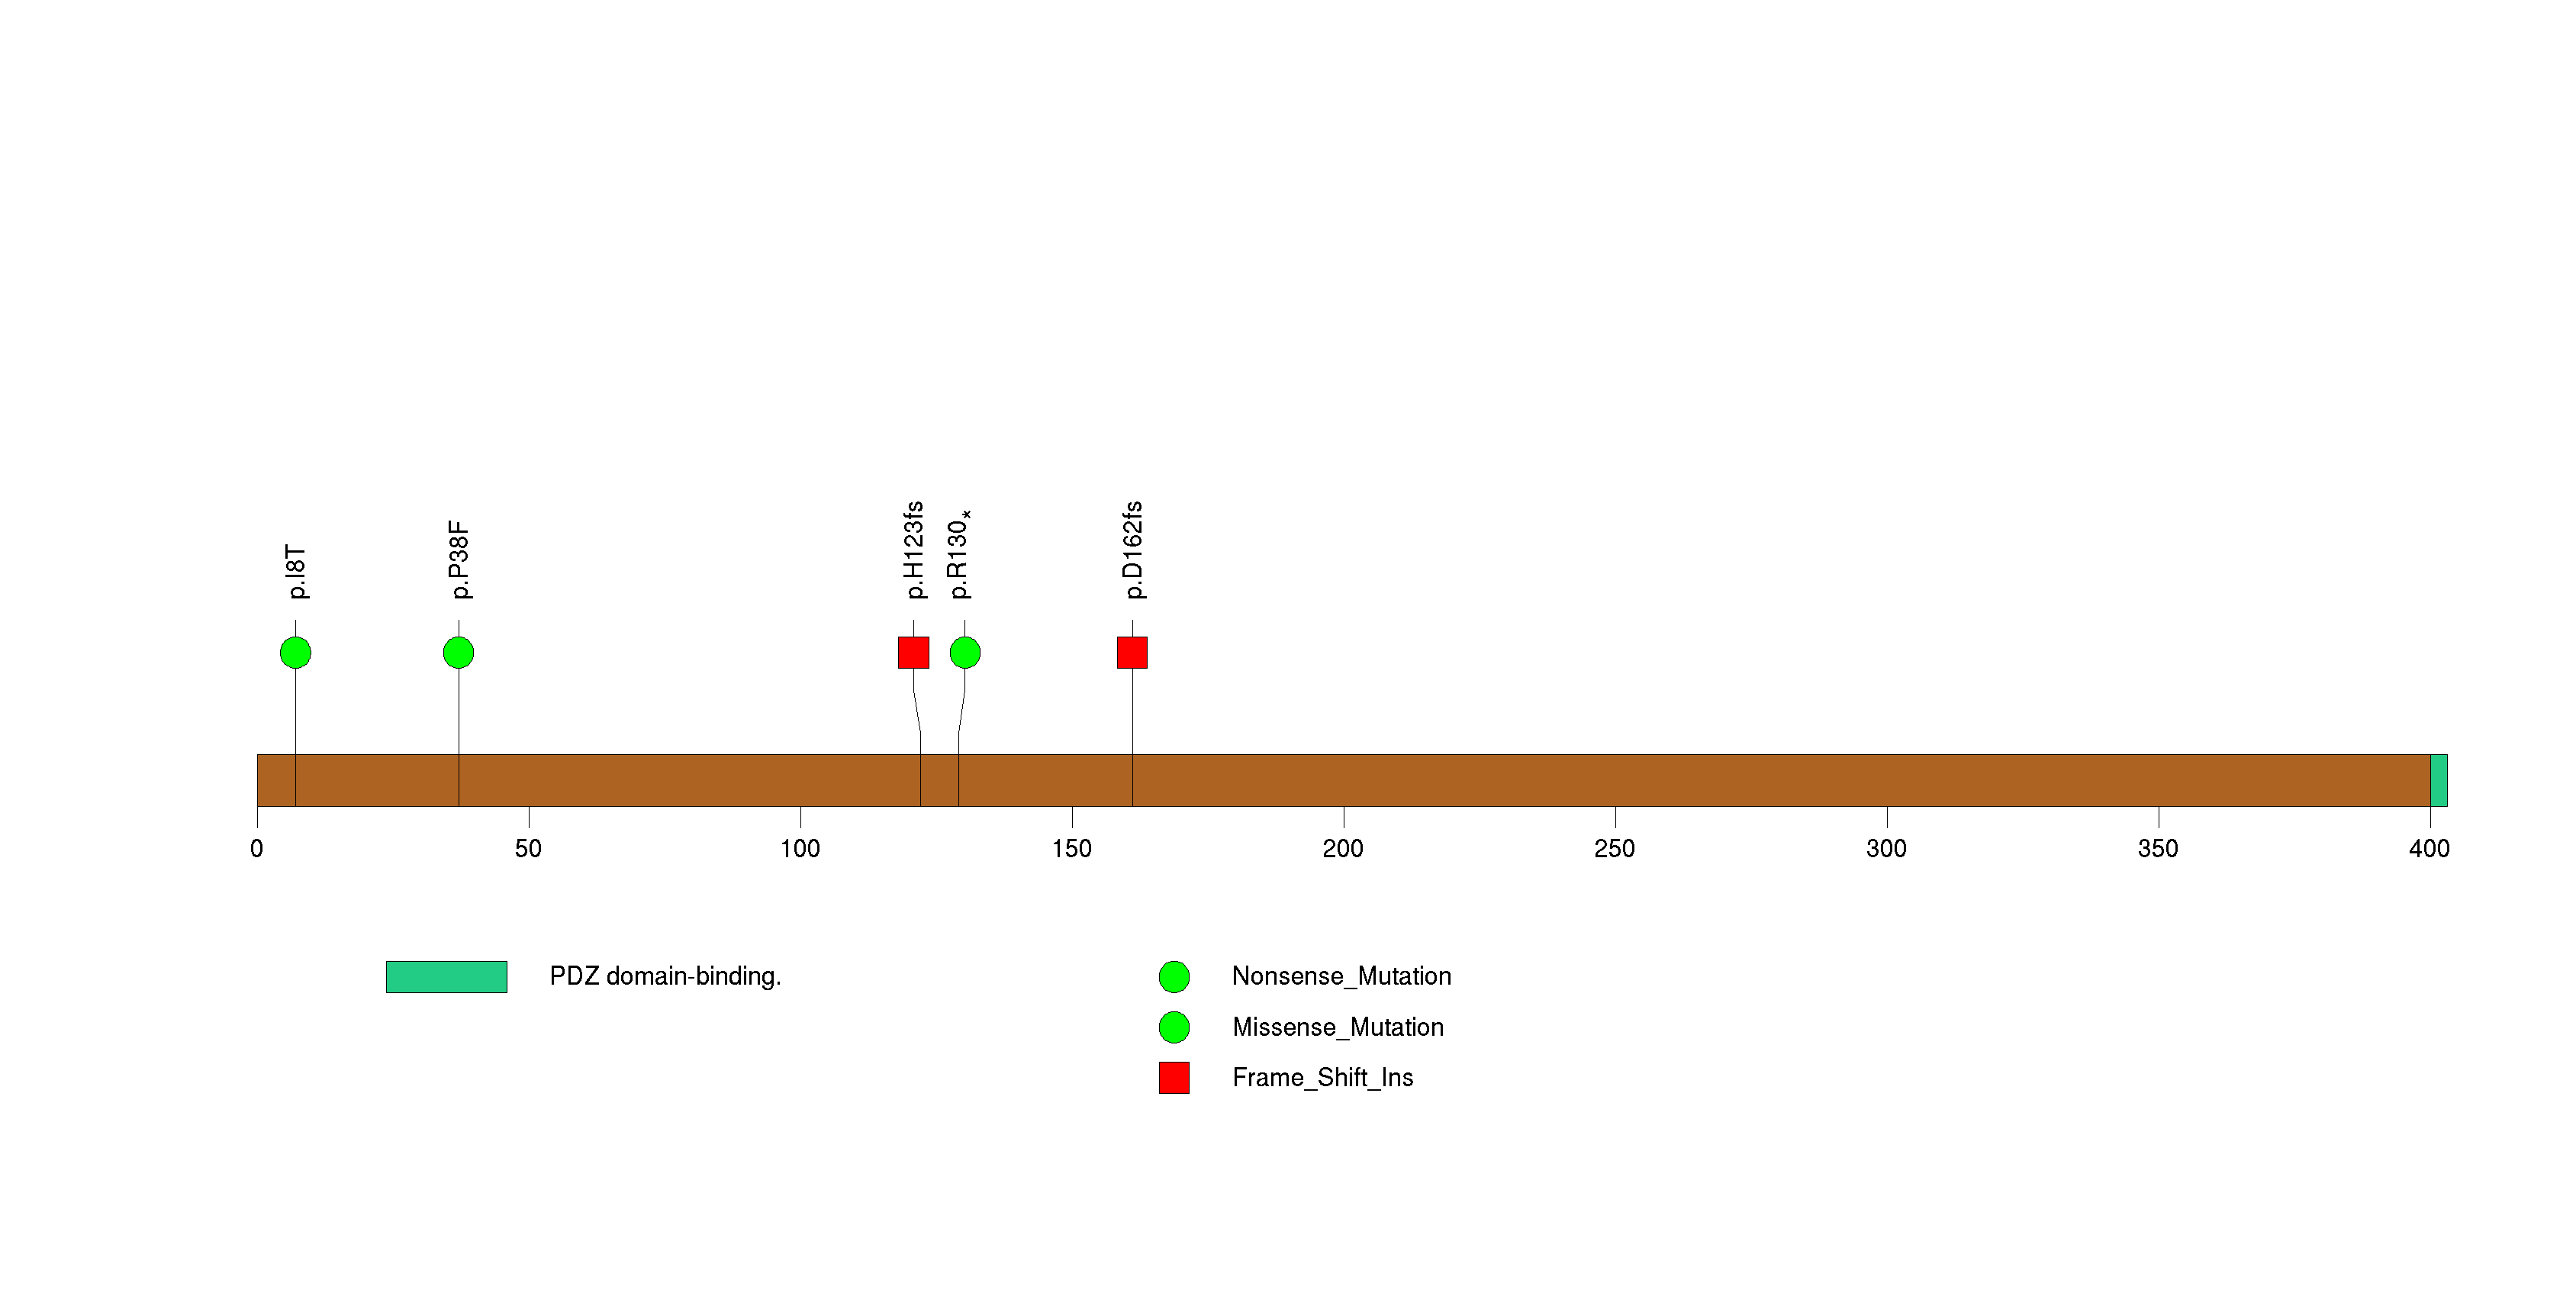
Figure S5. This figure depicts the distribution of mutations and mutation types across the TLL1 significant gene.
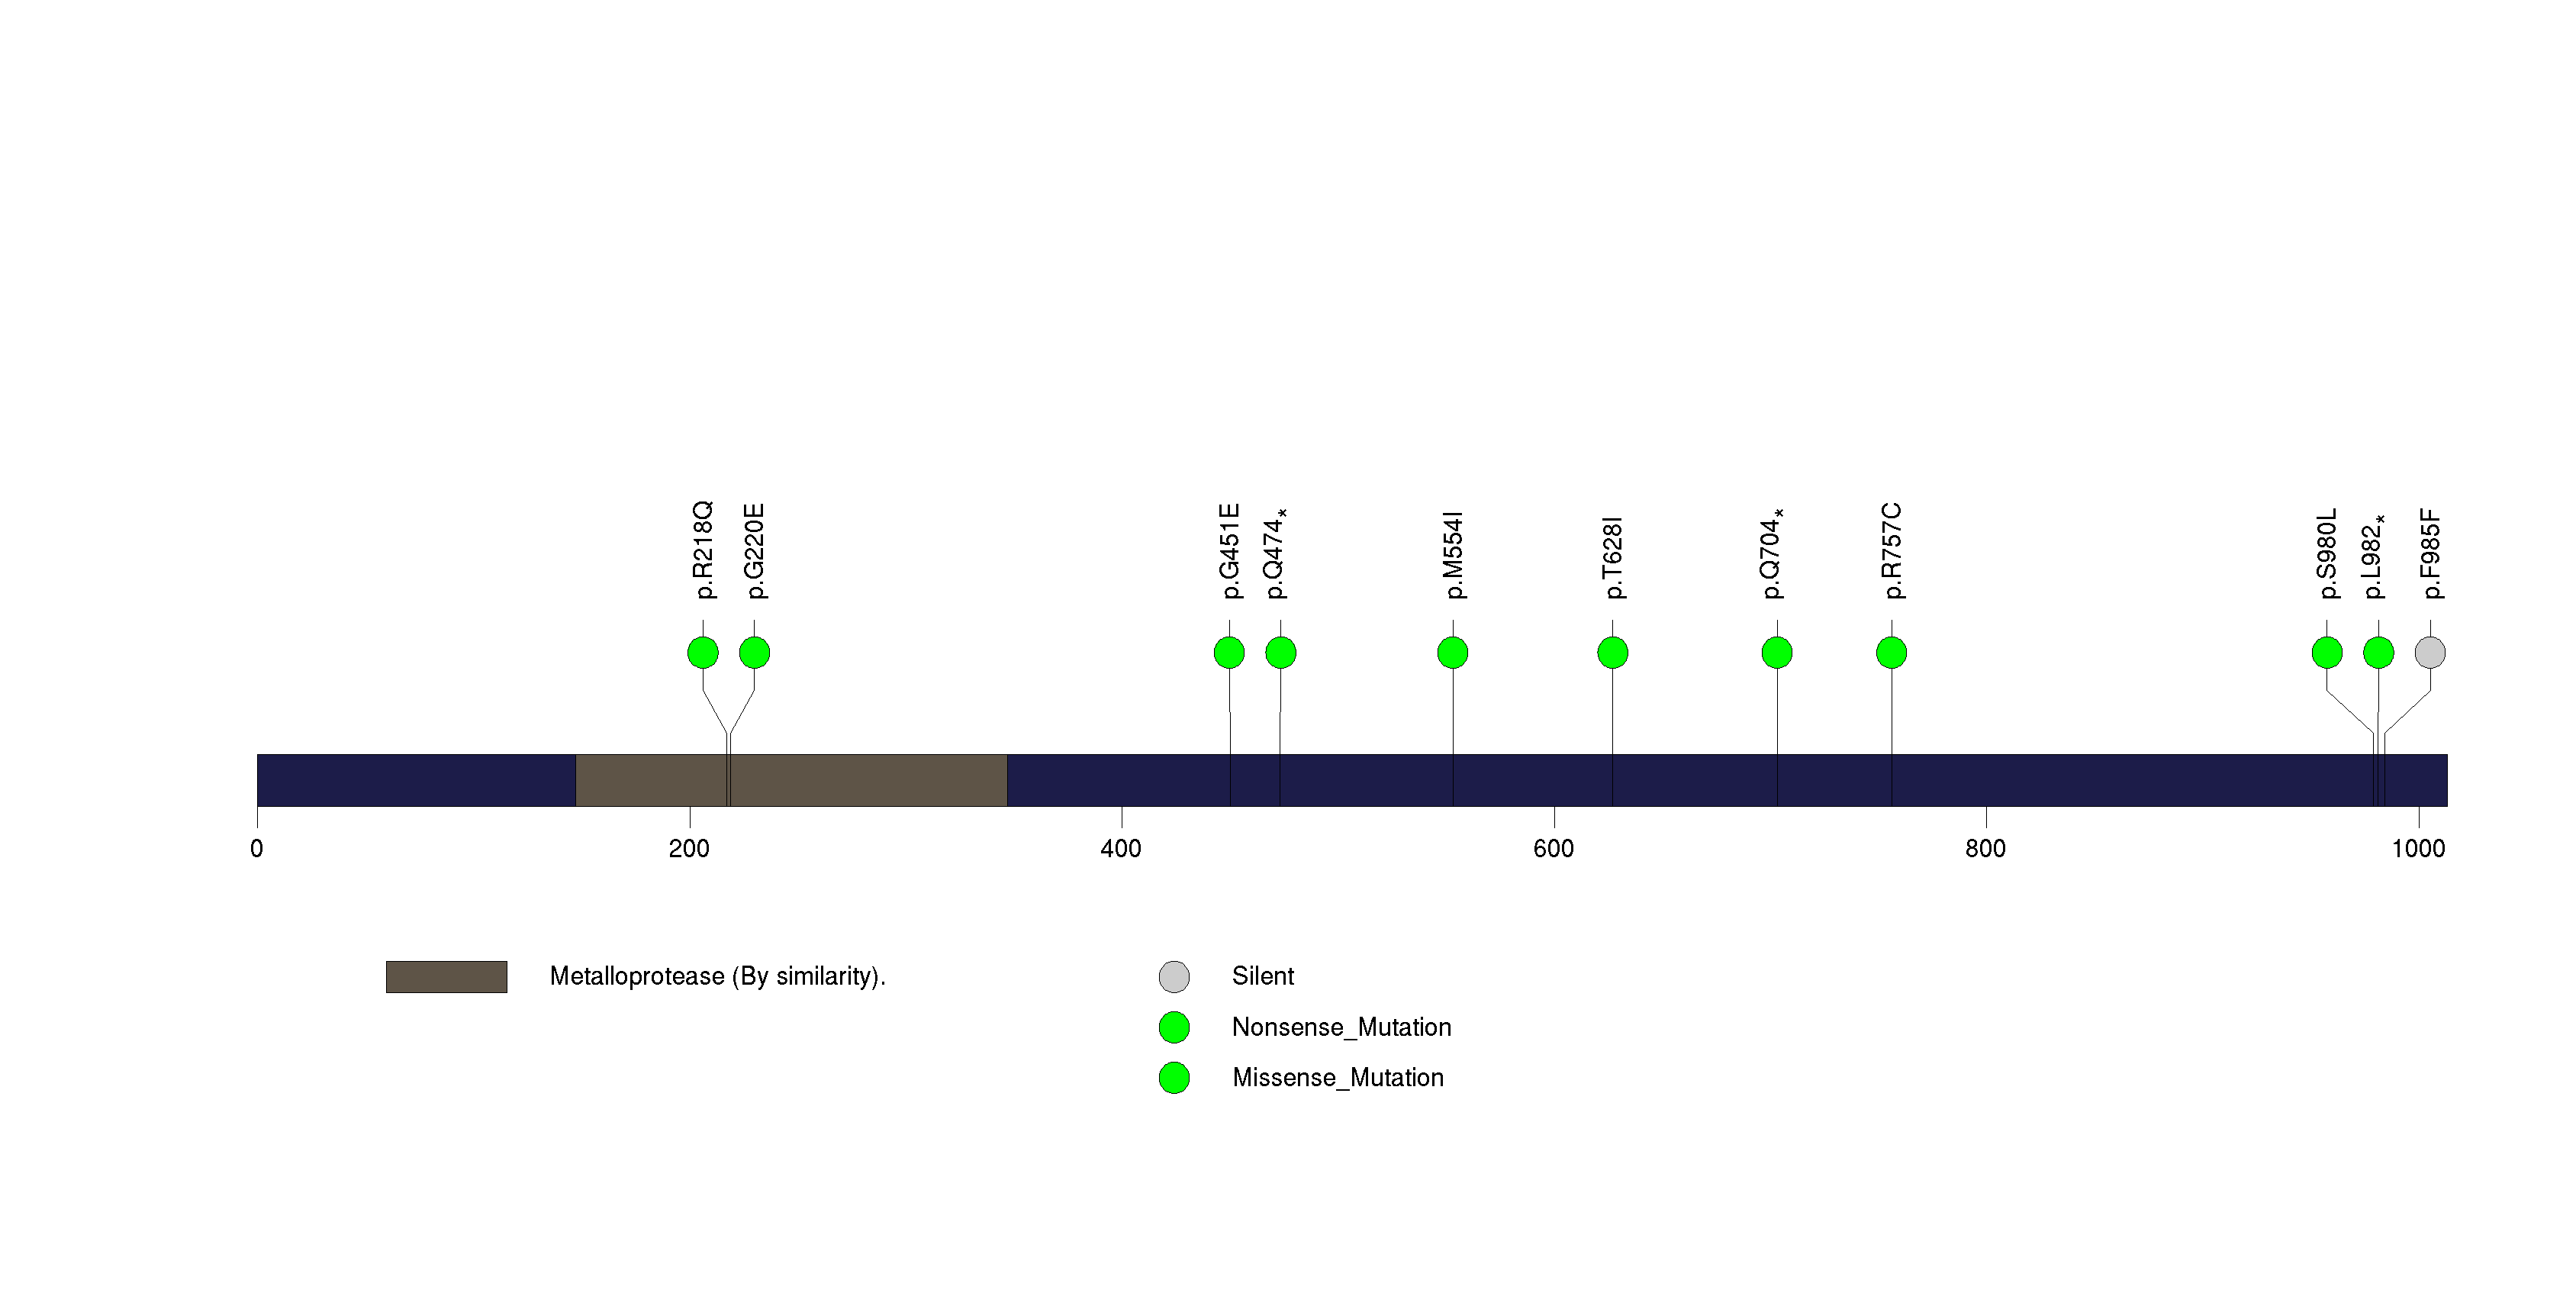
Figure S6. This figure depicts the distribution of mutations and mutation types across the EPB41L4A significant gene.
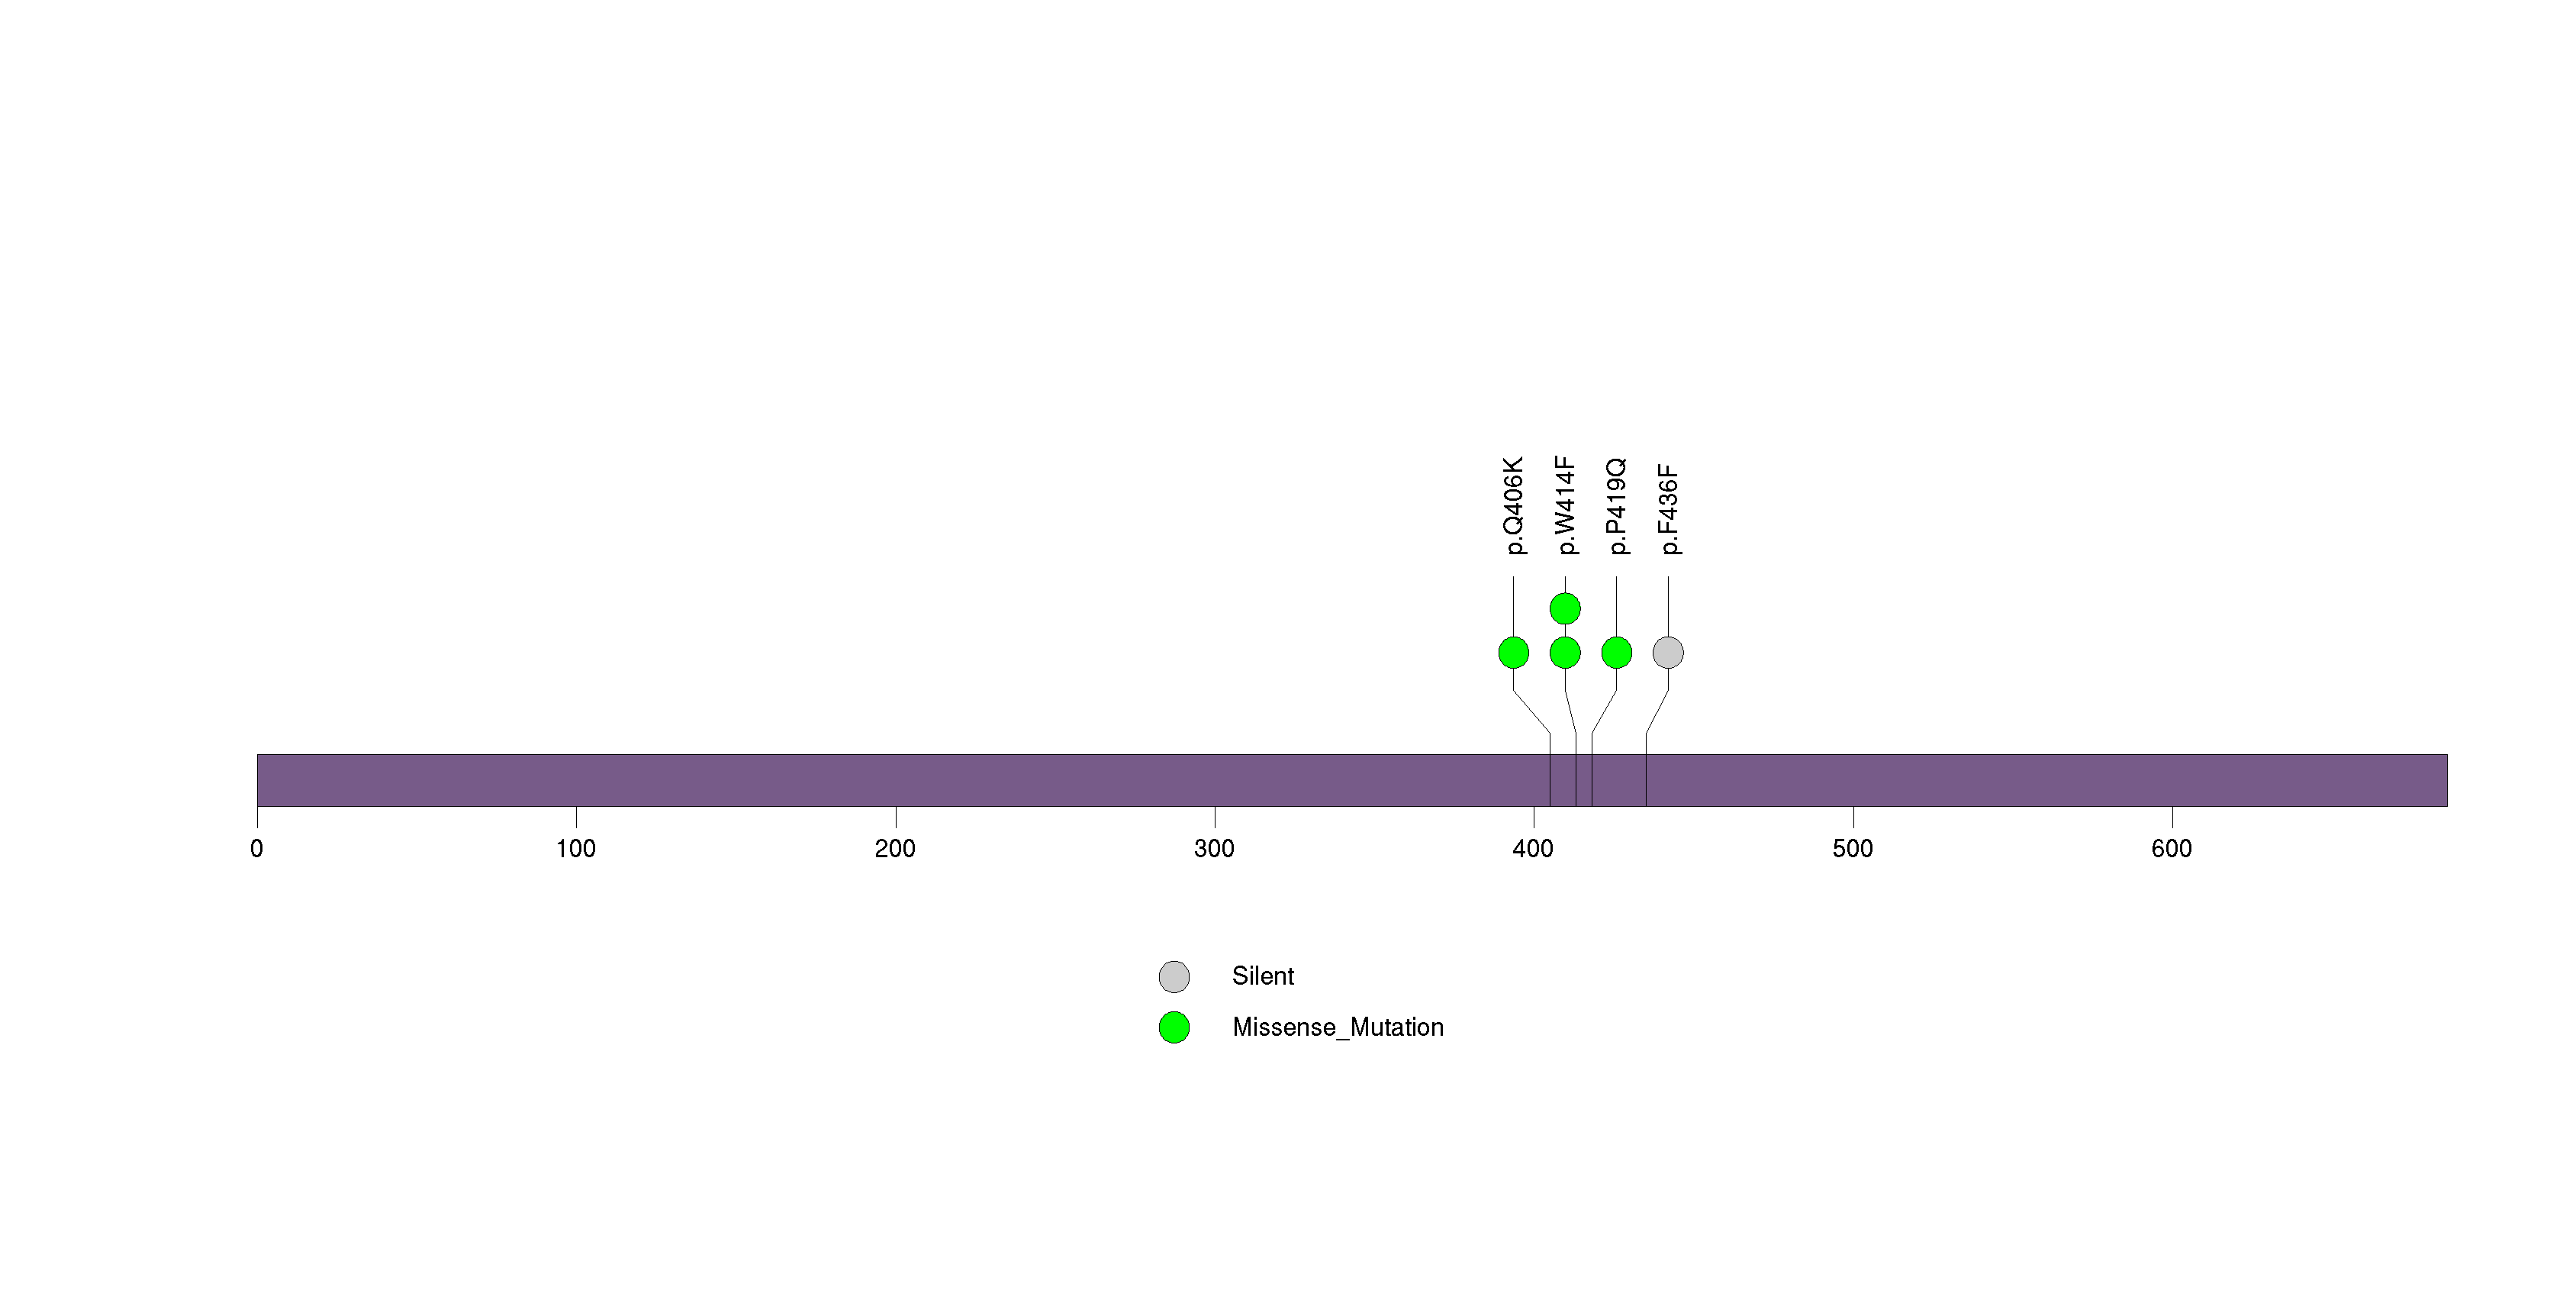
Figure S7. This figure depicts the distribution of mutations and mutation types across the MAP2K1 significant gene.
In this analysis, COSMIC is used as a filter to increase power by restricting the territory of each gene. Cosmic version: v48.
Table 4. Get Full Table Significantly mutated genes (COSMIC territory only). To access the database please go to: COSMIC. Number of significant genes found: 5. Number of genes displayed: 10
| rank | gene | description | n | cos | n_cos | N_cos | cos_ev | p | q |
|---|---|---|---|---|---|---|---|---|---|
| 1 | BRAF | v-raf murine sarcoma viral oncogene homolog B1 | 24 | 89 | 23 | 3382 | 330218 | 0 | 0 |
| 2 | NRAS | neuroblastoma RAS viral (v-ras) oncogene homolog | 6 | 33 | 6 | 1254 | 7788 | 0 | 0 |
| 3 | IDH1 | isocitrate dehydrogenase 1 (NADP+), soluble | 3 | 5 | 2 | 190 | 2984 | 2.1e-06 | 0.0032 |
| 4 | TP53 | tumor protein p53 | 4 | 356 | 4 | 13528 | 1243 | 0.000017 | 0.018 |
| 5 | PTEN | phosphatase and tensin homolog (mutated in multiple advanced cancers 1) | 5 | 767 | 5 | 29146 | 211 | 2e-05 | 0.018 |
| 6 | CBL | Cas-Br-M (murine) ecotropic retroviral transforming sequence | 3 | 45 | 2 | 1710 | 7 | 0.00017 | 0.13 |
| 7 | ADAM2 | ADAM metallopeptidase domain 2 (fertilin beta) | 3 | 1 | 1 | 38 | 1 | 0.00041 | 0.16 |
| 8 | F13A1 | coagulation factor XIII, A1 polypeptide | 2 | 1 | 1 | 38 | 1 | 0.00041 | 0.16 |
| 9 | GLRA2 | glycine receptor, alpha 2 | 1 | 1 | 1 | 38 | 1 | 0.00041 | 0.16 |
| 10 | NAP1L2 | nucleosome assembly protein 1-like 2 | 3 | 1 | 1 | 38 | 1 | 0.00041 | 0.16 |
Note:
n - number of (nonsilent) mutations in this gene across the individual set.
cos = number of unique mutated sites in this gene in COSMIC
n_cos = overlap between n and cos.
N_cos = number of individuals times cos.
cos_ev = total evidence: number of reports in COSMIC for mutations seen in this gene.
p = p-value for seeing the observed amount of overlap in this gene)
q = q-value, False Discovery Rate (Benjamini-Hochberg procedure)
Table 5. Get Full Table Genes with Clustered Mutations
| num | gene | desc | n | mindist | nmuts0 | nmuts3 | nmuts12 | npairs0 | npairs3 | npairs12 |
|---|---|---|---|---|---|---|---|---|---|---|
| 580 | BRAF | v-raf murine sarcoma viral oncogene homolog B1 | 24 | 0 | 91 | 105 | 105 | 91 | 105 | 105 |
| 3776 | NRAS | neuroblastoma RAS viral (v-ras) oncogene homolog | 6 | 0 | 15 | 15 | 15 | 15 | 15 | 15 |
| 1192 | CLIP1 | CAP-GLY domain containing linker protein 1 | 5 | 0 | 3 | 3 | 3 | 3 | 3 | 3 |
| 3263 | MAP2K1 | mitogen-activated protein kinase kinase 1 | 3 | 0 | 3 | 3 | 3 | 3 | 3 | 3 |
| 4491 | PRB2 | proline-rich protein BstNI subfamily 2 | 9 | 0 | 2 | 2 | 3 | 2 | 2 | 3 |
| 717 | C1orf173 | chromosome 1 open reading frame 173 | 10 | 0 | 2 | 2 | 2 | 2 | 2 | 2 |
| 6265 | ZNF208 | zinc finger protein 208 | 8 | 0 | 2 | 2 | 2 | 2 | 2 | 2 |
| 3517 | MUC16 | mucin 16, cell surface associated | 78 | 0 | 1 | 4 | 5 | 1 | 4 | 5 |
| 2041 | FLG2 | filaggrin family member 2 | 15 | 0 | 1 | 2 | 3 | 1 | 2 | 3 |
| 3438 | MORC1 | MORC family CW-type zinc finger 1 | 5 | 0 | 1 | 2 | 2 | 1 | 2 | 2 |
Note:
n - number of mutations in this gene in the individual set.
mindist - distance (in aa) between closest pair of mutations in this gene
npairs3 - how many pairs of mutations are within 3 aa of each other.
npairs12 - how many pairs of mutations are within 12 aa of each other.
Table 6. Get Full Table A Ranked List of Significantly Mutated Genesets. (Source: MSigDB GSEA Cannonical Pathway Set).Number of significant genesets found: 4. Number of genesets displayed: 10
| rank | geneset | description | genes | N_genes | mut_tally | N | n | npat | nsite | nsil | n1 | n2 | n3 | n4 | n5 | n6 | p_ns_s | p | q |
|---|---|---|---|---|---|---|---|---|---|---|---|---|---|---|---|---|---|---|---|
| 1 | ST_G_ALPHA_S_PATHWAY | The G-alpha-s protein activates adenylyl cyclases, which catalyze cAMP formation. | ASAH1, BF, BFAR, BRAF, CAMP, CREB1, CREB3, CREB5, EPAC, GAS, GRF2, MAPK1, RAF1, SNX13, SRC, TERF2IP | 12 | BFAR(1), BRAF(24), CREB5(2), TERF2IP(1) | 628058 | 28 | 25 | 8 | 1 | 3 | 0 | 1 | 24 | 0 | 0 | 0.014 | 5.1e-15 | 3.2e-12 |
| 2 | ST_ERK1_ERK2_MAPK_PATHWAY | The Erk1 and Erk2 MAP kinase pathways are regulated by Raf, Mos, and Tpl-2. | ARAF1, ATF1, BAD, BRAF, COPEB, CREB1, CREB3, CREB5, DUSP4, DUSP6, DUSP9, EEF2K, EIF4E, GRB2, HTATIP, MAP2K1, MAP2K2, MAP3K8, MAPK1, MAPK3, MKNK1, MKNK2, MOS, NFKB1, RAP1A, RPS6KA1, RPS6KA2, RPS6KA3, SHC1, SOS1, SOS2, TRAF3 | 29 | ATF1(1), BRAF(24), CREB5(2), DUSP4(2), EEF2K(2), EIF4E(1), MAP2K1(3), MAP2K2(1), RPS6KA1(3), RPS6KA2(1), SHC1(2), SOS1(1), SOS2(2) | 1650651 | 45 | 28 | 23 | 2 | 15 | 3 | 3 | 24 | 0 | 0 | 0.00011 | 6.5e-12 | 2e-09 |
| 3 | ST_DIFFERENTIATION_PATHWAY_IN_PC12_CELLS | Rat-derived PC12 cells respond to nerve growth factor (NGF) and PACAP to differentiate into neuronal cells. | AKT1, ASAH1, ATF1, BRAF, CAMP, CREB1, CREB3, CREB5, CREBBP, CRKL, DAG1, EGR1, EGR2, EGR3, EGR4, ELK1, FRS2, GAS, GNAQ, GRF2, JUN, MAP1B, MAP2K4, MAP2K7, MAPK1, MAPK10, MAPK3, MAPK8, MAPK8IP1, MAPK8IP2, MAPK8IP3, MAPK9, NTRK1, OPN1LW, PACAP, PIK3C2G, PIK3CA, PIK3CD, PIK3R1, PTPN11, RPS6KA3, SH2B, SHC1, SRC, TERF2IP, TH, TUBA3 | 42 | ATF1(1), BRAF(24), CREB5(2), CREBBP(3), DAG1(1), FRS2(1), GNAQ(2), MAPK10(1), MAPK8(1), MAPK8IP1(1), MAPK8IP2(2), MAPK8IP3(1), MAPK9(2), NTRK1(4), OPN1LW(1), PIK3C2G(7), PIK3CA(1), PIK3R1(4), PTPN11(1), SHC1(2), TERF2IP(1) | 2864884 | 63 | 30 | 43 | 5 | 20 | 3 | 4 | 31 | 5 | 0 | 0.000034 | 5.1e-09 | 1e-06 |
| 4 | ST_ADRENERGIC | Adrenergic receptors respond to epinephrine and norepinephrine signaling. | AKT1, APC, AR, ASAH1, BF, BRAF, CAMP, CCL13, CCL15, CCL16, DAG1, EGFR, GAS, GNA11, GNA15, GNAI1, GNAQ, ITPKA, ITPKB, ITPR1, ITPR2, ITPR3, KCNJ3, KCNJ5, KCNJ9, MAPK1, MAPK10, MAPK14, PHKA2, PIK3CA, PIK3CD, PIK3R1, PITX2, PTX1, PTX3, RAF1, SRC | 34 | APC(3), BRAF(24), CCL13(1), DAG1(1), EGFR(1), GNAQ(2), ITPKA(1), ITPR1(7), ITPR2(1), ITPR3(3), KCNJ3(4), KCNJ5(3), MAPK10(1), PIK3CA(1), PIK3R1(4) | 2987528 | 57 | 29 | 37 | 9 | 17 | 2 | 4 | 31 | 3 | 0 | 0.0045 | 0.00037 | 0.057 |
| 5 | MAPKPATHWAY | The mitogen-activated protein (MAP) kinase pathway is a common signaling mechanism and has four main sub-pathways: Erk, JNK/SAPK, p53, and ERK5. | ARAF1, ATF2, BRAF, CEBPA, CHUK, CREB1, DAXX, ELK1, FOS, GRB2, HRAS, IKBKB, JUN, MAP2K1, MAP2K2, MAP2K3, MAP2K4, MAP2K5, MAP2K6, MAP2K7, MAP3K1, MAP3K10, MAP3K11, MAP3K12, MAP3K13, MAP3K14, MAP3K2, MAP3K3, MAP3K4, MAP3K5, MAP3K6, MAP3K7, MAP3K8, MAP3K9, MAP4K1, MAP4K2, MAP4K3, MAP4K4, MAP4K5, MAPK1, MAPK10, MAPK11, MAPK12, MAPK13, MAPK14, MAPK3, MAPK4, MAPK6, MAPK7, MAPK8, MAPK9, MAPKAPK2, MAPKAPK3, MAPKAPK5, MAX, MEF2A, MEF2B, MEF2C, MEF2D, MKNK1, MKNK2, MYC, NFKB1, NFKBIA, PAK1, PAK2, PDZGEF1, RAC1, RAF1, RELA, RIPK1, RPS6KA1, RPS6KA2, RPS6KA3, RPS6KA4, RPS6KA5, RPS6KB1, RPS6KB2, SHC1, SP1, STAT1, TGFB1, TGFB2, TGFB3, TGFBR1, TRADD, TRAF2 | 84 | BRAF(24), DAXX(1), HRAS(1), IKBKB(1), MAP2K1(3), MAP2K2(1), MAP2K3(2), MAP3K1(1), MAP3K12(1), MAP3K14(1), MAP3K5(2), MAP3K9(2), MAP4K4(1), MAPK10(1), MAPK12(1), MAPK13(1), MAPK4(3), MAPK8(1), MAPK9(2), MAPKAPK3(1), MEF2B(1), MEF2C(1), MEF2D(1), MYC(1), RELA(1), RPS6KA1(3), RPS6KA2(1), RPS6KA4(1), SHC1(2), TRAF2(1) | 5298061 | 64 | 32 | 42 | 7 | 28 | 4 | 4 | 25 | 3 | 0 | 0.000066 | 0.0016 | 0.18 |
| 6 | HSA04320_DORSO_VENTRAL_AXIS_FORMATION | Genes involved in dorso-ventral axis formation | BRAF, CPEB1, EGFR, ERBB2, ERBB4, ETS1, ETS2, ETV6, ETV7, FMN2, GRB2, KRAS, MAP2K1, MAPK1, MAPK3, NOTCH1, NOTCH2, NOTCH3, NOTCH4, PIWIL1, PIWIL2, PIWIL3, PIWIL4, RAF1, SOS1, SOS2, SPIRE1, SPIRE2 | 28 | BRAF(24), EGFR(1), ERBB4(3), ETS1(1), ETS2(1), ETV6(2), FMN2(3), MAP2K1(3), NOTCH2(4), NOTCH4(3), PIWIL1(1), PIWIL2(2), PIWIL4(2), SOS1(1), SOS2(2) | 2938184 | 53 | 27 | 31 | 9 | 16 | 1 | 2 | 29 | 5 | 0 | 0.026 | 0.0021 | 0.18 |
| 7 | ARFPATHWAY | Cyclin-dependent kinase inhibitor 2A is a tumor suppressor that induces G1 arrest and can activate the p53 pathway, leading to G2/M arrest. | ABL1, CDKN2A, E2F1, MDM2, MYC, PIK3CA, PIK3R1, POLR1A, POLR1B, POLR1C, POLR1D, RAC1, RB1, TBX2, TP53, TWIST1 | 16 | CDKN2A(1), E2F1(2), MDM2(1), MYC(1), PIK3CA(1), PIK3R1(4), POLR1B(1), TP53(4) | 1134716 | 15 | 13 | 15 | 1 | 3 | 1 | 3 | 3 | 5 | 0 | 0.023 | 0.0021 | 0.18 |
| 8 | ERK5PATHWAY | Signaling between a tissue and its innervating axon stimulates retrograde transport via Trk receptors, which activate Erk5, which induces transcription of anti-apoptotic factors. | AKT1, CREB1, GRB2, HRAS, MAPK1, MAPK3, MAPK7, MEF2A, MEF2B, MEF2C, MEF2D, NTRK1, PIK3CA, PIK3R1, PLCG1, RPS6KA1, SHC1 | 17 | HRAS(1), MEF2B(1), MEF2C(1), MEF2D(1), NTRK1(4), PIK3CA(1), PIK3R1(4), RPS6KA1(3), SHC1(2) | 1061373 | 18 | 13 | 18 | 2 | 5 | 3 | 3 | 2 | 5 | 0 | 0.015 | 0.0024 | 0.19 |
| 9 | NKCELLSPATHWAY | Natural killer (NK) lymphocytes are inhibited by MHC and activated by surface glycoproteins on tumor or virus-infected cells, which undergo perforin-mediated lysis. | B2M, HLA-A, IL18, ITGB1, KLRC1, KLRC2, KLRC3, KLRC4, KLRD1, LAT, MAP2K1, MAPK3, PAK1, PIK3CA, PIK3R1, PTK2B, PTPN6, RAC1, SYK, VAV1 | 20 | B2M(1), KLRC1(1), MAP2K1(3), PIK3CA(1), PIK3R1(4), PTK2B(1), SYK(2), VAV1(2) | 1042544 | 15 | 12 | 13 | 1 | 8 | 1 | 1 | 2 | 3 | 0 | 0.014 | 0.0039 | 0.27 |
| 10 | SA_G1_AND_S_PHASES | Cdk2, 4, and 6 bind cyclin D in G1, while cdk2/cyclin E promotes the G1/S transition. | ARF1, ARF3, CCND1, CDK2, CDK4, CDKN1A, CDKN1B, CDKN2A, CFL1, E2F1, E2F2, MDM2, NXT1, PRB1, TP53 | 15 | CDKN2A(1), E2F1(2), MDM2(1), PRB1(5), TP53(4) | 471635 | 13 | 9 | 13 | 1 | 7 | 1 | 2 | 1 | 2 | 0 | 0.02 | 0.0058 | 0.36 |
Table 7. Get Full Table A Ranked List of Significantly Mutated Genesets (Excluding Significantly Mutated Genes). Number of significant genesets found: 0. Number of genesets displayed: 10
| rank | geneset | description | genes | N_genes | mut_tally | N | n | npat | nsite | nsil | n1 | n2 | n3 | n4 | n5 | n6 | p_ns_s | p | q |
|---|---|---|---|---|---|---|---|---|---|---|---|---|---|---|---|---|---|---|---|
| 1 | ARFPATHWAY | Cyclin-dependent kinase inhibitor 2A is a tumor suppressor that induces G1 arrest and can activate the p53 pathway, leading to G2/M arrest. | ABL1, CDKN2A, E2F1, MDM2, MYC, PIK3CA, PIK3R1, POLR1A, POLR1B, POLR1C, POLR1D, RAC1, RB1, TBX2, TP53, TWIST1 | 16 | CDKN2A(1), E2F1(2), MDM2(1), MYC(1), PIK3CA(1), PIK3R1(4), POLR1B(1), TP53(4) | 1134716 | 15 | 13 | 15 | 1 | 3 | 1 | 3 | 3 | 5 | 0 | 0.023 | 0.0021 | 0.75 |
| 2 | ERK5PATHWAY | Signaling between a tissue and its innervating axon stimulates retrograde transport via Trk receptors, which activate Erk5, which induces transcription of anti-apoptotic factors. | AKT1, CREB1, GRB2, HRAS, MAPK1, MAPK3, MAPK7, MEF2A, MEF2B, MEF2C, MEF2D, NTRK1, PIK3CA, PIK3R1, PLCG1, RPS6KA1, SHC1 | 17 | HRAS(1), MEF2B(1), MEF2C(1), MEF2D(1), NTRK1(4), PIK3CA(1), PIK3R1(4), RPS6KA1(3), SHC1(2) | 1061373 | 18 | 13 | 18 | 2 | 5 | 3 | 3 | 2 | 5 | 0 | 0.015 | 0.0024 | 0.75 |
| 3 | SA_G1_AND_S_PHASES | Cdk2, 4, and 6 bind cyclin D in G1, while cdk2/cyclin E promotes the G1/S transition. | ARF1, ARF3, CCND1, CDK2, CDK4, CDKN1A, CDKN1B, CDKN2A, CFL1, E2F1, E2F2, MDM2, NXT1, PRB1, TP53 | 15 | CDKN2A(1), E2F1(2), MDM2(1), PRB1(5), TP53(4) | 471635 | 13 | 9 | 13 | 1 | 7 | 1 | 2 | 1 | 2 | 0 | 0.02 | 0.0058 | 1 |
| 4 | MITRPATHWAY | The MyoD/MEF2 transcription factors induce muscle cell differentiation and are repressed by the transcriptional repressor MITR. | CAMK1, CAMK1G, HDAC9, MEF2A, MEF2B, MEF2C, MEF2D, MYOD1, YWHAH | 9 | CAMK1(1), CAMK1G(2), HDAC9(6), MEF2B(1), MEF2C(1), MEF2D(1) | 421151 | 12 | 9 | 12 | 1 | 8 | 1 | 0 | 1 | 2 | 0 | 0.024 | 0.014 | 1 |
| 5 | GSPATHWAY | Activated G-protein coupled receptors stimulate cAMP production and thus activate protein kinase A, involved in a number of signal transduction pathways. | ADCY1, GNAS, GNB1, GNGT1, PRKACA, PRKAR1A | 6 | ADCY1(3), GNAS(3), PRKACA(1), PRKAR1A(1) | 366518 | 8 | 8 | 7 | 1 | 6 | 0 | 0 | 1 | 1 | 0 | 0.15 | 0.016 | 1 |
| 6 | HSA00130_UBIQUINONE_BIOSYNTHESIS | Genes involved in ubiquinone biosynthesis | COQ2, COQ3, COQ5, COQ6, COQ7, ND1, ND2, ND3, ND4, ND4L, ND5, ND6, NDUFA12, NDUFA13, NDUFB11 | 8 | COQ3(2), COQ5(1), COQ6(1), NDUFA13(1) | 224210 | 5 | 5 | 5 | 1 | 2 | 0 | 1 | 1 | 1 | 0 | 0.39 | 0.025 | 1 |
| 7 | HSA00902_MONOTERPENOID_BIOSYNTHESIS | Genes involved in monoterpenoid biosynthesis | CYP2C19, CYP2C9 | 2 | CYP2C19(7), CYP2C9(3) | 113730 | 10 | 8 | 10 | 4 | 5 | 1 | 0 | 3 | 1 | 0 | 0.45 | 0.033 | 1 |
| 8 | NKCELLSPATHWAY | Natural killer (NK) lymphocytes are inhibited by MHC and activated by surface glycoproteins on tumor or virus-infected cells, which undergo perforin-mediated lysis. | B2M, HLA-A, IL18, ITGB1, KLRC1, KLRC2, KLRC3, KLRC4, KLRD1, LAT, MAP2K1, MAPK3, PAK1, PIK3CA, PIK3R1, PTK2B, PTPN6, RAC1, SYK, VAV1 | 19 | B2M(1), KLRC1(1), PIK3CA(1), PIK3R1(4), PTK2B(1), SYK(2), VAV1(2) | 999149 | 12 | 9 | 12 | 1 | 5 | 1 | 1 | 2 | 3 | 0 | 0.047 | 0.034 | 1 |
| 9 | CDC42RACPATHWAY | PI3 kinase stimulates cell migration by activating cdc42, which activates ARP2/3, which in turn promotes formation of new actin fibers. | ACTR2, ACTR3, ARHA, ARPC1A, ARPC1B, ARPC2, ARPC3, ARPC4, CDC42, PAK1, PDGFRA, PIK3CA, PIK3R1, RAC1, WASL | 14 | ARPC1A(1), CDC42(1), PDGFRA(5), PIK3CA(1), PIK3R1(4) | 755052 | 12 | 11 | 12 | 3 | 3 | 2 | 2 | 2 | 3 | 0 | 0.3 | 0.047 | 1 |
| 10 | CREMPATHWAY | The transcription factor CREM activates a post-meiotic transcriptional cascade culminating in spermatogenesis. | ADCY1, CREM, FHL5, FSHB, FSHR, GNAS, XPO1 | 7 | ADCY1(3), FHL5(1), FSHR(4), GNAS(3) | 532879 | 11 | 10 | 10 | 1 | 10 | 1 | 0 | 0 | 0 | 0 | 0.034 | 0.048 | 1 |
In brief, we tabulate the number of mutations and the number of covered bases for each gene. The counts are broken down by mutation context category: four context categories that are discovered by MutSig, and one for indel and 'null' mutations, which include indels, nonsense mutations, splice-site mutations, and non-stop (read-through) mutations. For each gene, we calculate the probability of seeing the observed constellation of mutations, i.e. the product P1 x P2 x ... x Pm, or a more extreme one, given the background mutation rates calculated across the dataset. [1]
This is an experimental feature. The full results of the analysis summarized in this report can be downloaded from the TCGA Data Coordination Center.