(All_Samples cohort)
This pipeline computes the correlation between significant arm-level copy number variations (cnvs) and selected clinical features.
Testing the association between copy number variation 77 arm-level results and 9 clinical features across 202 patients, one significant finding detected with Q value < 0.25.
-
18q gain cnv correlated to 'NEOPLASM.DISEASESTAGE'.
Table 1. Get Full Table Overview of the association between significant copy number variation of 77 arm-level results and 9 clinical features. Shown in the table are P values (Q values). Thresholded by Q value < 0.25, one significant finding detected.
|
Clinical Features |
Time to Death |
AGE |
PRIMARY SITE OF DISEASE |
GENDER |
RADIATIONS RADIATION REGIMENINDICATION |
DISTANT METASTASIS |
LYMPH NODE METASTASIS |
TUMOR STAGECODE |
NEOPLASM DISEASESTAGE |
||
| nCNV (%) | nWild-Type | logrank test | t-test | Fisher's exact test | Fisher's exact test | Fisher's exact test | Chi-square test | Chi-square test | t-test | Chi-square test | |
| 18q gain | 15 (7%) | 187 |
0.731 (1.00) |
0.282 (1.00) |
0.169 (1.00) |
0.581 (1.00) |
1 (1.00) |
0.949 (1.00) |
0.509 (1.00) |
0.000104 (0.0636) |
|
| 1p gain | 26 (13%) | 176 |
0.168 (1.00) |
0.0899 (1.00) |
0.68 (1.00) |
0.83 (1.00) |
0.34 (1.00) |
0.831 (1.00) |
0.0742 (1.00) |
0.0214 (1.00) |
|
| 1q gain | 67 (33%) | 135 |
0.749 (1.00) |
0.924 (1.00) |
0.0191 (1.00) |
1 (1.00) |
0.552 (1.00) |
0.683 (1.00) |
0.0348 (1.00) |
0.149 (1.00) |
|
| 2p gain | 19 (9%) | 183 |
0.315 (1.00) |
0.0188 (1.00) |
0.692 (1.00) |
0.33 (1.00) |
0.258 (1.00) |
0.907 (1.00) |
0.245 (1.00) |
0.657 (1.00) |
|
| 2q gain | 17 (8%) | 185 |
0.445 (1.00) |
0.118 (1.00) |
0.631 (1.00) |
0.297 (1.00) |
0.233 (1.00) |
0.925 (1.00) |
0.32 (1.00) |
0.648 (1.00) |
|
| 3p gain | 20 (10%) | 182 |
0.345 (1.00) |
0.804 (1.00) |
0.0128 (1.00) |
0.235 (1.00) |
0.27 (1.00) |
0.907 (1.00) |
0.786 (1.00) |
0.613 (1.00) |
|
| 3q gain | 25 (12%) | 177 |
0.318 (1.00) |
0.52 (1.00) |
0.0196 (1.00) |
0.275 (1.00) |
0.329 (1.00) |
0.854 (1.00) |
0.525 (1.00) |
0.696 (1.00) |
|
| 4p gain | 17 (8%) | 185 |
0.194 (1.00) |
0.0762 (1.00) |
0.342 (1.00) |
0.439 (1.00) |
1 (1.00) |
0.934 (1.00) |
0.289 (1.00) |
0.529 (1.00) |
|
| 4q gain | 13 (6%) | 189 |
0.173 (1.00) |
0.0689 (1.00) |
0.466 (1.00) |
1 (1.00) |
1 (1.00) |
0.969 (1.00) |
0.409 (1.00) |
0.642 (1.00) |
|
| 5p gain | 24 (12%) | 178 |
0.913 (1.00) |
0.492 (1.00) |
0.0842 (1.00) |
0.379 (1.00) |
1 (1.00) |
0.204 (1.00) |
0.787 (1.00) |
0.51 (1.00) |
|
| 5q gain | 7 (3%) | 195 |
0.139 (1.00) |
0.125 (1.00) |
0.713 (1.00) |
1 (1.00) |
0.989 (1.00) |
0.579 (1.00) |
0.433 (1.00) |
||
| 6p gain | 67 (33%) | 135 |
0.0819 (1.00) |
0.525 (1.00) |
0.163 (1.00) |
0.441 (1.00) |
0.552 (1.00) |
0.14 (1.00) |
0.193 (1.00) |
0.263 (1.00) |
|
| 6q gain | 16 (8%) | 186 |
0.796 (1.00) |
0.768 (1.00) |
0.348 (1.00) |
1 (1.00) |
1 (1.00) |
0.255 (1.00) |
0.927 (1.00) |
0.54 (1.00) |
|
| 7p gain | 85 (42%) | 117 |
0.118 (1.00) |
0.897 (1.00) |
0.428 (1.00) |
0.105 (1.00) |
1 (1.00) |
0.104 (1.00) |
0.471 (1.00) |
0.336 (1.00) |
|
| 7q gain | 86 (43%) | 116 |
0.341 (1.00) |
0.516 (1.00) |
0.627 (1.00) |
0.379 (1.00) |
1 (1.00) |
0.12 (1.00) |
0.444 (1.00) |
0.0766 (1.00) |
|
| 8p gain | 39 (19%) | 163 |
0.713 (1.00) |
0.784 (1.00) |
0.127 (1.00) |
0.362 (1.00) |
0.476 (1.00) |
0.0371 (1.00) |
0.473 (1.00) |
0.818 (1.00) |
|
| 8q gain | 63 (31%) | 139 |
0.413 (1.00) |
0.37 (1.00) |
0.338 (1.00) |
0.64 (1.00) |
0.554 (1.00) |
0.137 (1.00) |
0.396 (1.00) |
0.794 (1.00) |
|
| 9p gain | 3 (1%) | 199 |
0.0392 (1.00) |
1 (1.00) |
0.558 (1.00) |
1 (1.00) |
0.997 (1.00) |
0.0339 (1.00) |
0.439 (1.00) |
||
| 9q gain | 4 (2%) | 198 |
0.406 (1.00) |
0.662 (1.00) |
0.51 (1.00) |
0.633 (1.00) |
1 (1.00) |
0.995 (1.00) |
0.303 (1.00) |
0.65 (1.00) |
|
| 11p gain | 13 (6%) | 189 |
0.882 (1.00) |
0.123 (1.00) |
0.794 (1.00) |
0.378 (1.00) |
0.182 (1.00) |
0.957 (1.00) |
0.349 (1.00) |
0.951 (1.00) |
|
| 11q gain | 9 (4%) | 193 |
0.977 (1.00) |
0.212 (1.00) |
0.903 (1.00) |
1 (1.00) |
1 (1.00) |
0.98 (1.00) |
0.945 (1.00) |
0.713 (1.00) |
|
| 12p gain | 19 (9%) | 183 |
0.465 (1.00) |
0.464 (1.00) |
0.155 (1.00) |
0.628 (1.00) |
1 (1.00) |
0.0913 (1.00) |
0.16 (1.00) |
0.0969 (1.00) |
|
| 12q gain | 7 (3%) | 195 |
0.947 (1.00) |
0.816 (1.00) |
0.827 (1.00) |
0.259 (1.00) |
1 (1.00) |
0.989 (1.00) |
0.0166 (1.00) |
0.0881 (1.00) |
|
| 13q gain | 35 (17%) | 167 |
0.514 (1.00) |
0.925 (1.00) |
0.0432 (1.00) |
1 (1.00) |
1 (1.00) |
0.551 (1.00) |
0.161 (1.00) |
0.613 (1.00) |
|
| 14q gain | 14 (7%) | 188 |
0.587 (1.00) |
0.91 (1.00) |
0.548 (1.00) |
0.575 (1.00) |
1 (1.00) |
0.957 (1.00) |
0.766 (1.00) |
0.983 (1.00) |
|
| 15q gain | 26 (13%) | 176 |
0.533 (1.00) |
0.506 (1.00) |
0.125 (1.00) |
1 (1.00) |
1 (1.00) |
0.842 (1.00) |
0.453 (1.00) |
0.906 (1.00) |
|
| 16p gain | 14 (7%) | 188 |
0.223 (1.00) |
0.703 (1.00) |
0.369 (1.00) |
1 (1.00) |
1 (1.00) |
0.942 (1.00) |
0.591 (1.00) |
0.463 (1.00) |
|
| 16q gain | 13 (6%) | 189 |
0.39 (1.00) |
0.979 (1.00) |
0.643 (1.00) |
0.77 (1.00) |
1 (1.00) |
0.949 (1.00) |
0.243 (1.00) |
0.692 (1.00) |
|
| 17p gain | 15 (7%) | 187 |
0.9 (1.00) |
0.915 (1.00) |
0.233 (1.00) |
0.267 (1.00) |
1 (1.00) |
0.185 (1.00) |
0.937 (1.00) |
0.546 (1.00) |
|
| 17q gain | 24 (12%) | 178 |
0.0853 (1.00) |
0.102 (1.00) |
0.129 (1.00) |
0.187 (1.00) |
1 (1.00) |
0.446 (1.00) |
0.69 (1.00) |
0.868 (1.00) |
|
| 18p gain | 25 (12%) | 177 |
0.838 (1.00) |
0.0322 (1.00) |
0.662 (1.00) |
0.275 (1.00) |
0.329 (1.00) |
0.465 (1.00) |
0.615 (1.00) |
0.0185 (1.00) |
|
| 19p gain | 12 (6%) | 190 |
0.607 (1.00) |
0.227 (1.00) |
0.086 (1.00) |
0.767 (1.00) |
0.169 (1.00) |
0.963 (1.00) |
0.989 (1.00) |
0.0497 (1.00) |
|
| 19q gain | 15 (7%) | 187 |
0.5 (1.00) |
0.152 (1.00) |
0.229 (1.00) |
0.094 (1.00) |
1 (1.00) |
0.942 (1.00) |
0.883 (1.00) |
0.0741 (1.00) |
|
| 20p gain | 57 (28%) | 145 |
0.78 (1.00) |
0.486 (1.00) |
0.314 (1.00) |
0.519 (1.00) |
1 (1.00) |
0.114 (1.00) |
0.788 (1.00) |
0.668 (1.00) |
|
| 20q gain | 70 (35%) | 132 |
0.69 (1.00) |
0.863 (1.00) |
0.245 (1.00) |
0.542 (1.00) |
1 (1.00) |
0.0508 (1.00) |
0.943 (1.00) |
0.809 (1.00) |
|
| 21q gain | 22 (11%) | 180 |
0.0174 (1.00) |
0.915 (1.00) |
0.384 (1.00) |
0.487 (1.00) |
1 (1.00) |
0.134 (1.00) |
0.344 (1.00) |
0.0996 (1.00) |
|
| 22q gain | 50 (25%) | 152 |
0.372 (1.00) |
0.898 (1.00) |
0.313 (1.00) |
0.315 (1.00) |
1 (1.00) |
0.551 (1.00) |
0.14 (1.00) |
0.1 (1.00) |
|
| Xq gain | 4 (2%) | 198 |
0.0323 (1.00) |
0.296 (1.00) |
1 (1.00) |
1 (1.00) |
0.997 (1.00) |
0.989 (1.00) |
0.384 (1.00) |
||
| 1p loss | 16 (8%) | 186 |
0.564 (1.00) |
0.697 (1.00) |
0.779 (1.00) |
0.601 (1.00) |
1 (1.00) |
0.949 (1.00) |
0.421 (1.00) |
0.622 (1.00) |
|
| 1q loss | 7 (3%) | 195 |
0.591 (1.00) |
0.252 (1.00) |
0.179 (1.00) |
0.429 (1.00) |
0.101 (1.00) |
0.989 (1.00) |
0.724 (1.00) |
0.857 (1.00) |
|
| 2p loss | 19 (9%) | 183 |
0.632 (1.00) |
0.676 (1.00) |
0.982 (1.00) |
1 (1.00) |
0.258 (1.00) |
0.934 (1.00) |
0.713 (1.00) |
0.378 (1.00) |
|
| 2q loss | 17 (8%) | 185 |
0.697 (1.00) |
0.344 (1.00) |
0.87 (1.00) |
0.797 (1.00) |
0.233 (1.00) |
0.22 (1.00) |
0.926 (1.00) |
0.307 (1.00) |
|
| 3p loss | 13 (6%) | 189 |
0.259 (1.00) |
0.207 (1.00) |
0.352 (1.00) |
1 (1.00) |
1 (1.00) |
0.963 (1.00) |
0.23 (1.00) |
0.0422 (1.00) |
|
| 3q loss | 13 (6%) | 189 |
0.253 (1.00) |
0.449 (1.00) |
0.375 (1.00) |
0.561 (1.00) |
1 (1.00) |
0.963 (1.00) |
0.23 (1.00) |
0.365 (1.00) |
|
| 4p loss | 22 (11%) | 180 |
0.978 (1.00) |
0.379 (1.00) |
0.4 (1.00) |
0.103 (1.00) |
1 (1.00) |
0.376 (1.00) |
0.869 (1.00) |
0.658 (1.00) |
|
| 4q loss | 23 (11%) | 179 |
0.896 (1.00) |
0.592 (1.00) |
0.303 (1.00) |
0.169 (1.00) |
1 (1.00) |
0.00161 (0.981) |
0.807 (1.00) |
0.199 (1.00) |
|
| 5p loss | 25 (12%) | 177 |
0.604 (1.00) |
0.639 (1.00) |
1 (1.00) |
1 (1.00) |
0.329 (1.00) |
0.887 (1.00) |
0.912 (1.00) |
0.879 (1.00) |
|
| 5q loss | 41 (20%) | 161 |
0.772 (1.00) |
0.416 (1.00) |
0.824 (1.00) |
0.471 (1.00) |
0.496 (1.00) |
0.12 (1.00) |
0.464 (1.00) |
0.487 (1.00) |
|
| 6p loss | 16 (8%) | 186 |
0.749 (1.00) |
0.956 (1.00) |
0.532 (1.00) |
0.601 (1.00) |
1 (1.00) |
0.934 (1.00) |
0.854 (1.00) |
0.517 (1.00) |
|
| 6q loss | 74 (37%) | 128 |
0.767 (1.00) |
0.084 (1.00) |
0.11 (1.00) |
0.764 (1.00) |
0.3 (1.00) |
0.982 (1.00) |
0.892 (1.00) |
0.534 (1.00) |
|
| 7p loss | 3 (1%) | 199 |
0.621 (1.00) |
0.418 (1.00) |
0.558 (1.00) |
1 (1.00) |
0.997 (1.00) |
0.965 (1.00) |
0.583 (1.00) |
||
| 7q loss | 3 (1%) | 199 |
0.621 (1.00) |
0.418 (1.00) |
0.558 (1.00) |
1 (1.00) |
0.997 (1.00) |
0.965 (1.00) |
0.583 (1.00) |
||
| 8p loss | 27 (13%) | 175 |
0.403 (1.00) |
0.823 (1.00) |
0.0953 (1.00) |
0.401 (1.00) |
1 (1.00) |
0.482 (1.00) |
0.648 (1.00) |
0.558 (1.00) |
|
| 8q loss | 6 (3%) | 196 |
1 (1.00) |
0.179 (1.00) |
0.0477 (1.00) |
0.674 (1.00) |
1 (1.00) |
0.989 (1.00) |
0.327 (1.00) |
0.555 (1.00) |
|
| 9p loss | 117 (58%) | 85 |
0.0344 (1.00) |
0.606 (1.00) |
0.0869 (1.00) |
1 (1.00) |
0.574 (1.00) |
0.441 (1.00) |
0.0633 (1.00) |
0.0283 (1.00) |
|
| 9q loss | 83 (41%) | 119 |
0.253 (1.00) |
0.178 (1.00) |
0.0868 (1.00) |
0.0552 (1.00) |
1 (1.00) |
0.101 (1.00) |
0.499 (1.00) |
0.00977 (1.00) |
|
| 10p loss | 88 (44%) | 114 |
0.089 (1.00) |
0.0748 (1.00) |
0.428 (1.00) |
0.187 (1.00) |
1 (1.00) |
0.688 (1.00) |
0.551 (1.00) |
0.751 (1.00) |
|
| 10q loss | 100 (50%) | 102 |
0.253 (1.00) |
0.00193 (1.00) |
0.167 (1.00) |
0.245 (1.00) |
1 (1.00) |
0.354 (1.00) |
0.767 (1.00) |
0.83 (1.00) |
|
| 11p loss | 51 (25%) | 151 |
0.867 (1.00) |
0.345 (1.00) |
0.791 (1.00) |
0.242 (1.00) |
0.573 (1.00) |
0.277 (1.00) |
0.108 (1.00) |
0.0254 (1.00) |
|
| 11q loss | 55 (27%) | 147 |
0.578 (1.00) |
0.893 (1.00) |
0.884 (1.00) |
0.103 (1.00) |
0.564 (1.00) |
0.352 (1.00) |
0.323 (1.00) |
0.049 (1.00) |
|
| 12p loss | 13 (6%) | 189 |
0.265 (1.00) |
0.964 (1.00) |
0.456 (1.00) |
0.561 (1.00) |
0.182 (1.00) |
0.406 (1.00) |
0.405 (1.00) |
0.489 (1.00) |
|
| 12q loss | 24 (12%) | 178 |
0.904 (1.00) |
0.842 (1.00) |
0.141 (1.00) |
0.187 (1.00) |
0.317 (1.00) |
0.322 (1.00) |
0.671 (1.00) |
0.787 (1.00) |
|
| 13q loss | 29 (14%) | 173 |
0.743 (1.00) |
0.348 (1.00) |
0.229 (1.00) |
1 (1.00) |
0.373 (1.00) |
0.00746 (1.00) |
0.00859 (1.00) |
0.286 (1.00) |
|
| 14q loss | 47 (23%) | 155 |
0.798 (1.00) |
0.718 (1.00) |
0.872 (1.00) |
0.865 (1.00) |
1 (1.00) |
0.306 (1.00) |
0.494 (1.00) |
0.595 (1.00) |
|
| 15q loss | 12 (6%) | 190 |
0.467 (1.00) |
0.138 (1.00) |
0.158 (1.00) |
0.767 (1.00) |
1 (1.00) |
0.0843 (1.00) |
0.48 (1.00) |
0.869 (1.00) |
|
| 16p loss | 15 (7%) | 187 |
0.441 (1.00) |
0.326 (1.00) |
0.642 (1.00) |
0.581 (1.00) |
1 (1.00) |
0.957 (1.00) |
0.785 (1.00) |
0.211 (1.00) |
|
| 16q loss | 38 (19%) | 164 |
0.0962 (1.00) |
0.633 (1.00) |
0.403 (1.00) |
0.853 (1.00) |
1 (1.00) |
0.434 (1.00) |
0.748 (1.00) |
0.206 (1.00) |
|
| 17p loss | 41 (20%) | 161 |
0.99 (1.00) |
0.501 (1.00) |
0.677 (1.00) |
0.719 (1.00) |
1 (1.00) |
0.604 (1.00) |
0.76 (1.00) |
0.551 (1.00) |
|
| 17q loss | 20 (10%) | 182 |
0.322 (1.00) |
0.647 (1.00) |
0.803 (1.00) |
1 (1.00) |
1 (1.00) |
0.224 (1.00) |
0.152 (1.00) |
0.617 (1.00) |
|
| 18p loss | 39 (19%) | 163 |
0.834 (1.00) |
0.661 (1.00) |
0.551 (1.00) |
0.713 (1.00) |
0.476 (1.00) |
0.698 (1.00) |
0.628 (1.00) |
0.145 (1.00) |
|
| 18q loss | 36 (18%) | 166 |
0.938 (1.00) |
0.566 (1.00) |
0.567 (1.00) |
0.852 (1.00) |
0.447 (1.00) |
0.567 (1.00) |
0.281 (1.00) |
0.0446 (1.00) |
|
| 19p loss | 18 (9%) | 184 |
0.821 (1.00) |
0.697 (1.00) |
0.78 (1.00) |
0.127 (1.00) |
1 (1.00) |
0.159 (1.00) |
0.862 (1.00) |
0.349 (1.00) |
|
| 19q loss | 19 (9%) | 183 |
0.51 (1.00) |
0.742 (1.00) |
0.21 (1.00) |
0.456 (1.00) |
1 (1.00) |
0.129 (1.00) |
0.785 (1.00) |
0.484 (1.00) |
|
| 20p loss | 8 (4%) | 194 |
0.188 (1.00) |
0.213 (1.00) |
0.111 (1.00) |
0.713 (1.00) |
1 (1.00) |
0.0335 (1.00) |
0.94 (1.00) |
0.774 (1.00) |
|
| 21q loss | 24 (12%) | 178 |
0.881 (1.00) |
0.843 (1.00) |
0.901 (1.00) |
1 (1.00) |
1 (1.00) |
0.854 (1.00) |
0.585 (1.00) |
0.105 (1.00) |
|
| 22q loss | 15 (7%) | 187 |
0.305 (1.00) |
0.824 (1.00) |
0.468 (1.00) |
0.581 (1.00) |
1 (1.00) |
0.255 (1.00) |
0.973 (1.00) |
0.37 (1.00) |
|
| Xq loss | 5 (2%) | 197 |
0.65 (1.00) |
0.932 (1.00) |
0.914 (1.00) |
0.0676 (1.00) |
1 (1.00) |
0.995 (1.00) |
0.97 (1.00) |
0.126 (1.00) |
P value = 0.000104 (Chi-square test), Q value = 0.064
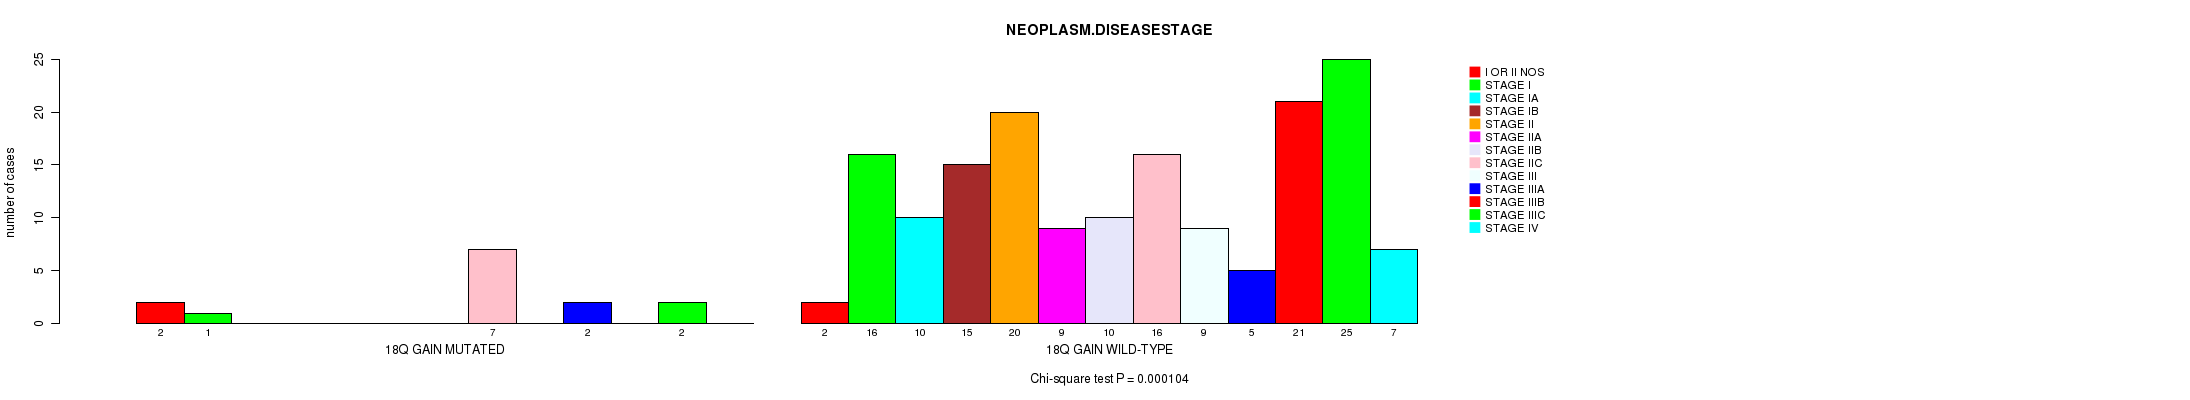
Table S1. Gene #31: '18q gain mutation analysis' versus Clinical Feature #9: 'NEOPLASM.DISEASESTAGE'
| nPatients | I OR II NOS | STAGE I | STAGE IA | STAGE IB | STAGE II | STAGE IIA | STAGE IIB | STAGE IIC | STAGE III | STAGE IIIA | STAGE IIIB | STAGE IIIC | STAGE IV |
|---|---|---|---|---|---|---|---|---|---|---|---|---|---|
| ALL | 4 | 17 | 10 | 15 | 20 | 9 | 10 | 23 | 9 | 7 | 21 | 27 | 7 |
| 18Q GAIN MUTATED | 2 | 1 | 0 | 0 | 0 | 0 | 0 | 7 | 0 | 2 | 0 | 2 | 0 |
| 18Q GAIN WILD-TYPE | 2 | 16 | 10 | 15 | 20 | 9 | 10 | 16 | 9 | 5 | 21 | 25 | 7 |
Figure S1. Get High-res Image Gene #31: '18q gain mutation analysis' versus Clinical Feature #9: 'NEOPLASM.DISEASESTAGE'
-
Mutation data file = broad_values_by_arm.mutsig.cluster.txt
-
Clinical data file = SKCM-All_Samples.clin.merged.picked.txt
-
Number of patients = 202
-
Number of significantly arm-level cnvs = 77
-
Number of selected clinical features = 9
-
Exclude genes that fewer than K tumors have mutations, K = 3
For survival clinical features, the Kaplan-Meier survival curves of tumors with and without gene mutations were plotted and the statistical significance P values were estimated by logrank test (Bland and Altman 2004) using the 'survdiff' function in R
For continuous numerical clinical features, two-tailed Student's t test with unequal variance (Lehmann and Romano 2005) was applied to compare the clinical values between tumors with and without gene mutations using 't.test' function in R
For binary or multi-class clinical features (nominal or ordinal), two-tailed Fisher's exact tests (Fisher 1922) were used to estimate the P values using the 'fisher.test' function in R
For multi-class clinical features (nominal or ordinal), Chi-square tests (Greenwood and Nikulin 1996) were used to estimate the P values using the 'chisq.test' function in R
For multiple hypothesis correction, Q value is the False Discovery Rate (FDR) analogue of the P value (Benjamini and Hochberg 1995), defined as the minimum FDR at which the test may be called significant. We used the 'Benjamini and Hochberg' method of 'p.adjust' function in R to convert P values into Q values.
This is an experimental feature. The full results of the analysis summarized in this report can be downloaded from the TCGA Data Coordination Center.