(All_Samples cohort)
This pipeline uses various statistical tests to identify mRNAs whose expression levels correlated to selected clinical features.
Testing the association between 18094 genes and 8 clinical features across 198 samples, statistically thresholded by Q value < 0.05, 8 clinical features related to at least one genes.
-
4 genes correlated to 'Time to Death'.
-
PRKAR2B|5577 , ZNF25|219749 , ARHGAP12|94134 , SATB1|6304
-
5 genes correlated to 'AGE'.
-
ACOX2|8309 , PHKA1|5255 , MCHR1|2847 , CD200|4345 , PTGIS|5740
-
282 genes correlated to 'PRIMARY.SITE.OF.DISEASE'.
-
KRT17|3872 , C7|730 , TP53AIP1|63970 , S100A7|6278 , S100A2|6273 , ...
-
20 genes correlated to 'GENDER'.
-
ZFY|7544 , CYORF15B|84663 , PRKY|5616 , RPS4Y1|6192 , DDX3Y|8653 , ...
-
89 genes correlated to 'RADIATIONS.RADIATION.REGIMENINDICATION'.
-
KDM4C|23081 , ZFP90|146198 , AQP5|362 , LPP|4026 , EIF4G2|1982 , ...
-
4 genes correlated to 'DISTANT.METASTASIS'.
-
CLDN6|9074 , CXADRP3|440224 , PRPS1|5631 , LRRC28|123355
-
5 genes correlated to 'LYMPH.NODE.METASTASIS'.
-
IHH|3549 , NPAS4|266743 , MUC6|4588 , NXNL2|158046 , AMY1A|276
-
2 genes correlated to 'NEOPLASM.DISEASESTAGE'.
-
TNFSF11|8600 , SLC34A2|10568
Complete statistical result table is provided in Supplement Table 1
Table 1. Get Full Table This table shows the clinical features, statistical methods used, and the number of genes that are significantly associated with each clinical feature at Q value < 0.05.
| Clinical feature | Statistical test | Significant genes | Associated with | Associated with | ||
|---|---|---|---|---|---|---|
| Time to Death | Cox regression test | N=4 | shorter survival | N=0 | longer survival | N=4 |
| AGE | Spearman correlation test | N=5 | older | N=0 | younger | N=5 |
| PRIMARY SITE OF DISEASE | ANOVA test | N=282 | ||||
| GENDER | t test | N=20 | male | N=14 | female | N=6 |
| RADIATIONS RADIATION REGIMENINDICATION | t test | N=89 | yes | N=51 | no | N=38 |
| DISTANT METASTASIS | ANOVA test | N=4 | ||||
| LYMPH NODE METASTASIS | ANOVA test | N=5 | ||||
| NEOPLASM DISEASESTAGE | ANOVA test | N=2 |
Table S1. Basic characteristics of clinical feature: 'Time to Death'
| Time to Death | Duration (Months) | 0-357.4 (median=42.4) |
| censored | N = 97 | |
| death | N = 91 | |
| Significant markers | N = 4 | |
| associated with shorter survival | 0 | |
| associated with longer survival | 4 |
Table S2. Get Full Table List of 4 genes significantly associated with 'Time to Death' by Cox regression test
| HazardRatio | Wald_P | Q | C_index | |
|---|---|---|---|---|
| PRKAR2B|5577 | 0.72 | 5.338e-07 | 0.0097 | 0.347 |
| ZNF25|219749 | 0.65 | 1.216e-06 | 0.022 | 0.352 |
| ARHGAP12|94134 | 0.64 | 1.589e-06 | 0.029 | 0.361 |
| SATB1|6304 | 0.75 | 1.599e-06 | 0.029 | 0.355 |
Figure S1. Get High-res Image As an example, this figure shows the association of PRKAR2B|5577 to 'Time to Death'. four curves present the cumulative survival rates of 4 quartile subsets of patients. P value = 5.34e-07 with univariate Cox regression analysis using continuous log-2 expression values.
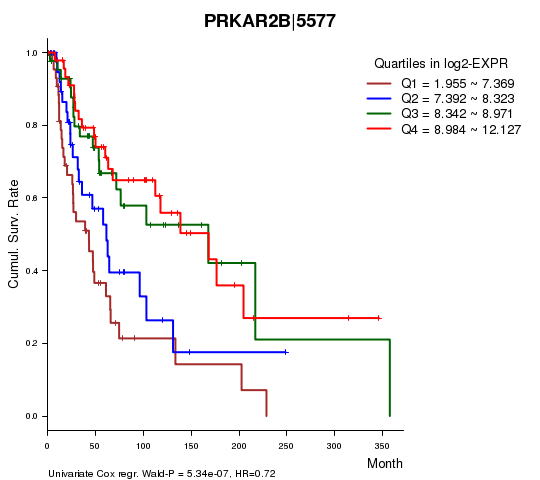
Table S3. Basic characteristics of clinical feature: 'AGE'
| AGE | Mean (SD) | 56.64 (16) |
| Significant markers | N = 5 | |
| pos. correlated | 0 | |
| neg. correlated | 5 |
Table S4. Get Full Table List of 5 genes significantly correlated to 'AGE' by Spearman correlation test
| SpearmanCorr | corrP | Q | |
|---|---|---|---|
| ACOX2|8309 | -0.4008 | 6.967e-09 | 0.000126 |
| PHKA1|5255 | -0.3887 | 2.143e-08 | 0.000388 |
| MCHR1|2847 | -0.3532 | 4.7e-07 | 0.0085 |
| CD200|4345 | -0.341 | 1.141e-06 | 0.0206 |
| PTGIS|5740 | -0.3334 | 2.038e-06 | 0.0369 |
Figure S2. Get High-res Image As an example, this figure shows the association of ACOX2|8309 to 'AGE'. P value = 6.97e-09 with Spearman correlation analysis. The straight line presents the best linear regression.
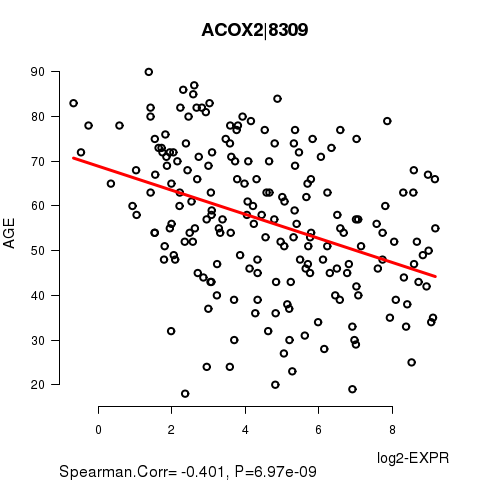
Table S5. Basic characteristics of clinical feature: 'PRIMARY.SITE.OF.DISEASE'
| PRIMARY.SITE.OF.DISEASE | Labels | N |
| DISTANT METASTASIS | 27 | |
| PRIMARY TUMOR | 24 | |
| REGIONAL CUTANEOUS OR SUBCUTANEOUS TISSUE (INCLUDES SATELLITE AND IN-TRANSIT METASTASIS) | 35 | |
| REGIONAL LYMPH NODE | 112 | |
| Significant markers | N = 282 |
Table S6. Get Full Table List of top 10 genes differentially expressed by 'PRIMARY.SITE.OF.DISEASE'
| ANOVA_P | Q | |
|---|---|---|
| KRT17|3872 | 1.384e-16 | 2.5e-12 |
| C7|730 | 3.95e-15 | 7.15e-11 |
| TP53AIP1|63970 | 1.818e-13 | 3.29e-09 |
| S100A7|6278 | 2.279e-13 | 4.12e-09 |
| S100A2|6273 | 2.662e-13 | 4.82e-09 |
| PLA2G4F|255189 | 3.899e-13 | 7.05e-09 |
| SPRR1B|6699 | 4.954e-13 | 8.96e-09 |
| SERPINB4|6318 | 8.095e-13 | 1.46e-08 |
| FLG2|388698 | 8.443e-13 | 1.53e-08 |
| KRT10|3858 | 8.65e-13 | 1.56e-08 |
Figure S3. Get High-res Image As an example, this figure shows the association of KRT17|3872 to 'PRIMARY.SITE.OF.DISEASE'. P value = 1.38e-16 with ANOVA analysis.
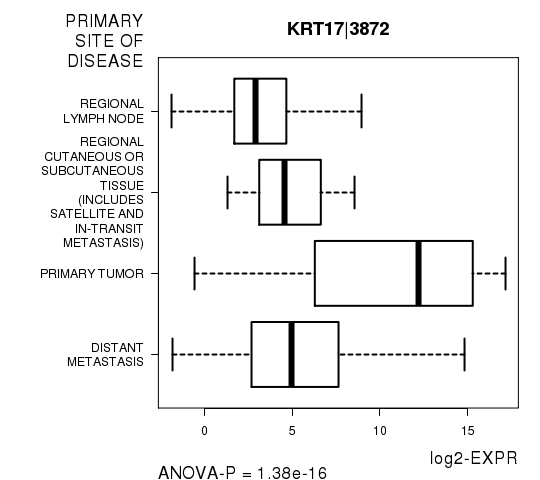
Table S7. Basic characteristics of clinical feature: 'GENDER'
| GENDER | Labels | N |
| FEMALE | 75 | |
| MALE | 123 | |
| Significant markers | N = 20 | |
| Higher in MALE | 14 | |
| Higher in FEMALE | 6 |
Table S8. Get Full Table List of top 10 genes differentially expressed by 'GENDER'
| T(pos if higher in 'MALE') | ttestP | Q | AUC | |
|---|---|---|---|---|
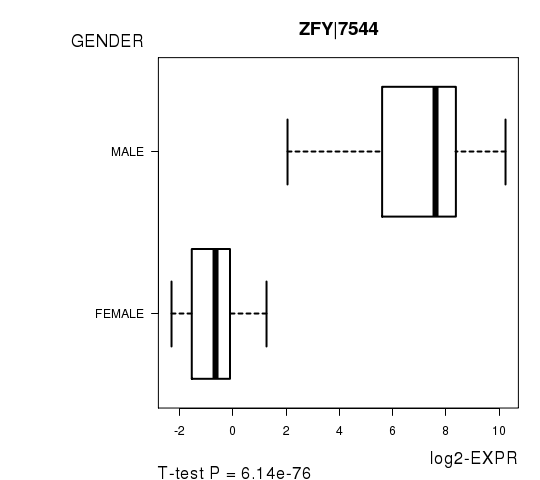
| ZFY|7544 | 32.67 | 6.143e-76 | 1.11e-71 | 0.9928 |
| CYORF15B|84663 | 34.4 | 3.32e-65 | 6e-61 | 1 |
| PRKY|5616 | 29 | 1.119e-63 | 2.02e-59 | 0.9951 |
| RPS4Y1|6192 | 31.59 | 7.482e-50 | 1.35e-45 | 1 |
| DDX3Y|8653 | 33.69 | 1.469e-49 | 2.66e-45 | 0.9982 |
| XIST|7503 | -20.9 | 1.219e-48 | 2.21e-44 | 0.9703 |
| KDM5D|8284 | 31.86 | 4.122e-44 | 7.45e-40 | 0.9938 |
| EIF1AY|9086 | 30.83 | 1.016e-36 | 1.84e-32 | 0.9959 |
| TSIX|9383 | -15.94 | 8.088e-34 | 1.46e-29 | 0.9642 |
| USP9Y|8287 | 28.09 | 7.241e-33 | 1.31e-28 | 0.9993 |
Figure S4. Get High-res Image As an example, this figure shows the association of ZFY|7544 to 'GENDER'. P value = 6.14e-76 with T-test analysis.
89 genes related to 'RADIATIONS.RADIATION.REGIMENINDICATION'.
Table S9. Basic characteristics of clinical feature: 'RADIATIONS.RADIATION.REGIMENINDICATION'
| RADIATIONS.RADIATION.REGIMENINDICATION | Labels | N |
| NO | 3 | |
| YES | 195 | |
| Significant markers | N = 89 | |
| Higher in YES | 51 | |
| Higher in NO | 38 |
Table S10. Get Full Table List of top 10 genes differentially expressed by 'RADIATIONS.RADIATION.REGIMENINDICATION'
| T(pos if higher in 'YES') | ttestP | Q | AUC | |
|---|---|---|---|---|
| KDM4C|23081 | -26.05 | 1.821e-46 | 2.95e-42 | 0.9846 |
| ZFP90|146198 | -13.86 | 1.316e-30 | 2.13e-26 | 0.8906 |
| AQP5|362 | 15.48 | 5.885e-30 | 9.54e-26 | 0.9337 |
| LPP|4026 | -12.98 | 1.001e-26 | 1.62e-22 | 0.8393 |
| EIF4G2|1982 | -11.71 | 1.077e-22 | 1.75e-18 | 0.8598 |
| TBC1D5|9779 | -14.26 | 2.329e-22 | 3.77e-18 | 0.8957 |
| HIST3H2A|92815 | 14.48 | 3.902e-21 | 6.32e-17 | 0.875 |
| PSCA|8000 | 11.59 | 5.265e-21 | 8.53e-17 | 0.8048 |
| GPI|2821 | 11.05 | 1.002e-20 | 1.62e-16 | 0.8137 |
| DMRTA2|63950 | 11.41 | 2.895e-19 | 4.69e-15 | 0.8847 |
Figure S5. Get High-res Image As an example, this figure shows the association of KDM4C|23081 to 'RADIATIONS.RADIATION.REGIMENINDICATION'. P value = 1.82e-46 with T-test analysis.
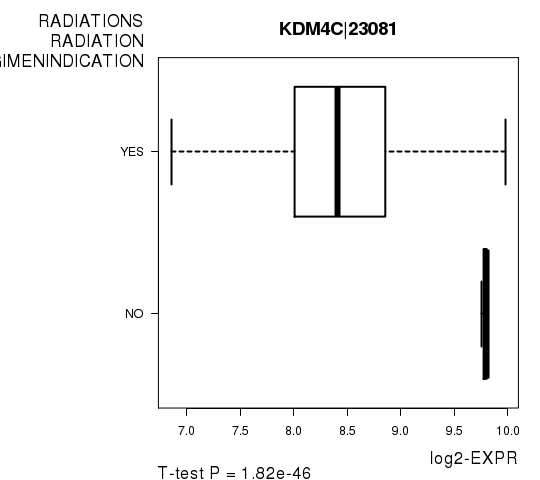
Table S11. Basic characteristics of clinical feature: 'DISTANT.METASTASIS'
| DISTANT.METASTASIS | Labels | N |
| M0 | 172 | |
| M1 | 2 | |
| M1A | 2 | |
| M1B | 2 | |
| M1C | 3 | |
| Significant markers | N = 4 |
Table S12. Get Full Table List of 4 genes differentially expressed by 'DISTANT.METASTASIS'
| ANOVA_P | Q | |
|---|---|---|
| CLDN6|9074 | 2.626e-09 | 4.75e-05 |
| CXADRP3|440224 | 1.071e-07 | 0.00194 |
| PRPS1|5631 | 6.116e-07 | 0.0111 |
| LRRC28|123355 | 1.57e-06 | 0.0284 |
Figure S6. Get High-res Image As an example, this figure shows the association of CLDN6|9074 to 'DISTANT.METASTASIS'. P value = 2.63e-09 with ANOVA analysis.
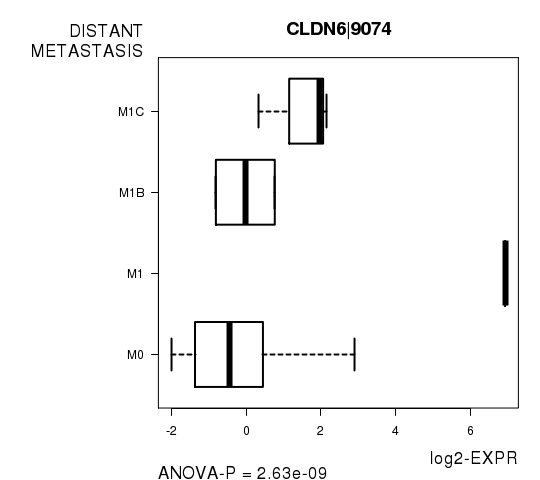
Table S13. Basic characteristics of clinical feature: 'LYMPH.NODE.METASTASIS'
| LYMPH.NODE.METASTASIS | Labels | N |
| N0 | 109 | |
| N1 | 2 | |
| N1A | 7 | |
| N1B | 17 | |
| N2 | 1 | |
| N2A | 5 | |
| N2B | 13 | |
| N2C | 6 | |
| N3 | 18 | |
| NX | 5 | |
| Significant markers | N = 5 |
Table S14. Get Full Table List of 5 genes differentially expressed by 'LYMPH.NODE.METASTASIS'
| ANOVA_P | Q | |
|---|---|---|
| IHH|3549 | 8.61e-13 | 1.56e-08 |
| NPAS4|266743 | 3.038e-08 | 0.00055 |
| MUC6|4588 | 1.803e-07 | 0.00326 |
| NXNL2|158046 | 7.127e-07 | 0.0129 |
| AMY1A|276 | 1.49e-06 | 0.027 |
Figure S7. Get High-res Image As an example, this figure shows the association of IHH|3549 to 'LYMPH.NODE.METASTASIS'. P value = 8.61e-13 with ANOVA analysis.
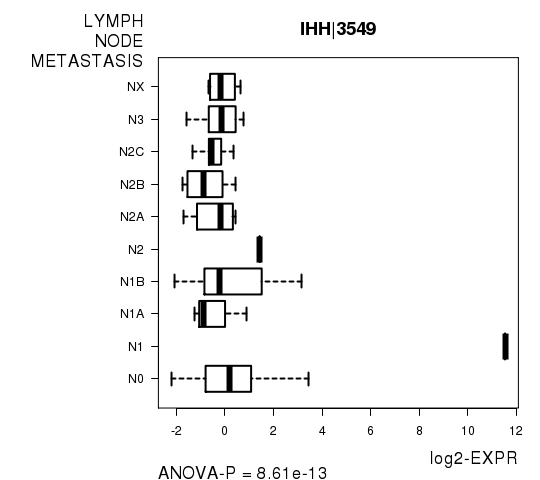
Table S15. Basic characteristics of clinical feature: 'NEOPLASM.DISEASESTAGE'
| NEOPLASM.DISEASESTAGE | Labels | N |
| I OR II NOS | 4 | |
| STAGE I | 17 | |
| STAGE IA | 10 | |
| STAGE IB | 15 | |
| STAGE II | 20 | |
| STAGE IIA | 9 | |
| STAGE IIB | 10 | |
| STAGE IIC | 22 | |
| STAGE III | 9 | |
| STAGE IIIA | 6 | |
| STAGE IIIB | 20 | |
| STAGE IIIC | 26 | |
| STAGE IV | 7 | |
| Significant markers | N = 2 |
Table S16. Get Full Table List of 2 genes differentially expressed by 'NEOPLASM.DISEASESTAGE'
| ANOVA_P | Q | |
|---|---|---|
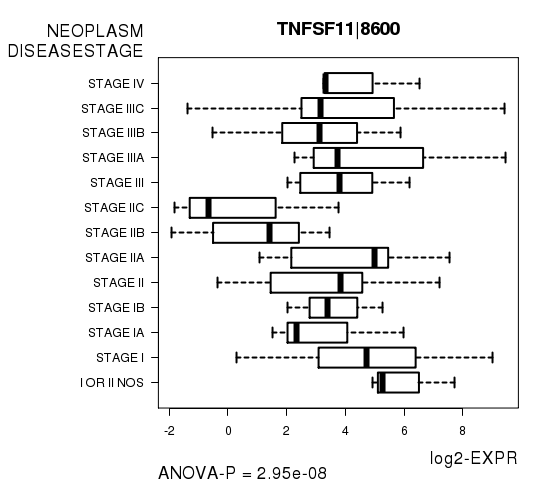
| TNFSF11|8600 | 2.946e-08 | 0.000533 |
| SLC34A2|10568 | 6.71e-07 | 0.0121 |
Figure S8. Get High-res Image As an example, this figure shows the association of TNFSF11|8600 to 'NEOPLASM.DISEASESTAGE'. P value = 2.95e-08 with ANOVA analysis.
-
Expresson data file = SKCM-All_Samples.uncv2.mRNAseq_RSEM_normalized_log2.txt
-
Clinical data file = SKCM-All_Samples.clin.merged.picked.txt
-
Number of patients = 198
-
Number of genes = 18094
-
Number of clinical features = 8
For survival clinical features, Wald's test in univariate Cox regression analysis with proportional hazards model (Andersen and Gill 1982) was used to estimate the P values using the 'coxph' function in R. Kaplan-Meier survival curves were plot using the four quartile subgroups of patients based on expression levels
For continuous numerical clinical features, Spearman's rank correlation coefficients (Spearman 1904) and two-tailed P values were estimated using 'cor.test' function in R
For multi-class clinical features (ordinal or nominal), one-way analysis of variance (Howell 2002) was applied to compare the log2-expression levels between different clinical classes using 'anova' function in R
For two-class clinical features, two-tailed Student's t test with unequal variance (Lehmann and Romano 2005) was applied to compare the log2-expression levels between the two clinical classes using 't.test' function in R
For multiple hypothesis correction, Q value is the False Discovery Rate (FDR) analogue of the P value (Benjamini and Hochberg 1995), defined as the minimum FDR at which the test may be called significant. We used the 'Benjamini and Hochberg' method of 'p.adjust' function in R to convert P values into Q values.
This is an experimental feature. The full results of the analysis summarized in this report can be downloaded from the TCGA Data Coordination Center.