(All_Samples cohort)
This pipeline uses various statistical tests to identify genes whose promoter methylation levels correlated to selected clinical features.
Testing the association between 17134 genes and 8 clinical features across 195 samples, statistically thresholded by Q value < 0.05, 8 clinical features related to at least one genes.
-
1 gene correlated to 'Time to Death'.
-
NR4A3
-
21 genes correlated to 'AGE'.
-
PTX3 , BBX , XKR6 , VGF , CAMK1 , ...
-
45 genes correlated to 'PRIMARY.SITE.OF.DISEASE'.
-
S100A2 , AGAP11 , DCLRE1C , KLF2 , LAX1 , ...
-
1 gene correlated to 'GENDER'.
-
DDX43
-
407 genes correlated to 'RADIATIONS.RADIATION.REGIMENINDICATION'.
-
HRNR , ABT1 , IGF1R , ZNF280A , TMEM49 , ...
-
220 genes correlated to 'DISTANT.METASTASIS'.
-
LDHAL6B , COL5A1 , CCNG1 , FAM186A , SELT , ...
-
33 genes correlated to 'LYMPH.NODE.METASTASIS'.
-
CCDC25 , NGLY1 , LIMK2 , C17ORF63 , PCLO , ...
-
10 genes correlated to 'NEOPLASM.DISEASESTAGE'.
-
POLE4 , C4ORF3 , GRAMD1B , RAD21L1 , ZNF587 , ...
Complete statistical result table is provided in Supplement Table 1
Table 1. Get Full Table This table shows the clinical features, statistical methods used, and the number of genes that are significantly associated with each clinical feature at Q value < 0.05.
| Clinical feature | Statistical test | Significant genes | Associated with | Associated with | ||
|---|---|---|---|---|---|---|
| Time to Death | Cox regression test | N=1 | shorter survival | N=0 | longer survival | N=1 |
| AGE | Spearman correlation test | N=21 | older | N=21 | younger | N=0 |
| PRIMARY SITE OF DISEASE | ANOVA test | N=45 | ||||
| GENDER | t test | N=1 | male | N=0 | female | N=1 |
| RADIATIONS RADIATION REGIMENINDICATION | t test | N=407 | yes | N=93 | no | N=314 |
| DISTANT METASTASIS | ANOVA test | N=220 | ||||
| LYMPH NODE METASTASIS | ANOVA test | N=33 | ||||
| NEOPLASM DISEASESTAGE | ANOVA test | N=10 |
Table S1. Basic characteristics of clinical feature: 'Time to Death'
| Time to Death | Duration (Months) | 0-357.4 (median=41.6) |
| censored | N = 97 | |
| death | N = 88 | |
| Significant markers | N = 1 | |
| associated with shorter survival | 0 | |
| associated with longer survival | 1 |
Table S2. Get Full Table List of one gene significantly associated with 'Time to Death' by Cox regression test
| HazardRatio | Wald_P | Q | C_index | |
|---|---|---|---|---|
| NR4A3 | 0.07 | 3.047e-07 | 0.0052 | 0.325 |
Figure S1. Get High-res Image As an example, this figure shows the association of NR4A3 to 'Time to Death'. four curves present the cumulative survival rates of 4 quartile subsets of patients. P value = 3.05e-07 with univariate Cox regression analysis using continuous log-2 expression values.
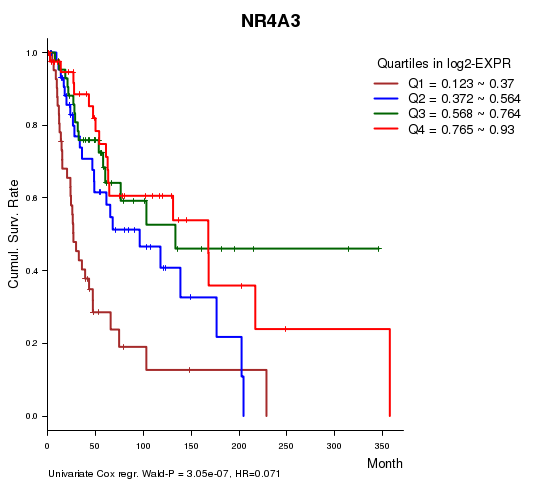
Table S3. Basic characteristics of clinical feature: 'AGE'
| AGE | Mean (SD) | 56.52 (16) |
| Significant markers | N = 21 | |
| pos. correlated | 21 | |
| neg. correlated | 0 |
Table S4. Get Full Table List of top 10 genes significantly correlated to 'AGE' by Spearman correlation test
| SpearmanCorr | corrP | Q | |
|---|---|---|---|
| PTX3 | 0.4047 | 6.377e-09 | 0.000109 |
| BBX | 0.3821 | 4.911e-08 | 0.000841 |
| XKR6 | 0.3779 | 7.087e-08 | 0.00121 |
| VGF | 0.3625 | 2.556e-07 | 0.00438 |
| CAMK1 | 0.349 | 7.489e-07 | 0.0128 |
| BARHL2 | 0.3483 | 7.916e-07 | 0.0136 |
| C11ORF66 | 0.3478 | 8.214e-07 | 0.0141 |
| TRPV4 | 0.3475 | 8.421e-07 | 0.0144 |
| ACTA2 | 0.3459 | 9.556e-07 | 0.0164 |
| FAS | 0.3459 | 9.556e-07 | 0.0164 |
Figure S2. Get High-res Image As an example, this figure shows the association of PTX3 to 'AGE'. P value = 6.38e-09 with Spearman correlation analysis. The straight line presents the best linear regression.
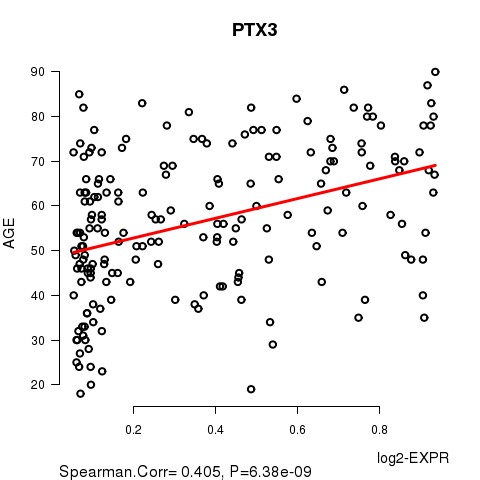
Table S5. Basic characteristics of clinical feature: 'PRIMARY.SITE.OF.DISEASE'
| PRIMARY.SITE.OF.DISEASE | Labels | N |
| DISTANT METASTASIS | 27 | |
| PRIMARY TUMOR | 24 | |
| REGIONAL CUTANEOUS OR SUBCUTANEOUS TISSUE (INCLUDES SATELLITE AND IN-TRANSIT METASTASIS) | 34 | |
| REGIONAL LYMPH NODE | 110 | |
| Significant markers | N = 45 |
Table S6. Get Full Table List of top 10 genes differentially expressed by 'PRIMARY.SITE.OF.DISEASE'
| ANOVA_P | Q | |
|---|---|---|
| S100A2 | 2.733e-08 | 0.000468 |
| AGAP11 | 5.374e-08 | 0.000921 |
| DCLRE1C | 7.03e-08 | 0.0012 |
| KLF2 | 8.427e-08 | 0.00144 |
| LAX1 | 8.505e-08 | 0.00146 |
| ERI3 | 8.892e-08 | 0.00152 |
| CD3D | 1.075e-07 | 0.00184 |
| SP140 | 1.117e-07 | 0.00191 |
| SLC39A13 | 1.645e-07 | 0.00282 |
| SLA2 | 1.69e-07 | 0.00289 |
Figure S3. Get High-res Image As an example, this figure shows the association of S100A2 to 'PRIMARY.SITE.OF.DISEASE'. P value = 2.73e-08 with ANOVA analysis.
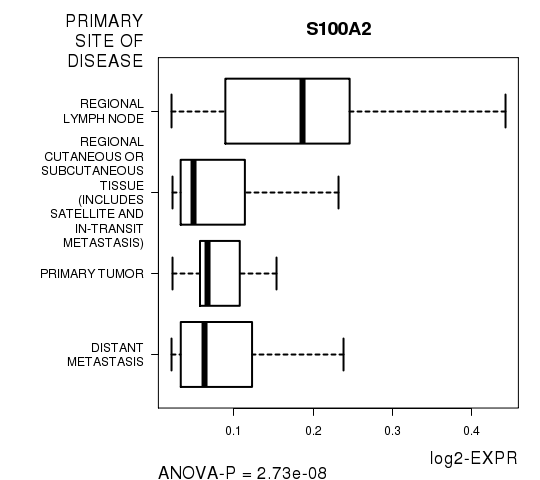
Table S7. Basic characteristics of clinical feature: 'GENDER'
| GENDER | Labels | N |
| FEMALE | 74 | |
| MALE | 121 | |
| Significant markers | N = 1 | |
| Higher in MALE | 0 | |
| Higher in FEMALE | 1 |
Table S8. Get Full Table List of one gene differentially expressed by 'GENDER'
| T(pos if higher in 'MALE') | ttestP | Q | AUC | |
|---|---|---|---|---|
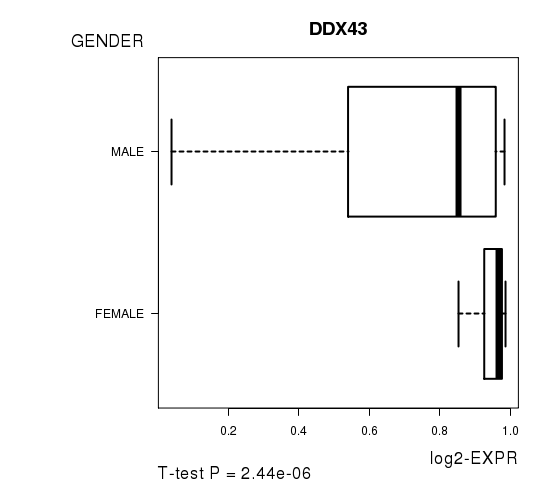
| DDX43 | -4.86 | 2.437e-06 | 0.0417 | 0.7091 |
Figure S4. Get High-res Image As an example, this figure shows the association of DDX43 to 'GENDER'. P value = 2.44e-06 with T-test analysis.
407 genes related to 'RADIATIONS.RADIATION.REGIMENINDICATION'.
Table S9. Basic characteristics of clinical feature: 'RADIATIONS.RADIATION.REGIMENINDICATION'
| RADIATIONS.RADIATION.REGIMENINDICATION | Labels | N |
| NO | 3 | |
| YES | 192 | |
| Significant markers | N = 407 | |
| Higher in YES | 93 | |
| Higher in NO | 314 |
Table S10. Get Full Table List of top 10 genes differentially expressed by 'RADIATIONS.RADIATION.REGIMENINDICATION'
| T(pos if higher in 'YES') | ttestP | Q | AUC | |
|---|---|---|---|---|
| HRNR | -24.55 | 5.151e-61 | 8.79e-57 | 0.9271 |
| ABT1 | -22.9 | 1.848e-54 | 3.15e-50 | 0.9566 |
| IGF1R | -21.34 | 6.178e-50 | 1.05e-45 | 0.9427 |
| ZNF280A | -17.25 | 8.431e-41 | 1.44e-36 | 0.9479 |
| TMEM49 | -15.6 | 1.558e-35 | 2.66e-31 | 0.8194 |
| TBC1D20 | -17.02 | 1.438e-33 | 2.45e-29 | 0.9653 |
| EPS8 | -15.32 | 1.604e-32 | 2.74e-28 | 0.9149 |
| SGK3 | -14.38 | 2.34e-32 | 3.99e-28 | 0.908 |
| FAM178B | -14.8 | 3.547e-32 | 6.05e-28 | 0.8264 |
| FAM83B | -14 | 3.318e-31 | 5.66e-27 | 0.7639 |
Figure S5. Get High-res Image As an example, this figure shows the association of HRNR to 'RADIATIONS.RADIATION.REGIMENINDICATION'. P value = 5.15e-61 with T-test analysis.
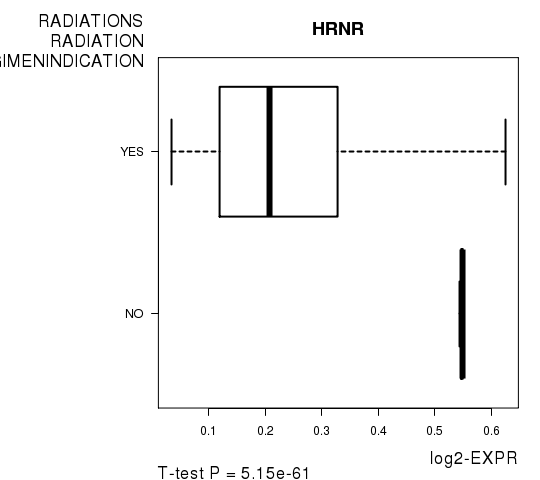
Table S11. Basic characteristics of clinical feature: 'DISTANT.METASTASIS'
| DISTANT.METASTASIS | Labels | N |
| M0 | 169 | |
| M1 | 2 | |
| M1A | 2 | |
| M1B | 2 | |
| M1C | 3 | |
| Significant markers | N = 220 |
Table S12. Get Full Table List of top 10 genes differentially expressed by 'DISTANT.METASTASIS'
| ANOVA_P | Q | |
|---|---|---|
| LDHAL6B | 1.786e-24 | 3.06e-20 |
| COL5A1 | 3.706e-24 | 6.35e-20 |
| CCNG1 | 4.551e-24 | 7.8e-20 |
| FAM186A | 3.268e-21 | 5.6e-17 |
| SELT | 7.134e-21 | 1.22e-16 |
| C10ORF88 | 8.201e-21 | 1.4e-16 |
| MDM1 | 1.25e-19 | 2.14e-15 |
| LOC728758 | 1.468e-19 | 2.51e-15 |
| FGFR2 | 3.975e-19 | 6.81e-15 |
| ZNF585A | 1.597e-18 | 2.73e-14 |
Figure S6. Get High-res Image As an example, this figure shows the association of LDHAL6B to 'DISTANT.METASTASIS'. P value = 1.79e-24 with ANOVA analysis.
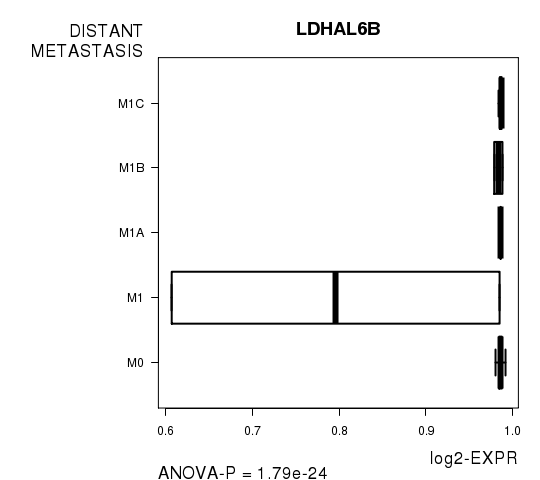
Table S13. Basic characteristics of clinical feature: 'LYMPH.NODE.METASTASIS'
| LYMPH.NODE.METASTASIS | Labels | N |
| N0 | 108 | |
| N1 | 2 | |
| N1A | 7 | |
| N1B | 16 | |
| N2 | 1 | |
| N2A | 5 | |
| N2B | 13 | |
| N2C | 6 | |
| N3 | 17 | |
| NX | 5 | |
| Significant markers | N = 33 |
Table S14. Get Full Table List of top 10 genes differentially expressed by 'LYMPH.NODE.METASTASIS'
| ANOVA_P | Q | |
|---|---|---|
| CCDC25 | 2.569e-189 | 4.4e-185 |
| NGLY1 | 4.062e-70 | 6.96e-66 |
| LIMK2 | 3.97e-38 | 6.8e-34 |
| C17ORF63 | 7.288e-26 | 1.25e-21 |
| PCLO | 2.619e-21 | 4.49e-17 |
| CSRP2BP | 3.44e-20 | 5.89e-16 |
| GPR44 | 2.493e-16 | 4.27e-12 |
| ASAP3 | 3.05e-16 | 5.22e-12 |
| MEGF6 | 4.401e-15 | 7.54e-11 |
| POP5 | 6.48e-14 | 1.11e-09 |
Figure S7. Get High-res Image As an example, this figure shows the association of CCDC25 to 'LYMPH.NODE.METASTASIS'. P value = 2.57e-189 with ANOVA analysis.
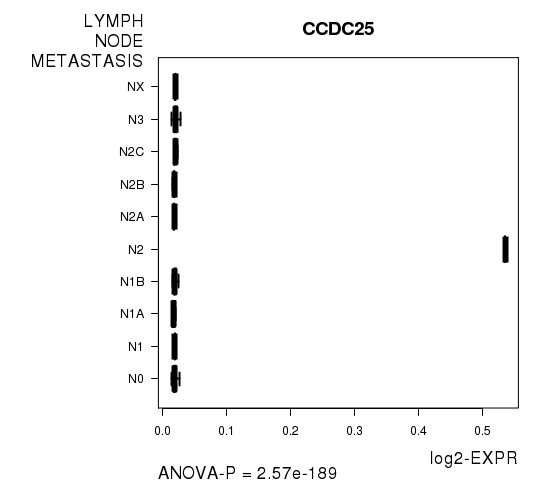
Table S15. Basic characteristics of clinical feature: 'NEOPLASM.DISEASESTAGE'
| NEOPLASM.DISEASESTAGE | Labels | N |
| I OR II NOS | 3 | |
| STAGE I | 17 | |
| STAGE IA | 10 | |
| STAGE IB | 15 | |
| STAGE II | 20 | |
| STAGE IIA | 9 | |
| STAGE IIB | 10 | |
| STAGE IIC | 22 | |
| STAGE III | 8 | |
| STAGE IIIA | 6 | |
| STAGE IIIB | 20 | |
| STAGE IIIC | 25 | |
| STAGE IV | 7 | |
| Significant markers | N = 10 |
Table S16. Get Full Table List of 10 genes differentially expressed by 'NEOPLASM.DISEASESTAGE'
| ANOVA_P | Q | |
|---|---|---|
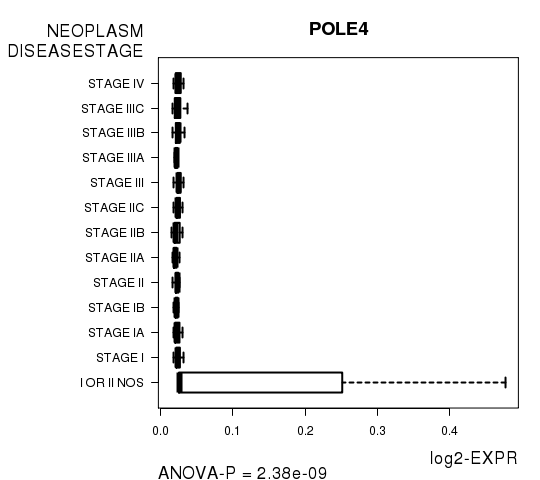
| POLE4 | 2.38e-09 | 4.08e-05 |
| C4ORF3 | 3.314e-09 | 5.68e-05 |
| GRAMD1B | 2.5e-08 | 0.000428 |
| RAD21L1 | 2.602e-08 | 0.000446 |
| ZNF587 | 2.763e-08 | 0.000473 |
| HEMK1 | 1.276e-07 | 0.00219 |
| GALNT7 | 3.837e-07 | 0.00657 |
| LOC100128191 | 1.185e-06 | 0.0203 |
| TMPO | 1.185e-06 | 0.0203 |
| LZTS1 | 1.829e-06 | 0.0313 |
Figure S8. Get High-res Image As an example, this figure shows the association of POLE4 to 'NEOPLASM.DISEASESTAGE'. P value = 2.38e-09 with ANOVA analysis.
-
Expresson data file = SKCM-All_Samples.meth.for_correlation.filtered_data.txt
-
Clinical data file = SKCM-All_Samples.clin.merged.picked.txt
-
Number of patients = 195
-
Number of genes = 17134
-
Number of clinical features = 8
For survival clinical features, Wald's test in univariate Cox regression analysis with proportional hazards model (Andersen and Gill 1982) was used to estimate the P values using the 'coxph' function in R. Kaplan-Meier survival curves were plot using the four quartile subgroups of patients based on expression levels
For continuous numerical clinical features, Spearman's rank correlation coefficients (Spearman 1904) and two-tailed P values were estimated using 'cor.test' function in R
For multi-class clinical features (ordinal or nominal), one-way analysis of variance (Howell 2002) was applied to compare the log2-expression levels between different clinical classes using 'anova' function in R
For two-class clinical features, two-tailed Student's t test with unequal variance (Lehmann and Romano 2005) was applied to compare the log2-expression levels between the two clinical classes using 't.test' function in R
For multiple hypothesis correction, Q value is the False Discovery Rate (FDR) analogue of the P value (Benjamini and Hochberg 1995), defined as the minimum FDR at which the test may be called significant. We used the 'Benjamini and Hochberg' method of 'p.adjust' function in R to convert P values into Q values.
This is an experimental feature. The full results of the analysis summarized in this report can be downloaded from the TCGA Data Coordination Center.