(BRAF_Hotspot_Mutants cohort)
This pipeline computes the correlation between significant copy number variation (cnv focal) genes and selected clinical features.
Testing the association between copy number variation 36 arm-level results and 8 clinical features across 67 patients, one significant finding detected with Q value < 0.25.
-
Amp Peak 5(6p25.3) cnv correlated to 'Time to Death'.
Table 1. Get Full Table Overview of the association between significant copy number variation of 36 arm-level results and 8 clinical features. Shown in the table are P values (Q values). Thresholded by Q value < 0.25, one significant finding detected.
|
Clinical Features |
Time to Death |
AGE |
PRIMARY SITE OF DISEASE |
GENDER |
DISTANT METASTASIS |
LYMPH NODE METASTASIS |
TUMOR STAGECODE |
NEOPLASM DISEASESTAGE |
||
| nCNV (%) | nWild-Type | logrank test | t-test | Fisher's exact test | Fisher's exact test | Chi-square test | Chi-square test | t-test | Chi-square test | |
| Amp Peak 5(6p25 3) | 32 (48%) | 35 |
0.000576 (0.145) |
0.241 (1.00) |
1 (1.00) |
1 (1.00) |
0.477 (1.00) |
0.447 (1.00) |
0.691 (1.00) |
|
| Amp Peak 1(1q43) | 34 (51%) | 33 |
0.21 (1.00) |
0.681 (1.00) |
0.498 (1.00) |
0.437 (1.00) |
0.289 (1.00) |
0.775 (1.00) |
0.975 (1.00) |
|
| Amp Peak 2(2q36 2) | 18 (27%) | 49 |
0.992 (1.00) |
0.363 (1.00) |
0.316 (1.00) |
0.141 (1.00) |
0.386 (1.00) |
0.371 (1.00) |
0.805 (1.00) |
|
| Amp Peak 3(3p13) | 17 (25%) | 50 |
0.145 (1.00) |
0.754 (1.00) |
0.384 (1.00) |
0.231 (1.00) |
0.798 (1.00) |
0.583 (1.00) |
0.562 (1.00) |
|
| Amp Peak 4(5p15 33) | 24 (36%) | 43 |
0.373 (1.00) |
0.178 (1.00) |
0.419 (1.00) |
1 (1.00) |
0.508 (1.00) |
0.684 (1.00) |
0.838 (1.00) |
|
| Amp Peak 6(7q21 11) | 49 (73%) | 18 |
0.887 (1.00) |
0.515 (1.00) |
0.697 (1.00) |
0.0847 (1.00) |
0.386 (1.00) |
0.3 (1.00) |
0.226 (1.00) |
|
| Amp Peak 7(7q34) | 55 (82%) | 12 |
0.739 (1.00) |
0.0314 (1.00) |
0.806 (1.00) |
0.187 (1.00) |
0.899 (1.00) |
0.493 (1.00) |
0.151 (1.00) |
|
| Amp Peak 8(8q21 13) | 36 (54%) | 31 |
0.341 (1.00) |
0.968 (1.00) |
0.189 (1.00) |
0.436 (1.00) |
0.272 (1.00) |
0.419 (1.00) |
0.46 (1.00) |
|
| Amp Peak 9(8q24 21) | 37 (55%) | 30 |
0.43 (1.00) |
0.63 (1.00) |
0.2 (1.00) |
0.607 (1.00) |
0.248 (1.00) |
0.476 (1.00) |
0.454 (1.00) |
|
| Amp Peak 10(12q15) | 10 (15%) | 57 |
0.99 (1.00) |
0.782 (1.00) |
0.773 (1.00) |
0.478 (1.00) |
0.899 (1.00) |
0.254 (1.00) |
0.574 (1.00) |
|
| Amp Peak 11(15q26 2) | 24 (36%) | 43 |
0.608 (1.00) |
0.89 (1.00) |
0.365 (1.00) |
0.175 (1.00) |
0.401 (1.00) |
0.442 (1.00) |
0.229 (1.00) |
|
| Amp Peak 12(17q24 3) | 24 (36%) | 43 |
0.406 (1.00) |
0.173 (1.00) |
1 (1.00) |
0.418 (1.00) |
0.388 (1.00) |
0.68 (1.00) |
0.377 (1.00) |
|
| Amp Peak 13(19p13 2) | 17 (25%) | 50 |
0.96 (1.00) |
0.381 (1.00) |
0.924 (1.00) |
0.0388 (1.00) |
0.173 (1.00) |
0.652 (1.00) |
0.349 (1.00) |
|
| Amp Peak 14(22q13 32) | 28 (42%) | 39 |
0.968 (1.00) |
0.317 (1.00) |
0.189 (1.00) |
0.117 (1.00) |
0.419 (1.00) |
0.167 (1.00) |
0.713 (1.00) |
|
| Del Peak 1(1p36 31) | 20 (30%) | 47 |
0.186 (1.00) |
0.342 (1.00) |
1 (1.00) |
1 (1.00) |
0.386 (1.00) |
0.253 (1.00) |
0.635 (1.00) |
|
| Del Peak 2(1p22 1) | 24 (36%) | 43 |
0.833 (1.00) |
0.204 (1.00) |
0.235 (1.00) |
1 (1.00) |
0.4 (1.00) |
0.61 (1.00) |
0.278 (1.00) |
|
| Del Peak 3(2q37 3) | 18 (27%) | 49 |
0.735 (1.00) |
0.764 (1.00) |
0.582 (1.00) |
0.566 (1.00) |
0.151 (1.00) |
0.955 (1.00) |
0.73 (1.00) |
|
| Del Peak 4(3p26 1) | 16 (24%) | 51 |
0.259 (1.00) |
0.233 (1.00) |
0.722 (1.00) |
0.129 (1.00) |
0.794 (1.00) |
0.201 (1.00) |
0.795 (1.00) |
|
| Del Peak 5(3q27 2) | 13 (19%) | 54 |
0.112 (1.00) |
0.899 (1.00) |
0.47 (1.00) |
0.00619 (1.00) |
0.754 (1.00) |
0.354 (1.00) |
0.481 (1.00) |
|
| Del Peak 6(4p16 3) | 15 (22%) | 52 |
0.301 (1.00) |
0.0267 (1.00) |
0.0491 (1.00) |
1 (1.00) |
0.281 (1.00) |
0.961 (1.00) |
0.546 (1.00) |
|
| Del Peak 7(4q34 3) | 18 (27%) | 49 |
0.0558 (1.00) |
0.379 (1.00) |
0.189 (1.00) |
0.771 (1.00) |
0.386 (1.00) |
0.824 (1.00) |
0.619 (1.00) |
|
| Del Peak 8(5q11 2) | 24 (36%) | 43 |
0.423 (1.00) |
0.188 (1.00) |
0.669 (1.00) |
0.594 (1.00) |
0.322 (1.00) |
0.737 (1.00) |
0.345 (1.00) |
|
| Del Peak 9(5q31 3) | 32 (48%) | 35 |
0.265 (1.00) |
0.801 (1.00) |
0.509 (1.00) |
1 (1.00) |
0.534 (1.00) |
0.848 (1.00) |
0.328 (1.00) |
|
| Del Peak 10(6q25 2) | 45 (67%) | 22 |
0.248 (1.00) |
0.196 (1.00) |
1 (1.00) |
1 (1.00) |
0.508 (1.00) |
0.38 (1.00) |
0.491 (1.00) |
|
| Del Peak 11(6q27) | 44 (66%) | 23 |
0.243 (1.00) |
0.21 (1.00) |
1 (1.00) |
1 (1.00) |
0.529 (1.00) |
0.44 (1.00) |
0.643 (1.00) |
|
| Del Peak 12(9p21 3) | 54 (81%) | 13 |
0.907 (1.00) |
0.461 (1.00) |
0.255 (1.00) |
0.521 (1.00) |
0.281 (1.00) |
0.583 (1.00) |
0.749 (1.00) |
|
| Del Peak 13(9q21 2) | 34 (51%) | 33 |
0.893 (1.00) |
0.929 (1.00) |
0.0935 (1.00) |
0.0684 (1.00) |
0.272 (1.00) |
0.198 (1.00) |
0.387 (1.00) |
|
| Del Peak 14(10q21 1) | 48 (72%) | 19 |
0.867 (1.00) |
0.564 (1.00) |
0.673 (1.00) |
0.0199 (1.00) |
0.173 (1.00) |
0.45 (1.00) |
0.746 (1.00) |
|
| Del Peak 15(10q23 31) | 51 (76%) | 16 |
0.878 (1.00) |
0.538 (1.00) |
0.918 (1.00) |
0.0129 (1.00) |
0.127 (1.00) |
0.371 (1.00) |
0.642 (1.00) |
|
| Del Peak 16(11q22 3) | 36 (54%) | 31 |
0.304 (1.00) |
0.437 (1.00) |
0.774 (1.00) |
0.122 (1.00) |
0.282 (1.00) |
0.0686 (1.00) |
0.369 (1.00) |
|
| Del Peak 17(12q24 32) | 11 (16%) | 56 |
0.725 (1.00) |
0.621 (1.00) |
0.704 (1.00) |
0.157 (1.00) |
0.12 (1.00) |
0.291 (1.00) |
0.447 (1.00) |
|
| Del Peak 18(14q31 1) | 23 (34%) | 44 |
0.28 (1.00) |
0.333 (1.00) |
1 (1.00) |
0.584 (1.00) |
0.275 (1.00) |
0.401 (1.00) |
0.313 (1.00) |
|
| Del Peak 19(15q21 1) | 13 (19%) | 54 |
0.161 (1.00) |
0.876 (1.00) |
0.622 (1.00) |
0.327 (1.00) |
0.0606 (1.00) |
0.691 (1.00) |
0.92 (1.00) |
|
| Del Peak 20(16q23 3) | 19 (28%) | 48 |
0.548 (1.00) |
0.383 (1.00) |
0.351 (1.00) |
0.0436 (1.00) |
0.374 (1.00) |
0.465 (1.00) |
0.146 (1.00) |
|
| Del Peak 21(17q12) | 19 (28%) | 48 |
0.181 (1.00) |
0.974 (1.00) |
0.874 (1.00) |
0.389 (1.00) |
0.173 (1.00) |
0.834 (1.00) |
0.27 (1.00) |
|
| Del Peak 22(19p13 3) | 24 (36%) | 43 |
0.6 (1.00) |
0.922 (1.00) |
0.892 (1.00) |
0.286 (1.00) |
0.0732 (1.00) |
0.728 (1.00) |
0.204 (1.00) |
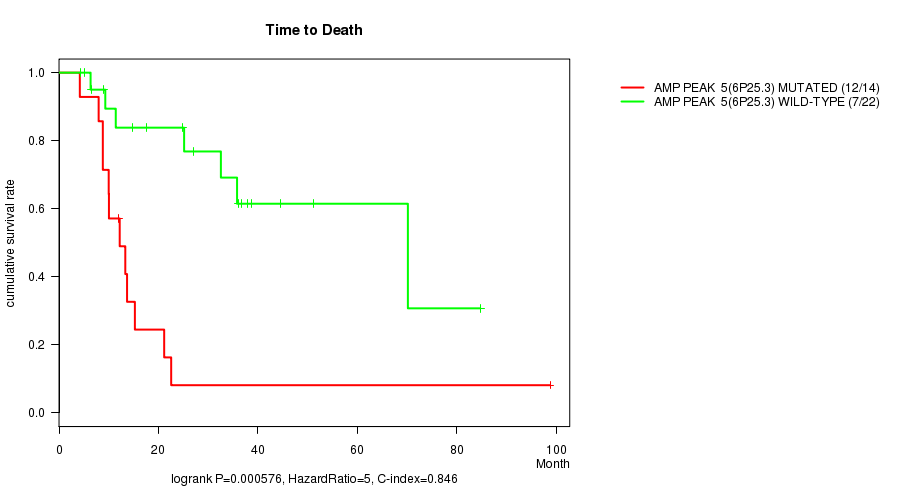
P value = 0.000576 (logrank test), Q value = 0.15
Table S1. Gene #5: 'Amp Peak 5(6p25.3) mutation analysis' versus Clinical Feature #1: 'Time to Death'
| nPatients | nDeath | Duration Range (Median), Month | |
|---|---|---|---|
| ALL | 36 | 19 | 4.2 - 98.8 (15.0) |
| AMP PEAK 5(6P25.3) MUTATED | 14 | 12 | 4.2 - 98.8 (12.1) |
| AMP PEAK 5(6P25.3) WILD-TYPE | 22 | 7 | 4.4 - 84.7 (26.1) |
Figure S1. Get High-res Image Gene #5: 'Amp Peak 5(6p25.3) mutation analysis' versus Clinical Feature #1: 'Time to Death'
-
Mutation data file = all_lesions.conf_99.cnv.cluster.txt
-
Clinical data file = SKCM-BRAF_Hotspot_Mutants.clin.merged.picked.txt
-
Number of patients = 67
-
Number of significantly arm-level cnvs = 36
-
Number of selected clinical features = 8
-
Exclude genes that fewer than K tumors have mutations, K = 3
For survival clinical features, the Kaplan-Meier survival curves of tumors with and without gene mutations were plotted and the statistical significance P values were estimated by logrank test (Bland and Altman 2004) using the 'survdiff' function in R
For continuous numerical clinical features, two-tailed Student's t test with unequal variance (Lehmann and Romano 2005) was applied to compare the clinical values between tumors with and without gene mutations using 't.test' function in R
For binary or multi-class clinical features (nominal or ordinal), two-tailed Fisher's exact tests (Fisher 1922) were used to estimate the P values using the 'fisher.test' function in R
For multi-class clinical features (nominal or ordinal), Chi-square tests (Greenwood and Nikulin 1996) were used to estimate the P values using the 'chisq.test' function in R
For multiple hypothesis correction, Q value is the False Discovery Rate (FDR) analogue of the P value (Benjamini and Hochberg 1995), defined as the minimum FDR at which the test may be called significant. We used the 'Benjamini and Hochberg' method of 'p.adjust' function in R to convert P values into Q values.
This is an experimental feature. The full results of the analysis summarized in this report can be downloaded from the TCGA Data Coordination Center.