(BRAF_Hotspot_Mutants cohort)
This pipeline uses various statistical tests to identify mRNAs whose expression levels correlated to selected clinical features.
Testing the association between 18144 genes and 7 clinical features across 67 samples, statistically thresholded by Q value < 0.05, 4 clinical features related to at least one genes.
-
2 genes correlated to 'PRIMARY.SITE.OF.DISEASE'.
-
KRTAP1-5|83895 , AGXT|189
-
13 genes correlated to 'GENDER'.
-
ZFY|7544 , USP9Y|8287 , CYORF15B|84663 , PRKY|5616 , RPS4Y1|6192 , ...
-
9 genes correlated to 'DISTANT.METASTASIS'.
-
PAX3|5077 , LOC728640|728640 , OCRL|4952 , ZNF546|339327 , USP9X|8239 , ...
-
1 gene correlated to 'LYMPH.NODE.METASTASIS'.
-
CABP7|164633
-
No genes correlated to 'Time to Death', 'AGE', and 'NEOPLASM.DISEASESTAGE'.
Complete statistical result table is provided in Supplement Table 1
Table 1. Get Full Table This table shows the clinical features, statistical methods used, and the number of genes that are significantly associated with each clinical feature at Q value < 0.05.
| Clinical feature | Statistical test | Significant genes | Associated with | Associated with | ||
|---|---|---|---|---|---|---|
| Time to Death | Cox regression test | N=0 | ||||
| AGE | Spearman correlation test | N=0 | ||||
| PRIMARY SITE OF DISEASE | ANOVA test | N=2 | ||||
| GENDER | t test | N=13 | male | N=11 | female | N=2 |
| DISTANT METASTASIS | ANOVA test | N=9 | ||||
| LYMPH NODE METASTASIS | ANOVA test | N=1 | ||||
| NEOPLASM DISEASESTAGE | ANOVA test | N=0 |
Table S1. Basic characteristics of clinical feature: 'Time to Death'
| Time to Death | Duration (Months) | 4.2-98.8 (median=15) |
| censored | N = 17 | |
| death | N = 19 | |
| Significant markers | N = 0 |
Table S2. Basic characteristics of clinical feature: 'AGE'
| AGE | Mean (SD) | 50.27 (16) |
| Significant markers | N = 0 |
Table S3. Basic characteristics of clinical feature: 'PRIMARY.SITE.OF.DISEASE'
| PRIMARY.SITE.OF.DISEASE | Labels | N |
| DISTANT METASTASIS | 6 | |
| PRIMARY TUMOR | 1 | |
| REGIONAL CUTANEOUS OR SUBCUTANEOUS TISSUE (INCLUDES SATELLITE AND IN-TRANSIT METASTASIS) | 12 | |
| REGIONAL LYMPH NODE | 48 | |
| Significant markers | N = 2 |
Table S4. Get Full Table List of 2 genes differentially expressed by 'PRIMARY.SITE.OF.DISEASE'
| ANOVA_P | Q | |
|---|---|---|
| KRTAP1-5|83895 | 5.656e-09 | 0.000103 |
| AGXT|189 | 2.412e-06 | 0.0438 |
Figure S1. Get High-res Image As an example, this figure shows the association of KRTAP1-5|83895 to 'PRIMARY.SITE.OF.DISEASE'. P value = 5.66e-09 with ANOVA analysis.
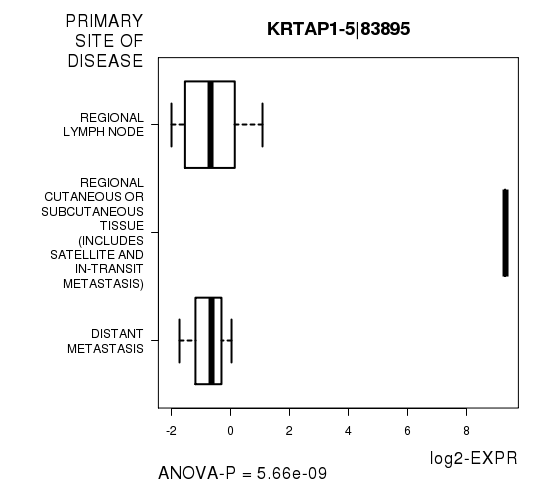
Table S5. Basic characteristics of clinical feature: 'GENDER'
| GENDER | Labels | N |
| FEMALE | 22 | |
| MALE | 45 | |
| Significant markers | N = 13 | |
| Higher in MALE | 11 | |
| Higher in FEMALE | 2 |
Table S6. Get Full Table List of top 10 genes differentially expressed by 'GENDER'
| T(pos if higher in 'MALE') | ttestP | Q | AUC | |
|---|---|---|---|---|
| ZFY|7544 | 20.79 | 4.412e-29 | 8e-25 | 1 |
| USP9Y|8287 | 23.34 | 6.963e-24 | 1.26e-19 | 1 |
| CYORF15B|84663 | 19.54 | 1.148e-23 | 2.08e-19 | 1 |
| PRKY|5616 | 17.57 | 1.162e-21 | 2.11e-17 | 1 |
| RPS4Y1|6192 | 20.34 | 5.237e-20 | 9.49e-16 | 1 |
| XIST|7503 | -12.37 | 1.466e-17 | 2.66e-13 | 0.9607 |
| KDM5D|8284 | 18.26 | 2.864e-11 | 5.19e-07 | 1 |
| DDX3Y|8653 | 18.12 | 1.647e-10 | 2.99e-06 | 1 |
| TTTY15|64595 | 18.13 | 2.752e-10 | 4.99e-06 | 1 |
| TSIX|9383 | -8.33 | 3.626e-10 | 6.57e-06 | 0.9562 |
Figure S2. Get High-res Image As an example, this figure shows the association of ZFY|7544 to 'GENDER'. P value = 4.41e-29 with T-test analysis.
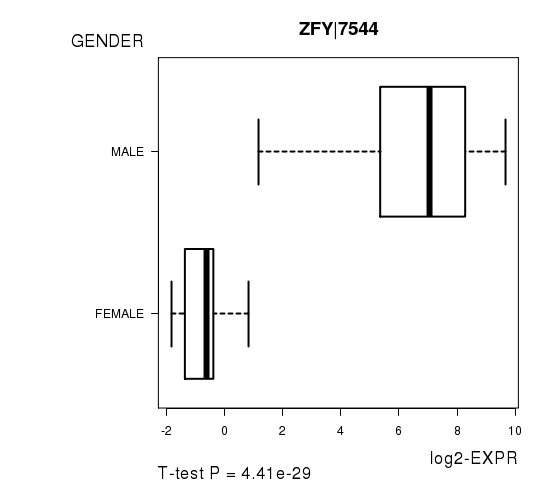
Table S7. Basic characteristics of clinical feature: 'DISTANT.METASTASIS'
| DISTANT.METASTASIS | Labels | N |
| M0 | 56 | |
| M1 | 1 | |
| M1A | 1 | |
| M1B | 1 | |
| M1C | 2 | |
| Significant markers | N = 9 |
Table S8. Get Full Table List of 9 genes differentially expressed by 'DISTANT.METASTASIS'
| ANOVA_P | Q | |
|---|---|---|
| PAX3|5077 | 2.127e-10 | 3.85e-06 |
| LOC728640|728640 | 1.159e-08 | 0.00021 |
| OCRL|4952 | 5.946e-08 | 0.00107 |
| ZNF546|339327 | 1.109e-07 | 0.002 |
| USP9X|8239 | 4.177e-07 | 0.00755 |
| ZNHIT2|741 | 5.187e-07 | 0.00937 |
| ZNF658|26149 | 5.291e-07 | 0.00956 |
| NUDT12|83594 | 9.66e-07 | 0.0175 |
| MAP3K13|9175 | 1.473e-06 | 0.0266 |
Figure S3. Get High-res Image As an example, this figure shows the association of PAX3|5077 to 'DISTANT.METASTASIS'. P value = 2.13e-10 with ANOVA analysis.
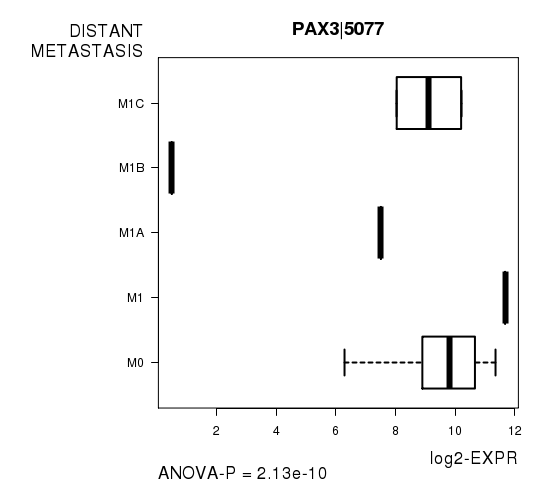
Table S9. Basic characteristics of clinical feature: 'LYMPH.NODE.METASTASIS'
| LYMPH.NODE.METASTASIS | Labels | N |
| N0 | 33 | |
| N1 | 1 | |
| N1A | 2 | |
| N1B | 7 | |
| N2A | 1 | |
| N2B | 5 | |
| N2C | 3 | |
| N3 | 7 | |
| NX | 2 | |
| Significant markers | N = 1 |
Table S10. Get Full Table List of one gene differentially expressed by 'LYMPH.NODE.METASTASIS'
| ANOVA_P | Q | |
|---|---|---|
| CABP7|164633 | 1.634e-08 | 0.000296 |
Figure S4. Get High-res Image As an example, this figure shows the association of CABP7|164633 to 'LYMPH.NODE.METASTASIS'. P value = 1.63e-08 with ANOVA analysis.
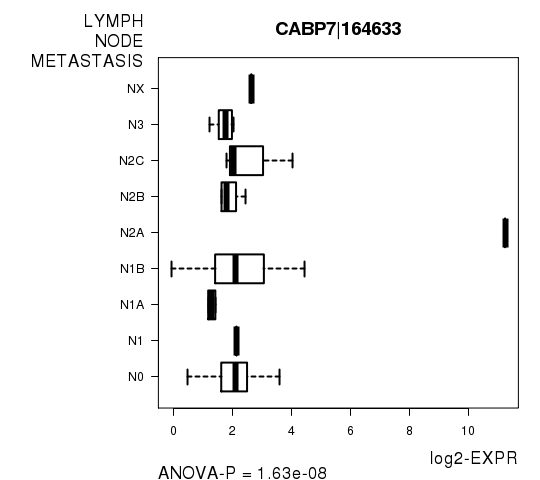
Table S11. Basic characteristics of clinical feature: 'NEOPLASM.DISEASESTAGE'
| NEOPLASM.DISEASESTAGE | Labels | N |
| I OR II NOS | 2 | |
| STAGE I | 10 | |
| STAGE IA | 2 | |
| STAGE IB | 5 | |
| STAGE II | 8 | |
| STAGE IIA | 3 | |
| STAGE IIC | 2 | |
| STAGE III | 5 | |
| STAGE IIIA | 2 | |
| STAGE IIIB | 7 | |
| STAGE IIIC | 9 | |
| STAGE IV | 3 | |
| Significant markers | N = 0 |
-
Expresson data file = SKCM-BRAF_Hotspot_Mutants.uncv2.mRNAseq_RSEM_normalized_log2.txt
-
Clinical data file = SKCM-BRAF_Hotspot_Mutants.clin.merged.picked.txt
-
Number of patients = 67
-
Number of genes = 18144
-
Number of clinical features = 7
For survival clinical features, Wald's test in univariate Cox regression analysis with proportional hazards model (Andersen and Gill 1982) was used to estimate the P values using the 'coxph' function in R. Kaplan-Meier survival curves were plot using the four quartile subgroups of patients based on expression levels
For continuous numerical clinical features, Spearman's rank correlation coefficients (Spearman 1904) and two-tailed P values were estimated using 'cor.test' function in R
For multi-class clinical features (ordinal or nominal), one-way analysis of variance (Howell 2002) was applied to compare the log2-expression levels between different clinical classes using 'anova' function in R
For two-class clinical features, two-tailed Student's t test with unequal variance (Lehmann and Romano 2005) was applied to compare the log2-expression levels between the two clinical classes using 't.test' function in R
For multiple hypothesis correction, Q value is the False Discovery Rate (FDR) analogue of the P value (Benjamini and Hochberg 1995), defined as the minimum FDR at which the test may be called significant. We used the 'Benjamini and Hochberg' method of 'p.adjust' function in R to convert P values into Q values.
This is an experimental feature. The full results of the analysis summarized in this report can be downloaded from the TCGA Data Coordination Center.