(BRAF_Hotspot_Mutants cohort)
This pipeline uses various statistical tests to identify genes whose promoter methylation levels correlated to selected clinical features.
Testing the association between 17172 genes and 7 clinical features across 64 samples, statistically thresholded by Q value < 0.05, 4 clinical features related to at least one genes.
-
105 genes correlated to 'PRIMARY.SITE.OF.DISEASE'.
-
PSPN , AMY2B , RTN4RL2 , IRAK4 , PUS7L , ...
-
531 genes correlated to 'DISTANT.METASTASIS'.
-
MUL1 , SFRP4 , CCNG1 , POLR3K , MAN2A1 , ...
-
42 genes correlated to 'LYMPH.NODE.METASTASIS'.
-
TGM4 , CRIPAK , ITGB6 , MEPE , NHEDC1 , ...
-
17 genes correlated to 'NEOPLASM.DISEASESTAGE'.
-
C4ORF3 , SRPK2 , FAM107B , HEMK1 , C2CD4C , ...
-
No genes correlated to 'Time to Death', 'AGE', and 'GENDER'.
Complete statistical result table is provided in Supplement Table 1
Table 1. Get Full Table This table shows the clinical features, statistical methods used, and the number of genes that are significantly associated with each clinical feature at Q value < 0.05.
| Clinical feature | Statistical test | Significant genes | Associated with | Associated with | ||
|---|---|---|---|---|---|---|
| Time to Death | Cox regression test | N=0 | ||||
| AGE | Spearman correlation test | N=0 | ||||
| PRIMARY SITE OF DISEASE | ANOVA test | N=105 | ||||
| GENDER | t test | N=0 | ||||
| DISTANT METASTASIS | ANOVA test | N=531 | ||||
| LYMPH NODE METASTASIS | ANOVA test | N=42 | ||||
| NEOPLASM DISEASESTAGE | ANOVA test | N=17 |
Table S1. Basic characteristics of clinical feature: 'Time to Death'
| Time to Death | Duration (Months) | 4.2-84.7 (median=13.7) |
| censored | N = 16 | |
| death | N = 17 | |
| Significant markers | N = 0 |
Table S2. Basic characteristics of clinical feature: 'AGE'
| AGE | Mean (SD) | 50.17 (16) |
| Significant markers | N = 0 |
Table S3. Basic characteristics of clinical feature: 'PRIMARY.SITE.OF.DISEASE'
| PRIMARY.SITE.OF.DISEASE | Labels | N |
| DISTANT METASTASIS | 6 | |
| PRIMARY TUMOR | 1 | |
| REGIONAL CUTANEOUS OR SUBCUTANEOUS TISSUE (INCLUDES SATELLITE AND IN-TRANSIT METASTASIS) | 11 | |
| REGIONAL LYMPH NODE | 46 | |
| Significant markers | N = 105 |
Table S4. Get Full Table List of top 10 genes differentially expressed by 'PRIMARY.SITE.OF.DISEASE'
| ANOVA_P | Q | |
|---|---|---|
| PSPN | 5.699e-71 | 9.79e-67 |
| AMY2B | 1.357e-39 | 2.33e-35 |
| RTN4RL2 | 6.09e-34 | 1.05e-29 |
| IRAK4 | 8.495e-30 | 1.46e-25 |
| PUS7L | 8.495e-30 | 1.46e-25 |
| SCAMP4 | 5.363e-28 | 9.21e-24 |
| MIER2 | 2.768e-22 | 4.75e-18 |
| KLHDC4 | 6.838e-21 | 1.17e-16 |
| RPTOR | 1.044e-19 | 1.79e-15 |
| ACRV1 | 1.798e-19 | 3.09e-15 |
Figure S1. Get High-res Image As an example, this figure shows the association of PSPN to 'PRIMARY.SITE.OF.DISEASE'. P value = 5.7e-71 with ANOVA analysis.
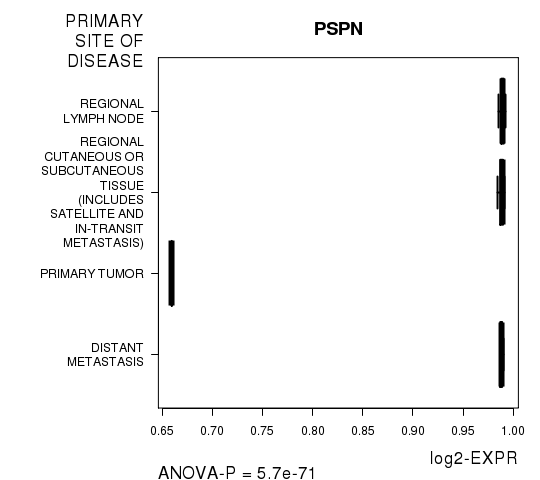
Table S5. Basic characteristics of clinical feature: 'GENDER'
| GENDER | Labels | N |
| FEMALE | 21 | |
| MALE | 43 | |
| Significant markers | N = 0 |
Table S6. Basic characteristics of clinical feature: 'DISTANT.METASTASIS'
| DISTANT.METASTASIS | Labels | N |
| M0 | 53 | |
| M1 | 1 | |
| M1A | 1 | |
| M1B | 1 | |
| M1C | 2 | |
| Significant markers | N = 531 |
Table S7. Get Full Table List of top 10 genes differentially expressed by 'DISTANT.METASTASIS'
| ANOVA_P | Q | |
|---|---|---|
| MUL1 | 3.595e-72 | 6.17e-68 |
| SFRP4 | 2.051e-62 | 3.52e-58 |
| CCNG1 | 8.506e-43 | 1.46e-38 |
| POLR3K | 4.528e-38 | 7.77e-34 |
| MAN2A1 | 1.457e-37 | 2.5e-33 |
| TPD52L2 | 2.203e-37 | 3.78e-33 |
| C11ORF80 | 9.745e-37 | 1.67e-32 |
| COPS3 | 7.502e-36 | 1.29e-31 |
| LOC728758 | 3.011e-33 | 5.17e-29 |
| F2RL1 | 3.967e-32 | 6.81e-28 |
Figure S2. Get High-res Image As an example, this figure shows the association of MUL1 to 'DISTANT.METASTASIS'. P value = 3.6e-72 with ANOVA analysis.
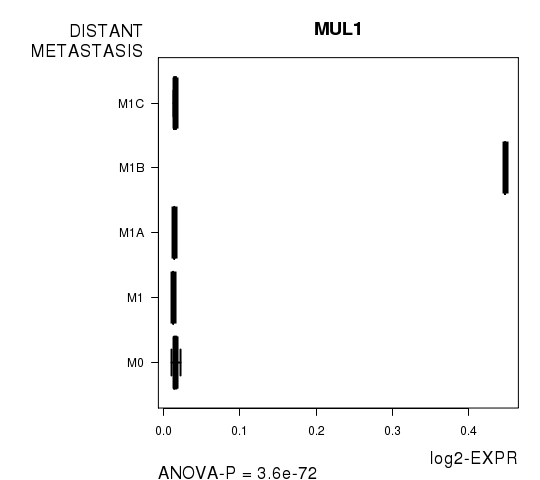
Table S8. Basic characteristics of clinical feature: 'LYMPH.NODE.METASTASIS'
| LYMPH.NODE.METASTASIS | Labels | N |
| N0 | 31 | |
| N1 | 1 | |
| N1A | 2 | |
| N1B | 6 | |
| N2A | 1 | |
| N2B | 5 | |
| N2C | 3 | |
| N3 | 7 | |
| NX | 2 | |
| Significant markers | N = 42 |
Table S9. Get Full Table List of top 10 genes differentially expressed by 'LYMPH.NODE.METASTASIS'
| ANOVA_P | Q | |
|---|---|---|
| TGM4 | 2.142e-30 | 3.68e-26 |
| CRIPAK | 1.178e-25 | 2.02e-21 |
| ITGB6 | 4.141e-23 | 7.11e-19 |
| MEPE | 1.019e-20 | 1.75e-16 |
| NHEDC1 | 2.102e-19 | 3.61e-15 |
| SUCNR1 | 3.43e-19 | 5.89e-15 |
| FREM2 | 1.625e-18 | 2.79e-14 |
| RNASEL | 3.014e-17 | 5.17e-13 |
| DGCR6 | 7.16e-17 | 1.23e-12 |
| TMEM182 | 2.198e-16 | 3.77e-12 |
Figure S3. Get High-res Image As an example, this figure shows the association of TGM4 to 'LYMPH.NODE.METASTASIS'. P value = 2.14e-30 with ANOVA analysis.
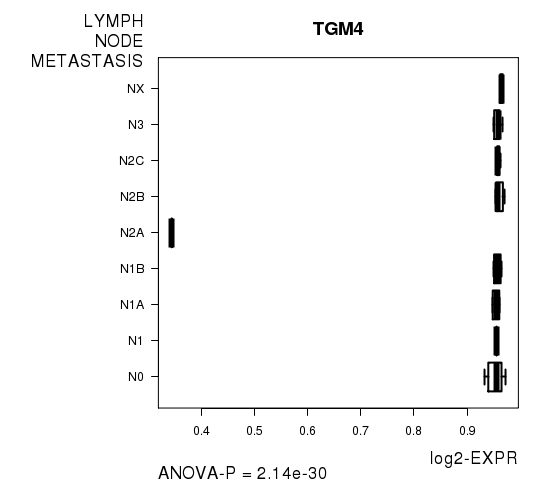
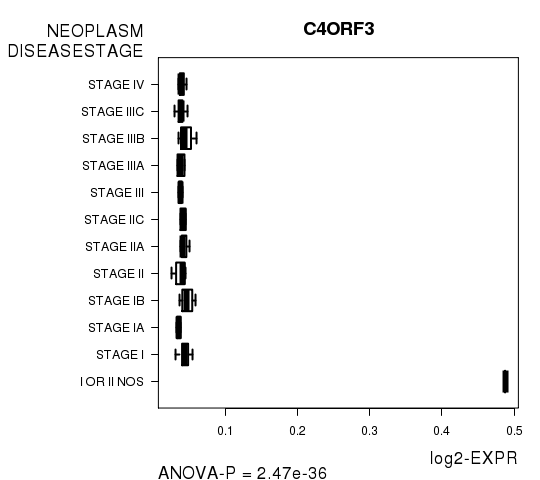
Table S10. Basic characteristics of clinical feature: 'NEOPLASM.DISEASESTAGE'
| NEOPLASM.DISEASESTAGE | Labels | N |
| I OR II NOS | 1 | |
| STAGE I | 10 | |
| STAGE IA | 2 | |
| STAGE IB | 4 | |
| STAGE II | 8 | |
| STAGE IIA | 3 | |
| STAGE IIC | 2 | |
| STAGE III | 4 | |
| STAGE IIIA | 2 | |
| STAGE IIIB | 7 | |
| STAGE IIIC | 9 | |
| STAGE IV | 3 | |
| Significant markers | N = 17 |
Table S11. Get Full Table List of top 10 genes differentially expressed by 'NEOPLASM.DISEASESTAGE'
| ANOVA_P | Q | |
|---|---|---|
| C4ORF3 | 2.468e-36 | 4.24e-32 |
| SRPK2 | 8.904e-27 | 1.53e-22 |
| FAM107B | 6.781e-26 | 1.16e-21 |
| HEMK1 | 2.79e-24 | 4.79e-20 |
| C2CD4C | 2.194e-18 | 3.77e-14 |
| TRIM5 | 1.355e-16 | 2.33e-12 |
| FUT4 | 8.719e-15 | 1.5e-10 |
| C5ORF58 | 2.48e-13 | 4.26e-09 |
| PTPRD | 3.513e-10 | 6.03e-06 |
| C17ORF49 | 4.82e-09 | 8.27e-05 |
Figure S4. Get High-res Image As an example, this figure shows the association of C4ORF3 to 'NEOPLASM.DISEASESTAGE'. P value = 2.47e-36 with ANOVA analysis.
-
Expresson data file = SKCM-BRAF_Hotspot_Mutants.meth.for_correlation.filtered_data.txt
-
Clinical data file = SKCM-BRAF_Hotspot_Mutants.clin.merged.picked.txt
-
Number of patients = 64
-
Number of genes = 17172
-
Number of clinical features = 7
For survival clinical features, Wald's test in univariate Cox regression analysis with proportional hazards model (Andersen and Gill 1982) was used to estimate the P values using the 'coxph' function in R. Kaplan-Meier survival curves were plot using the four quartile subgroups of patients based on expression levels
For continuous numerical clinical features, Spearman's rank correlation coefficients (Spearman 1904) and two-tailed P values were estimated using 'cor.test' function in R
For multi-class clinical features (ordinal or nominal), one-way analysis of variance (Howell 2002) was applied to compare the log2-expression levels between different clinical classes using 'anova' function in R
For two-class clinical features, two-tailed Student's t test with unequal variance (Lehmann and Romano 2005) was applied to compare the log2-expression levels between the two clinical classes using 't.test' function in R
For multiple hypothesis correction, Q value is the False Discovery Rate (FDR) analogue of the P value (Benjamini and Hochberg 1995), defined as the minimum FDR at which the test may be called significant. We used the 'Benjamini and Hochberg' method of 'p.adjust' function in R to convert P values into Q values.
This is an experimental feature. The full results of the analysis summarized in this report can be downloaded from the TCGA Data Coordination Center.