(NF1_Any_Mutants cohort)
This pipeline computes the correlation between significant arm-level copy number variations (cnvs) and selected clinical features.
Testing the association between copy number variation 38 arm-level results and 7 clinical features across 25 patients, 2 significant findings detected with Q value < 0.25.
-
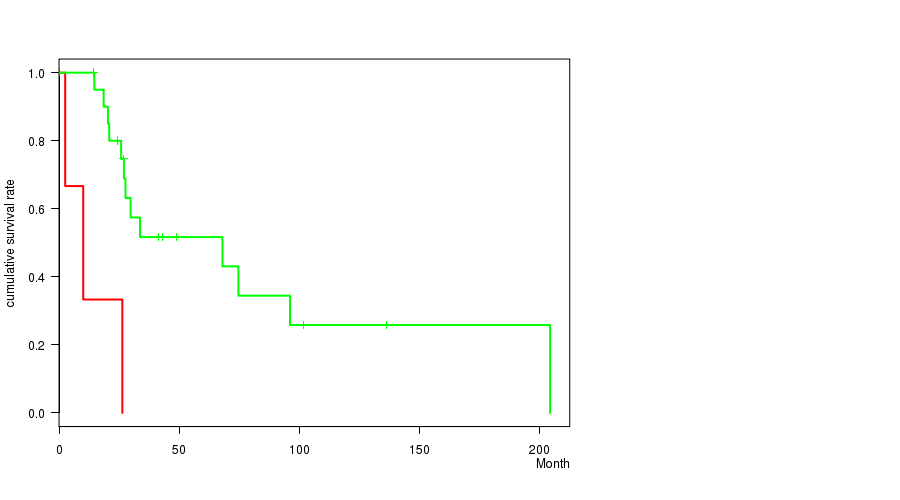
1p gain cnv correlated to 'Time to Death'.
-
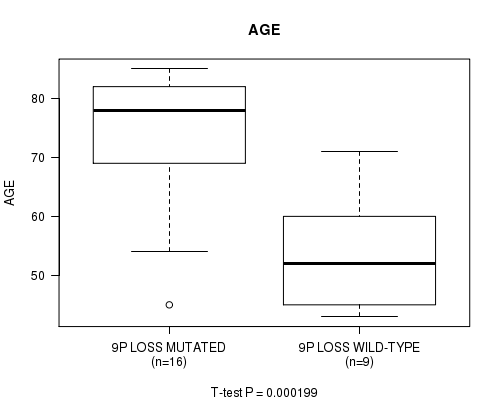
9p loss cnv correlated to 'AGE'.
Table 1. Get Full Table Overview of the association between significant copy number variation of 38 arm-level results and 7 clinical features. Shown in the table are P values (Q values). Thresholded by Q value < 0.25, 2 significant findings detected.
|
Clinical Features |
Time to Death |
AGE |
PRIMARY SITE OF DISEASE |
GENDER |
LYMPH NODE METASTASIS |
TUMOR STAGECODE |
NEOPLASM DISEASESTAGE |
||
| nCNV (%) | nWild-Type | logrank test | t-test | Fisher's exact test | Fisher's exact test | Fisher's exact test | t-test | Chi-square test | |
| 1p gain | 4 (16%) | 21 |
0.000555 (0.125) |
0.973 (1.00) |
1 (1.00) |
1 (1.00) |
0.481 (1.00) |
||
| 9p loss | 16 (64%) | 9 |
0.521 (1.00) |
0.000199 (0.0451) |
0.412 (1.00) |
0.661 (1.00) |
0.893 (1.00) |
0.719 (1.00) |
|
| 1q gain | 9 (36%) | 16 |
0.0169 (1.00) |
0.433 (1.00) |
0.353 (1.00) |
0.394 (1.00) |
0.1 (1.00) |
0.349 (1.00) |
|
| 3p gain | 4 (16%) | 21 |
0.528 (1.00) |
0.61 (1.00) |
1 (1.00) |
1 (1.00) |
0.481 (1.00) |
0.151 (1.00) |
|
| 3q gain | 5 (20%) | 20 |
0.167 (1.00) |
0.963 (1.00) |
0.812 (1.00) |
1 (1.00) |
0.352 (1.00) |
0.117 (1.00) |
|
| 5p gain | 4 (16%) | 21 |
0.0766 (1.00) |
0.711 (1.00) |
0.626 (1.00) |
0.57 (1.00) |
1 (1.00) |
0.0803 (1.00) |
|
| 5q gain | 3 (12%) | 22 |
0.0766 (1.00) |
0.97 (1.00) |
1 (1.00) |
1 (1.00) |
1 (1.00) |
0.188 (1.00) |
|
| 6p gain | 11 (44%) | 14 |
0.734 (1.00) |
0.327 (1.00) |
0.367 (1.00) |
1 (1.00) |
0.323 (1.00) |
0.316 (1.00) |
|
| 7p gain | 10 (40%) | 15 |
0.96 (1.00) |
0.756 (1.00) |
0.196 (1.00) |
0.194 (1.00) |
0.533 (1.00) |
0.812 (1.00) |
|
| 7q gain | 9 (36%) | 16 |
0.719 (1.00) |
0.827 (1.00) |
0.547 (1.00) |
0.087 (1.00) |
0.406 (1.00) |
0.512 (1.00) |
|
| 8p gain | 5 (20%) | 20 |
0.223 (1.00) |
0.951 (1.00) |
0.812 (1.00) |
0.283 (1.00) |
0.838 (1.00) |
0.17 (1.00) |
|
| 8q gain | 6 (24%) | 19 |
0.452 (1.00) |
0.949 (1.00) |
0.576 (1.00) |
0.344 (1.00) |
0.654 (1.00) |
0.349 (1.00) |
|
| 14q gain | 4 (16%) | 21 |
0.516 (1.00) |
0.504 (1.00) |
0.496 (1.00) |
0.57 (1.00) |
0.605 (1.00) |
0.788 (1.00) |
|
| 15q gain | 4 (16%) | 21 |
0.219 (1.00) |
0.957 (1.00) |
0.383 (1.00) |
0.0808 (1.00) |
1 (1.00) |
0.188 (1.00) |
|
| 17q gain | 5 (20%) | 20 |
0.235 (1.00) |
0.17 (1.00) |
0.347 (1.00) |
1 (1.00) |
0.292 (1.00) |
0.912 (1.00) |
|
| 18p gain | 3 (12%) | 22 |
0.0455 (1.00) |
0.25 (1.00) |
0.565 (1.00) |
1 (1.00) |
0.0378 (1.00) |
0.42 (1.00) |
|
| 20p gain | 6 (24%) | 19 |
0.388 (1.00) |
0.144 (1.00) |
0.107 (1.00) |
0.0593 (1.00) |
0.401 (1.00) |
0.349 (1.00) |
|
| 20q gain | 8 (32%) | 17 |
0.309 (1.00) |
0.487 (1.00) |
0.621 (1.00) |
0.359 (1.00) |
0.144 (1.00) |
0.487 (1.00) |
|
| 22q gain | 9 (36%) | 16 |
0.73 (1.00) |
0.462 (1.00) |
1 (1.00) |
0.394 (1.00) |
0.202 (1.00) |
0.577 (1.00) |
|
| 1p loss | 3 (12%) | 22 |
0.0487 (1.00) |
0.214 (1.00) |
0.152 (1.00) |
1 (1.00) |
1 (1.00) |
0.188 (1.00) |
|
| 4p loss | 4 (16%) | 21 |
0.362 (1.00) |
0.22 (1.00) |
0.275 (1.00) |
0.57 (1.00) |
0.481 (1.00) |
0.587 (1.00) |
|
| 4q loss | 4 (16%) | 21 |
0.312 (1.00) |
0.997 (1.00) |
0.204 (1.00) |
0.57 (1.00) |
1 (1.00) |
0.188 (1.00) |
|
| 5p loss | 4 (16%) | 21 |
0.386 (1.00) |
0.567 (1.00) |
0.204 (1.00) |
0.269 (1.00) |
0.684 (1.00) |
0.77 (1.00) |
|
| 5q loss | 6 (24%) | 19 |
0.0542 (1.00) |
0.959 (1.00) |
0.138 (1.00) |
0.129 (1.00) |
0.133 (1.00) |
0.738 (1.00) |
|
| 6q loss | 10 (40%) | 15 |
0.654 (1.00) |
0.0557 (1.00) |
0.577 (1.00) |
0.667 (1.00) |
0.105 (1.00) |
0.42 (1.00) |
|
| 9q loss | 13 (52%) | 12 |
0.575 (1.00) |
0.0565 (1.00) |
0.249 (1.00) |
0.673 (1.00) |
0.784 (1.00) |
0.294 (1.00) |
|
| 10p loss | 8 (32%) | 17 |
0.594 (1.00) |
0.601 (1.00) |
1 (1.00) |
0.359 (1.00) |
0.401 (1.00) |
0.986 (1.00) |
|
| 10q loss | 8 (32%) | 17 |
0.594 (1.00) |
0.205 (1.00) |
1 (1.00) |
0.359 (1.00) |
0.401 (1.00) |
0.752 (1.00) |
|
| 11p loss | 9 (36%) | 16 |
0.99 (1.00) |
0.377 (1.00) |
0.152 (1.00) |
0.394 (1.00) |
0.0303 (1.00) |
0.383 (1.00) |
|
| 11q loss | 9 (36%) | 16 |
0.752 (1.00) |
0.472 (1.00) |
0.152 (1.00) |
0.087 (1.00) |
0.714 (1.00) |
0.188 (1.00) |
|
| 12q loss | 3 (12%) | 22 |
0.963 (1.00) |
0.875 (1.00) |
0.763 (1.00) |
1 (1.00) |
0.209 (1.00) |
0.188 (1.00) |
|
| 13q loss | 6 (24%) | 19 |
0.535 (1.00) |
0.885 (1.00) |
0.689 (1.00) |
1 (1.00) |
0.0898 (1.00) |
0.236 (1.00) |
|
| 14q loss | 3 (12%) | 22 |
0.619 (1.00) |
0.996 (1.00) |
1 (1.00) |
0.231 (1.00) |
0.481 (1.00) |
0.587 (1.00) |
|
| 16q loss | 4 (16%) | 21 |
0.249 (1.00) |
0.944 (1.00) |
0.626 (1.00) |
1 (1.00) |
1 (1.00) |
0.326 (1.00) |
|
| 17p loss | 5 (20%) | 20 |
0.661 (1.00) |
0.755 (1.00) |
0.812 (1.00) |
1 (1.00) |
0.135 (1.00) |
0.278 (1.00) |
|
| 18p loss | 4 (16%) | 21 |
0.303 (1.00) |
0.559 (1.00) |
1 (1.00) |
0.57 (1.00) |
0.605 (1.00) |
0.716 (1.00) |
|
| 18q loss | 3 (12%) | 22 |
0.872 (1.00) |
0.61 (1.00) |
0.763 (1.00) |
1 (1.00) |
0.684 (1.00) |
0.854 (1.00) |
|
| 21q loss | 7 (28%) | 18 |
0.215 (1.00) |
0.978 (1.00) |
0.719 (1.00) |
0.64 (1.00) |
0.87 (1.00) |
0.31 (1.00) |
P value = 0.000555 (logrank test), Q value = 0.13
Table S1. Gene #1: '1p gain mutation analysis' versus Clinical Feature #1: 'Time to Death'
| nPatients | nDeath | Duration Range (Median), Month | |
|---|---|---|---|
| ALL | 25 | 16 | 0.2 - 204.6 (27.0) |
| 1P GAIN MUTATED | 4 | 3 | 0.2 - 26.4 (6.3) |
| 1P GAIN WILD-TYPE | 21 | 13 | 14.3 - 204.6 (29.8) |
Figure S1. Get High-res Image Gene #1: '1p gain mutation analysis' versus Clinical Feature #1: 'Time to Death'
P value = 0.000199 (t-test), Q value = 0.045
Table S2. Gene #25: '9p loss mutation analysis' versus Clinical Feature #2: 'AGE'
| nPatients | Mean (Std.Dev) | |
|---|---|---|
| ALL | 25 | 66.3 (14.3) |
| 9P LOSS MUTATED | 16 | 73.2 (11.7) |
| 9P LOSS WILD-TYPE | 9 | 53.9 (9.3) |
Figure S2. Get High-res Image Gene #25: '9p loss mutation analysis' versus Clinical Feature #2: 'AGE'
-
Mutation data file = broad_values_by_arm.mutsig.cluster.txt
-
Clinical data file = SKCM-NF1_Any_Mutants.clin.merged.picked.txt
-
Number of patients = 25
-
Number of significantly arm-level cnvs = 38
-
Number of selected clinical features = 7
-
Exclude genes that fewer than K tumors have mutations, K = 3
For survival clinical features, the Kaplan-Meier survival curves of tumors with and without gene mutations were plotted and the statistical significance P values were estimated by logrank test (Bland and Altman 2004) using the 'survdiff' function in R
For continuous numerical clinical features, two-tailed Student's t test with unequal variance (Lehmann and Romano 2005) was applied to compare the clinical values between tumors with and without gene mutations using 't.test' function in R
For binary or multi-class clinical features (nominal or ordinal), two-tailed Fisher's exact tests (Fisher 1922) were used to estimate the P values using the 'fisher.test' function in R
For multi-class clinical features (nominal or ordinal), Chi-square tests (Greenwood and Nikulin 1996) were used to estimate the P values using the 'chisq.test' function in R
For multiple hypothesis correction, Q value is the False Discovery Rate (FDR) analogue of the P value (Benjamini and Hochberg 1995), defined as the minimum FDR at which the test may be called significant. We used the 'Benjamini and Hochberg' method of 'p.adjust' function in R to convert P values into Q values.
This is an experimental feature. The full results of the analysis summarized in this report can be downloaded from the TCGA Data Coordination Center.