(NF1_Any_Mutants cohort)
This pipeline uses various statistical tests to identify mRNAs whose expression levels correlated to selected clinical features.
Testing the association between 17990 genes and 6 clinical features across 25 samples, statistically thresholded by Q value < 0.05, 1 clinical feature related to at least one genes.
-
8 genes correlated to 'GENDER'.
-
EIF1AY|9086 , UTY|7404 , PRKY|5616 , ZFY|7544 , XIST|7503 , ...
-
No genes correlated to 'Time to Death', 'AGE', 'PRIMARY.SITE.OF.DISEASE', 'LYMPH.NODE.METASTASIS', and 'NEOPLASM.DISEASESTAGE'.
Complete statistical result table is provided in Supplement Table 1
Table 1. Get Full Table This table shows the clinical features, statistical methods used, and the number of genes that are significantly associated with each clinical feature at Q value < 0.05.
| Clinical feature | Statistical test | Significant genes | Associated with | Associated with | ||
|---|---|---|---|---|---|---|
| Time to Death | Cox regression test | N=0 | ||||
| AGE | Spearman correlation test | N=0 | ||||
| PRIMARY SITE OF DISEASE | ANOVA test | N=0 | ||||
| GENDER | t test | N=8 | male | N=7 | female | N=1 |
| LYMPH NODE METASTASIS | ANOVA test | N=0 | ||||
| NEOPLASM DISEASESTAGE | ANOVA test | N=0 |
Table S1. Basic characteristics of clinical feature: 'Time to Death'
| Time to Death | Duration (Months) | 0.2-204.6 (median=27) |
| censored | N = 9 | |
| death | N = 16 | |
| Significant markers | N = 0 |
Table S2. Basic characteristics of clinical feature: 'AGE'
| AGE | Mean (SD) | 66.28 (14) |
| Significant markers | N = 0 |
Table S3. Basic characteristics of clinical feature: 'PRIMARY.SITE.OF.DISEASE'
| PRIMARY.SITE.OF.DISEASE | Labels | N |
| DISTANT METASTASIS | 7 | |
| REGIONAL CUTANEOUS OR SUBCUTANEOUS TISSUE (INCLUDES SATELLITE AND IN-TRANSIT METASTASIS) | 5 | |
| REGIONAL LYMPH NODE | 13 | |
| Significant markers | N = 0 |
Table S4. Basic characteristics of clinical feature: 'GENDER'
| GENDER | Labels | N |
| FEMALE | 8 | |
| MALE | 17 | |
| Significant markers | N = 8 | |
| Higher in MALE | 7 | |
| Higher in FEMALE | 1 |
Table S5. Get Full Table List of 8 genes differentially expressed by 'GENDER'
| T(pos if higher in 'MALE') | ttestP | Q | AUC | |
|---|---|---|---|---|
| EIF1AY|9086 | 23.49 | 3.609e-14 | 6.43e-10 | 1 |
| UTY|7404 | 17.07 | 4.759e-10 | 8.48e-06 | 1 |
| PRKY|5616 | 11.04 | 1.195e-08 | 0.000213 | 1 |
| ZFY|7544 | 10.71 | 2.43e-08 | 0.000433 | 1 |
| XIST|7503 | -9.35 | 7.947e-08 | 0.00142 | 1 |
| TTTY15|64595 | 10.04 | 1.353e-07 | 0.00241 | 1 |
| DDX3Y|8653 | 13.51 | 2.794e-07 | 0.00498 | 1 |
| RPS4Y1|6192 | 11.39 | 2.732e-06 | 0.0487 | 1 |
Figure S1. Get High-res Image As an example, this figure shows the association of EIF1AY|9086 to 'GENDER'. P value = 3.61e-14 with T-test analysis.
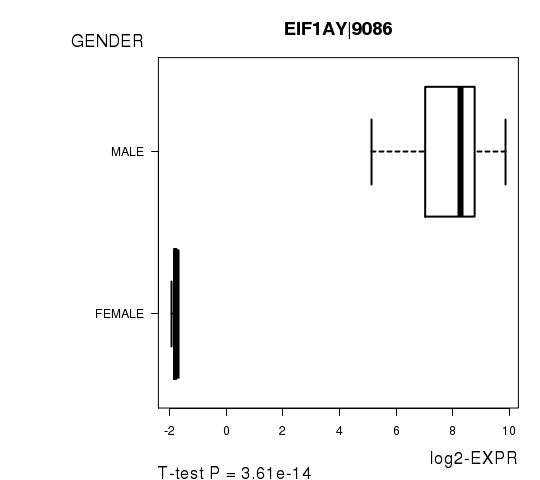
Table S6. Basic characteristics of clinical feature: 'LYMPH.NODE.METASTASIS'
| LYMPH.NODE.METASTASIS | Labels | N |
| N0 | 16 | |
| N1B | 3 | |
| N2C | 2 | |
| N3 | 2 | |
| Significant markers | N = 0 |
Table S7. Basic characteristics of clinical feature: 'NEOPLASM.DISEASESTAGE'
| NEOPLASM.DISEASESTAGE | Labels | N |
| STAGE IA | 3 | |
| STAGE IB | 1 | |
| STAGE II | 6 | |
| STAGE IIB | 3 | |
| STAGE IIIB | 3 | |
| STAGE IIIC | 4 | |
| STAGE IV | 1 | |
| Significant markers | N = 0 |
-
Expresson data file = SKCM-NF1_Any_Mutants.uncv2.mRNAseq_RSEM_normalized_log2.txt
-
Clinical data file = SKCM-NF1_Any_Mutants.clin.merged.picked.txt
-
Number of patients = 25
-
Number of genes = 17990
-
Number of clinical features = 6
For survival clinical features, Wald's test in univariate Cox regression analysis with proportional hazards model (Andersen and Gill 1982) was used to estimate the P values using the 'coxph' function in R. Kaplan-Meier survival curves were plot using the four quartile subgroups of patients based on expression levels
For continuous numerical clinical features, Spearman's rank correlation coefficients (Spearman 1904) and two-tailed P values were estimated using 'cor.test' function in R
For multi-class clinical features (ordinal or nominal), one-way analysis of variance (Howell 2002) was applied to compare the log2-expression levels between different clinical classes using 'anova' function in R
For two-class clinical features, two-tailed Student's t test with unequal variance (Lehmann and Romano 2005) was applied to compare the log2-expression levels between the two clinical classes using 't.test' function in R
For multiple hypothesis correction, Q value is the False Discovery Rate (FDR) analogue of the P value (Benjamini and Hochberg 1995), defined as the minimum FDR at which the test may be called significant. We used the 'Benjamini and Hochberg' method of 'p.adjust' function in R to convert P values into Q values.
This is an experimental feature. The full results of the analysis summarized in this report can be downloaded from the TCGA Data Coordination Center.