(NF1_Any_Mutants cohort)
This pipeline uses various statistical tests to identify genes whose promoter methylation levels correlated to selected clinical features.
Testing the association between 17038 genes and 6 clinical features across 22 samples, statistically thresholded by Q value < 0.05, 2 clinical features related to at least one genes.
-
288 genes correlated to 'LYMPH.NODE.METASTASIS'.
-
PALM3 , CYP4V2 , INPP5B , ZNF467 , DACT1 , ...
-
101 genes correlated to 'NEOPLASM.DISEASESTAGE'.
-
TCTEX1D4 , GZF1 , ZIK1 , AKAP13 , MTG1 , ...
-
No genes correlated to 'Time to Death', 'AGE', 'PRIMARY.SITE.OF.DISEASE', and 'GENDER'.
Complete statistical result table is provided in Supplement Table 1
Table 1. Get Full Table This table shows the clinical features, statistical methods used, and the number of genes that are significantly associated with each clinical feature at Q value < 0.05.
| Clinical feature | Statistical test | Significant genes | Associated with | Associated with | ||
|---|---|---|---|---|---|---|
| Time to Death | Cox regression test | N=0 | ||||
| AGE | Spearman correlation test | N=0 | ||||
| PRIMARY SITE OF DISEASE | ANOVA test | N=0 | ||||
| GENDER | t test | N=0 | ||||
| LYMPH NODE METASTASIS | ANOVA test | N=288 | ||||
| NEOPLASM DISEASESTAGE | ANOVA test | N=101 |
Table S1. Basic characteristics of clinical feature: 'Time to Death'
| Time to Death | Duration (Months) | 0.2-204.6 (median=26.9) |
| censored | N = 8 | |
| death | N = 14 | |
| Significant markers | N = 0 |
Table S2. Basic characteristics of clinical feature: 'AGE'
| AGE | Mean (SD) | 65.41 (15) |
| Significant markers | N = 0 |
Table S3. Basic characteristics of clinical feature: 'PRIMARY.SITE.OF.DISEASE'
| PRIMARY.SITE.OF.DISEASE | Labels | N |
| DISTANT METASTASIS | 6 | |
| REGIONAL CUTANEOUS OR SUBCUTANEOUS TISSUE (INCLUDES SATELLITE AND IN-TRANSIT METASTASIS) | 3 | |
| REGIONAL LYMPH NODE | 13 | |
| Significant markers | N = 0 |
Table S4. Basic characteristics of clinical feature: 'GENDER'
| GENDER | Labels | N |
| FEMALE | 8 | |
| MALE | 14 | |
| Significant markers | N = 0 |
Table S5. Basic characteristics of clinical feature: 'LYMPH.NODE.METASTASIS'
| LYMPH.NODE.METASTASIS | Labels | N |
| N0 | 15 | |
| N1B | 3 | |
| N2C | 1 | |
| N3 | 1 | |
| Significant markers | N = 288 |
Table S6. Get Full Table List of top 10 genes differentially expressed by 'LYMPH.NODE.METASTASIS'
| ANOVA_P | Q | |
|---|---|---|
| PALM3 | 1.937e-30 | 3.3e-26 |
| CYP4V2 | 7.353e-27 | 1.25e-22 |
| INPP5B | 7.719e-27 | 1.31e-22 |
| ZNF467 | 1.666e-26 | 2.84e-22 |
| DACT1 | 2.583e-26 | 4.4e-22 |
| TBKBP1 | 2.837e-26 | 4.83e-22 |
| ADRB2 | 5.849e-26 | 9.96e-22 |
| GAMT | 4.366e-25 | 7.44e-21 |
| MYCBPAP | 9.062e-25 | 1.54e-20 |
| MTL5 | 9.246e-25 | 1.57e-20 |
Figure S1. Get High-res Image As an example, this figure shows the association of PALM3 to 'LYMPH.NODE.METASTASIS'. P value = 1.94e-30 with ANOVA analysis.
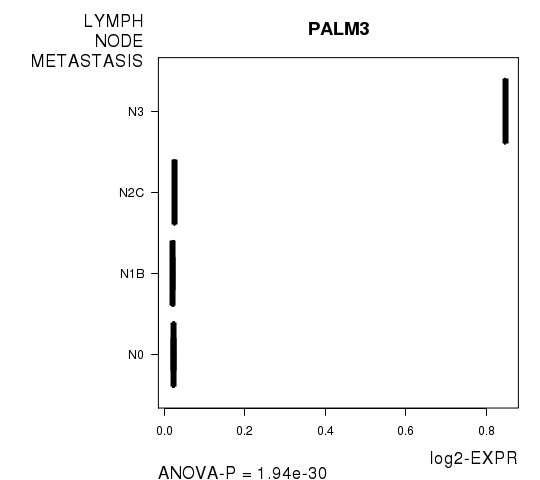
Table S7. Basic characteristics of clinical feature: 'NEOPLASM.DISEASESTAGE'
| NEOPLASM.DISEASESTAGE | Labels | N |
| STAGE IA | 2 | |
| STAGE IB | 1 | |
| STAGE II | 6 | |
| STAGE IIB | 3 | |
| STAGE IIIB | 2 | |
| STAGE IIIC | 3 | |
| STAGE IV | 1 | |
| Significant markers | N = 101 |
Table S8. Get Full Table List of top 10 genes differentially expressed by 'NEOPLASM.DISEASESTAGE'
| ANOVA_P | Q | |
|---|---|---|
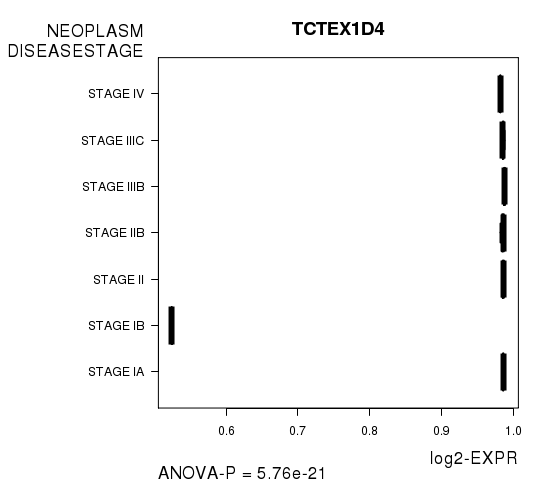
| TCTEX1D4 | 5.758e-21 | 9.81e-17 |
| GZF1 | 3.197e-20 | 5.45e-16 |
| ZIK1 | 1.005e-18 | 1.71e-14 |
| AKAP13 | 1.577e-17 | 2.69e-13 |
| MTG1 | 1.425e-15 | 2.43e-11 |
| FAM47E | 3.69e-15 | 6.29e-11 |
| RAB3GAP2 | 7.399e-14 | 1.26e-09 |
| CORO1B | 1.197e-13 | 2.04e-09 |
| ASNA1 | 2.899e-13 | 4.94e-09 |
| LDHAL6B | 4.504e-13 | 7.67e-09 |
Figure S2. Get High-res Image As an example, this figure shows the association of TCTEX1D4 to 'NEOPLASM.DISEASESTAGE'. P value = 5.76e-21 with ANOVA analysis.
-
Expresson data file = SKCM-NF1_Any_Mutants.meth.for_correlation.filtered_data.txt
-
Clinical data file = SKCM-NF1_Any_Mutants.clin.merged.picked.txt
-
Number of patients = 22
-
Number of genes = 17038
-
Number of clinical features = 6
For survival clinical features, Wald's test in univariate Cox regression analysis with proportional hazards model (Andersen and Gill 1982) was used to estimate the P values using the 'coxph' function in R. Kaplan-Meier survival curves were plot using the four quartile subgroups of patients based on expression levels
For continuous numerical clinical features, Spearman's rank correlation coefficients (Spearman 1904) and two-tailed P values were estimated using 'cor.test' function in R
For multi-class clinical features (ordinal or nominal), one-way analysis of variance (Howell 2002) was applied to compare the log2-expression levels between different clinical classes using 'anova' function in R
For two-class clinical features, two-tailed Student's t test with unequal variance (Lehmann and Romano 2005) was applied to compare the log2-expression levels between the two clinical classes using 't.test' function in R
For multiple hypothesis correction, Q value is the False Discovery Rate (FDR) analogue of the P value (Benjamini and Hochberg 1995), defined as the minimum FDR at which the test may be called significant. We used the 'Benjamini and Hochberg' method of 'p.adjust' function in R to convert P values into Q values.
This is an experimental feature. The full results of the analysis summarized in this report can be downloaded from the TCGA Data Coordination Center.