(NRAS_Hotspot_Mutants cohort)
This pipeline uses various statistical tests to identify mRNAs whose expression levels correlated to selected clinical features.
Testing the association between 18037 genes and 6 clinical features across 45 samples, statistically thresholded by Q value < 0.05, 2 clinical features related to at least one genes.
-
11 genes correlated to 'GENDER'.
-
ZFY|7544 , CYORF15B|84663 , PRKY|5616 , DDX3Y|8653 , RPS4Y1|6192 , ...
-
1 gene correlated to 'NEOPLASM.DISEASESTAGE'.
-
CHRNA9|55584
-
No genes correlated to 'Time to Death', 'AGE', 'PRIMARY.SITE.OF.DISEASE', and 'LYMPH.NODE.METASTASIS'.
Complete statistical result table is provided in Supplement Table 1
Table 1. Get Full Table This table shows the clinical features, statistical methods used, and the number of genes that are significantly associated with each clinical feature at Q value < 0.05.
| Clinical feature | Statistical test | Significant genes | Associated with | Associated with | ||
|---|---|---|---|---|---|---|
| Time to Death | Cox regression test | N=0 | ||||
| AGE | Spearman correlation test | N=0 | ||||
| PRIMARY SITE OF DISEASE | ANOVA test | N=0 | ||||
| GENDER | t test | N=11 | male | N=9 | female | N=2 |
| LYMPH NODE METASTASIS | ANOVA test | N=0 | ||||
| NEOPLASM DISEASESTAGE | ANOVA test | N=1 |
Table S1. Basic characteristics of clinical feature: 'Time to Death'
| Time to Death | Duration (Months) | 2.6-314.5 (median=48.9) |
| censored | N = 20 | |
| death | N = 25 | |
| Significant markers | N = 0 |
Table S2. Basic characteristics of clinical feature: 'AGE'
| AGE | Mean (SD) | 57.76 (15) |
| Significant markers | N = 0 |
Table S3. Basic characteristics of clinical feature: 'PRIMARY.SITE.OF.DISEASE'
| PRIMARY.SITE.OF.DISEASE | Labels | N |
| DISTANT METASTASIS | 8 | |
| REGIONAL CUTANEOUS OR SUBCUTANEOUS TISSUE (INCLUDES SATELLITE AND IN-TRANSIT METASTASIS) | 9 | |
| REGIONAL LYMPH NODE | 28 | |
| Significant markers | N = 0 |
Table S4. Basic characteristics of clinical feature: 'GENDER'
| GENDER | Labels | N |
| FEMALE | 16 | |
| MALE | 29 | |
| Significant markers | N = 11 | |
| Higher in MALE | 9 | |
| Higher in FEMALE | 2 |
Table S5. Get Full Table List of top 10 genes differentially expressed by 'GENDER'
| T(pos if higher in 'MALE') | ttestP | Q | AUC | |
|---|---|---|---|---|
| ZFY|7544 | 17.7 | 1.703e-20 | 3.07e-16 | 0.9973 |
| CYORF15B|84663 | 19.49 | 1.614e-18 | 2.91e-14 | 1 |
| PRKY|5616 | 14.46 | 1.671e-14 | 3.01e-10 | 0.9977 |
| DDX3Y|8653 | 16.65 | 5.727e-12 | 1.03e-07 | 1 |
| RPS4Y1|6192 | 14.22 | 2.207e-11 | 3.98e-07 | 1 |
| XIST|7503 | -9.82 | 3.168e-11 | 5.71e-07 | 0.9736 |
| NLGN4Y|22829 | 10.46 | 3.228e-11 | 5.82e-07 | 1 |
| KDM5D|8284 | 15.85 | 1.842e-08 | 0.000332 | 1 |
| TSIX|9383 | -7.45 | 1.766e-07 | 0.00318 | 0.9688 |
| USP9Y|8287 | 12.12 | 1.137e-06 | 0.0205 | 1 |
Figure S1. Get High-res Image As an example, this figure shows the association of ZFY|7544 to 'GENDER'. P value = 1.7e-20 with T-test analysis.
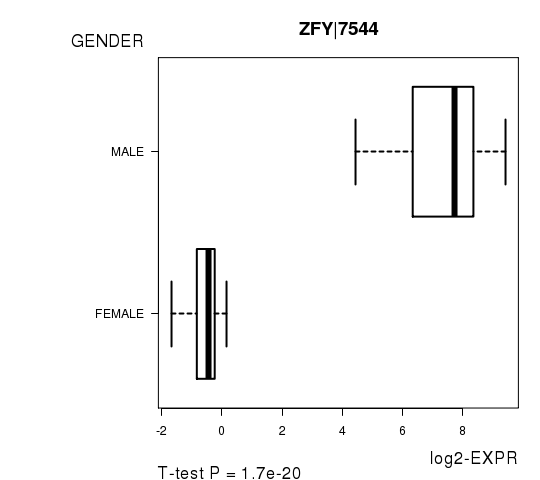
Table S6. Basic characteristics of clinical feature: 'LYMPH.NODE.METASTASIS'
| LYMPH.NODE.METASTASIS | Labels | N |
| N0 | 27 | |
| N1A | 3 | |
| N1B | 4 | |
| N2A | 1 | |
| N2B | 2 | |
| N3 | 5 | |
| Significant markers | N = 0 |
Table S7. Basic characteristics of clinical feature: 'NEOPLASM.DISEASESTAGE'
| NEOPLASM.DISEASESTAGE | Labels | N |
| I OR II NOS | 1 | |
| STAGE I | 3 | |
| STAGE IA | 4 | |
| STAGE IB | 6 | |
| STAGE II | 4 | |
| STAGE IIA | 3 | |
| STAGE IIB | 4 | |
| STAGE IIC | 2 | |
| STAGE III | 1 | |
| STAGE IIIA | 1 | |
| STAGE IIIB | 6 | |
| STAGE IIIC | 6 | |
| STAGE IV | 1 | |
| Significant markers | N = 1 |
Table S8. Get Full Table List of one gene differentially expressed by 'NEOPLASM.DISEASESTAGE'
| ANOVA_P | Q | |
|---|---|---|
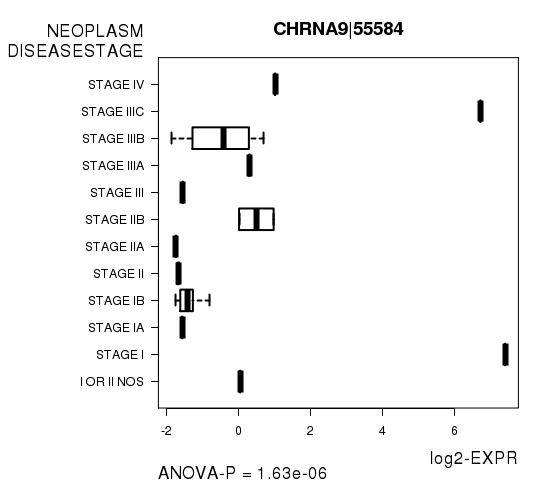
| CHRNA9|55584 | 1.631e-06 | 0.0294 |
Figure S2. Get High-res Image As an example, this figure shows the association of CHRNA9|55584 to 'NEOPLASM.DISEASESTAGE'. P value = 1.63e-06 with ANOVA analysis.
-
Expresson data file = SKCM-NRAS_Hotspot_Mutants.uncv2.mRNAseq_RSEM_normalized_log2.txt
-
Clinical data file = SKCM-NRAS_Hotspot_Mutants.clin.merged.picked.txt
-
Number of patients = 45
-
Number of genes = 18037
-
Number of clinical features = 6
For survival clinical features, Wald's test in univariate Cox regression analysis with proportional hazards model (Andersen and Gill 1982) was used to estimate the P values using the 'coxph' function in R. Kaplan-Meier survival curves were plot using the four quartile subgroups of patients based on expression levels
For continuous numerical clinical features, Spearman's rank correlation coefficients (Spearman 1904) and two-tailed P values were estimated using 'cor.test' function in R
For multi-class clinical features (ordinal or nominal), one-way analysis of variance (Howell 2002) was applied to compare the log2-expression levels between different clinical classes using 'anova' function in R
For two-class clinical features, two-tailed Student's t test with unequal variance (Lehmann and Romano 2005) was applied to compare the log2-expression levels between the two clinical classes using 't.test' function in R
For multiple hypothesis correction, Q value is the False Discovery Rate (FDR) analogue of the P value (Benjamini and Hochberg 1995), defined as the minimum FDR at which the test may be called significant. We used the 'Benjamini and Hochberg' method of 'p.adjust' function in R to convert P values into Q values.
This is an experimental feature. The full results of the analysis summarized in this report can be downloaded from the TCGA Data Coordination Center.