(NRAS_Hotspot_Mutants cohort)
This pipeline computes the correlation between significantly recurrent gene mutations and selected clinical features.
Testing the association between mutation status of 99 genes and 7 clinical features across 45 patients, 3 significant findings detected with Q value < 0.25.
-
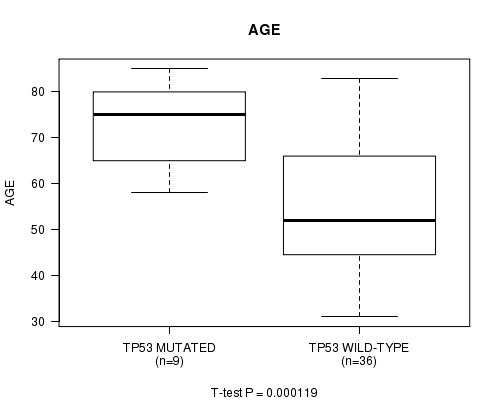
TP53 mutation correlated to 'AGE'.
-
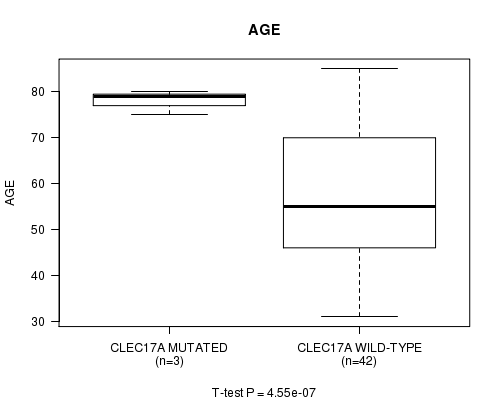
CLEC17A mutation correlated to 'AGE'.
-
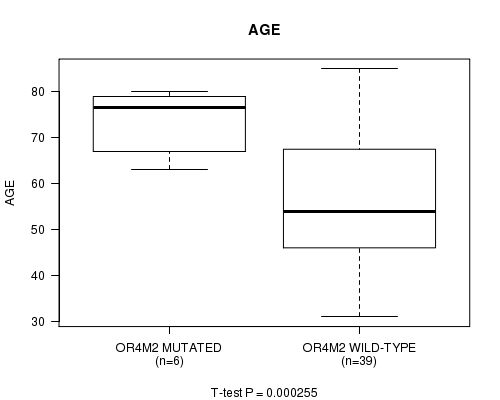
OR4M2 mutation correlated to 'AGE'.
Table 1. Get Full Table Overview of the association between mutation status of 99 genes and 7 clinical features. Shown in the table are P values (Q values). Thresholded by Q value < 0.25, 3 significant findings detected.
|
Clinical Features |
Time to Death |
AGE |
PRIMARY SITE OF DISEASE |
GENDER |
LYMPH NODE METASTASIS |
TUMOR STAGECODE |
NEOPLASM DISEASESTAGE |
||
| nMutated (%) | nWild-Type | logrank test | t-test | Fisher's exact test | Fisher's exact test | Chi-square test | t-test | Chi-square test | |
| TP53 | 9 (20%) | 36 |
0.443 (1.00) |
0.000119 (0.0701) |
0.659 (1.00) |
1 (1.00) |
0.129 (1.00) |
0.384 (1.00) |
|
| CLEC17A | 3 (7%) | 42 |
0.934 (1.00) |
4.55e-07 (0.00027) |
1 (1.00) |
1 (1.00) |
0.0784 (1.00) |
0.458 (1.00) |
|
| OR4M2 | 6 (13%) | 39 |
0.967 (1.00) |
0.000255 (0.15) |
0.397 (1.00) |
1 (1.00) |
0.526 (1.00) |
0.339 (1.00) |
|
| CDKN2A | 11 (24%) | 34 |
0.538 (1.00) |
0.782 (1.00) |
0.286 (1.00) |
0.483 (1.00) |
0.23 (1.00) |
0.25 (1.00) |
|
| MUM1L1 | 7 (16%) | 38 |
0.308 (1.00) |
0.754 (1.00) |
0.162 (1.00) |
0.686 (1.00) |
0.0038 (1.00) |
0.314 (1.00) |
|
| CD163L1 | 13 (29%) | 32 |
0.436 (1.00) |
0.00256 (1.00) |
0.9 (1.00) |
0.743 (1.00) |
0.582 (1.00) |
0.709 (1.00) |
|
| PSG4 | 8 (18%) | 37 |
0.451 (1.00) |
0.521 (1.00) |
0.259 (1.00) |
0.427 (1.00) |
0.822 (1.00) |
0.971 (1.00) |
|
| PPP6C | 9 (20%) | 36 |
0.0283 (1.00) |
0.414 (1.00) |
0.0712 (1.00) |
0.7 (1.00) |
0.0595 (1.00) |
0.348 (1.00) |
|
| ZNF99 | 13 (29%) | 32 |
0.0269 (1.00) |
0.135 (1.00) |
0.47 (1.00) |
0.494 (1.00) |
0.678 (1.00) |
0.532 (1.00) |
|
| KHDRBS2 | 8 (18%) | 37 |
0.867 (1.00) |
0.0923 (1.00) |
0.259 (1.00) |
0.691 (1.00) |
0.745 (1.00) |
0.651 (1.00) |
|
| POTEG | 8 (18%) | 37 |
0.202 (1.00) |
0.257 (1.00) |
0.628 (1.00) |
0.691 (1.00) |
0.418 (1.00) |
0.606 (1.00) |
|
| MARCO | 9 (20%) | 36 |
0.905 (1.00) |
0.936 (1.00) |
0.21 (1.00) |
0.127 (1.00) |
0.285 (1.00) |
0.348 (1.00) |
|
| SGCZ | 8 (18%) | 37 |
0.84 (1.00) |
0.829 (1.00) |
0.628 (1.00) |
1 (1.00) |
0.278 (1.00) |
0.546 (1.00) |
|
| GLRB | 9 (20%) | 36 |
0.793 (1.00) |
0.434 (1.00) |
0.432 (1.00) |
0.456 (1.00) |
0.778 (1.00) |
0.502 (1.00) |
|
| OR2W1 | 6 (13%) | 39 |
0.0765 (1.00) |
0.473 (1.00) |
0.703 (1.00) |
1 (1.00) |
0.471 (1.00) |
0.555 (1.00) |
|
| C4ORF22 | 5 (11%) | 40 |
0.229 (1.00) |
0.826 (1.00) |
0.656 (1.00) |
1 (1.00) |
0.773 (1.00) |
0.773 (1.00) |
|
| UGT2B28 | 8 (18%) | 37 |
0.902 (1.00) |
0.164 (1.00) |
0.869 (1.00) |
1 (1.00) |
0.653 (1.00) |
0.883 (1.00) |
|
| ZNF676 | 10 (22%) | 35 |
0.518 (1.00) |
0.687 (1.00) |
0.459 (1.00) |
0.726 (1.00) |
0.604 (1.00) |
0.606 (1.00) |
|
| LIPI | 7 (16%) | 38 |
0.0707 (1.00) |
0.721 (1.00) |
1 (1.00) |
0.393 (1.00) |
0.471 (1.00) |
0.92 (1.00) |
|
| CADM2 | 5 (11%) | 40 |
0.398 (1.00) |
0.764 (1.00) |
0.426 (1.00) |
0.33 (1.00) |
0.0934 (1.00) |
0.036 (1.00) |
|
| CDH9 | 9 (20%) | 36 |
0.855 (1.00) |
0.728 (1.00) |
0.283 (1.00) |
0.7 (1.00) |
0.672 (1.00) |
0.344 (1.00) |
|
| OR52E2 | 6 (13%) | 39 |
0.945 (1.00) |
0.991 (1.00) |
0.493 (1.00) |
1 (1.00) |
0.865 (1.00) |
0.528 (1.00) |
|
| CLEC5A | 4 (9%) | 41 |
0.58 (1.00) |
0.471 (1.00) |
0.215 (1.00) |
0.281 (1.00) |
0.799 (1.00) |
0.155 (1.00) |
|
| HIST1H2AA | 3 (7%) | 42 |
0.466 (1.00) |
0.438 (1.00) |
0.76 (1.00) |
1 (1.00) |
0.877 (1.00) |
0.779 (1.00) |
|
| KIAA1257 | 4 (9%) | 41 |
0.0143 (1.00) |
0.531 (1.00) |
0.0896 (1.00) |
1 (1.00) |
0.373 (1.00) |
0.154 (1.00) |
|
| PCDH18 | 9 (20%) | 36 |
0.424 (1.00) |
0.865 (1.00) |
0.659 (1.00) |
1 (1.00) |
0.817 (1.00) |
0.989 (1.00) |
|
| SPOCK3 | 6 (13%) | 39 |
0.936 (1.00) |
0.63 (1.00) |
0.189 (1.00) |
0.0749 (1.00) |
0.566 (1.00) |
0.0919 (1.00) |
|
| OR2G6 | 8 (18%) | 37 |
0.374 (1.00) |
0.00686 (1.00) |
0.215 (1.00) |
1 (1.00) |
0.809 (1.00) |
0.949 (1.00) |
|
| STXBP5L | 10 (22%) | 35 |
0.271 (1.00) |
0.726 (1.00) |
0.601 (1.00) |
0.131 (1.00) |
0.268 (1.00) |
0.897 (1.00) |
|
| CNGB3 | 9 (20%) | 36 |
0.246 (1.00) |
0.335 (1.00) |
1 (1.00) |
0.017 (1.00) |
0.778 (1.00) |
0.717 (1.00) |
|
| HHIPL2 | 3 (7%) | 42 |
0.608 (1.00) |
0.696 (1.00) |
1 (1.00) |
0.285 (1.00) |
0.847 (1.00) |
0.936 (1.00) |
|
| OR10G8 | 4 (9%) | 41 |
0.583 (1.00) |
0.224 (1.00) |
0.802 (1.00) |
0.121 (1.00) |
0.257 (1.00) |
0.458 (1.00) |
|
| UGT2B4 | 8 (18%) | 37 |
0.457 (1.00) |
0.375 (1.00) |
0.869 (1.00) |
0.427 (1.00) |
0.512 (1.00) |
0.071 (1.00) |
|
| ZBBX | 9 (20%) | 36 |
0.915 (1.00) |
0.583 (1.00) |
0.659 (1.00) |
0.127 (1.00) |
0.357 (1.00) |
0.441 (1.00) |
|
| C1QTNF9 | 3 (7%) | 42 |
0.438 (1.00) |
0.824 (1.00) |
1 (1.00) |
1 (1.00) |
0.877 (1.00) |
0.564 (1.00) |
|
| HCRTR2 | 7 (16%) | 38 |
0.58 (1.00) |
0.123 (1.00) |
0.522 (1.00) |
1 (1.00) |
0.598 (1.00) |
0.355 (1.00) |
|
| KRT78 | 5 (11%) | 40 |
0.168 (1.00) |
0.276 (1.00) |
0.807 (1.00) |
1 (1.00) |
0.448 (1.00) |
0.461 (1.00) |
|
| BCLAF1 | 9 (20%) | 36 |
0.67 (1.00) |
0.0172 (1.00) |
0.378 (1.00) |
0.456 (1.00) |
0.809 (1.00) |
0.789 (1.00) |
|
| LPAR1 | 3 (7%) | 42 |
0.379 (1.00) |
0.269 (1.00) |
0.529 (1.00) |
0.542 (1.00) |
0.735 (1.00) |
0.779 (1.00) |
|
| STK31 | 6 (13%) | 39 |
0.768 (1.00) |
0.935 (1.00) |
0.189 (1.00) |
1 (1.00) |
0.46 (1.00) |
0.667 (1.00) |
|
| HBG2 | 4 (9%) | 41 |
0.803 (1.00) |
0.123 (1.00) |
0.802 (1.00) |
1 (1.00) |
0.799 (1.00) |
0.608 (1.00) |
|
| BAGE2 | 3 (7%) | 42 |
0.223 (1.00) |
0.29 (1.00) |
0.103 (1.00) |
1 (1.00) |
0.847 (1.00) |
0.564 (1.00) |
|
| ADH1B | 6 (13%) | 39 |
0.597 (1.00) |
0.605 (1.00) |
0.595 (1.00) |
0.65 (1.00) |
0.877 (1.00) |
0.461 (1.00) |
|
| CNTN4 | 10 (22%) | 35 |
0.773 (1.00) |
0.681 (1.00) |
0.139 (1.00) |
1 (1.00) |
0.355 (1.00) |
0.7 (1.00) |
|
| DEFA4 | 4 (9%) | 41 |
0.562 (1.00) |
0.979 (1.00) |
0.802 (1.00) |
0.608 (1.00) |
0.88 (1.00) |
0.196 (1.00) |
|
| GFRAL | 8 (18%) | 37 |
0.414 (1.00) |
0.78 (1.00) |
0.141 (1.00) |
0.427 (1.00) |
0.546 (1.00) |
0.00422 (1.00) |
|
| ST8SIA3 | 6 (13%) | 39 |
0.848 (1.00) |
0.768 (1.00) |
0.595 (1.00) |
0.166 (1.00) |
0.0355 (1.00) |
0.597 (1.00) |
|
| DSPP | 5 (11%) | 40 |
0.29 (1.00) |
0.7 (1.00) |
0.336 (1.00) |
1 (1.00) |
0.448 (1.00) |
0.461 (1.00) |
|
| OR10K2 | 7 (16%) | 38 |
0.929 (1.00) |
0.0419 (1.00) |
1 (1.00) |
1 (1.00) |
0.364 (1.00) |
0.734 (1.00) |
|
| POU6F2 | 8 (18%) | 37 |
0.549 (1.00) |
0.0106 (1.00) |
0.869 (1.00) |
1 (1.00) |
0.0796 (1.00) |
0.467 (1.00) |
|
| LRRIQ3 | 7 (16%) | 38 |
0.544 (1.00) |
0.341 (1.00) |
1 (1.00) |
1 (1.00) |
0.231 (1.00) |
0.497 (1.00) |
|
| ARID2 | 9 (20%) | 36 |
0.451 (1.00) |
0.0875 (1.00) |
0.659 (1.00) |
0.456 (1.00) |
0.7 (1.00) |
0.753 (1.00) |
|
| GAS2 | 5 (11%) | 40 |
0.508 (1.00) |
0.973 (1.00) |
0.256 (1.00) |
0.641 (1.00) |
0.676 (1.00) |
0.242 (1.00) |
|
| SIRPB1 | 6 (13%) | 39 |
0.874 (1.00) |
0.669 (1.00) |
0.703 (1.00) |
0.399 (1.00) |
0.763 (1.00) |
0.986 (1.00) |
|
| ACTC1 | 4 (9%) | 41 |
0.343 (1.00) |
0.709 (1.00) |
0.619 (1.00) |
0.281 (1.00) |
0.773 (1.00) |
0.196 (1.00) |
|
| PRB2 | 5 (11%) | 40 |
0.875 (1.00) |
0.193 (1.00) |
0.656 (1.00) |
0.144 (1.00) |
0.306 (1.00) |
0.905 (1.00) |
|
| C15ORF23 | 3 (7%) | 42 |
0.0764 (1.00) |
0.533 (1.00) |
0.316 (1.00) |
1 (1.00) |
0.0296 (1.00) |
0.112 (1.00) |
|
| FASLG | 3 (7%) | 42 |
0.778 (1.00) |
0.569 (1.00) |
0.76 (1.00) |
1 (1.00) |
|||
| PAK7 | 9 (20%) | 36 |
0.781 (1.00) |
0.288 (1.00) |
0.659 (1.00) |
1 (1.00) |
0.21 (1.00) |
0.512 (1.00) |
|
| SIGLEC14 | 3 (7%) | 42 |
0.754 (1.00) |
0.256 (1.00) |
0.0276 (1.00) |
0.542 (1.00) |
0.533 (1.00) |
0.564 (1.00) |
|
| TPTE2 | 6 (13%) | 39 |
0.3 (1.00) |
0.599 (1.00) |
0.595 (1.00) |
0.399 (1.00) |
0.773 (1.00) |
0.693 (1.00) |
|
| APBB1IP | 5 (11%) | 40 |
0.836 (1.00) |
0.746 (1.00) |
0.522 (1.00) |
1 (1.00) |
0.448 (1.00) |
0.667 (1.00) |
|
| ANGPT1 | 6 (13%) | 39 |
0.502 (1.00) |
0.509 (1.00) |
0.703 (1.00) |
0.0749 (1.00) |
0.761 (1.00) |
0.882 (1.00) |
|
| ARMC4 | 11 (24%) | 34 |
0.461 (1.00) |
0.11 (1.00) |
0.477 (1.00) |
1 (1.00) |
0.143 (1.00) |
0.748 (1.00) |
|
| CYP4X1 | 4 (9%) | 41 |
0.16 (1.00) |
0.055 (1.00) |
0.306 (1.00) |
0.121 (1.00) |
0.0503 (1.00) |
0.905 (1.00) |
|
| DSG1 | 6 (13%) | 39 |
0.675 (1.00) |
0.58 (1.00) |
0.397 (1.00) |
0.65 (1.00) |
0.0552 (1.00) |
0.615 (1.00) |
|
| ADAM7 | 10 (22%) | 35 |
0.05 (1.00) |
0.809 (1.00) |
0.337 (1.00) |
0.0714 (1.00) |
0.68 (1.00) |
0.67 (1.00) |
|
| KCNQ5 | 8 (18%) | 37 |
0.00331 (1.00) |
0.421 (1.00) |
0.468 (1.00) |
1 (1.00) |
0.945 (1.00) |
0.967 (1.00) |
|
| POF1B | 8 (18%) | 37 |
0.0461 (1.00) |
0.652 (1.00) |
0.215 (1.00) |
0.427 (1.00) |
0.164 (1.00) |
0.703 (1.00) |
|
| TCEB3C | 6 (13%) | 39 |
0.281 (1.00) |
0.91 (1.00) |
1 (1.00) |
0.399 (1.00) |
0.182 (1.00) |
0.732 (1.00) |
|
| F2RL1 | 5 (11%) | 40 |
0.351 (1.00) |
0.221 (1.00) |
0.522 (1.00) |
0.33 (1.00) |
0.88 (1.00) |
0.608 (1.00) |
|
| SNCAIP | 9 (20%) | 36 |
0.596 (1.00) |
0.9 (1.00) |
1 (1.00) |
0.127 (1.00) |
0.473 (1.00) |
0.746 (1.00) |
|
| LOC649330 | 7 (16%) | 38 |
0.624 (1.00) |
0.207 (1.00) |
1 (1.00) |
1 (1.00) |
0.471 (1.00) |
0.838 (1.00) |
|
| UGT2A3 | 6 (13%) | 39 |
0.438 (1.00) |
0.211 (1.00) |
0.493 (1.00) |
0.399 (1.00) |
0.761 (1.00) |
0.217 (1.00) |
|
| NDUFA13 | 4 (9%) | 41 |
0.385 (1.00) |
0.118 (1.00) |
0.444 (1.00) |
0.281 (1.00) |
0.218 (1.00) |
0.773 (1.00) |
|
| ZIM3 | 4 (9%) | 41 |
0.108 (1.00) |
0.884 (1.00) |
1 (1.00) |
1 (1.00) |
0.877 (1.00) |
0.869 (1.00) |
|
| DDX3X | 6 (13%) | 39 |
0.549 (1.00) |
0.971 (1.00) |
0.819 (1.00) |
0.399 (1.00) |
0.676 (1.00) |
0.798 (1.00) |
|
| LILRB4 | 6 (13%) | 39 |
0.486 (1.00) |
0.579 (1.00) |
0.0544 (1.00) |
0.65 (1.00) |
0.911 (1.00) |
0.157 (1.00) |
|
| TLR4 | 9 (20%) | 36 |
0.225 (1.00) |
0.854 (1.00) |
0.378 (1.00) |
0.127 (1.00) |
0.608 (1.00) |
0.546 (1.00) |
|
| ZNF479 | 3 (7%) | 42 |
0.715 (1.00) |
0.0535 (1.00) |
1 (1.00) |
1 (1.00) |
0.0151 (1.00) |
0.936 (1.00) |
|
| GABRG1 | 3 (7%) | 42 |
0.744 (1.00) |
0.297 (1.00) |
0.76 (1.00) |
1 (1.00) |
0.257 (1.00) |
0.779 (1.00) |
|
| OR1N2 | 6 (13%) | 39 |
0.205 (1.00) |
0.827 (1.00) |
0.493 (1.00) |
0.399 (1.00) |
0.761 (1.00) |
0.441 (1.00) |
|
| HHLA2 | 4 (9%) | 41 |
0.384 (1.00) |
0.726 (1.00) |
0.215 (1.00) |
0.281 (1.00) |
0.799 (1.00) |
0.693 (1.00) |
|
| SYCE1 | 4 (9%) | 41 |
0.608 (1.00) |
0.0737 (1.00) |
0.215 (1.00) |
1 (1.00) |
0.0296 (1.00) |
0.0797 (1.00) |
|
| RGPD3 | 9 (20%) | 36 |
0.788 (1.00) |
0.543 (1.00) |
0.766 (1.00) |
0.456 (1.00) |
0.628 (1.00) |
0.424 (1.00) |
|
| CDH10 | 10 (22%) | 35 |
0.033 (1.00) |
0.454 (1.00) |
0.774 (1.00) |
0.726 (1.00) |
0.0475 (1.00) |
0.422 (1.00) |
|
| C6ORF105 | 4 (9%) | 41 |
0.633 (1.00) |
0.00357 (1.00) |
1 (1.00) |
1 (1.00) |
0.00399 (1.00) |
0.155 (1.00) |
|
| FPR2 | 4 (9%) | 41 |
0.753 (1.00) |
0.834 (1.00) |
0.619 (1.00) |
1 (1.00) |
0.783 (1.00) |
0.693 (1.00) |
|
| UGT1A7 | 3 (7%) | 42 |
0.571 (1.00) |
0.389 (1.00) |
1 (1.00) |
1 (1.00) |
0.257 (1.00) |
0.779 (1.00) |
|
| JAKMIP1 | 5 (11%) | 40 |
0.125 (1.00) |
0.00949 (1.00) |
1 (1.00) |
0.641 (1.00) |
0.865 (1.00) |
0.0719 (1.00) |
|
| CYLC2 | 5 (11%) | 40 |
0.78 (1.00) |
0.256 (1.00) |
1 (1.00) |
0.641 (1.00) |
0.404 (1.00) |
0.773 (1.00) |
|
| DRGX | 6 (13%) | 39 |
0.714 (1.00) |
0.368 (1.00) |
0.595 (1.00) |
1 (1.00) |
0.761 (1.00) |
0.615 (1.00) |
|
| IDH1 | 3 (7%) | 42 |
0.9 (1.00) |
0.401 (1.00) |
0.76 (1.00) |
0.285 (1.00) |
0.877 (1.00) |
0.779 (1.00) |
|
| ASB5 | 3 (7%) | 42 |
0.895 (1.00) |
0.37 (1.00) |
1 (1.00) |
1 (1.00) |
0.877 (1.00) |
0.674 (1.00) |
|
| COL21A1 | 9 (20%) | 36 |
0.522 (1.00) |
0.684 (1.00) |
0.766 (1.00) |
0.456 (1.00) |
0.496 (1.00) |
0.0164 (1.00) |
|
| ANKRD45 | 7 (16%) | 38 |
0.194 (1.00) |
0.114 (1.00) |
1 (1.00) |
0.393 (1.00) |
0.0355 (1.00) |
0.254 (1.00) |
|
| LCE1B | 4 (9%) | 41 |
0.123 (1.00) |
0.443 (1.00) |
1 (1.00) |
0.608 (1.00) |
0.625 (1.00) |
0.949 (1.00) |
|
| MGAM | 18 (40%) | 27 |
0.58 (1.00) |
0.203 (1.00) |
0.387 (1.00) |
0.527 (1.00) |
0.96 (1.00) |
0.421 (1.00) |
|
| ACSM2B | 6 (13%) | 39 |
0.516 (1.00) |
0.714 (1.00) |
0.595 (1.00) |
1 (1.00) |
0.832 (1.00) |
0.0425 (1.00) |
P value = 0.000119 (t-test), Q value = 0.07
Table S1. Gene #2: 'TP53 MUTATION STATUS' versus Clinical Feature #2: 'AGE'
| nPatients | Mean (Std.Dev) | |
|---|---|---|
| ALL | 45 | 57.8 (15.4) |
| TP53 MUTATED | 9 | 73.1 (9.5) |
| TP53 WILD-TYPE | 36 | 53.9 (14.2) |
Figure S1. Get High-res Image Gene #2: 'TP53 MUTATION STATUS' versus Clinical Feature #2: 'AGE'
P value = 4.55e-07 (t-test), Q value = 0.00027
Table S2. Gene #48: 'CLEC17A MUTATION STATUS' versus Clinical Feature #2: 'AGE'
| nPatients | Mean (Std.Dev) | |
|---|---|---|
| ALL | 45 | 57.8 (15.4) |
| CLEC17A MUTATED | 3 | 78.0 (2.6) |
| CLEC17A WILD-TYPE | 42 | 56.3 (14.9) |
Figure S2. Get High-res Image Gene #48: 'CLEC17A MUTATION STATUS' versus Clinical Feature #2: 'AGE'
P value = 0.000255 (t-test), Q value = 0.15
Table S3. Gene #95: 'OR4M2 MUTATION STATUS' versus Clinical Feature #2: 'AGE'
| nPatients | Mean (Std.Dev) | |
|---|---|---|
| ALL | 45 | 57.8 (15.4) |
| OR4M2 MUTATED | 6 | 73.7 (7.0) |
| OR4M2 WILD-TYPE | 39 | 55.3 (14.9) |
Figure S3. Get High-res Image Gene #95: 'OR4M2 MUTATION STATUS' versus Clinical Feature #2: 'AGE'
-
Mutation data file = SKCM-NRAS_Hotspot_Mutants.mutsig.cluster.txt
-
Clinical data file = SKCM-NRAS_Hotspot_Mutants.clin.merged.picked.txt
-
Number of patients = 45
-
Number of significantly mutated genes = 99
-
Number of selected clinical features = 7
-
Exclude genes that fewer than K tumors have mutations, K = 3
For survival clinical features, the Kaplan-Meier survival curves of tumors with and without gene mutations were plotted and the statistical significance P values were estimated by logrank test (Bland and Altman 2004) using the 'survdiff' function in R
For continuous numerical clinical features, two-tailed Student's t test with unequal variance (Lehmann and Romano 2005) was applied to compare the clinical values between tumors with and without gene mutations using 't.test' function in R
For binary or multi-class clinical features (nominal or ordinal), two-tailed Fisher's exact tests (Fisher 1922) were used to estimate the P values using the 'fisher.test' function in R
For multi-class clinical features (nominal or ordinal), Chi-square tests (Greenwood and Nikulin 1996) were used to estimate the P values using the 'chisq.test' function in R
For multiple hypothesis correction, Q value is the False Discovery Rate (FDR) analogue of the P value (Benjamini and Hochberg 1995), defined as the minimum FDR at which the test may be called significant. We used the 'Benjamini and Hochberg' method of 'p.adjust' function in R to convert P values into Q values.
This is an experimental feature. The full results of the analysis summarized in this report can be downloaded from the TCGA Data Coordination Center.