(Regional_LN cohort)
This pipeline computes the correlation between significant arm-level copy number variations (cnvs) and selected clinical features.
Testing the association between copy number variation 72 arm-level results and 7 clinical features across 112 patients, one significant finding detected with Q value < 0.25.
-
18q gain cnv correlated to 'NEOPLASM.DISEASESTAGE'.
Table 1. Get Full Table Overview of the association between significant copy number variation of 72 arm-level results and 7 clinical features. Shown in the table are P values (Q values). Thresholded by Q value < 0.25, one significant finding detected.
|
Clinical Features |
Time to Death |
AGE | GENDER |
DISTANT METASTASIS |
LYMPH NODE METASTASIS |
TUMOR STAGECODE |
NEOPLASM DISEASESTAGE |
||
| nCNV (%) | nWild-Type | logrank test | t-test | Fisher's exact test | Fisher's exact test | Chi-square test | t-test | Chi-square test | |
| 18q gain | 6 (5%) | 106 |
0.648 (1.00) |
0.989 (1.00) |
0.663 (1.00) |
1 (1.00) |
0.656 (1.00) |
0.000517 (0.221) |
|
| 1p gain | 12 (11%) | 100 |
0.842 (1.00) |
0.191 (1.00) |
0.751 (1.00) |
1 (1.00) |
0.103 (1.00) |
0.905 (1.00) |
|
| 1q gain | 33 (29%) | 79 |
0.531 (1.00) |
0.84 (1.00) |
0.374 (1.00) |
1 (1.00) |
0.116 (1.00) |
0.714 (1.00) |
|
| 2p gain | 10 (9%) | 102 |
0.962 (1.00) |
0.382 (1.00) |
1 (1.00) |
1 (1.00) |
0.255 (1.00) |
0.435 (1.00) |
|
| 2q gain | 9 (8%) | 103 |
0.756 (1.00) |
0.705 (1.00) |
1 (1.00) |
1 (1.00) |
0.542 (1.00) |
0.685 (1.00) |
|
| 3p gain | 7 (6%) | 105 |
0.577 (1.00) |
0.946 (1.00) |
0.676 (1.00) |
1 (1.00) |
0.174 (1.00) |
0.623 (1.00) |
|
| 3q gain | 8 (7%) | 104 |
0.901 (1.00) |
0.00716 (1.00) |
0.703 (1.00) |
1 (1.00) |
0.722 (1.00) |
0.945 (1.00) |
|
| 4p gain | 10 (9%) | 102 |
0.209 (1.00) |
0.258 (1.00) |
0.281 (1.00) |
1 (1.00) |
0.954 (1.00) |
0.0101 (1.00) |
|
| 4q gain | 10 (9%) | 102 |
0.385 (1.00) |
0.121 (1.00) |
0.501 (1.00) |
1 (1.00) |
0.695 (1.00) |
0.00206 (0.874) |
|
| 5p gain | 12 (11%) | 100 |
0.409 (1.00) |
0.734 (1.00) |
1 (1.00) |
0.399 (1.00) |
0.812 (1.00) |
0.366 (1.00) |
|
| 5q gain | 5 (4%) | 107 |
0.555 (1.00) |
0.647 (1.00) |
1 (1.00) |
0.571 (1.00) |
0.775 (1.00) |
||
| 6p gain | 35 (31%) | 77 |
0.986 (1.00) |
0.366 (1.00) |
0.0303 (1.00) |
1 (1.00) |
0.809 (1.00) |
0.562 (1.00) |
|
| 6q gain | 8 (7%) | 104 |
0.334 (1.00) |
0.801 (1.00) |
0.703 (1.00) |
1 (1.00) |
0.916 (1.00) |
0.527 (1.00) |
|
| 7p gain | 44 (39%) | 68 |
0.869 (1.00) |
0.746 (1.00) |
1 (1.00) |
0.209 (1.00) |
0.229 (1.00) |
0.062 (1.00) |
|
| 7q gain | 44 (39%) | 68 |
0.528 (1.00) |
0.466 (1.00) |
1 (1.00) |
0.218 (1.00) |
0.478 (1.00) |
0.0452 (1.00) |
|
| 8p gain | 18 (16%) | 94 |
0.983 (1.00) |
0.184 (1.00) |
0.421 (1.00) |
0.271 (1.00) |
0.8 (1.00) |
0.538 (1.00) |
|
| 8q gain | 31 (28%) | 81 |
0.533 (1.00) |
0.258 (1.00) |
0.261 (1.00) |
0.483 (1.00) |
0.724 (1.00) |
0.953 (1.00) |
|
| 9q gain | 4 (4%) | 108 |
0.889 (1.00) |
0.588 (1.00) |
1 (1.00) |
0.463 (1.00) |
0.799 (1.00) |
||
| 11p gain | 8 (7%) | 104 |
0.995 (1.00) |
0.494 (1.00) |
1 (1.00) |
1 (1.00) |
0.241 (1.00) |
0.503 (1.00) |
|
| 11q gain | 5 (4%) | 107 |
0.927 (1.00) |
0.617 (1.00) |
1 (1.00) |
1 (1.00) |
0.934 (1.00) |
0.471 (1.00) |
|
| 12p gain | 10 (9%) | 102 |
0.368 (1.00) |
0.929 (1.00) |
0.722 (1.00) |
0.176 (1.00) |
0.328 (1.00) |
0.756 (1.00) |
|
| 12q gain | 4 (4%) | 108 |
0.942 (1.00) |
0.582 (1.00) |
0.307 (1.00) |
1 (1.00) |
0.00575 (1.00) |
0.354 (1.00) |
|
| 13q gain | 15 (13%) | 97 |
0.569 (1.00) |
0.75 (1.00) |
0.23 (1.00) |
1 (1.00) |
0.12 (1.00) |
0.154 (1.00) |
|
| 14q gain | 9 (8%) | 103 |
0.303 (1.00) |
0.654 (1.00) |
0.718 (1.00) |
1 (1.00) |
0.874 (1.00) |
0.849 (1.00) |
|
| 15q gain | 16 (14%) | 96 |
0.703 (1.00) |
0.79 (1.00) |
0.772 (1.00) |
1 (1.00) |
0.789 (1.00) |
0.678 (1.00) |
|
| 16p gain | 6 (5%) | 106 |
0.778 (1.00) |
0.744 (1.00) |
0.374 (1.00) |
1 (1.00) |
0.377 (1.00) |
0.634 (1.00) |
|
| 16q gain | 6 (5%) | 106 |
0.778 (1.00) |
0.838 (1.00) |
1 (1.00) |
1 (1.00) |
0.0441 (1.00) |
0.698 (1.00) |
|
| 17p gain | 8 (7%) | 104 |
0.733 (1.00) |
0.0317 (1.00) |
0.254 (1.00) |
1 (1.00) |
0.991 (1.00) |
0.000914 (0.39) |
|
| 17q gain | 15 (13%) | 97 |
0.101 (1.00) |
0.0133 (1.00) |
0.23 (1.00) |
1 (1.00) |
0.907 (1.00) |
0.0456 (1.00) |
|
| 18p gain | 14 (12%) | 98 |
0.726 (1.00) |
0.247 (1.00) |
0.361 (1.00) |
1 (1.00) |
0.222 (1.00) |
0.000619 (0.264) |
|
| 19p gain | 8 (7%) | 104 |
0.378 (1.00) |
0.481 (1.00) |
0.254 (1.00) |
1 (1.00) |
0.93 (1.00) |
0.113 (1.00) |
|
| 19q gain | 9 (8%) | 103 |
0.378 (1.00) |
0.383 (1.00) |
0.135 (1.00) |
1 (1.00) |
0.478 (1.00) |
0.0854 (1.00) |
|
| 20p gain | 31 (28%) | 81 |
0.889 (1.00) |
0.447 (1.00) |
1 (1.00) |
0.499 (1.00) |
0.992 (1.00) |
0.499 (1.00) |
|
| 20q gain | 39 (35%) | 73 |
0.301 (1.00) |
0.721 (1.00) |
0.831 (1.00) |
0.608 (1.00) |
0.989 (1.00) |
0.512 (1.00) |
|
| 21q gain | 11 (10%) | 101 |
0.672 (1.00) |
0.303 (1.00) |
0.315 (1.00) |
1 (1.00) |
0.917 (1.00) |
0.276 (1.00) |
|
| 22q gain | 24 (21%) | 88 |
0.199 (1.00) |
0.485 (1.00) |
0.808 (1.00) |
0.608 (1.00) |
0.303 (1.00) |
0.139 (1.00) |
|
| 1p loss | 8 (7%) | 104 |
0.948 (1.00) |
0.722 (1.00) |
0.254 (1.00) |
1 (1.00) |
0.689 (1.00) |
0.269 (1.00) |
|
| 2p loss | 12 (11%) | 100 |
0.822 (1.00) |
0.897 (1.00) |
1 (1.00) |
1 (1.00) |
0.997 (1.00) |
0.501 (1.00) |
|
| 2q loss | 11 (10%) | 101 |
0.608 (1.00) |
0.643 (1.00) |
0.315 (1.00) |
0.313 (1.00) |
0.974 (1.00) |
0.328 (1.00) |
|
| 3p loss | 5 (4%) | 107 |
0.775 (1.00) |
0.424 (1.00) |
0.647 (1.00) |
1 (1.00) |
0.971 (1.00) |
0.0424 (1.00) |
|
| 3q loss | 8 (7%) | 104 |
0.716 (1.00) |
0.422 (1.00) |
0.254 (1.00) |
1 (1.00) |
0.981 (1.00) |
0.0314 (1.00) |
|
| 4p loss | 9 (8%) | 103 |
0.782 (1.00) |
0.813 (1.00) |
0.457 (1.00) |
0.313 (1.00) |
0.691 (1.00) |
0.827 (1.00) |
|
| 4q loss | 10 (9%) | 102 |
0.912 (1.00) |
0.772 (1.00) |
0.281 (1.00) |
0.0174 (1.00) |
0.516 (1.00) |
0.708 (1.00) |
|
| 5p loss | 14 (12%) | 98 |
0.302 (1.00) |
0.177 (1.00) |
0.128 (1.00) |
1 (1.00) |
0.88 (1.00) |
0.647 (1.00) |
|
| 5q loss | 24 (21%) | 88 |
0.593 (1.00) |
0.955 (1.00) |
0.224 (1.00) |
0.628 (1.00) |
0.727 (1.00) |
0.882 (1.00) |
|
| 6p loss | 9 (8%) | 103 |
0.243 (1.00) |
0.0178 (1.00) |
1 (1.00) |
1 (1.00) |
0.294 (1.00) |
0.749 (1.00) |
|
| 6q loss | 40 (36%) | 72 |
0.961 (1.00) |
0.0106 (1.00) |
0.531 (1.00) |
0.243 (1.00) |
0.323 (1.00) |
0.195 (1.00) |
|
| 8p loss | 14 (12%) | 98 |
0.976 (1.00) |
0.521 (1.00) |
0.761 (1.00) |
0.371 (1.00) |
0.798 (1.00) |
0.586 (1.00) |
|
| 8q loss | 3 (3%) | 109 |
0.0353 (1.00) |
0.23 (1.00) |
1 (1.00) |
0.989 (1.00) |
0.756 (1.00) |
||
| 9p loss | 57 (51%) | 55 |
0.119 (1.00) |
0.935 (1.00) |
0.839 (1.00) |
0.495 (1.00) |
0.351 (1.00) |
0.167 (1.00) |
|
| 9q loss | 42 (38%) | 70 |
0.153 (1.00) |
0.0222 (1.00) |
0.293 (1.00) |
0.0809 (1.00) |
0.659 (1.00) |
0.133 (1.00) |
|
| 10p loss | 45 (40%) | 67 |
0.0595 (1.00) |
0.504 (1.00) |
0.0215 (1.00) |
0.831 (1.00) |
0.585 (1.00) |
0.636 (1.00) |
|
| 10q loss | 49 (44%) | 63 |
0.0992 (1.00) |
0.0561 (1.00) |
0.153 (1.00) |
0.13 (1.00) |
0.778 (1.00) |
0.552 (1.00) |
|
| 11p loss | 26 (23%) | 86 |
0.877 (1.00) |
0.222 (1.00) |
1 (1.00) |
0.415 (1.00) |
0.183 (1.00) |
0.143 (1.00) |
|
| 11q loss | 30 (27%) | 82 |
0.467 (1.00) |
0.779 (1.00) |
0.82 (1.00) |
0.466 (1.00) |
0.0694 (1.00) |
0.131 (1.00) |
|
| 12p loss | 5 (4%) | 107 |
0.838 (1.00) |
0.637 (1.00) |
0.647 (1.00) |
0.0979 (1.00) |
0.00969 (1.00) |
0.344 (1.00) |
|
| 12q loss | 8 (7%) | 104 |
0.894 (1.00) |
0.407 (1.00) |
0.105 (1.00) |
0.137 (1.00) |
0.0853 (1.00) |
0.831 (1.00) |
|
| 13q loss | 17 (15%) | 95 |
0.915 (1.00) |
0.709 (1.00) |
1 (1.00) |
0.00498 (1.00) |
0.376 (1.00) |
0.17 (1.00) |
|
| 14q loss | 25 (22%) | 87 |
0.757 (1.00) |
0.86 (1.00) |
1 (1.00) |
0.45 (1.00) |
0.675 (1.00) |
0.486 (1.00) |
|
| 15q loss | 7 (6%) | 105 |
0.238 (1.00) |
0.344 (1.00) |
0.676 (1.00) |
0.218 (1.00) |
0.534 (1.00) |
0.176 (1.00) |
|
| 16p loss | 8 (7%) | 104 |
0.152 (1.00) |
0.994 (1.00) |
0.703 (1.00) |
1 (1.00) |
0.885 (1.00) |
0.043 (1.00) |
|
| 16q loss | 16 (14%) | 96 |
0.103 (1.00) |
0.216 (1.00) |
1 (1.00) |
0.476 (1.00) |
0.807 (1.00) |
0.0989 (1.00) |
|
| 17p loss | 28 (25%) | 84 |
0.406 (1.00) |
0.0765 (1.00) |
1 (1.00) |
0.302 (1.00) |
0.46 (1.00) |
0.829 (1.00) |
|
| 17q loss | 13 (12%) | 99 |
0.854 (1.00) |
0.759 (1.00) |
0.54 (1.00) |
0.233 (1.00) |
0.0287 (1.00) |
0.692 (1.00) |
|
| 18p loss | 18 (16%) | 94 |
0.692 (1.00) |
0.58 (1.00) |
0.0246 (1.00) |
1 (1.00) |
0.203 (1.00) |
0.718 (1.00) |
|
| 18q loss | 18 (16%) | 94 |
0.478 (1.00) |
0.886 (1.00) |
0.0934 (1.00) |
0.546 (1.00) |
0.365 (1.00) |
0.627 (1.00) |
|
| 19p loss | 12 (11%) | 100 |
0.833 (1.00) |
0.225 (1.00) |
0.00851 (1.00) |
0.067 (1.00) |
0.0717 (1.00) |
0.0267 (1.00) |
|
| 19q loss | 12 (11%) | 100 |
0.532 (1.00) |
0.13 (1.00) |
0.187 (1.00) |
0.047 (1.00) |
0.0909 (1.00) |
0.0317 (1.00) |
|
| 20p loss | 3 (3%) | 109 |
0.166 (1.00) |
0.318 (1.00) |
0.23 (1.00) |
1 (1.00) |
0.576 (1.00) |
0.437 (1.00) |
|
| 21q loss | 15 (13%) | 97 |
0.917 (1.00) |
0.714 (1.00) |
1 (1.00) |
1 (1.00) |
0.75 (1.00) |
0.0496 (1.00) |
|
| 22q loss | 7 (6%) | 105 |
0.587 (1.00) |
0.262 (1.00) |
1 (1.00) |
0.251 (1.00) |
0.989 (1.00) |
0.633 (1.00) |
|
| Xq loss | 3 (3%) | 109 |
0.361 (1.00) |
0.0287 (1.00) |
1 (1.00) |
0.989 (1.00) |
0.862 (1.00) |
P value = 0.000517 (Chi-square test), Q value = 0.22
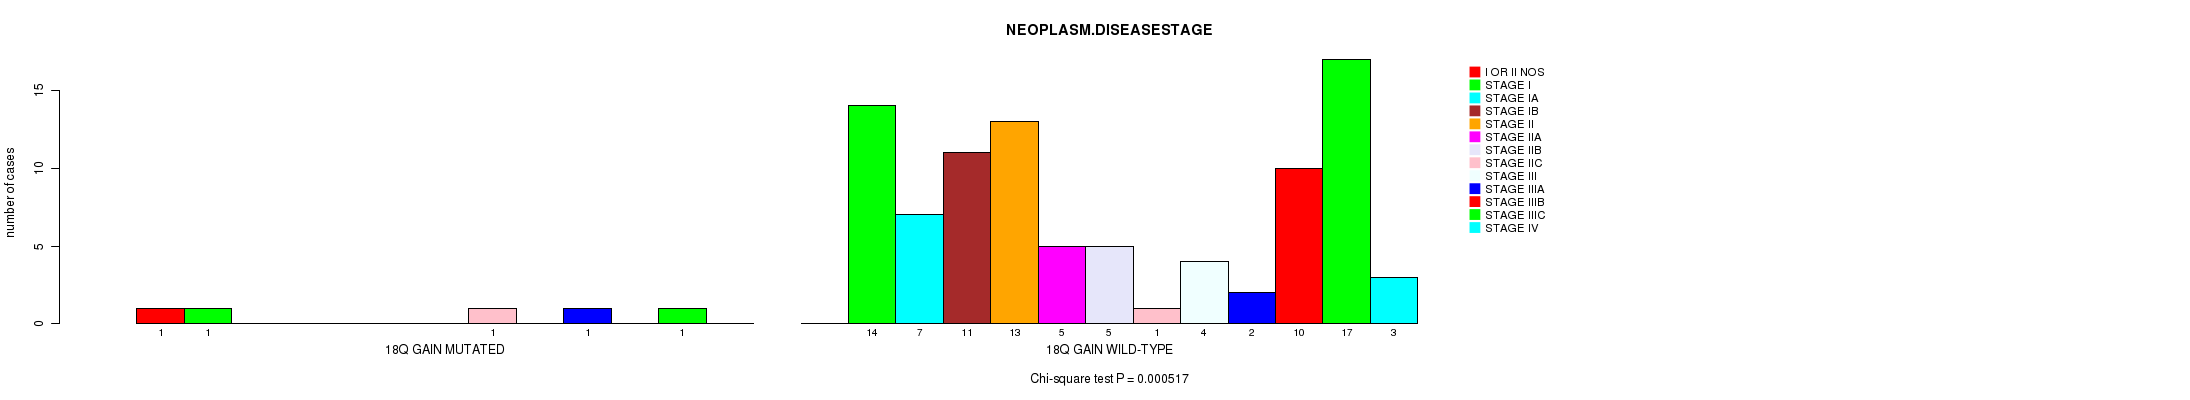
Table S1. Gene #30: '18q gain mutation analysis' versus Clinical Feature #7: 'NEOPLASM.DISEASESTAGE'
| nPatients | I OR II NOS | STAGE I | STAGE IA | STAGE IB | STAGE II | STAGE IIA | STAGE IIB | STAGE IIC | STAGE III | STAGE IIIA | STAGE IIIB | STAGE IIIC | STAGE IV |
|---|---|---|---|---|---|---|---|---|---|---|---|---|---|
| ALL | 1 | 15 | 7 | 11 | 13 | 5 | 5 | 2 | 4 | 3 | 10 | 18 | 3 |
| 18Q GAIN MUTATED | 1 | 1 | 0 | 0 | 0 | 0 | 0 | 1 | 0 | 1 | 0 | 1 | 0 |
| 18Q GAIN WILD-TYPE | 0 | 14 | 7 | 11 | 13 | 5 | 5 | 1 | 4 | 2 | 10 | 17 | 3 |
Figure S1. Get High-res Image Gene #30: '18q gain mutation analysis' versus Clinical Feature #7: 'NEOPLASM.DISEASESTAGE'
-
Mutation data file = broad_values_by_arm.mutsig.cluster.txt
-
Clinical data file = SKCM-Regional_LN.clin.merged.picked.txt
-
Number of patients = 112
-
Number of significantly arm-level cnvs = 72
-
Number of selected clinical features = 7
-
Exclude genes that fewer than K tumors have mutations, K = 3
For survival clinical features, the Kaplan-Meier survival curves of tumors with and without gene mutations were plotted and the statistical significance P values were estimated by logrank test (Bland and Altman 2004) using the 'survdiff' function in R
For continuous numerical clinical features, two-tailed Student's t test with unequal variance (Lehmann and Romano 2005) was applied to compare the clinical values between tumors with and without gene mutations using 't.test' function in R
For binary or multi-class clinical features (nominal or ordinal), two-tailed Fisher's exact tests (Fisher 1922) were used to estimate the P values using the 'fisher.test' function in R
For multi-class clinical features (nominal or ordinal), Chi-square tests (Greenwood and Nikulin 1996) were used to estimate the P values using the 'chisq.test' function in R
For multiple hypothesis correction, Q value is the False Discovery Rate (FDR) analogue of the P value (Benjamini and Hochberg 1995), defined as the minimum FDR at which the test may be called significant. We used the 'Benjamini and Hochberg' method of 'p.adjust' function in R to convert P values into Q values.
This is an experimental feature. The full results of the analysis summarized in this report can be downloaded from the TCGA Data Coordination Center.