(Regional_LN cohort)
This pipeline uses various statistical tests to identify mRNAs whose expression levels correlated to selected clinical features.
Testing the association between 18122 genes and 6 clinical features across 112 samples, statistically thresholded by Q value < 0.05, 6 clinical features related to at least one genes.
-
8 genes correlated to 'Time to Death'.
-
PRKAR2B|5577 , NUDT7|283927 , ATP8B4|79895 , RBM14|10432 , CASC4|113201 , ...
-
10 genes correlated to 'AGE'.
-
MICALL2|79778 , ACOX2|8309 , TCEAL5|340543 , ETFB|2109 , C4ORF46|201725 , ...
-
16 genes correlated to 'GENDER'.
-
ZFY|7544 , PRKY|5616 , CYORF15B|84663 , XIST|7503 , RPS4Y1|6192 , ...
-
1 gene correlated to 'DISTANT.METASTASIS'.
-
TMEM147|10430
-
2 genes correlated to 'LYMPH.NODE.METASTASIS'.
-
AMY1A|276 , PPAN-P2RY11|692312
-
1 gene correlated to 'NEOPLASM.DISEASESTAGE'.
-
SRRM4|84530
Complete statistical result table is provided in Supplement Table 1
Table 1. Get Full Table This table shows the clinical features, statistical methods used, and the number of genes that are significantly associated with each clinical feature at Q value < 0.05.
| Clinical feature | Statistical test | Significant genes | Associated with | Associated with | ||
|---|---|---|---|---|---|---|
| Time to Death | Cox regression test | N=8 | shorter survival | N=1 | longer survival | N=7 |
| AGE | Spearman correlation test | N=10 | older | N=4 | younger | N=6 |
| GENDER | t test | N=16 | male | N=11 | female | N=5 |
| DISTANT METASTASIS | ANOVA test | N=1 | ||||
| LYMPH NODE METASTASIS | ANOVA test | N=2 | ||||
| NEOPLASM DISEASESTAGE | ANOVA test | N=1 |
Table S1. Basic characteristics of clinical feature: 'Time to Death'
| Time to Death | Duration (Months) | 2.6-346 (median=47.3) |
| censored | N = 55 | |
| death | N = 55 | |
| Significant markers | N = 8 | |
| associated with shorter survival | 1 | |
| associated with longer survival | 7 |
Table S2. Get Full Table List of 8 genes significantly associated with 'Time to Death' by Cox regression test
| HazardRatio | Wald_P | Q | C_index | |
|---|---|---|---|---|
| PRKAR2B|5577 | 0.6 | 6.113e-08 | 0.0011 | 0.312 |
| NUDT7|283927 | 0.66 | 1.981e-07 | 0.0036 | 0.349 |
| ATP8B4|79895 | 0.62 | 5.392e-07 | 0.0098 | 0.328 |
| RBM14|10432 | 5.3 | 8.553e-07 | 0.015 | 0.683 |
| CASC4|113201 | 0.48 | 9.414e-07 | 0.017 | 0.35 |
| PLEKHA3|65977 | 0.4 | 1.125e-06 | 0.02 | 0.353 |
| TLR1|7096 | 0.59 | 1.447e-06 | 0.026 | 0.308 |
| PION|54103 | 0.67 | 1.969e-06 | 0.036 | 0.344 |
Figure S1. Get High-res Image As an example, this figure shows the association of PRKAR2B|5577 to 'Time to Death'. four curves present the cumulative survival rates of 4 quartile subsets of patients. P value = 6.11e-08 with univariate Cox regression analysis using continuous log-2 expression values.
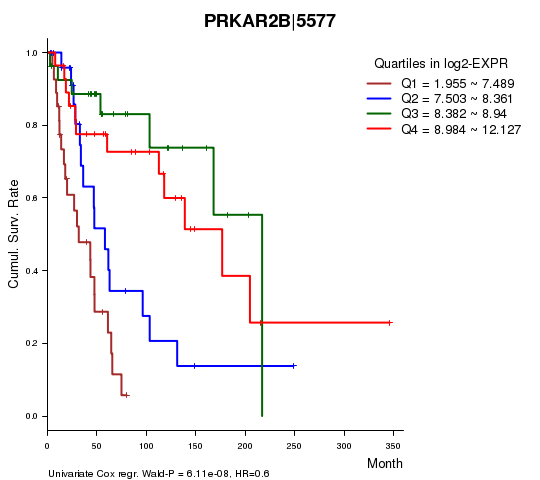
Table S3. Basic characteristics of clinical feature: 'AGE'
| AGE | Mean (SD) | 55.44 (16) |
| Significant markers | N = 10 | |
| pos. correlated | 4 | |
| neg. correlated | 6 |
Table S4. Get Full Table List of 10 genes significantly correlated to 'AGE' by Spearman correlation test
| SpearmanCorr | corrP | Q | |
|---|---|---|---|
| MICALL2|79778 | -0.5099 | 9.302e-09 | 0.000169 |
| ACOX2|8309 | -0.4847 | 6.137e-08 | 0.00111 |
| TCEAL5|340543 | -0.4548 | 4.7e-07 | 0.00852 |
| ETFB|2109 | -0.4529 | 5.331e-07 | 0.00966 |
| C4ORF46|201725 | 0.4397 | 1.233e-06 | 0.0223 |
| ZBED4|9889 | 0.4349 | 1.65e-06 | 0.0299 |
| CDHR3|222256 | 0.4331 | 1.849e-06 | 0.0335 |
| MGST2|4258 | -0.4323 | 1.936e-06 | 0.0351 |
| CHUK|1147 | 0.4311 | 2.088e-06 | 0.0378 |
| COX7A1|1346 | -0.4273 | 2.623e-06 | 0.0475 |
Figure S2. Get High-res Image As an example, this figure shows the association of MICALL2|79778 to 'AGE'. P value = 9.3e-09 with Spearman correlation analysis. The straight line presents the best linear regression.

Table S5. Basic characteristics of clinical feature: 'GENDER'
| GENDER | Labels | N |
| FEMALE | 35 | |
| MALE | 77 | |
| Significant markers | N = 16 | |
| Higher in MALE | 11 | |
| Higher in FEMALE | 5 |
Table S6. Get Full Table List of top 10 genes differentially expressed by 'GENDER'
| T(pos if higher in 'MALE') | ttestP | Q | AUC | |
|---|---|---|---|---|
| ZFY|7544 | 25.17 | 1.487e-42 | 2.69e-38 | 0.9903 |
| PRKY|5616 | 20.74 | 5.42e-30 | 9.82e-26 | 0.9935 |
| CYORF15B|84663 | 31.14 | 9.066e-30 | 1.64e-25 | 1 |
| XIST|7503 | -16.28 | 6.09e-29 | 1.1e-24 | 0.9691 |
| RPS4Y1|6192 | 25.58 | 1.253e-26 | 2.27e-22 | 1 |
| DDX3Y|8653 | 24 | 2.832e-18 | 5.13e-14 | 0.9981 |
| TSIX|9383 | -11.42 | 1.317e-17 | 2.38e-13 | 0.9673 |
| NLGN4Y|22829 | 11.27 | 2.281e-14 | 4.13e-10 | 0.9633 |
| TTTY15|64595 | 18.09 | 1.57e-13 | 2.84e-09 | 0.9833 |
| KDM5D|8284 | 18.95 | 1.348e-11 | 2.44e-07 | 0.9909 |
Figure S3. Get High-res Image As an example, this figure shows the association of ZFY|7544 to 'GENDER'. P value = 1.49e-42 with T-test analysis.
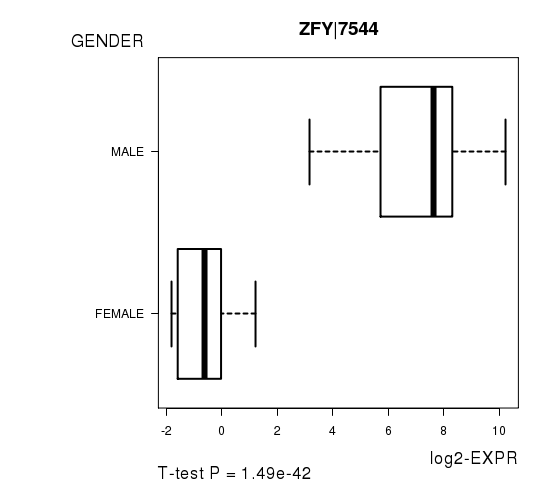
Table S7. Basic characteristics of clinical feature: 'DISTANT.METASTASIS'
| DISTANT.METASTASIS | Labels | N |
| M0 | 98 | |
| M1 | 1 | |
| M1B | 2 | |
| M1C | 1 | |
| Significant markers | N = 1 |
Table S8. Get Full Table List of one gene differentially expressed by 'DISTANT.METASTASIS'
| ANOVA_P | Q | |
|---|---|---|
| TMEM147|10430 | 2.733e-06 | 0.0493 |
Figure S4. Get High-res Image As an example, this figure shows the association of TMEM147|10430 to 'DISTANT.METASTASIS'. P value = 2.73e-06 with ANOVA analysis.
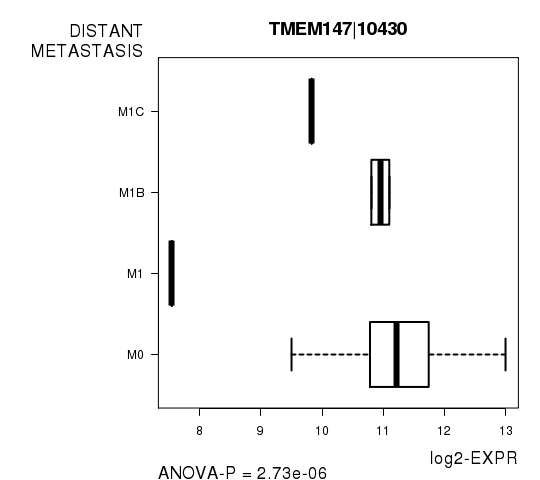
Table S9. Basic characteristics of clinical feature: 'LYMPH.NODE.METASTASIS'
| LYMPH.NODE.METASTASIS | Labels | N |
| N0 | 61 | |
| N1 | 1 | |
| N1A | 3 | |
| N1B | 10 | |
| N2 | 1 | |
| N2A | 3 | |
| N2B | 8 | |
| N2C | 1 | |
| N3 | 13 | |
| NX | 2 | |
| Significant markers | N = 2 |
Table S10. Get Full Table List of 2 genes differentially expressed by 'LYMPH.NODE.METASTASIS'
| ANOVA_P | Q | |
|---|---|---|
| AMY1A|276 | 3.587e-07 | 0.0065 |
| PPAN-P2RY11|692312 | 4.781e-07 | 0.00866 |
Figure S5. Get High-res Image As an example, this figure shows the association of AMY1A|276 to 'LYMPH.NODE.METASTASIS'. P value = 3.59e-07 with ANOVA analysis.
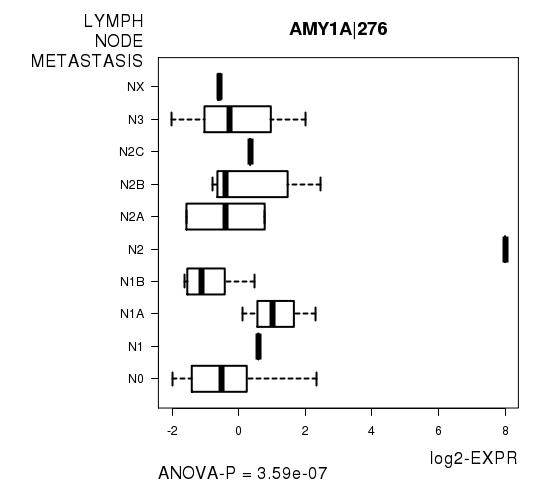
Table S11. Basic characteristics of clinical feature: 'NEOPLASM.DISEASESTAGE'
| NEOPLASM.DISEASESTAGE | Labels | N |
| I OR II NOS | 1 | |
| STAGE I | 15 | |
| STAGE IA | 7 | |
| STAGE IB | 11 | |
| STAGE II | 13 | |
| STAGE IIA | 5 | |
| STAGE IIB | 5 | |
| STAGE IIC | 2 | |
| STAGE III | 4 | |
| STAGE IIIA | 3 | |
| STAGE IIIB | 10 | |
| STAGE IIIC | 18 | |
| STAGE IV | 3 | |
| Significant markers | N = 1 |
Table S12. Get Full Table List of one gene differentially expressed by 'NEOPLASM.DISEASESTAGE'
| ANOVA_P | Q | |
|---|---|---|
| SRRM4|84530 | 3.58e-07 | 0.00649 |
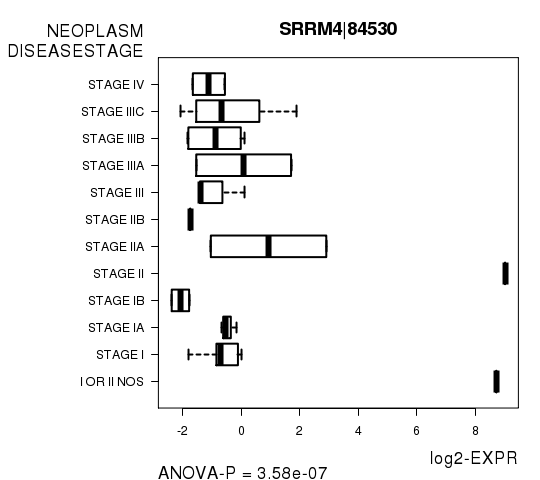
Figure S6. Get High-res Image As an example, this figure shows the association of SRRM4|84530 to 'NEOPLASM.DISEASESTAGE'. P value = 3.58e-07 with ANOVA analysis.
-
Expresson data file = SKCM-Regional_LN.uncv2.mRNAseq_RSEM_normalized_log2.txt
-
Clinical data file = SKCM-Regional_LN.clin.merged.picked.txt
-
Number of patients = 112
-
Number of genes = 18122
-
Number of clinical features = 6
For survival clinical features, Wald's test in univariate Cox regression analysis with proportional hazards model (Andersen and Gill 1982) was used to estimate the P values using the 'coxph' function in R. Kaplan-Meier survival curves were plot using the four quartile subgroups of patients based on expression levels
For continuous numerical clinical features, Spearman's rank correlation coefficients (Spearman 1904) and two-tailed P values were estimated using 'cor.test' function in R
For two-class clinical features, two-tailed Student's t test with unequal variance (Lehmann and Romano 2005) was applied to compare the log2-expression levels between the two clinical classes using 't.test' function in R
For multi-class clinical features (ordinal or nominal), one-way analysis of variance (Howell 2002) was applied to compare the log2-expression levels between different clinical classes using 'anova' function in R
For multiple hypothesis correction, Q value is the False Discovery Rate (FDR) analogue of the P value (Benjamini and Hochberg 1995), defined as the minimum FDR at which the test may be called significant. We used the 'Benjamini and Hochberg' method of 'p.adjust' function in R to convert P values into Q values.
This is an experimental feature. The full results of the analysis summarized in this report can be downloaded from the TCGA Data Coordination Center.