(Regional_LN cohort)
This pipeline uses various statistical tests to identify genes whose promoter methylation levels correlated to selected clinical features.
Testing the association between 17153 genes and 6 clinical features across 109 samples, statistically thresholded by Q value < 0.05, 5 clinical features related to at least one genes.
-
6 genes correlated to 'AGE'.
-
BBX , ICA1L , KLK4 , EPN3 , GPR63 , ...
-
1 gene correlated to 'GENDER'.
-
UTP14C
-
273 genes correlated to 'DISTANT.METASTASIS'.
-
CCNG1 , THAP2 , ZFC3H1 , C9ORF140 , FLJ12825 , ...
-
56 genes correlated to 'LYMPH.NODE.METASTASIS'.
-
CCDC25 , NOS1AP , MBIP , NGLY1 , NHEDC1 , ...
-
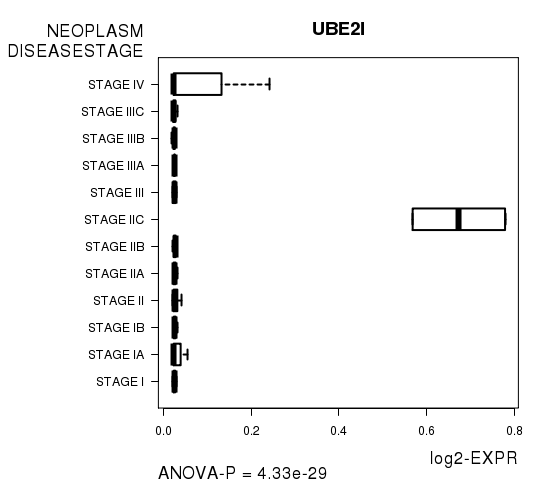
31 genes correlated to 'NEOPLASM.DISEASESTAGE'.
-
UBE2I , PPP1R9B , ZBTB37 , TUG1 , MRPL11 , ...
-
No genes correlated to 'Time to Death'
Complete statistical result table is provided in Supplement Table 1
Table 1. Get Full Table This table shows the clinical features, statistical methods used, and the number of genes that are significantly associated with each clinical feature at Q value < 0.05.
| Clinical feature | Statistical test | Significant genes | Associated with | Associated with | ||
|---|---|---|---|---|---|---|
| Time to Death | Cox regression test | N=0 | ||||
| AGE | Spearman correlation test | N=6 | older | N=6 | younger | N=0 |
| GENDER | t test | N=1 | male | N=1 | female | N=0 |
| DISTANT METASTASIS | ANOVA test | N=273 | ||||
| LYMPH NODE METASTASIS | ANOVA test | N=56 | ||||
| NEOPLASM DISEASESTAGE | ANOVA test | N=31 |
Table S1. Basic characteristics of clinical feature: 'Time to Death'
| Time to Death | Duration (Months) | 1-84.7 (median=12.1) |
| censored | N = 26 | |
| death | N = 30 | |
| Significant markers | N = 0 |
Table S2. Basic characteristics of clinical feature: 'AGE'
| AGE | Mean (SD) | 55.3 (16) |
| Significant markers | N = 6 | |
| pos. correlated | 6 | |
| neg. correlated | 0 |
Table S3. Get Full Table List of 6 genes significantly correlated to 'AGE' by Spearman correlation test
| SpearmanCorr | corrP | Q | |
|---|---|---|---|
| BBX | 0.4451 | 1.239e-06 | 0.0213 |
| ICA1L | 0.4433 | 1.38e-06 | 0.0237 |
| KLK4 | 0.4432 | 1.395e-06 | 0.0239 |
| EPN3 | 0.4373 | 1.992e-06 | 0.0342 |
| GPR63 | 0.434 | 2.42e-06 | 0.0415 |
| LOXL4 | 0.431 | 2.894e-06 | 0.0496 |
Figure S1. Get High-res Image As an example, this figure shows the association of BBX to 'AGE'. P value = 1.24e-06 with Spearman correlation analysis. The straight line presents the best linear regression.

Table S4. Basic characteristics of clinical feature: 'GENDER'
| GENDER | Labels | N |
| FEMALE | 33 | |
| MALE | 76 | |
| Significant markers | N = 1 | |
| Higher in MALE | 1 | |
| Higher in FEMALE | 0 |
Table S5. Get Full Table List of one gene differentially expressed by 'GENDER'
| T(pos if higher in 'MALE') | ttestP | Q | AUC | |
|---|---|---|---|---|
| UTP14C | 8.48 | 3.531e-10 | 6.06e-06 | 0.9418 |
Figure S2. Get High-res Image As an example, this figure shows the association of UTP14C to 'GENDER'. P value = 3.53e-10 with T-test analysis.

Table S6. Basic characteristics of clinical feature: 'DISTANT.METASTASIS'
| DISTANT.METASTASIS | Labels | N |
| M0 | 95 | |
| M1 | 1 | |
| M1B | 2 | |
| M1C | 1 | |
| Significant markers | N = 273 |
Table S7. Get Full Table List of top 10 genes differentially expressed by 'DISTANT.METASTASIS'
| ANOVA_P | Q | |
|---|---|---|
| CCNG1 | 5.585e-110 | 9.58e-106 |
| THAP2 | 6.432e-33 | 1.1e-28 |
| ZFC3H1 | 6.432e-33 | 1.1e-28 |
| C9ORF140 | 1.074e-29 | 1.84e-25 |
| FLJ12825 | 7.254e-21 | 1.24e-16 |
| FAM65C | 2.924e-19 | 5.01e-15 |
| EDEM3 | 3.461e-18 | 5.93e-14 |
| IFT57 | 1.301e-16 | 2.23e-12 |
| CCDC41 | 7.257e-16 | 1.24e-11 |
| CASC5 | 1.152e-15 | 1.98e-11 |
Figure S3. Get High-res Image As an example, this figure shows the association of CCNG1 to 'DISTANT.METASTASIS'. P value = 5.58e-110 with ANOVA analysis.
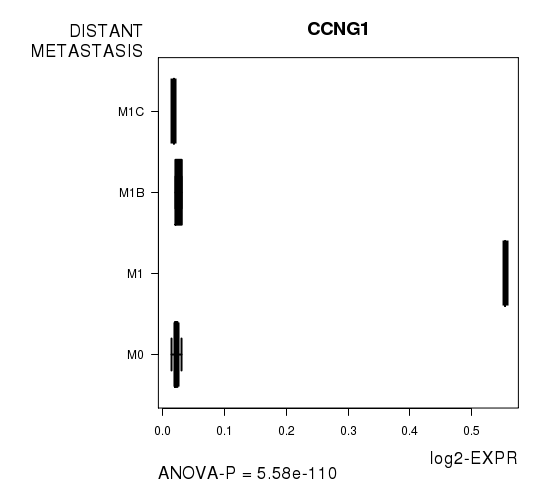
Table S8. Basic characteristics of clinical feature: 'LYMPH.NODE.METASTASIS'
| LYMPH.NODE.METASTASIS | Labels | N |
| N0 | 59 | |
| N1 | 1 | |
| N1A | 3 | |
| N1B | 10 | |
| N2 | 1 | |
| N2A | 3 | |
| N2B | 8 | |
| N2C | 1 | |
| N3 | 12 | |
| NX | 2 | |
| Significant markers | N = 56 |
Table S9. Get Full Table List of top 10 genes differentially expressed by 'LYMPH.NODE.METASTASIS'
| ANOVA_P | Q | |
|---|---|---|
| CCDC25 | 6.731e-112 | 1.15e-107 |
| NOS1AP | 2.584e-58 | 4.43e-54 |
| MBIP | 6.27e-55 | 1.08e-50 |
| NGLY1 | 3.85e-46 | 6.6e-42 |
| NHEDC1 | 1.383e-33 | 2.37e-29 |
| TMEM184B | 9.324e-30 | 1.6e-25 |
| RNF220 | 1.664e-29 | 2.85e-25 |
| C6ORF162 | 5.369e-29 | 9.21e-25 |
| DYNC1I2 | 1.523e-28 | 2.61e-24 |
| C17ORF63 | 1.724e-19 | 2.96e-15 |
Figure S4. Get High-res Image As an example, this figure shows the association of CCDC25 to 'LYMPH.NODE.METASTASIS'. P value = 6.73e-112 with ANOVA analysis.
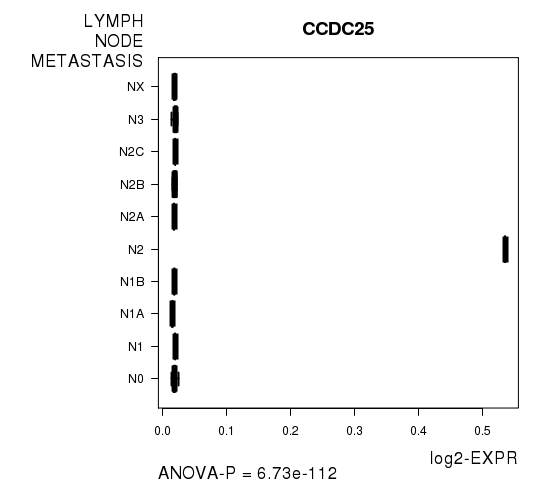
Table S10. Basic characteristics of clinical feature: 'NEOPLASM.DISEASESTAGE'
| NEOPLASM.DISEASESTAGE | Labels | N |
| STAGE I | 15 | |
| STAGE IA | 7 | |
| STAGE IB | 10 | |
| STAGE II | 13 | |
| STAGE IIA | 5 | |
| STAGE IIB | 5 | |
| STAGE IIC | 2 | |
| STAGE III | 4 | |
| STAGE IIIA | 3 | |
| STAGE IIIB | 10 | |
| STAGE IIIC | 17 | |
| STAGE IV | 3 | |
| Significant markers | N = 31 |
Table S11. Get Full Table List of top 10 genes differentially expressed by 'NEOPLASM.DISEASESTAGE'
| ANOVA_P | Q | |
|---|---|---|
| UBE2I | 4.333e-29 | 7.43e-25 |
| PPP1R9B | 3.089e-21 | 5.3e-17 |
| ZBTB37 | 1.011e-13 | 1.73e-09 |
| TUG1 | 2.866e-10 | 4.91e-06 |
| MRPL11 | 8.362e-10 | 1.43e-05 |
| PLXDC2 | 1.163e-08 | 0.000199 |
| TLL2 | 5.08e-08 | 0.000871 |
| GRAMD1A | 6.037e-08 | 0.00104 |
| TMC7 | 7.809e-08 | 0.00134 |
| DNAH3 | 1.169e-07 | 0.002 |
Figure S5. Get High-res Image As an example, this figure shows the association of UBE2I to 'NEOPLASM.DISEASESTAGE'. P value = 4.33e-29 with ANOVA analysis.
-
Expresson data file = SKCM-Regional_LN.meth.for_correlation.filtered_data.txt
-
Clinical data file = SKCM-Regional_LN.clin.merged.picked.txt
-
Number of patients = 109
-
Number of genes = 17153
-
Number of clinical features = 6
For survival clinical features, Wald's test in univariate Cox regression analysis with proportional hazards model (Andersen and Gill 1982) was used to estimate the P values using the 'coxph' function in R. Kaplan-Meier survival curves were plot using the four quartile subgroups of patients based on expression levels
For continuous numerical clinical features, Spearman's rank correlation coefficients (Spearman 1904) and two-tailed P values were estimated using 'cor.test' function in R
For two-class clinical features, two-tailed Student's t test with unequal variance (Lehmann and Romano 2005) was applied to compare the log2-expression levels between the two clinical classes using 't.test' function in R
For multi-class clinical features (ordinal or nominal), one-way analysis of variance (Howell 2002) was applied to compare the log2-expression levels between different clinical classes using 'anova' function in R
For multiple hypothesis correction, Q value is the False Discovery Rate (FDR) analogue of the P value (Benjamini and Hochberg 1995), defined as the minimum FDR at which the test may be called significant. We used the 'Benjamini and Hochberg' method of 'p.adjust' function in R to convert P values into Q values.
This is an experimental feature. The full results of the analysis summarized in this report can be downloaded from the TCGA Data Coordination Center.