(Regional_LN cohort)
This pipeline computes the correlation between significant arm-level copy number variations (cnvs) and subtypes.
Testing the association between copy number variation 72 arm-level results and 8 molecular subtypes across 112 patients, 13 significant findings detected with Q value < 0.25.
-
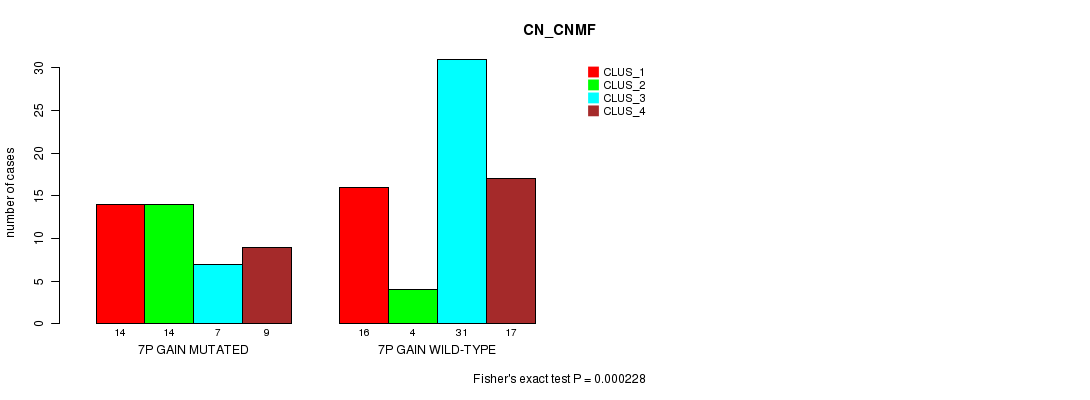
7p gain cnv correlated to 'CN_CNMF'.
-
7q gain cnv correlated to 'CN_CNMF'.
-
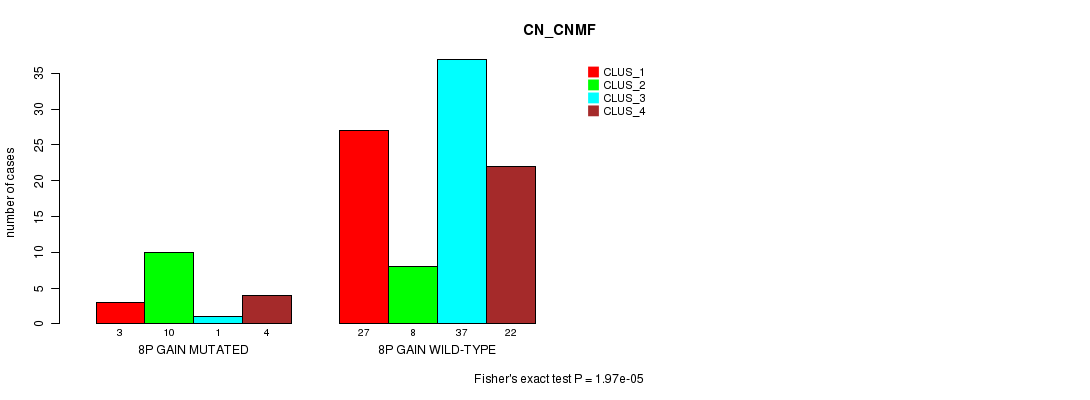
8p gain cnv correlated to 'CN_CNMF'.
-
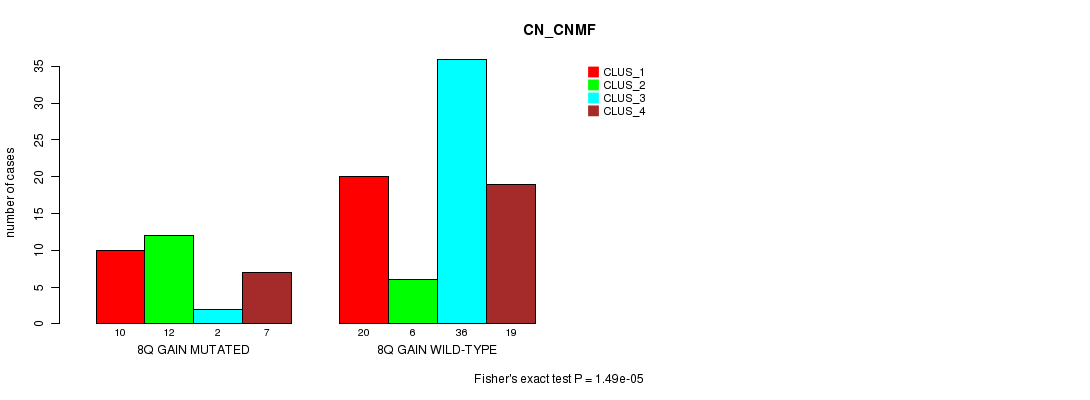
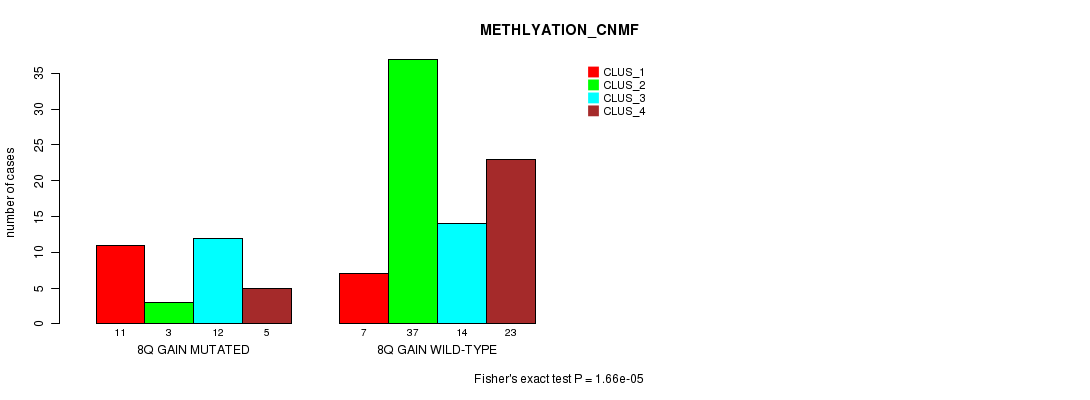
8q gain cnv correlated to 'CN_CNMF' and 'METHLYATION_CNMF'.
-
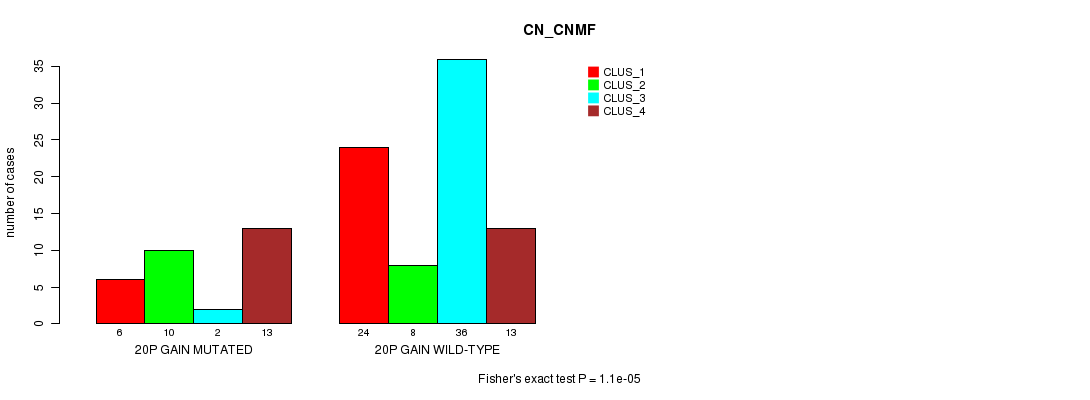
20p gain cnv correlated to 'CN_CNMF' and 'METHLYATION_CNMF'.
-
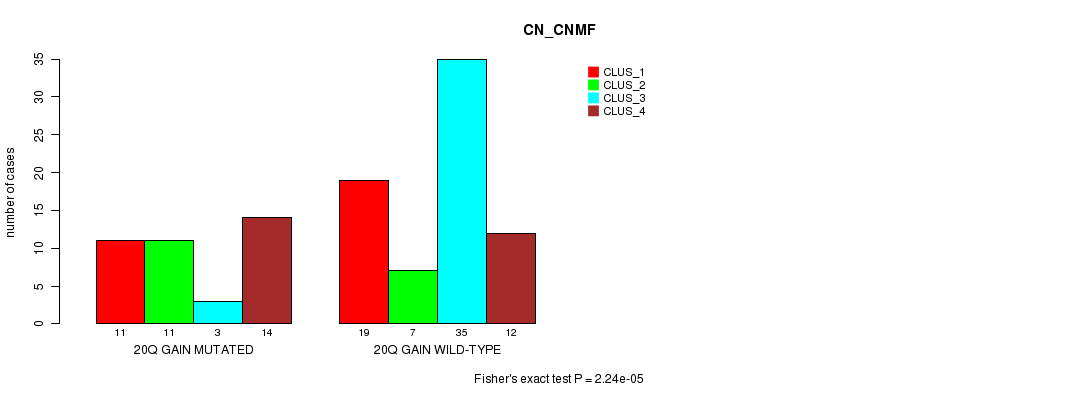
20q gain cnv correlated to 'CN_CNMF'.
-
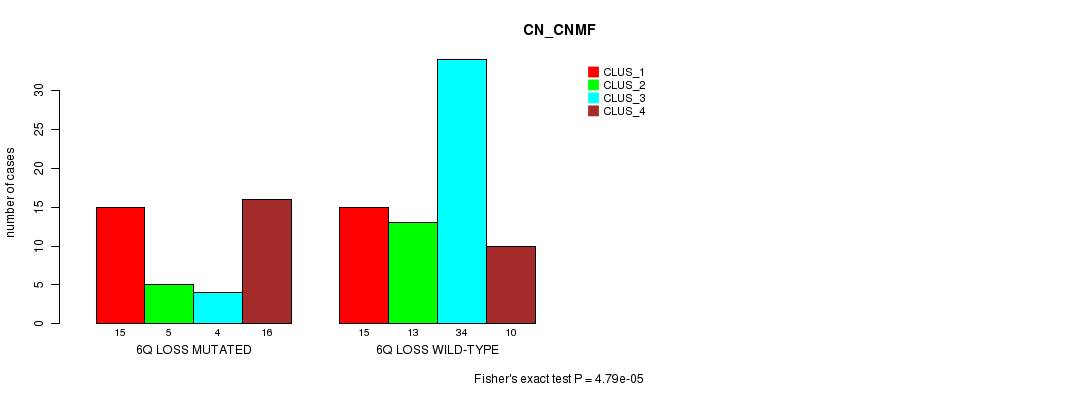
6q loss cnv correlated to 'CN_CNMF'.
-
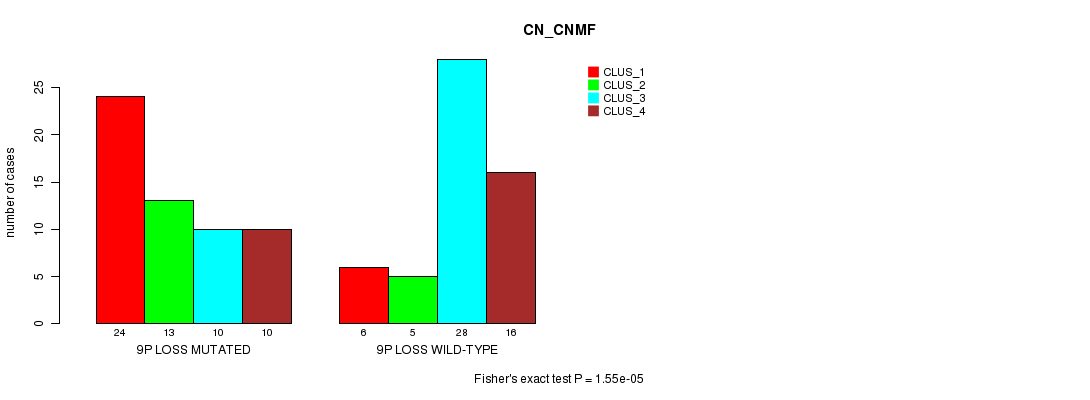
9p loss cnv correlated to 'CN_CNMF'.
-
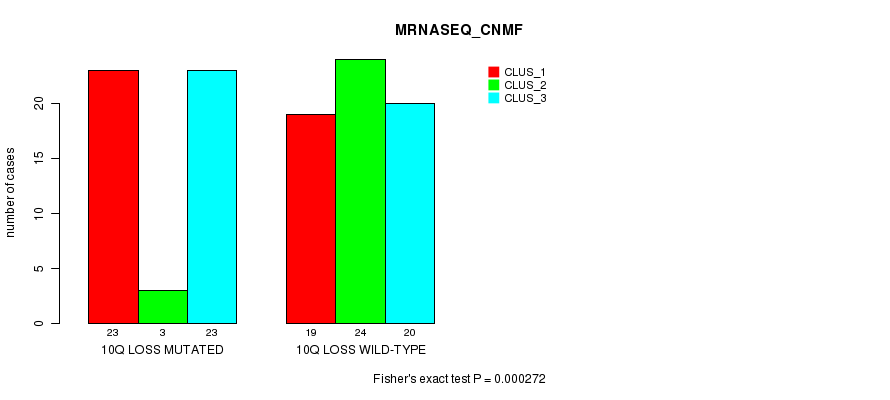
10q loss cnv correlated to 'MRNASEQ_CNMF'.
-
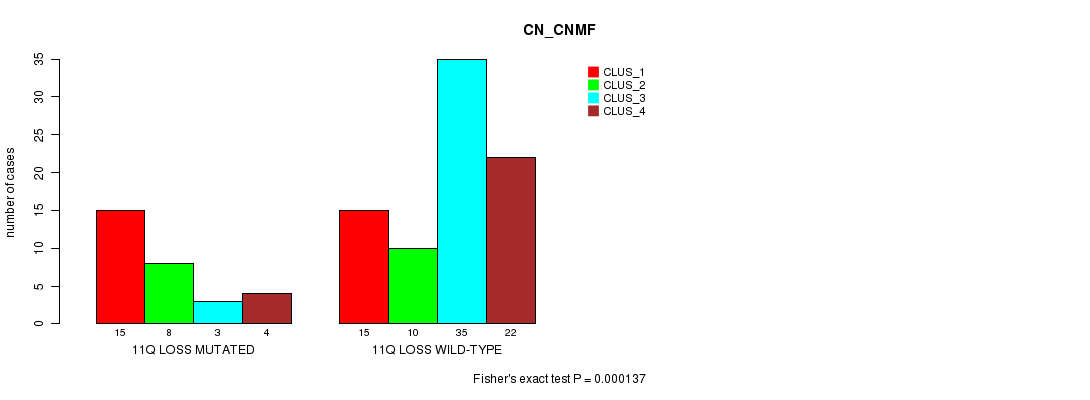
11q loss cnv correlated to 'CN_CNMF'.
-
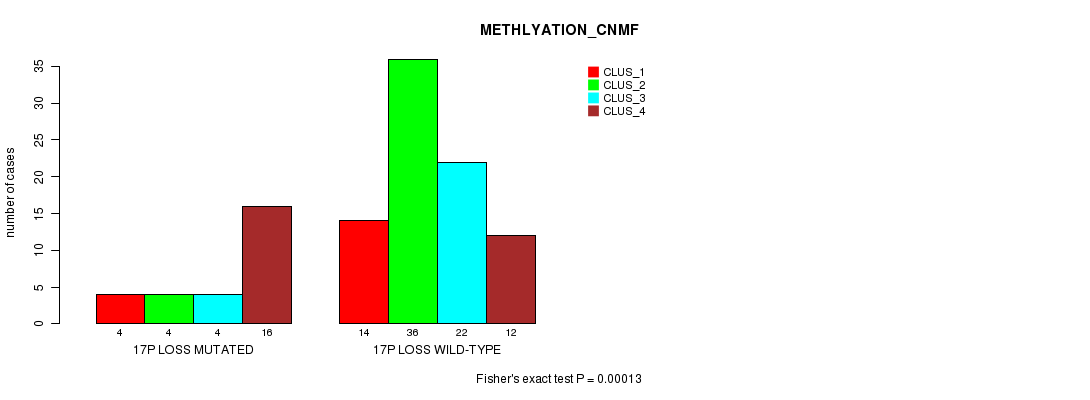
17p loss cnv correlated to 'METHLYATION_CNMF'.
Table 1. Get Full Table Overview of the association between significant copy number variation of 72 arm-level results and 8 molecular subtypes. Shown in the table are P values (Q values). Thresholded by Q value < 0.25, 13 significant findings detected.
|
Molecular subtypes |
CN CNMF |
METHLYATION CNMF |
RPPA CNMF |
RPPA CHIERARCHICAL |
MRNASEQ CNMF |
MRNASEQ CHIERARCHICAL |
MIRSEQ CNMF |
MIRSEQ CHIERARCHICAL |
||
| nCNV (%) | nWild-Type | Fisher's exact test | Fisher's exact test | Chi-square test | Fisher's exact test | Fisher's exact test | Fisher's exact test | Fisher's exact test | Fisher's exact test | |
| 8q gain | 31 (28%) | 81 |
1.49e-05 (0.00849) |
1.66e-05 (0.00944) |
0.499 (1.00) |
0.65 (1.00) |
0.000599 (0.334) |
0.0247 (1.00) |
0.856 (1.00) |
0.226 (1.00) |
| 20p gain | 31 (28%) | 81 |
1.1e-05 (0.00627) |
0.00034 (0.189) |
0.579 (1.00) |
0.953 (1.00) |
0.00392 (1.00) |
0.0253 (1.00) |
0.218 (1.00) |
0.802 (1.00) |
| 7p gain | 44 (39%) | 68 |
0.000228 (0.128) |
0.0217 (1.00) |
0.968 (1.00) |
0.465 (1.00) |
0.0259 (1.00) |
0.35 (1.00) |
0.212 (1.00) |
0.13 (1.00) |
| 7q gain | 44 (39%) | 68 |
0.000286 (0.16) |
0.00103 (0.567) |
0.873 (1.00) |
0.303 (1.00) |
0.0318 (1.00) |
0.0915 (1.00) |
0.0747 (1.00) |
0.0846 (1.00) |
| 8p gain | 18 (16%) | 94 |
1.97e-05 (0.0111) |
0.00284 (1.00) |
0.416 (1.00) |
0.297 (1.00) |
0.00611 (1.00) |
0.108 (1.00) |
0.635 (1.00) |
0.236 (1.00) |
| 20q gain | 39 (35%) | 73 |
2.24e-05 (0.0126) |
0.000691 (0.384) |
0.813 (1.00) |
0.614 (1.00) |
0.00529 (1.00) |
0.0612 (1.00) |
0.127 (1.00) |
0.604 (1.00) |
| 6q loss | 40 (36%) | 72 |
4.79e-05 (0.027) |
0.0166 (1.00) |
0.217 (1.00) |
0.652 (1.00) |
0.0359 (1.00) |
0.073 (1.00) |
0.0593 (1.00) |
0.13 (1.00) |
| 9p loss | 57 (51%) | 55 |
1.55e-05 (0.00878) |
0.000905 (0.5) |
0.614 (1.00) |
0.855 (1.00) |
0.00237 (1.00) |
0.167 (1.00) |
0.0306 (1.00) |
0.242 (1.00) |
| 10q loss | 49 (44%) | 63 |
0.0168 (1.00) |
0.0103 (1.00) |
0.242 (1.00) |
0.115 (1.00) |
0.000272 (0.153) |
0.00199 (1.00) |
0.0219 (1.00) |
0.163 (1.00) |
| 11q loss | 30 (27%) | 82 |
0.000137 (0.077) |
0.00276 (1.00) |
0.327 (1.00) |
0.576 (1.00) |
0.0111 (1.00) |
0.00709 (1.00) |
0.131 (1.00) |
0.134 (1.00) |
| 17p loss | 28 (25%) | 84 |
0.325 (1.00) |
0.00013 (0.0729) |
0.381 (1.00) |
0.746 (1.00) |
0.0622 (1.00) |
0.0279 (1.00) |
0.127 (1.00) |
0.209 (1.00) |
| 1p gain | 12 (11%) | 100 |
0.262 (1.00) |
0.00106 (0.583) |
0.307 (1.00) |
0.726 (1.00) |
0.143 (1.00) |
0.114 (1.00) |
0.182 (1.00) |
0.0935 (1.00) |
| 1q gain | 33 (29%) | 79 |
0.0179 (1.00) |
0.189 (1.00) |
0.547 (1.00) |
0.78 (1.00) |
0.0107 (1.00) |
0.0385 (1.00) |
0.223 (1.00) |
0.248 (1.00) |
| 2p gain | 10 (9%) | 102 |
0.424 (1.00) |
0.91 (1.00) |
0.156 (1.00) |
0.571 (1.00) |
0.408 (1.00) |
0.657 (1.00) |
0.82 (1.00) |
0.554 (1.00) |
| 2q gain | 9 (8%) | 103 |
0.719 (1.00) |
0.929 (1.00) |
0.156 (1.00) |
0.571 (1.00) |
0.621 (1.00) |
0.383 (1.00) |
0.899 (1.00) |
0.41 (1.00) |
| 3p gain | 7 (6%) | 105 |
0.00907 (1.00) |
0.0243 (1.00) |
0.589 (1.00) |
0.482 (1.00) |
0.256 (1.00) |
0.333 (1.00) |
1 (1.00) |
1 (1.00) |
| 3q gain | 8 (7%) | 104 |
0.0198 (1.00) |
0.158 (1.00) |
0.362 (1.00) |
0.188 (1.00) |
0.0665 (1.00) |
0.0177 (1.00) |
1 (1.00) |
0.864 (1.00) |
| 4p gain | 10 (9%) | 102 |
0.215 (1.00) |
0.00919 (1.00) |
0.705 (1.00) |
0.445 (1.00) |
0.636 (1.00) |
0.641 (1.00) |
0.0246 (1.00) |
0.5 (1.00) |
| 4q gain | 10 (9%) | 102 |
0.00335 (1.00) |
0.029 (1.00) |
0.552 (1.00) |
0.483 (1.00) |
0.408 (1.00) |
0.745 (1.00) |
0.0246 (1.00) |
0.5 (1.00) |
| 5p gain | 12 (11%) | 100 |
0.0314 (1.00) |
0.564 (1.00) |
0.703 (1.00) |
0.894 (1.00) |
0.246 (1.00) |
0.19 (1.00) |
0.197 (1.00) |
0.574 (1.00) |
| 5q gain | 5 (4%) | 107 |
0.127 (1.00) |
0.0994 (1.00) |
0.127 (1.00) |
0.561 (1.00) |
0.365 (1.00) |
0.429 (1.00) |
0.628 (1.00) |
1 (1.00) |
| 6p gain | 35 (31%) | 77 |
0.00182 (0.992) |
0.0254 (1.00) |
0.399 (1.00) |
0.814 (1.00) |
0.499 (1.00) |
0.404 (1.00) |
0.562 (1.00) |
0.0477 (1.00) |
| 6q gain | 8 (7%) | 104 |
0.594 (1.00) |
0.734 (1.00) |
0.75 (1.00) |
0.937 (1.00) |
0.215 (1.00) |
0.743 (1.00) |
0.318 (1.00) |
0.61 (1.00) |
| 9q gain | 4 (4%) | 108 |
0.695 (1.00) |
0.909 (1.00) |
0.203 (1.00) |
0.372 (1.00) |
0.0605 (1.00) |
0.0122 (1.00) |
0.0574 (1.00) |
0.387 (1.00) |
| 11p gain | 8 (7%) | 104 |
0.522 (1.00) |
0.0854 (1.00) |
0.459 (1.00) |
0.608 (1.00) |
0.0904 (1.00) |
0.0689 (1.00) |
0.283 (1.00) |
0.000829 (0.46) |
| 11q gain | 5 (4%) | 107 |
0.264 (1.00) |
0.174 (1.00) |
0.122 (1.00) |
0.631 (1.00) |
0.0862 (1.00) |
0.404 (1.00) |
0.84 (1.00) |
0.0171 (1.00) |
| 12p gain | 10 (9%) | 102 |
0.0097 (1.00) |
0.0251 (1.00) |
0.648 (1.00) |
1 (1.00) |
0.0397 (1.00) |
0.171 (1.00) |
0.0764 (1.00) |
0.226 (1.00) |
| 12q gain | 4 (4%) | 108 |
0.152 (1.00) |
0.0341 (1.00) |
0.674 (1.00) |
0.0881 (1.00) |
0.0282 (1.00) |
0.0299 (1.00) |
||
| 13q gain | 15 (13%) | 97 |
0.00505 (1.00) |
0.0748 (1.00) |
0.256 (1.00) |
0.636 (1.00) |
0.112 (1.00) |
0.91 (1.00) |
0.936 (1.00) |
0.621 (1.00) |
| 14q gain | 9 (8%) | 103 |
0.162 (1.00) |
0.353 (1.00) |
0.25 (1.00) |
0.35 (1.00) |
0.183 (1.00) |
0.05 (1.00) |
0.907 (1.00) |
0.229 (1.00) |
| 15q gain | 16 (14%) | 96 |
0.00354 (1.00) |
0.602 (1.00) |
0.116 (1.00) |
0.276 (1.00) |
0.941 (1.00) |
0.347 (1.00) |
0.454 (1.00) |
0.204 (1.00) |
| 16p gain | 6 (5%) | 106 |
0.0286 (1.00) |
0.00944 (1.00) |
0.635 (1.00) |
1 (1.00) |
0.192 (1.00) |
0.0208 (1.00) |
0.206 (1.00) |
0.503 (1.00) |
| 16q gain | 6 (5%) | 106 |
0.0703 (1.00) |
0.062 (1.00) |
0.857 (1.00) |
0.285 (1.00) |
0.383 (1.00) |
0.236 (1.00) |
0.0153 (1.00) |
0.0613 (1.00) |
| 17p gain | 8 (7%) | 104 |
0.49 (1.00) |
0.369 (1.00) |
0.389 (1.00) |
0.0303 (1.00) |
0.407 (1.00) |
0.793 (1.00) |
0.455 (1.00) |
0.864 (1.00) |
| 17q gain | 15 (13%) | 97 |
0.0414 (1.00) |
0.125 (1.00) |
0.804 (1.00) |
0.47 (1.00) |
0.434 (1.00) |
0.793 (1.00) |
0.0414 (1.00) |
0.682 (1.00) |
| 18p gain | 14 (12%) | 98 |
0.0792 (1.00) |
0.0203 (1.00) |
0.977 (1.00) |
0.723 (1.00) |
0.204 (1.00) |
0.407 (1.00) |
0.0125 (1.00) |
0.232 (1.00) |
| 18q gain | 6 (5%) | 106 |
0.179 (1.00) |
0.0721 (1.00) |
0.512 (1.00) |
0.937 (1.00) |
0.237 (1.00) |
0.147 (1.00) |
0.747 (1.00) |
1 (1.00) |
| 19p gain | 8 (7%) | 104 |
0.273 (1.00) |
0.0385 (1.00) |
0.5 (1.00) |
0.429 (1.00) |
0.0128 (1.00) |
0.00525 (1.00) |
0.508 (1.00) |
0.153 (1.00) |
| 19q gain | 9 (8%) | 103 |
0.0174 (1.00) |
0.0037 (1.00) |
0.886 (1.00) |
0.843 (1.00) |
0.0043 (1.00) |
0.00134 (0.732) |
0.489 (1.00) |
0.0679 (1.00) |
| 21q gain | 11 (10%) | 101 |
0.596 (1.00) |
0.0441 (1.00) |
0.311 (1.00) |
0.571 (1.00) |
0.477 (1.00) |
0.452 (1.00) |
0.66 (1.00) |
1 (1.00) |
| 22q gain | 24 (21%) | 88 |
0.191 (1.00) |
0.364 (1.00) |
0.348 (1.00) |
0.401 (1.00) |
0.734 (1.00) |
0.0914 (1.00) |
0.755 (1.00) |
0.817 (1.00) |
| 1p loss | 8 (7%) | 104 |
0.054 (1.00) |
0.147 (1.00) |
0.648 (1.00) |
0.514 (1.00) |
0.272 (1.00) |
0.217 (1.00) |
1 (1.00) |
0.285 (1.00) |
| 2p loss | 12 (11%) | 100 |
0.168 (1.00) |
0.148 (1.00) |
0.506 (1.00) |
0.184 (1.00) |
0.246 (1.00) |
0.759 (1.00) |
0.0249 (1.00) |
0.0414 (1.00) |
| 2q loss | 11 (10%) | 101 |
0.0203 (1.00) |
0.192 (1.00) |
0.673 (1.00) |
0.68 (1.00) |
0.4 (1.00) |
0.719 (1.00) |
0.0631 (1.00) |
0.0595 (1.00) |
| 3p loss | 5 (4%) | 107 |
0.00183 (0.998) |
0.16 (1.00) |
0.436 (1.00) |
0.729 (1.00) |
0.209 (1.00) |
0.061 (1.00) |
0.352 (1.00) |
0.765 (1.00) |
| 3q loss | 8 (7%) | 104 |
0.0107 (1.00) |
0.432 (1.00) |
0.142 (1.00) |
0.279 (1.00) |
0.188 (1.00) |
0.232 (1.00) |
0.406 (1.00) |
0.61 (1.00) |
| 4p loss | 9 (8%) | 103 |
0.494 (1.00) |
0.0405 (1.00) |
0.587 (1.00) |
0.445 (1.00) |
0.101 (1.00) |
0.169 (1.00) |
0.131 (1.00) |
0.127 (1.00) |
| 4q loss | 10 (9%) | 102 |
0.54 (1.00) |
0.503 (1.00) |
0.612 (1.00) |
0.627 (1.00) |
0.636 (1.00) |
0.377 (1.00) |
0.142 (1.00) |
0.435 (1.00) |
| 5p loss | 14 (12%) | 98 |
0.36 (1.00) |
0.00112 (0.613) |
0.291 (1.00) |
0.636 (1.00) |
0.151 (1.00) |
0.0147 (1.00) |
0.123 (1.00) |
0.359 (1.00) |
| 5q loss | 24 (21%) | 88 |
0.217 (1.00) |
0.154 (1.00) |
0.455 (1.00) |
0.664 (1.00) |
0.411 (1.00) |
0.0662 (1.00) |
0.346 (1.00) |
0.768 (1.00) |
| 6p loss | 9 (8%) | 103 |
0.396 (1.00) |
0.766 (1.00) |
0.1 (1.00) |
0.926 (1.00) |
1 (1.00) |
0.964 (1.00) |
0.235 (1.00) |
0.0547 (1.00) |
| 8p loss | 14 (12%) | 98 |
0.583 (1.00) |
0.0727 (1.00) |
0.653 (1.00) |
0.517 (1.00) |
0.386 (1.00) |
0.285 (1.00) |
0.0137 (1.00) |
0.0163 (1.00) |
| 8q loss | 3 (3%) | 109 |
1 (1.00) |
0.0656 (1.00) |
0.122 (1.00) |
1 (1.00) |
0.62 (1.00) |
0.705 (1.00) |
0.163 (1.00) |
0.687 (1.00) |
| 9q loss | 42 (38%) | 70 |
0.0216 (1.00) |
0.0186 (1.00) |
0.656 (1.00) |
0.397 (1.00) |
0.0295 (1.00) |
0.353 (1.00) |
0.0143 (1.00) |
0.243 (1.00) |
| 10p loss | 45 (40%) | 67 |
0.0139 (1.00) |
0.0254 (1.00) |
0.0945 (1.00) |
0.0517 (1.00) |
0.000965 (0.532) |
0.00548 (1.00) |
0.00179 (0.98) |
0.113 (1.00) |
| 11p loss | 26 (23%) | 86 |
0.000879 (0.487) |
0.0091 (1.00) |
0.401 (1.00) |
0.386 (1.00) |
0.028 (1.00) |
0.199 (1.00) |
0.137 (1.00) |
0.33 (1.00) |
| 12p loss | 5 (4%) | 107 |
0.48 (1.00) |
0.76 (1.00) |
0.203 (1.00) |
0.518 (1.00) |
0.739 (1.00) |
0.813 (1.00) |
0.438 (1.00) |
0.606 (1.00) |
| 12q loss | 8 (7%) | 104 |
0.172 (1.00) |
0.104 (1.00) |
0.959 (1.00) |
0.81 (1.00) |
0.815 (1.00) |
0.696 (1.00) |
0.172 (1.00) |
0.339 (1.00) |
| 13q loss | 17 (15%) | 95 |
0.0037 (1.00) |
0.605 (1.00) |
0.54 (1.00) |
0.771 (1.00) |
0.796 (1.00) |
0.878 (1.00) |
0.0491 (1.00) |
0.267 (1.00) |
| 14q loss | 25 (22%) | 87 |
0.00487 (1.00) |
0.0528 (1.00) |
0.143 (1.00) |
0.569 (1.00) |
0.221 (1.00) |
0.0879 (1.00) |
0.397 (1.00) |
0.587 (1.00) |
| 15q loss | 7 (6%) | 105 |
0.0843 (1.00) |
0.0708 (1.00) |
0.999 (1.00) |
1 (1.00) |
0.256 (1.00) |
0.947 (1.00) |
0.692 (1.00) |
0.703 (1.00) |
| 16p loss | 8 (7%) | 104 |
0.447 (1.00) |
0.432 (1.00) |
0.101 (1.00) |
0.561 (1.00) |
0.272 (1.00) |
0.819 (1.00) |
0.00541 (1.00) |
0.61 (1.00) |
| 16q loss | 16 (14%) | 96 |
0.62 (1.00) |
0.246 (1.00) |
0.108 (1.00) |
0.196 (1.00) |
0.0736 (1.00) |
0.261 (1.00) |
0.0134 (1.00) |
0.145 (1.00) |
| 17q loss | 13 (12%) | 99 |
0.399 (1.00) |
0.473 (1.00) |
0.754 (1.00) |
0.726 (1.00) |
0.199 (1.00) |
0.496 (1.00) |
1 (1.00) |
0.509 (1.00) |
| 18p loss | 18 (16%) | 94 |
0.289 (1.00) |
0.00371 (1.00) |
0.501 (1.00) |
0.506 (1.00) |
0.00437 (1.00) |
0.018 (1.00) |
0.0372 (1.00) |
0.659 (1.00) |
| 18q loss | 18 (16%) | 94 |
0.37 (1.00) |
0.00255 (1.00) |
0.855 (1.00) |
0.0884 (1.00) |
0.0405 (1.00) |
0.0341 (1.00) |
0.0892 (1.00) |
0.923 (1.00) |
| 19p loss | 12 (11%) | 100 |
0.708 (1.00) |
0.756 (1.00) |
0.481 (1.00) |
0.736 (1.00) |
0.289 (1.00) |
0.0161 (1.00) |
0.0194 (1.00) |
0.337 (1.00) |
| 19q loss | 12 (11%) | 100 |
0.0849 (1.00) |
0.609 (1.00) |
0.471 (1.00) |
0.795 (1.00) |
0.143 (1.00) |
0.0499 (1.00) |
0.182 (1.00) |
0.448 (1.00) |
| 20p loss | 3 (3%) | 109 |
0.457 (1.00) |
0.599 (1.00) |
0.248 (1.00) |
0.297 (1.00) |
0.163 (1.00) |
0.687 (1.00) |
||
| 21q loss | 15 (13%) | 97 |
0.548 (1.00) |
0.149 (1.00) |
0.757 (1.00) |
0.579 (1.00) |
0.569 (1.00) |
0.91 (1.00) |
0.00288 (1.00) |
0.621 (1.00) |
| 22q loss | 7 (6%) | 105 |
0.178 (1.00) |
0.697 (1.00) |
0.494 (1.00) |
1 (1.00) |
0.256 (1.00) |
0.77 (1.00) |
0.149 (1.00) |
0.848 (1.00) |
| Xq loss | 3 (3%) | 109 |
0.236 (1.00) |
0.389 (1.00) |
0.786 (1.00) |
0.486 (1.00) |
0.606 (1.00) |
0.687 (1.00) |
P value = 0.000228 (Fisher's exact test), Q value = 0.13
Table S1. Gene #13: '7p gain mutation analysis' versus Clinical Feature #1: 'CN_CNMF'
| nPatients | CLUS_1 | CLUS_2 | CLUS_3 | CLUS_4 |
|---|---|---|---|---|
| ALL | 30 | 18 | 38 | 26 |
| 7P GAIN MUTATED | 14 | 14 | 7 | 9 |
| 7P GAIN WILD-TYPE | 16 | 4 | 31 | 17 |
Figure S1. Get High-res Image Gene #13: '7p gain mutation analysis' versus Clinical Feature #1: 'CN_CNMF'
P value = 0.000286 (Fisher's exact test), Q value = 0.16
Table S2. Gene #14: '7q gain mutation analysis' versus Clinical Feature #1: 'CN_CNMF'
| nPatients | CLUS_1 | CLUS_2 | CLUS_3 | CLUS_4 |
|---|---|---|---|---|
| ALL | 30 | 18 | 38 | 26 |
| 7Q GAIN MUTATED | 10 | 15 | 9 | 10 |
| 7Q GAIN WILD-TYPE | 20 | 3 | 29 | 16 |
Figure S2. Get High-res Image Gene #14: '7q gain mutation analysis' versus Clinical Feature #1: 'CN_CNMF'

P value = 1.97e-05 (Fisher's exact test), Q value = 0.011
Table S3. Gene #15: '8p gain mutation analysis' versus Clinical Feature #1: 'CN_CNMF'
| nPatients | CLUS_1 | CLUS_2 | CLUS_3 | CLUS_4 |
|---|---|---|---|---|
| ALL | 30 | 18 | 38 | 26 |
| 8P GAIN MUTATED | 3 | 10 | 1 | 4 |
| 8P GAIN WILD-TYPE | 27 | 8 | 37 | 22 |
Figure S3. Get High-res Image Gene #15: '8p gain mutation analysis' versus Clinical Feature #1: 'CN_CNMF'
P value = 1.49e-05 (Fisher's exact test), Q value = 0.0085
Table S4. Gene #16: '8q gain mutation analysis' versus Clinical Feature #1: 'CN_CNMF'
| nPatients | CLUS_1 | CLUS_2 | CLUS_3 | CLUS_4 |
|---|---|---|---|---|
| ALL | 30 | 18 | 38 | 26 |
| 8Q GAIN MUTATED | 10 | 12 | 2 | 7 |
| 8Q GAIN WILD-TYPE | 20 | 6 | 36 | 19 |
Figure S4. Get High-res Image Gene #16: '8q gain mutation analysis' versus Clinical Feature #1: 'CN_CNMF'
P value = 1.66e-05 (Fisher's exact test), Q value = 0.0094
Table S5. Gene #16: '8q gain mutation analysis' versus Clinical Feature #2: 'METHLYATION_CNMF'
| nPatients | CLUS_1 | CLUS_2 | CLUS_3 | CLUS_4 |
|---|---|---|---|---|
| ALL | 18 | 40 | 26 | 28 |
| 8Q GAIN MUTATED | 11 | 3 | 12 | 5 |
| 8Q GAIN WILD-TYPE | 7 | 37 | 14 | 23 |
Figure S5. Get High-res Image Gene #16: '8q gain mutation analysis' versus Clinical Feature #2: 'METHLYATION_CNMF'
P value = 1.1e-05 (Fisher's exact test), Q value = 0.0063
Table S6. Gene #33: '20p gain mutation analysis' versus Clinical Feature #1: 'CN_CNMF'
| nPatients | CLUS_1 | CLUS_2 | CLUS_3 | CLUS_4 |
|---|---|---|---|---|
| ALL | 30 | 18 | 38 | 26 |
| 20P GAIN MUTATED | 6 | 10 | 2 | 13 |
| 20P GAIN WILD-TYPE | 24 | 8 | 36 | 13 |
Figure S6. Get High-res Image Gene #33: '20p gain mutation analysis' versus Clinical Feature #1: 'CN_CNMF'
P value = 0.00034 (Fisher's exact test), Q value = 0.19
Table S7. Gene #33: '20p gain mutation analysis' versus Clinical Feature #2: 'METHLYATION_CNMF'
| nPatients | CLUS_1 | CLUS_2 | CLUS_3 | CLUS_4 |
|---|---|---|---|---|
| ALL | 18 | 40 | 26 | 28 |
| 20P GAIN MUTATED | 10 | 6 | 12 | 3 |
| 20P GAIN WILD-TYPE | 8 | 34 | 14 | 25 |
Figure S7. Get High-res Image Gene #33: '20p gain mutation analysis' versus Clinical Feature #2: 'METHLYATION_CNMF'

P value = 2.24e-05 (Fisher's exact test), Q value = 0.013
Table S8. Gene #34: '20q gain mutation analysis' versus Clinical Feature #1: 'CN_CNMF'
| nPatients | CLUS_1 | CLUS_2 | CLUS_3 | CLUS_4 |
|---|---|---|---|---|
| ALL | 30 | 18 | 38 | 26 |
| 20Q GAIN MUTATED | 11 | 11 | 3 | 14 |
| 20Q GAIN WILD-TYPE | 19 | 7 | 35 | 12 |
Figure S8. Get High-res Image Gene #34: '20q gain mutation analysis' versus Clinical Feature #1: 'CN_CNMF'
P value = 4.79e-05 (Fisher's exact test), Q value = 0.027
Table S9. Gene #47: '6q loss mutation analysis' versus Clinical Feature #1: 'CN_CNMF'
| nPatients | CLUS_1 | CLUS_2 | CLUS_3 | CLUS_4 |
|---|---|---|---|---|
| ALL | 30 | 18 | 38 | 26 |
| 6Q LOSS MUTATED | 15 | 5 | 4 | 16 |
| 6Q LOSS WILD-TYPE | 15 | 13 | 34 | 10 |
Figure S9. Get High-res Image Gene #47: '6q loss mutation analysis' versus Clinical Feature #1: 'CN_CNMF'
P value = 1.55e-05 (Fisher's exact test), Q value = 0.0088
Table S10. Gene #50: '9p loss mutation analysis' versus Clinical Feature #1: 'CN_CNMF'
| nPatients | CLUS_1 | CLUS_2 | CLUS_3 | CLUS_4 |
|---|---|---|---|---|
| ALL | 30 | 18 | 38 | 26 |
| 9P LOSS MUTATED | 24 | 13 | 10 | 10 |
| 9P LOSS WILD-TYPE | 6 | 5 | 28 | 16 |
Figure S10. Get High-res Image Gene #50: '9p loss mutation analysis' versus Clinical Feature #1: 'CN_CNMF'
P value = 0.000272 (Fisher's exact test), Q value = 0.15
Table S11. Gene #53: '10q loss mutation analysis' versus Clinical Feature #5: 'MRNASEQ_CNMF'
| nPatients | CLUS_1 | CLUS_2 | CLUS_3 |
|---|---|---|---|
| ALL | 42 | 27 | 43 |
| 10Q LOSS MUTATED | 23 | 3 | 23 |
| 10Q LOSS WILD-TYPE | 19 | 24 | 20 |
Figure S11. Get High-res Image Gene #53: '10q loss mutation analysis' versus Clinical Feature #5: 'MRNASEQ_CNMF'
P value = 0.000137 (Fisher's exact test), Q value = 0.077
Table S12. Gene #55: '11q loss mutation analysis' versus Clinical Feature #1: 'CN_CNMF'
| nPatients | CLUS_1 | CLUS_2 | CLUS_3 | CLUS_4 |
|---|---|---|---|---|
| ALL | 30 | 18 | 38 | 26 |
| 11Q LOSS MUTATED | 15 | 8 | 3 | 4 |
| 11Q LOSS WILD-TYPE | 15 | 10 | 35 | 22 |
Figure S12. Get High-res Image Gene #55: '11q loss mutation analysis' versus Clinical Feature #1: 'CN_CNMF'
P value = 0.00013 (Fisher's exact test), Q value = 0.073
Table S13. Gene #63: '17p loss mutation analysis' versus Clinical Feature #2: 'METHLYATION_CNMF'
| nPatients | CLUS_1 | CLUS_2 | CLUS_3 | CLUS_4 |
|---|---|---|---|---|
| ALL | 18 | 40 | 26 | 28 |
| 17P LOSS MUTATED | 4 | 4 | 4 | 16 |
| 17P LOSS WILD-TYPE | 14 | 36 | 22 | 12 |
Figure S13. Get High-res Image Gene #63: '17p loss mutation analysis' versus Clinical Feature #2: 'METHLYATION_CNMF'
-
Mutation data file = broad_values_by_arm.mutsig.cluster.txt
-
Molecular subtypes file = SKCM-Regional_LN.transferedmergedcluster.txt
-
Number of patients = 112
-
Number of significantly arm-level cnvs = 72
-
Number of molecular subtypes = 8
-
Exclude genes that fewer than K tumors have mutations, K = 3
For binary or multi-class clinical features (nominal or ordinal), two-tailed Fisher's exact tests (Fisher 1922) were used to estimate the P values using the 'fisher.test' function in R
For multi-class clinical features (nominal or ordinal), Chi-square tests (Greenwood and Nikulin 1996) were used to estimate the P values using the 'chisq.test' function in R
For multiple hypothesis correction, Q value is the False Discovery Rate (FDR) analogue of the P value (Benjamini and Hochberg 1995), defined as the minimum FDR at which the test may be called significant. We used the 'Benjamini and Hochberg' method of 'p.adjust' function in R to convert P values into Q values.
This is an experimental feature. The full results of the analysis summarized in this report can be downloaded from the TCGA Data Coordination Center.