(Regional_Metastatic cohort)
This pipeline computes the correlation between significant arm-level copy number variations (cnvs) and selected clinical features.
Testing the association between copy number variation 73 arm-level results and 8 clinical features across 147 patients, 2 significant findings detected with Q value < 0.25.
-
18p gain cnv correlated to 'NEOPLASM.DISEASESTAGE'.
-
18q gain cnv correlated to 'NEOPLASM.DISEASESTAGE'.
Table 1. Get Full Table Overview of the association between significant copy number variation of 73 arm-level results and 8 clinical features. Shown in the table are P values (Q values). Thresholded by Q value < 0.25, 2 significant findings detected.
|
Clinical Features |
Time to Death |
AGE |
PRIMARY SITE OF DISEASE |
GENDER |
DISTANT METASTASIS |
LYMPH NODE METASTASIS |
TUMOR STAGECODE |
NEOPLASM DISEASESTAGE |
||
| nCNV (%) | nWild-Type | logrank test | t-test | Fisher's exact test | Fisher's exact test | Chi-square test | Chi-square test | t-test | Chi-square test | |
| 18p gain | 19 (13%) | 128 |
0.707 (1.00) |
0.104 (1.00) |
0.777 (1.00) |
0.305 (1.00) |
0.541 (1.00) |
0.26 (1.00) |
4.46e-06 (0.00227) |
|
| 18q gain | 10 (7%) | 137 |
0.469 (1.00) |
0.537 (1.00) |
0.25 (1.00) |
0.743 (1.00) |
0.983 (1.00) |
0.326 (1.00) |
1.13e-07 (5.76e-05) |
|
| 1p gain | 20 (14%) | 127 |
0.264 (1.00) |
0.0546 (1.00) |
0.258 (1.00) |
1 (1.00) |
0.904 (1.00) |
0.22 (1.00) |
0.0385 (1.00) |
|
| 1q gain | 48 (33%) | 99 |
0.866 (1.00) |
0.924 (1.00) |
0.153 (1.00) |
0.581 (1.00) |
0.689 (1.00) |
0.165 (1.00) |
0.388 (1.00) |
|
| 2p gain | 16 (11%) | 131 |
0.758 (1.00) |
0.412 (1.00) |
0.534 (1.00) |
0.789 (1.00) |
0.94 (1.00) |
0.0729 (1.00) |
0.428 (1.00) |
|
| 2q gain | 15 (10%) | 132 |
0.95 (1.00) |
0.709 (1.00) |
0.351 (1.00) |
1 (1.00) |
0.947 (1.00) |
0.175 (1.00) |
0.537 (1.00) |
|
| 3p gain | 12 (8%) | 135 |
0.697 (1.00) |
0.867 (1.00) |
0.158 (1.00) |
0.754 (1.00) |
0.973 (1.00) |
0.052 (1.00) |
0.396 (1.00) |
|
| 3q gain | 15 (10%) | 132 |
0.192 (1.00) |
0.303 (1.00) |
0.196 (1.00) |
0.778 (1.00) |
0.947 (1.00) |
0.0635 (1.00) |
0.652 (1.00) |
|
| 4p gain | 14 (10%) | 133 |
0.111 (1.00) |
0.07 (1.00) |
0.742 (1.00) |
0.565 (1.00) |
0.961 (1.00) |
0.111 (1.00) |
0.102 (1.00) |
|
| 4q gain | 12 (8%) | 135 |
0.311 (1.00) |
0.0782 (1.00) |
0.732 (1.00) |
1 (1.00) |
0.978 (1.00) |
0.315 (1.00) |
0.114 (1.00) |
|
| 5p gain | 13 (9%) | 134 |
0.0873 (1.00) |
0.829 (1.00) |
0.303 (1.00) |
0.771 (1.00) |
0.386 (1.00) |
0.689 (1.00) |
0.145 (1.00) |
|
| 5q gain | 5 (3%) | 142 |
0.207 (1.00) |
0.602 (1.00) |
0.339 (1.00) |
1 (1.00) |
0.993 (1.00) |
0.57 (1.00) |
0.726 (1.00) |
|
| 6p gain | 45 (31%) | 102 |
0.754 (1.00) |
0.34 (1.00) |
0.534 (1.00) |
0.138 (1.00) |
0.72 (1.00) |
0.443 (1.00) |
0.243 (1.00) |
|
| 6q gain | 9 (6%) | 138 |
0.358 (1.00) |
0.557 (1.00) |
1 (1.00) |
0.721 (1.00) |
0.177 (1.00) |
0.895 (1.00) |
0.437 (1.00) |
|
| 7p gain | 63 (43%) | 84 |
0.59 (1.00) |
0.596 (1.00) |
0.124 (1.00) |
0.297 (1.00) |
0.138 (1.00) |
0.0588 (1.00) |
0.0459 (1.00) |
|
| 7q gain | 62 (42%) | 85 |
0.874 (1.00) |
0.555 (1.00) |
0.241 (1.00) |
0.601 (1.00) |
0.145 (1.00) |
0.0684 (1.00) |
0.0173 (1.00) |
|
| 8p gain | 29 (20%) | 118 |
0.999 (1.00) |
0.422 (1.00) |
0.0546 (1.00) |
0.668 (1.00) |
0.239 (1.00) |
0.492 (1.00) |
0.167 (1.00) |
|
| 8q gain | 46 (31%) | 101 |
0.783 (1.00) |
0.366 (1.00) |
0.0992 (1.00) |
0.266 (1.00) |
0.413 (1.00) |
0.25 (1.00) |
0.453 (1.00) |
|
| 9p gain | 3 (2%) | 144 |
0.578 (1.00) |
0.0314 (1.00) |
0.561 (1.00) |
0.285 (1.00) |
0.998 (1.00) |
0.0535 (1.00) |
0.518 (1.00) |
|
| 9q gain | 3 (2%) | 144 |
0.784 (1.00) |
0.873 (1.00) |
1 (1.00) |
0.285 (1.00) |
0.998 (1.00) |
0.288 (1.00) |
0.959 (1.00) |
|
| 11p gain | 9 (6%) | 138 |
0.999 (1.00) |
0.29 (1.00) |
0.687 (1.00) |
0.493 (1.00) |
0.983 (1.00) |
0.0395 (1.00) |
0.718 (1.00) |
|
| 11q gain | 6 (4%) | 141 |
0.319 (1.00) |
0.33 (1.00) |
1 (1.00) |
0.424 (1.00) |
0.993 (1.00) |
0.758 (1.00) |
0.602 (1.00) |
|
| 12p gain | 16 (11%) | 131 |
0.981 (1.00) |
0.685 (1.00) |
0.213 (1.00) |
0.419 (1.00) |
0.0217 (1.00) |
0.102 (1.00) |
0.0487 (1.00) |
|
| 12q gain | 7 (5%) | 140 |
0.866 (1.00) |
0.421 (1.00) |
0.671 (1.00) |
0.422 (1.00) |
0.99 (1.00) |
0.0248 (1.00) |
0.0736 (1.00) |
|
| 13q gain | 21 (14%) | 126 |
0.197 (1.00) |
0.851 (1.00) |
0.586 (1.00) |
0.808 (1.00) |
0.571 (1.00) |
0.243 (1.00) |
0.319 (1.00) |
|
| 14q gain | 12 (8%) | 135 |
0.65 (1.00) |
0.975 (1.00) |
1 (1.00) |
1 (1.00) |
0.973 (1.00) |
0.783 (1.00) |
0.394 (1.00) |
|
| 15q gain | 21 (14%) | 126 |
0.934 (1.00) |
0.673 (1.00) |
1 (1.00) |
0.808 (1.00) |
0.894 (1.00) |
0.337 (1.00) |
0.552 (1.00) |
|
| 16p gain | 12 (8%) | 135 |
0.895 (1.00) |
0.667 (1.00) |
0.158 (1.00) |
0.754 (1.00) |
0.961 (1.00) |
0.493 (1.00) |
0.509 (1.00) |
|
| 16q gain | 10 (7%) | 137 |
0.81 (1.00) |
0.922 (1.00) |
0.25 (1.00) |
0.743 (1.00) |
0.973 (1.00) |
0.0711 (1.00) |
0.529 (1.00) |
|
| 17p gain | 13 (9%) | 134 |
0.632 (1.00) |
0.627 (1.00) |
0.192 (1.00) |
0.544 (1.00) |
0.285 (1.00) |
0.96 (1.00) |
0.00352 (1.00) |
|
| 17q gain | 21 (14%) | 126 |
0.371 (1.00) |
0.0484 (1.00) |
1 (1.00) |
0.466 (1.00) |
0.597 (1.00) |
0.68 (1.00) |
0.141 (1.00) |
|
| 19p gain | 7 (5%) | 140 |
0.91 (1.00) |
0.834 (1.00) |
0.198 (1.00) |
0.698 (1.00) |
0.987 (1.00) |
0.988 (1.00) |
0.0163 (1.00) |
|
| 19q gain | 11 (7%) | 136 |
0.377 (1.00) |
0.332 (1.00) |
1 (1.00) |
0.0529 (1.00) |
0.967 (1.00) |
0.431 (1.00) |
0.0848 (1.00) |
|
| 20p gain | 43 (29%) | 104 |
0.456 (1.00) |
0.852 (1.00) |
0.524 (1.00) |
1 (1.00) |
0.394 (1.00) |
0.911 (1.00) |
0.489 (1.00) |
|
| 20q gain | 53 (36%) | 94 |
0.108 (1.00) |
0.844 (1.00) |
0.687 (1.00) |
0.858 (1.00) |
0.17 (1.00) |
0.964 (1.00) |
0.391 (1.00) |
|
| 21q gain | 17 (12%) | 130 |
0.862 (1.00) |
0.955 (1.00) |
0.238 (1.00) |
0.293 (1.00) |
0.471 (1.00) |
0.296 (1.00) |
0.0448 (1.00) |
|
| 22q gain | 37 (25%) | 110 |
0.122 (1.00) |
0.435 (1.00) |
0.0753 (1.00) |
0.843 (1.00) |
0.726 (1.00) |
0.0151 (1.00) |
0.0135 (1.00) |
|
| 1p loss | 12 (8%) | 135 |
0.117 (1.00) |
0.657 (1.00) |
0.48 (1.00) |
0.346 (1.00) |
0.978 (1.00) |
0.722 (1.00) |
0.0378 (1.00) |
|
| 1q loss | 4 (3%) | 143 |
0.842 (1.00) |
0.0384 (1.00) |
0.0421 (1.00) |
0.127 (1.00) |
0.996 (1.00) |
0.963 (1.00) |
0.589 (1.00) |
|
| 2p loss | 14 (10%) | 133 |
0.2 (1.00) |
0.772 (1.00) |
0.52 (1.00) |
1 (1.00) |
0.967 (1.00) |
0.974 (1.00) |
0.237 (1.00) |
|
| 2q loss | 13 (9%) | 134 |
0.31 (1.00) |
0.411 (1.00) |
0.734 (1.00) |
0.544 (1.00) |
0.285 (1.00) |
0.916 (1.00) |
0.122 (1.00) |
|
| 3p loss | 10 (7%) | 137 |
0.57 (1.00) |
0.235 (1.00) |
0.0583 (1.00) |
0.743 (1.00) |
0.983 (1.00) |
0.562 (1.00) |
0.0458 (1.00) |
|
| 3q loss | 12 (8%) | 135 |
0.791 (1.00) |
0.562 (1.00) |
0.48 (1.00) |
0.346 (1.00) |
0.973 (1.00) |
0.722 (1.00) |
0.0767 (1.00) |
|
| 4p loss | 15 (10%) | 132 |
0.962 (1.00) |
0.617 (1.00) |
0.196 (1.00) |
0.156 (1.00) |
0.386 (1.00) |
0.856 (1.00) |
0.37 (1.00) |
|
| 4q loss | 16 (11%) | 131 |
0.709 (1.00) |
0.591 (1.00) |
0.213 (1.00) |
0.0945 (1.00) |
0.00137 (0.696) |
0.774 (1.00) |
0.267 (1.00) |
|
| 5p loss | 18 (12%) | 129 |
0.742 (1.00) |
0.16 (1.00) |
1 (1.00) |
0.435 (1.00) |
0.94 (1.00) |
0.896 (1.00) |
0.939 (1.00) |
|
| 5q loss | 31 (21%) | 116 |
0.419 (1.00) |
0.943 (1.00) |
1 (1.00) |
0.677 (1.00) |
0.6 (1.00) |
0.561 (1.00) |
0.941 (1.00) |
|
| 6p loss | 11 (7%) | 136 |
0.255 (1.00) |
0.275 (1.00) |
0.724 (1.00) |
0.52 (1.00) |
0.967 (1.00) |
0.889 (1.00) |
0.796 (1.00) |
|
| 6q loss | 53 (36%) | 94 |
0.649 (1.00) |
0.116 (1.00) |
0.106 (1.00) |
0.474 (1.00) |
0.443 (1.00) |
0.6 (1.00) |
0.143 (1.00) |
|
| 8p loss | 16 (11%) | 131 |
0.362 (1.00) |
0.902 (1.00) |
0.36 (1.00) |
0.789 (1.00) |
0.386 (1.00) |
0.707 (1.00) |
0.298 (1.00) |
|
| 9p loss | 82 (56%) | 65 |
0.478 (1.00) |
0.648 (1.00) |
0.0503 (1.00) |
1 (1.00) |
0.456 (1.00) |
0.0427 (1.00) |
0.103 (1.00) |
|
| 9q loss | 61 (41%) | 86 |
0.446 (1.00) |
0.0166 (1.00) |
0.115 (1.00) |
0.0796 (1.00) |
0.272 (1.00) |
0.463 (1.00) |
0.0884 (1.00) |
|
| 10p loss | 64 (44%) | 83 |
0.132 (1.00) |
0.34 (1.00) |
0.0792 (1.00) |
0.164 (1.00) |
0.719 (1.00) |
0.168 (1.00) |
0.698 (1.00) |
|
| 10q loss | 71 (48%) | 76 |
0.442 (1.00) |
0.0132 (1.00) |
0.0547 (1.00) |
0.389 (1.00) |
0.375 (1.00) |
0.533 (1.00) |
0.742 (1.00) |
|
| 11p loss | 35 (24%) | 112 |
0.202 (1.00) |
0.33 (1.00) |
0.821 (1.00) |
0.547 (1.00) |
0.296 (1.00) |
0.373 (1.00) |
0.136 (1.00) |
|
| 11q loss | 39 (27%) | 108 |
0.128 (1.00) |
0.904 (1.00) |
1 (1.00) |
0.697 (1.00) |
0.33 (1.00) |
0.31 (1.00) |
0.0488 (1.00) |
|
| 12p loss | 8 (5%) | 139 |
0.539 (1.00) |
0.732 (1.00) |
0.396 (1.00) |
0.454 (1.00) |
0.00286 (1.00) |
0.882 (1.00) |
0.559 (1.00) |
|
| 12q loss | 15 (10%) | 132 |
0.639 (1.00) |
0.618 (1.00) |
0.0492 (1.00) |
0.156 (1.00) |
0.0145 (1.00) |
0.865 (1.00) |
0.62 (1.00) |
|
| 13q loss | 23 (16%) | 124 |
0.867 (1.00) |
0.487 (1.00) |
0.792 (1.00) |
1 (1.00) |
0.00129 (0.657) |
0.291 (1.00) |
0.362 (1.00) |
|
| 14q loss | 35 (24%) | 112 |
0.512 (1.00) |
0.95 (1.00) |
0.497 (1.00) |
1 (1.00) |
0.33 (1.00) |
0.519 (1.00) |
0.536 (1.00) |
|
| 15q loss | 12 (8%) | 135 |
0.675 (1.00) |
0.185 (1.00) |
0.158 (1.00) |
1 (1.00) |
0.231 (1.00) |
0.513 (1.00) |
0.737 (1.00) |
|
| 16p loss | 9 (6%) | 138 |
0.571 (1.00) |
0.834 (1.00) |
0.687 (1.00) |
0.721 (1.00) |
0.983 (1.00) |
0.84 (1.00) |
0.0223 (1.00) |
|
| 16q loss | 20 (14%) | 127 |
0.0729 (1.00) |
0.265 (1.00) |
1 (1.00) |
1 (1.00) |
0.571 (1.00) |
0.256 (1.00) |
0.0595 (1.00) |
|
| 17p loss | 33 (22%) | 114 |
0.319 (1.00) |
0.266 (1.00) |
0.247 (1.00) |
0.541 (1.00) |
0.298 (1.00) |
0.592 (1.00) |
0.791 (1.00) |
|
| 17q loss | 12 (8%) | 135 |
0.16 (1.00) |
0.759 (1.00) |
0.295 (1.00) |
1 (1.00) |
0.0201 (1.00) |
0.823 (1.00) |
0.844 (1.00) |
|
| 18p loss | 26 (18%) | 121 |
0.28 (1.00) |
0.502 (1.00) |
0.446 (1.00) |
0.499 (1.00) |
0.837 (1.00) |
0.214 (1.00) |
0.293 (1.00) |
|
| 18q loss | 24 (16%) | 123 |
0.347 (1.00) |
0.314 (1.00) |
1 (1.00) |
0.492 (1.00) |
0.686 (1.00) |
0.427 (1.00) |
0.237 (1.00) |
|
| 19p loss | 14 (10%) | 133 |
0.293 (1.00) |
0.148 (1.00) |
0.52 (1.00) |
0.00602 (1.00) |
0.0145 (1.00) |
0.602 (1.00) |
0.222 (1.00) |
|
| 19q loss | 15 (10%) | 132 |
0.835 (1.00) |
0.406 (1.00) |
1 (1.00) |
0.156 (1.00) |
0.00514 (1.00) |
0.4 (1.00) |
0.379 (1.00) |
|
| 20p loss | 6 (4%) | 141 |
0.743 (1.00) |
0.551 (1.00) |
0.147 (1.00) |
1 (1.00) |
0.0408 (1.00) |
0.84 (1.00) |
0.574 (1.00) |
|
| 21q loss | 18 (12%) | 129 |
0.814 (1.00) |
0.722 (1.00) |
0.565 (1.00) |
0.795 (1.00) |
0.923 (1.00) |
0.661 (1.00) |
0.0093 (1.00) |
|
| 22q loss | 12 (8%) | 135 |
0.726 (1.00) |
0.467 (1.00) |
0.158 (1.00) |
0.346 (1.00) |
0.337 (1.00) |
0.99 (1.00) |
0.469 (1.00) |
|
| Xq loss | 4 (3%) | 143 |
0.989 (1.00) |
0.675 (1.00) |
1 (1.00) |
0.0145 (1.00) |
0.998 (1.00) |
0.986 (1.00) |
0.747 (1.00) |
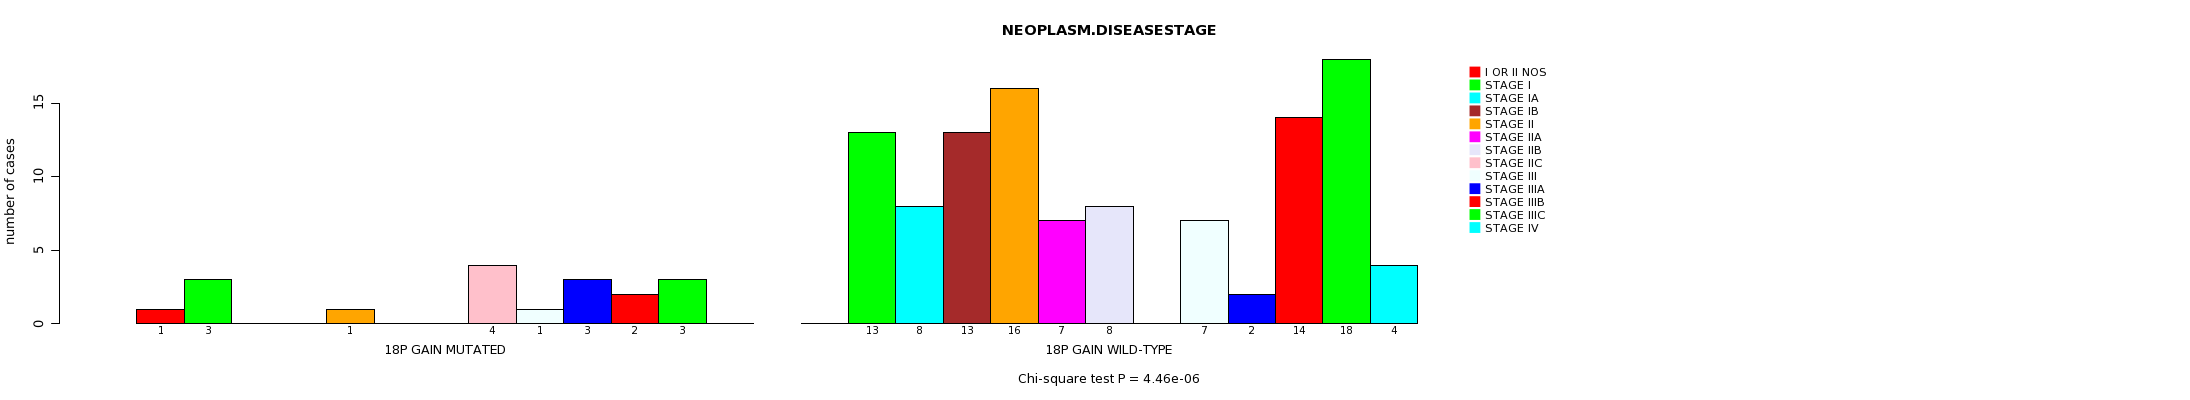
P value = 4.46e-06 (Chi-square test), Q value = 0.0023
Table S1. Gene #30: '18p gain mutation analysis' versus Clinical Feature #8: 'NEOPLASM.DISEASESTAGE'
| nPatients | I OR II NOS | STAGE I | STAGE IA | STAGE IB | STAGE II | STAGE IIA | STAGE IIB | STAGE IIC | STAGE III | STAGE IIIA | STAGE IIIB | STAGE IIIC | STAGE IV |
|---|---|---|---|---|---|---|---|---|---|---|---|---|---|
| ALL | 1 | 16 | 8 | 13 | 17 | 7 | 8 | 4 | 8 | 5 | 16 | 21 | 4 |
| 18P GAIN MUTATED | 1 | 3 | 0 | 0 | 1 | 0 | 0 | 4 | 1 | 3 | 2 | 3 | 0 |
| 18P GAIN WILD-TYPE | 0 | 13 | 8 | 13 | 16 | 7 | 8 | 0 | 7 | 2 | 14 | 18 | 4 |
Figure S1. Get High-res Image Gene #30: '18p gain mutation analysis' versus Clinical Feature #8: 'NEOPLASM.DISEASESTAGE'
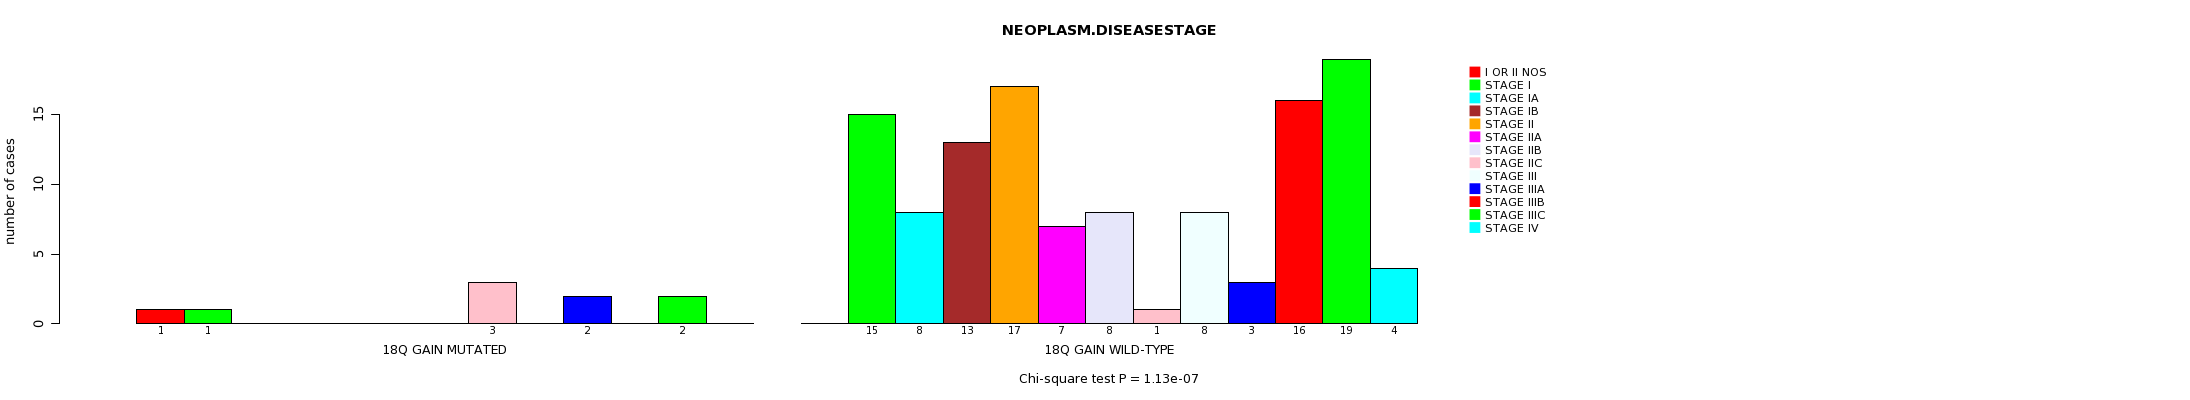
P value = 1.13e-07 (Chi-square test), Q value = 5.8e-05
Table S2. Gene #31: '18q gain mutation analysis' versus Clinical Feature #8: 'NEOPLASM.DISEASESTAGE'
| nPatients | I OR II NOS | STAGE I | STAGE IA | STAGE IB | STAGE II | STAGE IIA | STAGE IIB | STAGE IIC | STAGE III | STAGE IIIA | STAGE IIIB | STAGE IIIC | STAGE IV |
|---|---|---|---|---|---|---|---|---|---|---|---|---|---|
| ALL | 1 | 16 | 8 | 13 | 17 | 7 | 8 | 4 | 8 | 5 | 16 | 21 | 4 |
| 18Q GAIN MUTATED | 1 | 1 | 0 | 0 | 0 | 0 | 0 | 3 | 0 | 2 | 0 | 2 | 0 |
| 18Q GAIN WILD-TYPE | 0 | 15 | 8 | 13 | 17 | 7 | 8 | 1 | 8 | 3 | 16 | 19 | 4 |
Figure S2. Get High-res Image Gene #31: '18q gain mutation analysis' versus Clinical Feature #8: 'NEOPLASM.DISEASESTAGE'
-
Mutation data file = broad_values_by_arm.mutsig.cluster.txt
-
Clinical data file = SKCM-Regional_Metastatic.clin.merged.picked.txt
-
Number of patients = 147
-
Number of significantly arm-level cnvs = 73
-
Number of selected clinical features = 8
-
Exclude genes that fewer than K tumors have mutations, K = 3
For survival clinical features, the Kaplan-Meier survival curves of tumors with and without gene mutations were plotted and the statistical significance P values were estimated by logrank test (Bland and Altman 2004) using the 'survdiff' function in R
For continuous numerical clinical features, two-tailed Student's t test with unequal variance (Lehmann and Romano 2005) was applied to compare the clinical values between tumors with and without gene mutations using 't.test' function in R
For binary or multi-class clinical features (nominal or ordinal), two-tailed Fisher's exact tests (Fisher 1922) were used to estimate the P values using the 'fisher.test' function in R
For multi-class clinical features (nominal or ordinal), Chi-square tests (Greenwood and Nikulin 1996) were used to estimate the P values using the 'chisq.test' function in R
For multiple hypothesis correction, Q value is the False Discovery Rate (FDR) analogue of the P value (Benjamini and Hochberg 1995), defined as the minimum FDR at which the test may be called significant. We used the 'Benjamini and Hochberg' method of 'p.adjust' function in R to convert P values into Q values.
This is an experimental feature. The full results of the analysis summarized in this report can be downloaded from the TCGA Data Coordination Center.