(Regional_Metastatic cohort)
This pipeline uses various statistical tests to identify mRNAs whose expression levels correlated to selected clinical features.
Testing the association between 18128 genes and 7 clinical features across 145 samples, statistically thresholded by Q value < 0.05, 6 clinical features related to at least one genes.
-
2 genes correlated to 'Time to Death'.
-
NUDT7|283927 , PPP3CB|5532
-
9 genes correlated to 'AGE'.
-
ACOX2|8309 , PHKA1|5255 , MCHR1|2847 , ETFB|2109 , MICALL2|79778 , ...
-
27 genes correlated to 'PRIMARY.SITE.OF.DISEASE'.
-
FCRL1|115350 , PIM2|11040 , C8ORF80|389643 , GP1BA|2811 , FLJ40330|645784 , ...
-
17 genes correlated to 'GENDER'.
-
ZFY|7544 , PRKY|5616 , XIST|7503 , RPS4Y1|6192 , CYORF15B|84663 , ...
-
2 genes correlated to 'DISTANT.METASTASIS'.
-
TMEM147|10430 , LRRC28|123355
-
8 genes correlated to 'LYMPH.NODE.METASTASIS'.
-
IHH|3549 , C12ORF27|283460 , AMY1A|276 , NPAS4|266743 , MUC6|4588 , ...
-
No genes correlated to 'NEOPLASM.DISEASESTAGE'
Complete statistical result table is provided in Supplement Table 1
Table 1. Get Full Table This table shows the clinical features, statistical methods used, and the number of genes that are significantly associated with each clinical feature at Q value < 0.05.
| Clinical feature | Statistical test | Significant genes | Associated with | Associated with | ||
|---|---|---|---|---|---|---|
| Time to Death | Cox regression test | N=2 | shorter survival | N=0 | longer survival | N=2 |
| AGE | Spearman correlation test | N=9 | older | N=1 | younger | N=8 |
| PRIMARY SITE OF DISEASE | t test | N=27 | regional lymph node | N=24 | regional cutaneous or subcutaneous tissue (includes satellite and in-transit metastasis) | N=3 |
| GENDER | t test | N=17 | male | N=12 | female | N=5 |
| DISTANT METASTASIS | ANOVA test | N=2 | ||||
| LYMPH NODE METASTASIS | ANOVA test | N=8 | ||||
| NEOPLASM DISEASESTAGE | ANOVA test | N=0 |
Table S1. Basic characteristics of clinical feature: 'Time to Death'
| Time to Death | Duration (Months) | 1-98.8 (median=12.2) |
| censored | N = 37 | |
| death | N = 44 | |
| Significant markers | N = 2 | |
| associated with shorter survival | 0 | |
| associated with longer survival | 2 |
Table S2. Get Full Table List of 2 genes significantly associated with 'Time to Death' by Cox regression test
| HazardRatio | Wald_P | Q | C_index | |
|---|---|---|---|---|
| NUDT7|283927 | 0.65 | 2.186e-06 | 0.04 | 0.287 |
| PPP3CB|5532 | 0.29 | 2.627e-06 | 0.048 | 0.327 |
Figure S1. Get High-res Image As an example, this figure shows the association of NUDT7|283927 to 'Time to Death'. four curves present the cumulative survival rates of 4 quartile subsets of patients. P value = 2.19e-06 with univariate Cox regression analysis using continuous log-2 expression values.
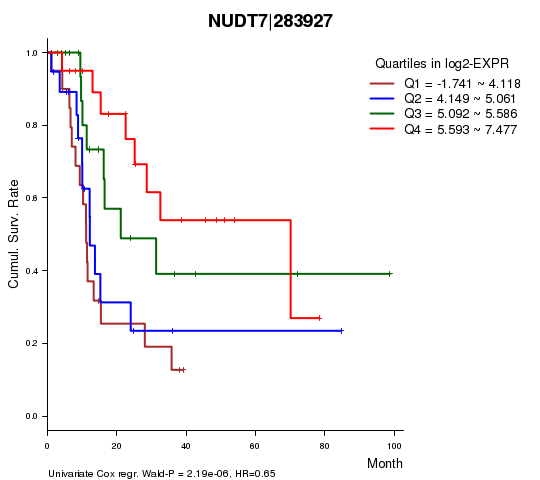
Table S3. Basic characteristics of clinical feature: 'AGE'
| AGE | Mean (SD) | 55.98 (16) |
| Significant markers | N = 9 | |
| pos. correlated | 1 | |
| neg. correlated | 8 |
Table S4. Get Full Table List of 9 genes significantly correlated to 'AGE' by Spearman correlation test
| SpearmanCorr | corrP | Q | |
|---|---|---|---|
| ACOX2|8309 | -0.447 | 1.744e-08 | 0.000316 |
| PHKA1|5255 | -0.4088 | 3.31e-07 | 0.006 |
| MCHR1|2847 | -0.4056 | 4.173e-07 | 0.00756 |
| ETFB|2109 | -0.4041 | 4.632e-07 | 0.00839 |
| MICALL2|79778 | -0.4033 | 4.925e-07 | 0.00893 |
| TCEAL5|340543 | -0.3975 | 7.376e-07 | 0.0134 |
| TENC1|23371 | -0.3828 | 2.012e-06 | 0.0365 |
| CDHR3|222256 | 0.3813 | 2.221e-06 | 0.0403 |
| SYT12|91683 | -0.3809 | 2.479e-06 | 0.0449 |
Figure S2. Get High-res Image As an example, this figure shows the association of ACOX2|8309 to 'AGE'. P value = 1.74e-08 with Spearman correlation analysis. The straight line presents the best linear regression.
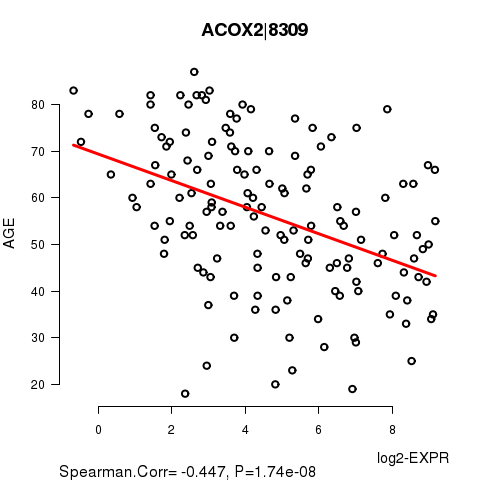
Table S5. Basic characteristics of clinical feature: 'PRIMARY.SITE.OF.DISEASE'
| PRIMARY.SITE.OF.DISEASE | Labels | N |
| REGIONAL CUTANEOUS OR SUBCUTANEOUS TISSUE (INCLUDES SATELLITE AND IN-TRANSIT METASTASIS) | 33 | |
| REGIONAL LYMPH NODE | 112 | |
| Significant markers | N = 27 | |
| Higher in REGIONAL LYMPH NODE | 24 | |
| Higher in REGIONAL CUTANEOUS OR SUBCUTANEOUS TISSUE (INCLUDES SATELLITE AND IN-TRANSIT METASTASIS) | 3 |
Table S6. Get Full Table List of top 10 genes differentially expressed by 'PRIMARY.SITE.OF.DISEASE'
| T(pos if higher in 'REGIONAL LYMPH NODE') | ttestP | Q | AUC | |
|---|---|---|---|---|
| FCRL1|115350 | 7.58 | 7.189e-11 | 1.3e-06 | 0.834 |
| PIM2|11040 | 5.94 | 4.947e-08 | 0.000897 | 0.7546 |
| C8ORF80|389643 | 5.98 | 8.127e-08 | 0.00147 | 0.7673 |
| GP1BA|2811 | 5.81 | 8.605e-08 | 0.00156 | 0.7527 |
| FLJ40330|645784 | 5.76 | 1.061e-07 | 0.00192 | 0.7603 |
| FCER2|2208 | 5.81 | 1.274e-07 | 0.00231 | 0.745 |
| AICDA|57379 | 5.87 | 1.292e-07 | 0.00234 | 0.7692 |
| IGLL1|3543 | 6.22 | 1.591e-07 | 0.00288 | 0.8517 |
| POU2AF1|5450 | 5.83 | 2.415e-07 | 0.00438 | 0.78 |
| MS4A1|931 | 5.66 | 2.651e-07 | 0.0048 | 0.7563 |
Figure S3. Get High-res Image As an example, this figure shows the association of FCRL1|115350 to 'PRIMARY.SITE.OF.DISEASE'. P value = 7.19e-11 with T-test analysis.
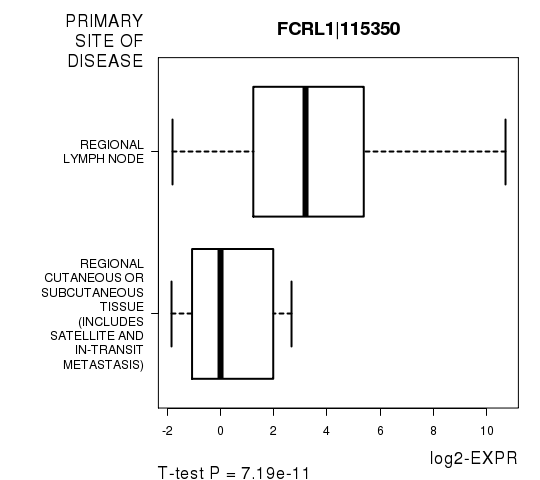
Table S7. Basic characteristics of clinical feature: 'GENDER'
| GENDER | Labels | N |
| FEMALE | 51 | |
| MALE | 94 | |
| Significant markers | N = 17 | |
| Higher in MALE | 12 | |
| Higher in FEMALE | 5 |
Table S8. Get Full Table List of top 10 genes differentially expressed by 'GENDER'
| T(pos if higher in 'MALE') | ttestP | Q | AUC | |
|---|---|---|---|---|
| ZFY|7544 | 29.3 | 1.79e-58 | 3.24e-54 | 0.992 |
| PRKY|5616 | 24.78 | 5.877e-44 | 1.06e-39 | 0.9947 |
| XIST|7503 | -18.99 | 1.671e-38 | 3.03e-34 | 0.9746 |
| RPS4Y1|6192 | 27.49 | 2.187e-34 | 3.96e-30 | 1 |
| CYORF15B|84663 | 32.09 | 2.239e-29 | 4.06e-25 | 1 |
| DDX3Y|8653 | 27.41 | 2.752e-28 | 4.98e-24 | 0.9977 |
| TSIX|9383 | -13.99 | 3.375e-25 | 6.11e-21 | 0.9721 |
| KDM5D|8284 | 25.85 | 1.524e-22 | 2.76e-18 | 0.992 |
| TTTY15|64595 | 20.65 | 7.358e-20 | 1.33e-15 | 0.9884 |
| EIF1AY|9086 | 25.96 | 2.075e-19 | 3.76e-15 | 0.9942 |
Figure S4. Get High-res Image As an example, this figure shows the association of ZFY|7544 to 'GENDER'. P value = 1.79e-58 with T-test analysis.
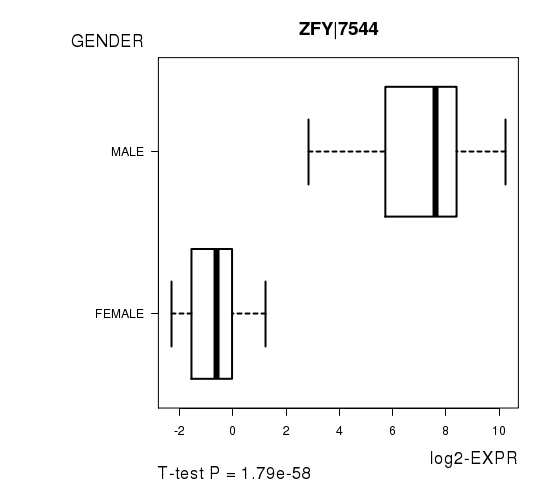
Table S9. Basic characteristics of clinical feature: 'DISTANT.METASTASIS'
| DISTANT.METASTASIS | Labels | N |
| M0 | 126 | |
| M1 | 1 | |
| M1A | 2 | |
| M1B | 2 | |
| M1C | 1 | |
| Significant markers | N = 2 |
Table S10. Get Full Table List of 2 genes differentially expressed by 'DISTANT.METASTASIS'
| ANOVA_P | Q | |
|---|---|---|
| TMEM147|10430 | 9.087e-07 | 0.0164 |
| LRRC28|123355 | 2.732e-06 | 0.0494 |
Figure S5. Get High-res Image As an example, this figure shows the association of TMEM147|10430 to 'DISTANT.METASTASIS'. P value = 9.09e-07 with ANOVA analysis.
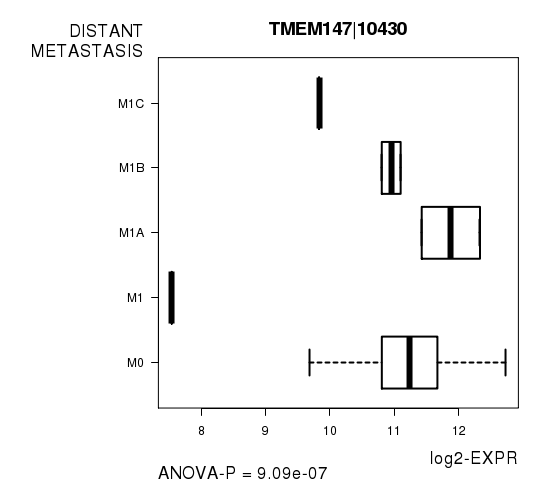
Table S11. Basic characteristics of clinical feature: 'LYMPH.NODE.METASTASIS'
| LYMPH.NODE.METASTASIS | Labels | N |
| N0 | 77 | |
| N1 | 2 | |
| N1A | 5 | |
| N1B | 12 | |
| N2 | 1 | |
| N2A | 4 | |
| N2B | 10 | |
| N2C | 4 | |
| N3 | 16 | |
| NX | 2 | |
| Significant markers | N = 8 |
Table S12. Get Full Table List of 8 genes differentially expressed by 'LYMPH.NODE.METASTASIS'
| ANOVA_P | Q | |
|---|---|---|
| IHH|3549 | 1.911e-11 | 3.46e-07 |
| C12ORF27|283460 | 1.91e-09 | 3.46e-05 |
| AMY1A|276 | 5.369e-08 | 0.000973 |
| NPAS4|266743 | 6.016e-08 | 0.00109 |
| MUC6|4588 | 7.43e-07 | 0.0135 |
| NXNL2|158046 | 1.355e-06 | 0.0246 |
| SCNN1G|6340 | 1.553e-06 | 0.0281 |
| ESR1|2099 | 2.338e-06 | 0.0424 |
Figure S6. Get High-res Image As an example, this figure shows the association of IHH|3549 to 'LYMPH.NODE.METASTASIS'. P value = 1.91e-11 with ANOVA analysis.
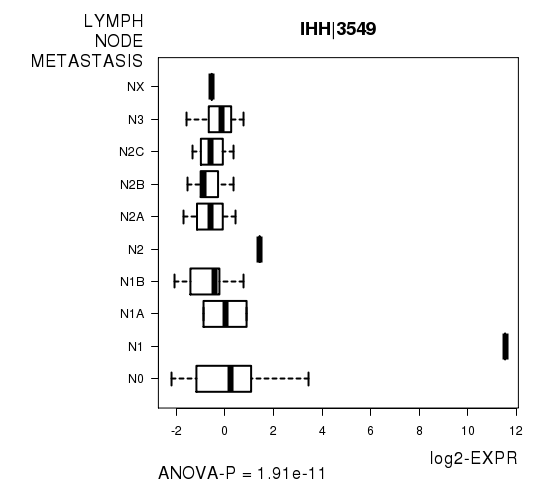
Table S13. Basic characteristics of clinical feature: 'NEOPLASM.DISEASESTAGE'
| NEOPLASM.DISEASESTAGE | Labels | N |
| I OR II NOS | 1 | |
| STAGE I | 16 | |
| STAGE IA | 8 | |
| STAGE IB | 13 | |
| STAGE II | 17 | |
| STAGE IIA | 7 | |
| STAGE IIB | 8 | |
| STAGE IIC | 4 | |
| STAGE III | 8 | |
| STAGE IIIA | 4 | |
| STAGE IIIB | 15 | |
| STAGE IIIC | 21 | |
| STAGE IV | 4 | |
| Significant markers | N = 0 |
-
Expresson data file = SKCM-Regional_Metastatic.uncv2.mRNAseq_RSEM_normalized_log2.txt
-
Clinical data file = SKCM-Regional_Metastatic.clin.merged.picked.txt
-
Number of patients = 145
-
Number of genes = 18128
-
Number of clinical features = 7
For survival clinical features, Wald's test in univariate Cox regression analysis with proportional hazards model (Andersen and Gill 1982) was used to estimate the P values using the 'coxph' function in R. Kaplan-Meier survival curves were plot using the four quartile subgroups of patients based on expression levels
For continuous numerical clinical features, Spearman's rank correlation coefficients (Spearman 1904) and two-tailed P values were estimated using 'cor.test' function in R
For two-class clinical features, two-tailed Student's t test with unequal variance (Lehmann and Romano 2005) was applied to compare the log2-expression levels between the two clinical classes using 't.test' function in R
For multi-class clinical features (ordinal or nominal), one-way analysis of variance (Howell 2002) was applied to compare the log2-expression levels between different clinical classes using 'anova' function in R
For multiple hypothesis correction, Q value is the False Discovery Rate (FDR) analogue of the P value (Benjamini and Hochberg 1995), defined as the minimum FDR at which the test may be called significant. We used the 'Benjamini and Hochberg' method of 'p.adjust' function in R to convert P values into Q values.
This is an experimental feature. The full results of the analysis summarized in this report can be downloaded from the TCGA Data Coordination Center.