(Regional_Metastatic cohort)
This pipeline uses various statistical tests to identify genes whose promoter methylation levels correlated to selected clinical features.
Testing the association between 17159 genes and 7 clinical features across 142 samples, statistically thresholded by Q value < 0.05, 7 clinical features related to at least one genes.
-
1 gene correlated to 'Time to Death'.
-
NR4A3
-
13 genes correlated to 'AGE'.
-
NUP155 , NIPAL2 , ITGA8 , HAPLN1 , STBD1 , ...
-
95 genes correlated to 'PRIMARY.SITE.OF.DISEASE'.
-
NT5M , IGSF6 , CLECL1 , LTA , ANKRD13A , ...
-
1 gene correlated to 'GENDER'.
-
UTP14C
-
309 genes correlated to 'DISTANT.METASTASIS'.
-
CCNG1 , IFT57 , FAM65C , LMF1 , POLE4 , ...
-
43 genes correlated to 'LYMPH.NODE.METASTASIS'.
-
CCDC25 , KIF20A , NGLY1 , MBIP , TMEM184B , ...
-
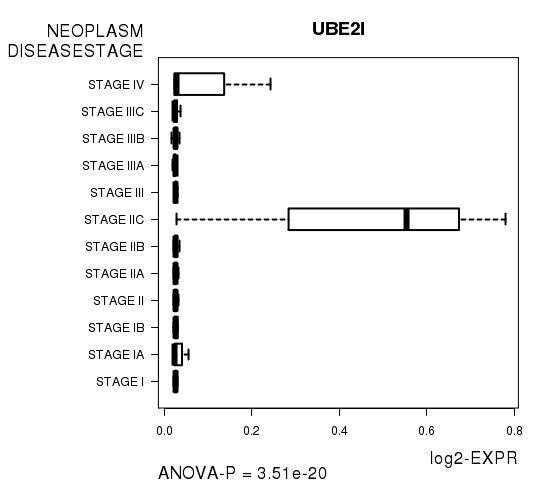
10 genes correlated to 'NEOPLASM.DISEASESTAGE'.
-
UBE2I , PIM3 , FUT11 , RAB11FIP4 , ELP2 , ...
Complete statistical result table is provided in Supplement Table 1
Table 1. Get Full Table This table shows the clinical features, statistical methods used, and the number of genes that are significantly associated with each clinical feature at Q value < 0.05.
| Clinical feature | Statistical test | Significant genes | Associated with | Associated with | ||
|---|---|---|---|---|---|---|
| Time to Death | Cox regression test | N=1 | shorter survival | N=0 | longer survival | N=1 |
| AGE | Spearman correlation test | N=13 | older | N=13 | younger | N=0 |
| PRIMARY SITE OF DISEASE | t test | N=95 | regional lymph node | N=33 | regional cutaneous or subcutaneous tissue (includes satellite and in-transit metastasis) | N=62 |
| GENDER | t test | N=1 | male | N=1 | female | N=0 |
| DISTANT METASTASIS | ANOVA test | N=309 | ||||
| LYMPH NODE METASTASIS | ANOVA test | N=43 | ||||
| NEOPLASM DISEASESTAGE | ANOVA test | N=10 |
Table S1. Basic characteristics of clinical feature: 'Time to Death'
| Time to Death | Duration (Months) | 2.6-346 (median=47.5) |
| censored | N = 74 | |
| death | N = 66 | |
| Significant markers | N = 1 | |
| associated with shorter survival | 0 | |
| associated with longer survival | 1 |
Table S2. Get Full Table List of one gene significantly associated with 'Time to Death' by Cox regression test
| HazardRatio | Wald_P | Q | C_index | |
|---|---|---|---|---|
| NR4A3 | 0.05 | 1.231e-06 | 0.021 | 0.319 |
Figure S1. Get High-res Image As an example, this figure shows the association of NR4A3 to 'Time to Death'. four curves present the cumulative survival rates of 4 quartile subsets of patients. P value = 1.23e-06 with univariate Cox regression analysis using continuous log-2 expression values.
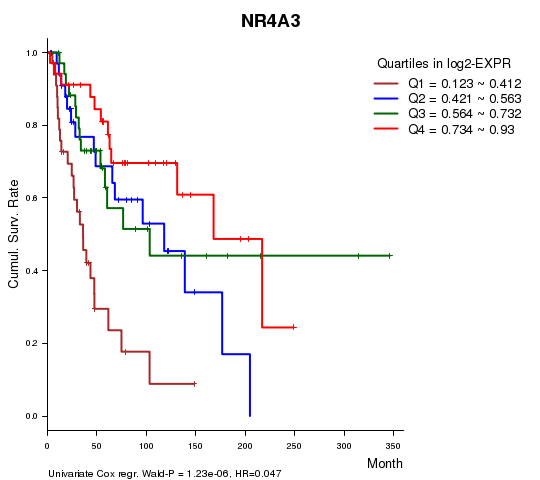
Table S3. Basic characteristics of clinical feature: 'AGE'
| AGE | Mean (SD) | 55.8 (16) |
| Significant markers | N = 13 | |
| pos. correlated | 13 | |
| neg. correlated | 0 |
Table S4. Get Full Table List of top 10 genes significantly correlated to 'AGE' by Spearman correlation test
| SpearmanCorr | corrP | Q | |
|---|---|---|---|
| NUP155 | 0.4438 | 3.169e-08 | 0.000544 |
| NIPAL2 | 0.4291 | 9.914e-08 | 0.0017 |
| ITGA8 | 0.4084 | 4.512e-07 | 0.00774 |
| HAPLN1 | 0.3992 | 8.589e-07 | 0.0147 |
| STBD1 | 0.3945 | 1.182e-06 | 0.0203 |
| FAS | 0.3935 | 1.272e-06 | 0.0218 |
| TRPV4 | 0.392 | 1.404e-06 | 0.0241 |
| POSTN | 0.3895 | 1.663e-06 | 0.0285 |
| BBX | 0.3894 | 1.673e-06 | 0.0287 |
| PTX3 | 0.3864 | 2.034e-06 | 0.0349 |
Figure S2. Get High-res Image As an example, this figure shows the association of NUP155 to 'AGE'. P value = 3.17e-08 with Spearman correlation analysis. The straight line presents the best linear regression.
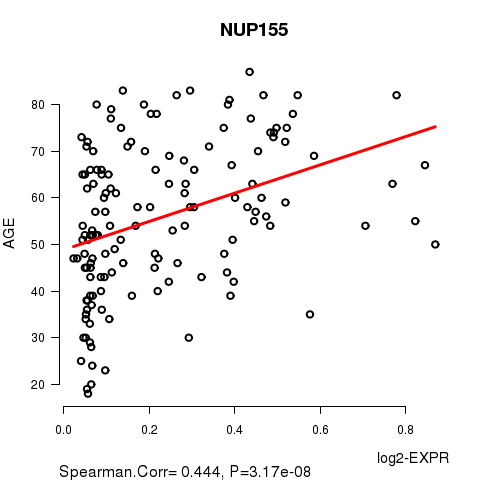
Table S5. Basic characteristics of clinical feature: 'PRIMARY.SITE.OF.DISEASE'
| PRIMARY.SITE.OF.DISEASE | Labels | N |
| REGIONAL CUTANEOUS OR SUBCUTANEOUS TISSUE (INCLUDES SATELLITE AND IN-TRANSIT METASTASIS) | 32 | |
| REGIONAL LYMPH NODE | 110 | |
| Significant markers | N = 95 | |
| Higher in REGIONAL LYMPH NODE | 33 | |
| Higher in REGIONAL CUTANEOUS OR SUBCUTANEOUS TISSUE (INCLUDES SATELLITE AND IN-TRANSIT METASTASIS) | 62 |
Table S6. Get Full Table List of top 10 genes differentially expressed by 'PRIMARY.SITE.OF.DISEASE'
| T(pos if higher in 'REGIONAL LYMPH NODE') | ttestP | Q | AUC | |
|---|---|---|---|---|
| NT5M | 7.59 | 4.503e-12 | 7.73e-08 | 0.7778 |
| IGSF6 | -7.13 | 4.971e-11 | 8.53e-07 | 0.7557 |
| CLECL1 | -6.58 | 8.669e-10 | 1.49e-05 | 0.719 |
| LTA | -6.56 | 9.814e-10 | 1.68e-05 | 0.7426 |
| ANKRD13A | -6.54 | 1.224e-09 | 2.1e-05 | 0.733 |
| ISCU | -6.63 | 1.345e-09 | 2.31e-05 | 0.7534 |
| DCLRE1C | -6.43 | 1.971e-09 | 3.38e-05 | 0.7384 |
| IL4I1 | -6.31 | 3.794e-09 | 6.51e-05 | 0.7347 |
| ABTB1 | -6.35 | 3.847e-09 | 6.6e-05 | 0.7739 |
| TAP1 | -6.29 | 9.945e-09 | 0.000171 | 0.7611 |
Figure S3. Get High-res Image As an example, this figure shows the association of NT5M to 'PRIMARY.SITE.OF.DISEASE'. P value = 4.5e-12 with T-test analysis.
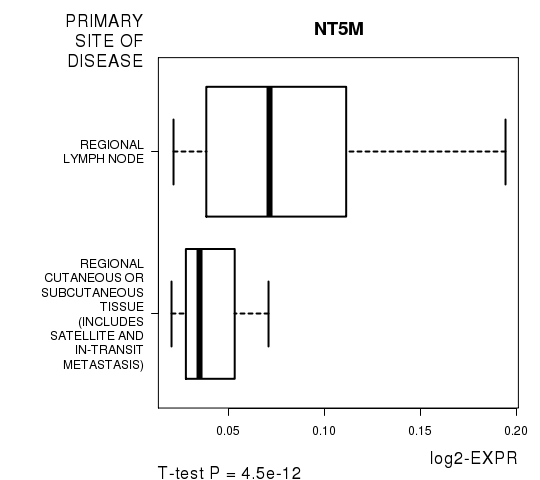
Table S7. Basic characteristics of clinical feature: 'GENDER'
| GENDER | Labels | N |
| FEMALE | 50 | |
| MALE | 92 | |
| Significant markers | N = 1 | |
| Higher in MALE | 1 | |
| Higher in FEMALE | 0 |
Table S8. Get Full Table List of one gene differentially expressed by 'GENDER'
| T(pos if higher in 'MALE') | ttestP | Q | AUC | |
|---|---|---|---|---|
| UTP14C | 10.06 | 3.89e-14 | 6.67e-10 | 0.9387 |
Figure S4. Get High-res Image As an example, this figure shows the association of UTP14C to 'GENDER'. P value = 3.89e-14 with T-test analysis.
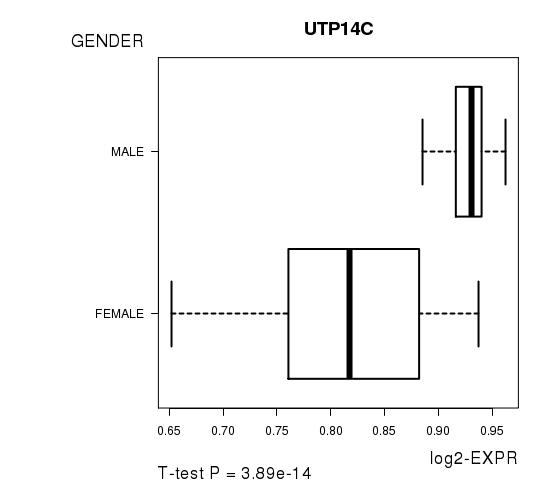
Table S9. Basic characteristics of clinical feature: 'DISTANT.METASTASIS'
| DISTANT.METASTASIS | Labels | N |
| M0 | 123 | |
| M1 | 1 | |
| M1A | 2 | |
| M1B | 2 | |
| M1C | 1 | |
| Significant markers | N = 309 |
Table S10. Get Full Table List of top 10 genes differentially expressed by 'DISTANT.METASTASIS'
| ANOVA_P | Q | |
|---|---|---|
| CCNG1 | 6.583e-116 | 1.13e-111 |
| IFT57 | 9.002e-21 | 1.54e-16 |
| FAM65C | 2.861e-20 | 4.91e-16 |
| LMF1 | 1.076e-17 | 1.85e-13 |
| POLE4 | 1.463e-17 | 2.51e-13 |
| CASC5 | 3.479e-17 | 5.97e-13 |
| COL5A1 | 3.599e-17 | 6.17e-13 |
| C10ORF88 | 4.154e-16 | 7.12e-12 |
| PXK | 4.773e-16 | 8.19e-12 |
| MAN2A1 | 5.262e-16 | 9.02e-12 |
Figure S5. Get High-res Image As an example, this figure shows the association of CCNG1 to 'DISTANT.METASTASIS'. P value = 6.58e-116 with ANOVA analysis.
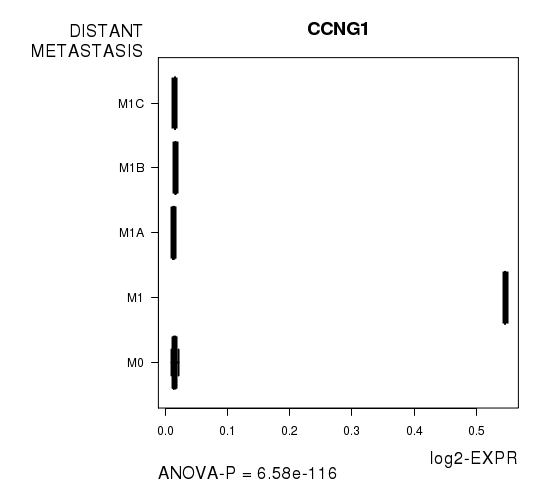
Table S11. Basic characteristics of clinical feature: 'LYMPH.NODE.METASTASIS'
| LYMPH.NODE.METASTASIS | Labels | N |
| N0 | 76 | |
| N1 | 2 | |
| N1A | 5 | |
| N1B | 11 | |
| N2 | 1 | |
| N2A | 4 | |
| N2B | 10 | |
| N2C | 4 | |
| N3 | 15 | |
| NX | 2 | |
| Significant markers | N = 43 |
Table S12. Get Full Table List of top 10 genes differentially expressed by 'LYMPH.NODE.METASTASIS'
| ANOVA_P | Q | |
|---|---|---|
| CCDC25 | 3.889e-140 | 6.67e-136 |
| KIF20A | 3.319e-67 | 5.69e-63 |
| NGLY1 | 4.605e-59 | 7.9e-55 |
| MBIP | 2.013e-56 | 3.45e-52 |
| TMEM184B | 2.829e-35 | 4.85e-31 |
| C6ORF162 | 1.001e-33 | 1.72e-29 |
| C17ORF63 | 2.596e-24 | 4.45e-20 |
| ASAP3 | 6.556e-20 | 1.12e-15 |
| NOS1 | 1.416e-18 | 2.43e-14 |
| CSRP2BP | 2.935e-18 | 5.03e-14 |
Figure S6. Get High-res Image As an example, this figure shows the association of CCDC25 to 'LYMPH.NODE.METASTASIS'. P value = 3.89e-140 with ANOVA analysis.
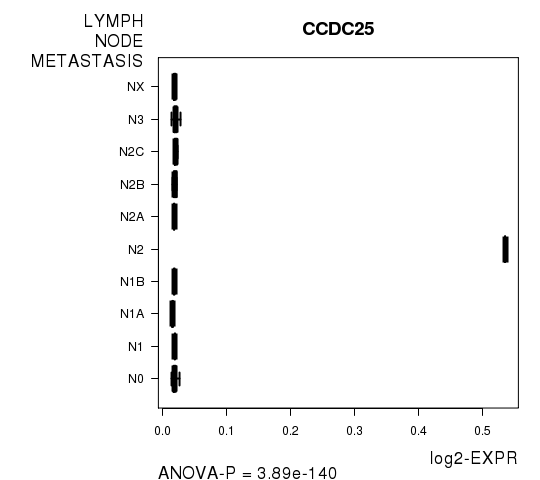
Table S13. Basic characteristics of clinical feature: 'NEOPLASM.DISEASESTAGE'
| NEOPLASM.DISEASESTAGE | Labels | N |
| STAGE I | 16 | |
| STAGE IA | 8 | |
| STAGE IB | 13 | |
| STAGE II | 17 | |
| STAGE IIA | 7 | |
| STAGE IIB | 8 | |
| STAGE IIC | 4 | |
| STAGE III | 7 | |
| STAGE IIIA | 4 | |
| STAGE IIIB | 15 | |
| STAGE IIIC | 20 | |
| STAGE IV | 4 | |
| Significant markers | N = 10 |
Table S14. Get Full Table List of 10 genes differentially expressed by 'NEOPLASM.DISEASESTAGE'
| ANOVA_P | Q | |
|---|---|---|
| UBE2I | 3.514e-20 | 6.03e-16 |
| PIM3 | 2.913e-10 | 5e-06 |
| FUT11 | 1.347e-08 | 0.000231 |
| RAB11FIP4 | 1.223e-07 | 0.0021 |
| ELP2 | 4.445e-07 | 0.00763 |
| SLC39A6 | 4.445e-07 | 0.00763 |
| JAM2 | 1.186e-06 | 0.0203 |
| MME | 1.36e-06 | 0.0233 |
| RPL38 | 1.496e-06 | 0.0257 |
| KDELC1 | 2.225e-06 | 0.0382 |
Figure S7. Get High-res Image As an example, this figure shows the association of UBE2I to 'NEOPLASM.DISEASESTAGE'. P value = 3.51e-20 with ANOVA analysis.
-
Expresson data file = SKCM-Regional_Metastatic.meth.for_correlation.filtered_data.txt
-
Clinical data file = SKCM-Regional_Metastatic.clin.merged.picked.txt
-
Number of patients = 142
-
Number of genes = 17159
-
Number of clinical features = 7
For survival clinical features, Wald's test in univariate Cox regression analysis with proportional hazards model (Andersen and Gill 1982) was used to estimate the P values using the 'coxph' function in R. Kaplan-Meier survival curves were plot using the four quartile subgroups of patients based on expression levels
For continuous numerical clinical features, Spearman's rank correlation coefficients (Spearman 1904) and two-tailed P values were estimated using 'cor.test' function in R
For two-class clinical features, two-tailed Student's t test with unequal variance (Lehmann and Romano 2005) was applied to compare the log2-expression levels between the two clinical classes using 't.test' function in R
For multi-class clinical features (ordinal or nominal), one-way analysis of variance (Howell 2002) was applied to compare the log2-expression levels between different clinical classes using 'anova' function in R
For multiple hypothesis correction, Q value is the False Discovery Rate (FDR) analogue of the P value (Benjamini and Hochberg 1995), defined as the minimum FDR at which the test may be called significant. We used the 'Benjamini and Hochberg' method of 'p.adjust' function in R to convert P values into Q values.
This is an experimental feature. The full results of the analysis summarized in this report can be downloaded from the TCGA Data Coordination Center.