(WT cohort)
This pipeline uses various statistical tests to identify mRNAs whose expression levels correlated to selected clinical features.
Testing the association between 18110 genes and 6 clinical features across 21 samples, statistically thresholded by Q value < 0.05, 4 clinical features related to at least one genes.
-
2 genes correlated to 'AGE'.
-
TRIM54|57159 , WWP2|11060
-
9 genes correlated to 'GENDER'.
-
RPS4Y1|6192 , PRKY|5616 , KDM5D|8284 , DDX3Y|8653 , USP9Y|8287 , ...
-
2 genes correlated to 'LYMPH.NODE.METASTASIS'.
-
C12ORF61|283416 , C12ORF27|283460
-
3 genes correlated to 'NEOPLASM.DISEASESTAGE'.
-
ZNF484|83744 , ZNF558|148156 , ZNF468|90333
-
No genes correlated to 'Time to Death', and 'PRIMARY.SITE.OF.DISEASE'.
Complete statistical result table is provided in Supplement Table 1
Table 1. Get Full Table This table shows the clinical features, statistical methods used, and the number of genes that are significantly associated with each clinical feature at Q value < 0.05.
| Clinical feature | Statistical test | Significant genes | Associated with | Associated with | ||
|---|---|---|---|---|---|---|
| Time to Death | Cox regression test | N=0 | ||||
| AGE | Spearman correlation test | N=2 | older | N=0 | younger | N=2 |
| PRIMARY SITE OF DISEASE | ANOVA test | N=0 | ||||
| GENDER | t test | N=9 | male | N=7 | female | N=2 |
| LYMPH NODE METASTASIS | ANOVA test | N=2 | ||||
| NEOPLASM DISEASESTAGE | ANOVA test | N=3 |
Table S1. Basic characteristics of clinical feature: 'Time to Death'
| Time to Death | Duration (Months) | 4.9-78.4 (median=13.8) |
| censored | N = 3 | |
| death | N = 9 | |
| Significant markers | N = 0 |
Table S2. Basic characteristics of clinical feature: 'AGE'
| AGE | Mean (SD) | 59.43 (14) |
| Significant markers | N = 2 | |
| pos. correlated | 0 | |
| neg. correlated | 2 |
Table S3. Get Full Table List of 2 genes significantly correlated to 'AGE' by Spearman correlation test
| SpearmanCorr | corrP | Q | |
|---|---|---|---|
| TRIM54|57159 | -0.8846 | 0 | 0 |
| WWP2|11060 | -0.8391 | 1.995e-06 | 0.0361 |
Figure S1. Get High-res Image As an example, this figure shows the association of TRIM54|57159 to 'AGE'. P value = 0 with Spearman correlation analysis. The straight line presents the best linear regression.
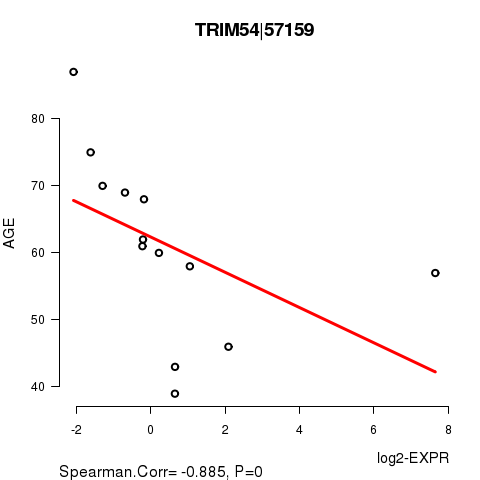
Table S4. Basic characteristics of clinical feature: 'PRIMARY.SITE.OF.DISEASE'
| PRIMARY.SITE.OF.DISEASE | Labels | N |
| DISTANT METASTASIS | 3 | |
| REGIONAL CUTANEOUS OR SUBCUTANEOUS TISSUE (INCLUDES SATELLITE AND IN-TRANSIT METASTASIS) | 4 | |
| REGIONAL LYMPH NODE | 14 | |
| Significant markers | N = 0 |
Table S5. Basic characteristics of clinical feature: 'GENDER'
| GENDER | Labels | N |
| FEMALE | 11 | |
| MALE | 10 | |
| Significant markers | N = 9 | |
| Higher in MALE | 7 | |
| Higher in FEMALE | 2 |
Table S6. Get Full Table List of 9 genes differentially expressed by 'GENDER'
| T(pos if higher in 'MALE') | ttestP | Q | AUC | |
|---|---|---|---|---|
| RPS4Y1|6192 | 13.49 | 7.546e-10 | 1.36e-05 | 1 |
| PRKY|5616 | 12.2 | 1.427e-09 | 2.57e-05 | 1 |
| KDM5D|8284 | 16.05 | 2.512e-09 | 4.52e-05 | 1 |
| DDX3Y|8653 | 14.27 | 3.078e-09 | 5.53e-05 | 1 |
| USP9Y|8287 | 17.13 | 3.233e-09 | 5.81e-05 | 1 |
| ZFY|7544 | 11.85 | 1.172e-08 | 0.000211 | 1 |
| TSIX|9383 | -8.18 | 2.614e-07 | 0.0047 | 1 |
| UTY|7404 | 11.13 | 8.731e-07 | 0.0157 | 1 |
| XIST|7503 | -7.53 | 1.814e-06 | 0.0326 | 1 |
Figure S2. Get High-res Image As an example, this figure shows the association of RPS4Y1|6192 to 'GENDER'. P value = 7.55e-10 with T-test analysis.
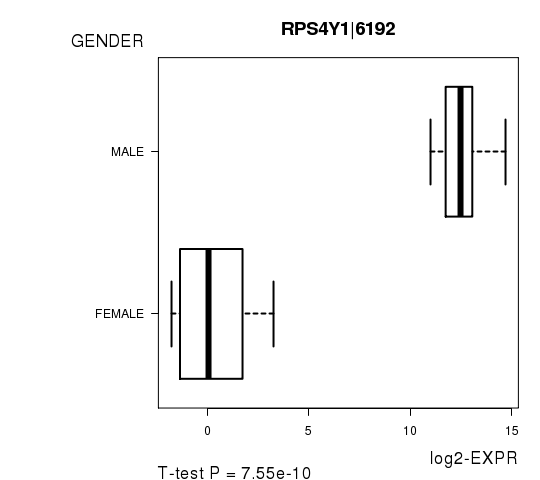
Table S7. Basic characteristics of clinical feature: 'LYMPH.NODE.METASTASIS'
| LYMPH.NODE.METASTASIS | Labels | N |
| N0 | 11 | |
| N1 | 1 | |
| N1A | 1 | |
| N1B | 3 | |
| N2B | 1 | |
| N3 | 2 | |
| Significant markers | N = 2 |
Table S8. Get Full Table List of 2 genes differentially expressed by 'LYMPH.NODE.METASTASIS'
| ANOVA_P | Q | |
|---|---|---|
| C12ORF61|283416 | 2.362e-07 | 0.00428 |
| C12ORF27|283460 | 1.064e-06 | 0.0193 |
Figure S3. Get High-res Image As an example, this figure shows the association of C12ORF61|283416 to 'LYMPH.NODE.METASTASIS'. P value = 2.36e-07 with ANOVA analysis.
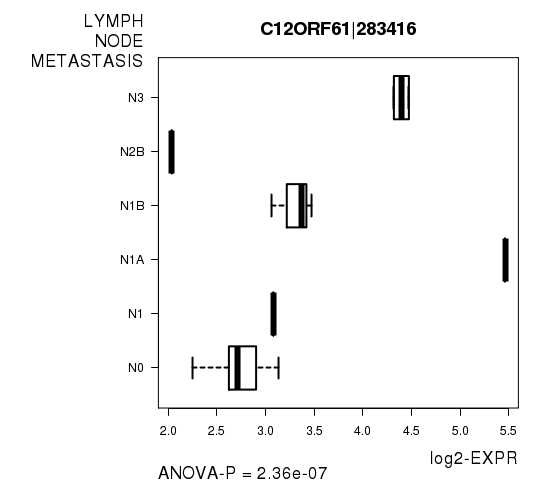
Table S9. Basic characteristics of clinical feature: 'NEOPLASM.DISEASESTAGE'
| NEOPLASM.DISEASESTAGE | Labels | N |
| STAGE I | 4 | |
| STAGE IA | 1 | |
| STAGE II | 1 | |
| STAGE IIB | 2 | |
| STAGE IIC | 3 | |
| STAGE III | 1 | |
| STAGE IIIA | 1 | |
| STAGE IIIB | 1 | |
| STAGE IIIC | 4 | |
| Significant markers | N = 3 |
Table S10. Get Full Table List of 3 genes differentially expressed by 'NEOPLASM.DISEASESTAGE'
| ANOVA_P | Q | |
|---|---|---|
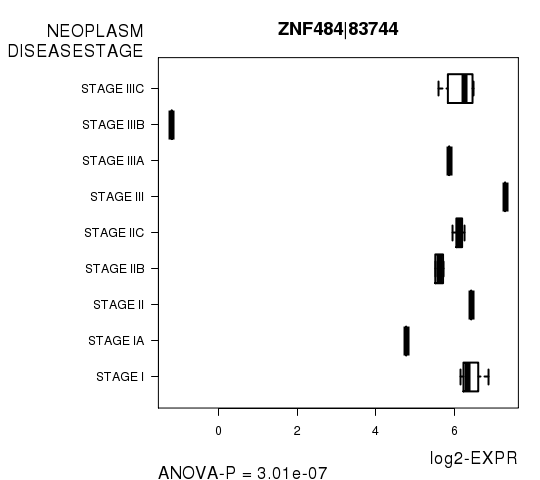
| ZNF484|83744 | 3.012e-07 | 0.00544 |
| ZNF558|148156 | 3.506e-07 | 0.00633 |
| ZNF468|90333 | 6.185e-07 | 0.0112 |
Figure S4. Get High-res Image As an example, this figure shows the association of ZNF484|83744 to 'NEOPLASM.DISEASESTAGE'. P value = 3.01e-07 with ANOVA analysis.
-
Expresson data file = SKCM-WT.uncv2.mRNAseq_RSEM_normalized_log2.txt
-
Clinical data file = SKCM-WT.clin.merged.picked.txt
-
Number of patients = 21
-
Number of genes = 18110
-
Number of clinical features = 6
For survival clinical features, Wald's test in univariate Cox regression analysis with proportional hazards model (Andersen and Gill 1982) was used to estimate the P values using the 'coxph' function in R. Kaplan-Meier survival curves were plot using the four quartile subgroups of patients based on expression levels
For continuous numerical clinical features, Spearman's rank correlation coefficients (Spearman 1904) and two-tailed P values were estimated using 'cor.test' function in R
For multi-class clinical features (ordinal or nominal), one-way analysis of variance (Howell 2002) was applied to compare the log2-expression levels between different clinical classes using 'anova' function in R
For two-class clinical features, two-tailed Student's t test with unequal variance (Lehmann and Romano 2005) was applied to compare the log2-expression levels between the two clinical classes using 't.test' function in R
For multiple hypothesis correction, Q value is the False Discovery Rate (FDR) analogue of the P value (Benjamini and Hochberg 1995), defined as the minimum FDR at which the test may be called significant. We used the 'Benjamini and Hochberg' method of 'p.adjust' function in R to convert P values into Q values.
This is an experimental feature. The full results of the analysis summarized in this report can be downloaded from the TCGA Data Coordination Center.