(WT cohort)
This pipeline uses various statistical tests to identify genes whose promoter methylation levels correlated to selected clinical features.
Testing the association between 17162 genes and 6 clinical features across 18 samples, statistically thresholded by Q value < 0.05, 3 clinical features related to at least one genes.
-
2 genes correlated to 'PRIMARY.SITE.OF.DISEASE'.
-
FAP , SLC4A10
-
100 genes correlated to 'LYMPH.NODE.METASTASIS'.
-
VSTM2B , FAHD2B , STARD4 , FOXC2 , CHRNB2 , ...
-
111 genes correlated to 'NEOPLASM.DISEASESTAGE'.
-
HSPA1B , SLC25A39 , GPR142 , VSTM2B , C18ORF18 , ...
-
No genes correlated to 'Time to Death', 'AGE', and 'GENDER'.
Complete statistical result table is provided in Supplement Table 1
Table 1. Get Full Table This table shows the clinical features, statistical methods used, and the number of genes that are significantly associated with each clinical feature at Q value < 0.05.
| Clinical feature | Statistical test | Significant genes | Associated with | Associated with | ||
|---|---|---|---|---|---|---|
| Time to Death | Cox regression test | N=0 | ||||
| AGE | Spearman correlation test | N=0 | ||||
| PRIMARY SITE OF DISEASE | ANOVA test | N=2 | ||||
| GENDER | t test | N=0 | ||||
| LYMPH NODE METASTASIS | ANOVA test | N=100 | ||||
| NEOPLASM DISEASESTAGE | ANOVA test | N=111 |
Table S1. Basic characteristics of clinical feature: 'Time to Death'
| Time to Death | Duration (Months) | 4.9-78.4 (median=13) |
| censored | N = 2 | |
| death | N = 7 | |
| Significant markers | N = 0 |
Table S2. Basic characteristics of clinical feature: 'AGE'
| AGE | Mean (SD) | 58.5 (15) |
| Significant markers | N = 0 |
Table S3. Basic characteristics of clinical feature: 'PRIMARY.SITE.OF.DISEASE'
| PRIMARY.SITE.OF.DISEASE | Labels | N |
| DISTANT METASTASIS | 3 | |
| REGIONAL CUTANEOUS OR SUBCUTANEOUS TISSUE (INCLUDES SATELLITE AND IN-TRANSIT METASTASIS) | 3 | |
| REGIONAL LYMPH NODE | 12 | |
| Significant markers | N = 2 |
Table S4. Get Full Table List of 2 genes differentially expressed by 'PRIMARY.SITE.OF.DISEASE'
| ANOVA_P | Q | |
|---|---|---|
| FAP | 2.117e-06 | 0.0363 |
| SLC4A10 | 2.783e-06 | 0.0478 |
Figure S1. Get High-res Image As an example, this figure shows the association of FAP to 'PRIMARY.SITE.OF.DISEASE'. P value = 2.12e-06 with ANOVA analysis.
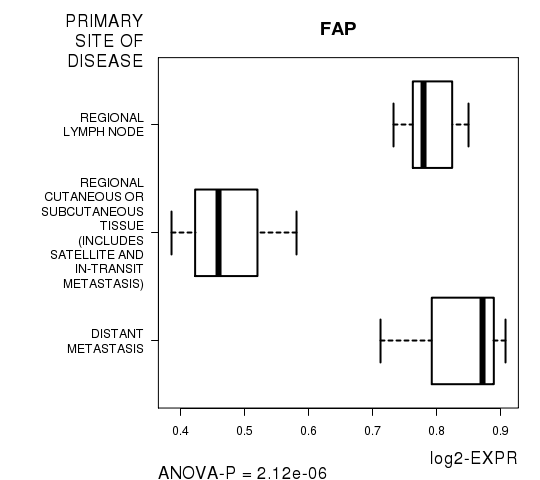
Table S5. Basic characteristics of clinical feature: 'GENDER'
| GENDER | Labels | N |
| FEMALE | 9 | |
| MALE | 9 | |
| Significant markers | N = 0 |
Table S6. Basic characteristics of clinical feature: 'LYMPH.NODE.METASTASIS'
| LYMPH.NODE.METASTASIS | Labels | N |
| N0 | 9 | |
| N1 | 1 | |
| N1A | 1 | |
| N1B | 3 | |
| N2B | 1 | |
| N3 | 1 | |
| Significant markers | N = 100 |
Table S7. Get Full Table List of top 10 genes differentially expressed by 'LYMPH.NODE.METASTASIS'
| ANOVA_P | Q | |
|---|---|---|
| VSTM2B | 4.344e-18 | 7.45e-14 |
| FAHD2B | 4.316e-17 | 7.41e-13 |
| STARD4 | 2.526e-16 | 4.34e-12 |
| FOXC2 | 2.693e-13 | 4.62e-09 |
| CHRNB2 | 4.69e-13 | 8.05e-09 |
| CPNE8 | 4.958e-13 | 8.51e-09 |
| PUS3 | 6.23e-13 | 1.07e-08 |
| FAM53B | 6.821e-13 | 1.17e-08 |
| MGC12982 | 8.858e-13 | 1.52e-08 |
| GAB4 | 9.716e-13 | 1.67e-08 |
Figure S2. Get High-res Image As an example, this figure shows the association of VSTM2B to 'LYMPH.NODE.METASTASIS'. P value = 4.34e-18 with ANOVA analysis.
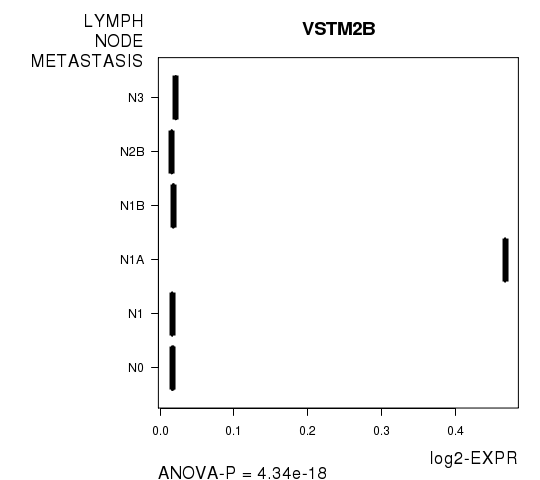
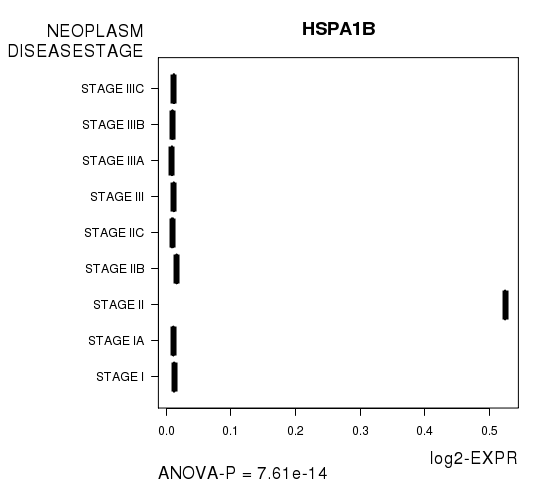
Table S8. Basic characteristics of clinical feature: 'NEOPLASM.DISEASESTAGE'
| NEOPLASM.DISEASESTAGE | Labels | N |
| STAGE I | 4 | |
| STAGE IA | 1 | |
| STAGE II | 1 | |
| STAGE IIB | 1 | |
| STAGE IIC | 2 | |
| STAGE III | 1 | |
| STAGE IIIA | 1 | |
| STAGE IIIB | 1 | |
| STAGE IIIC | 3 | |
| Significant markers | N = 111 |
Table S9. Get Full Table List of top 10 genes differentially expressed by 'NEOPLASM.DISEASESTAGE'
| ANOVA_P | Q | |
|---|---|---|
| HSPA1B | 7.606e-14 | 1.31e-09 |
| SLC25A39 | 1.033e-12 | 1.77e-08 |
| GPR142 | 3.061e-12 | 5.25e-08 |
| VSTM2B | 2.762e-11 | 4.74e-07 |
| C18ORF18 | 3.094e-11 | 5.31e-07 |
| TDRD12 | 4.913e-11 | 8.43e-07 |
| COMP | 6.938e-11 | 1.19e-06 |
| ZNF701 | 2.333e-10 | 4e-06 |
| LOC145783 | 2.633e-10 | 4.52e-06 |
| FAM57B | 2.711e-10 | 4.65e-06 |
Figure S3. Get High-res Image As an example, this figure shows the association of HSPA1B to 'NEOPLASM.DISEASESTAGE'. P value = 7.61e-14 with ANOVA analysis.
-
Expresson data file = SKCM-WT.meth.for_correlation.filtered_data.txt
-
Clinical data file = SKCM-WT.clin.merged.picked.txt
-
Number of patients = 18
-
Number of genes = 17162
-
Number of clinical features = 6
For survival clinical features, Wald's test in univariate Cox regression analysis with proportional hazards model (Andersen and Gill 1982) was used to estimate the P values using the 'coxph' function in R. Kaplan-Meier survival curves were plot using the four quartile subgroups of patients based on expression levels
For continuous numerical clinical features, Spearman's rank correlation coefficients (Spearman 1904) and two-tailed P values were estimated using 'cor.test' function in R
For multi-class clinical features (ordinal or nominal), one-way analysis of variance (Howell 2002) was applied to compare the log2-expression levels between different clinical classes using 'anova' function in R
For two-class clinical features, two-tailed Student's t test with unequal variance (Lehmann and Romano 2005) was applied to compare the log2-expression levels between the two clinical classes using 't.test' function in R
For multiple hypothesis correction, Q value is the False Discovery Rate (FDR) analogue of the P value (Benjamini and Hochberg 1995), defined as the minimum FDR at which the test may be called significant. We used the 'Benjamini and Hochberg' method of 'p.adjust' function in R to convert P values into Q values.
This is an experimental feature. The full results of the analysis summarized in this report can be downloaded from the TCGA Data Coordination Center.