(WT cohort)
This pipeline computes the correlation between significant arm-level copy number variations (cnvs) and subtypes.
Testing the association between copy number variation 55 arm-level results and 8 molecular subtypes across 35 patients, 2 significant findings detected with Q value < 0.25.
-
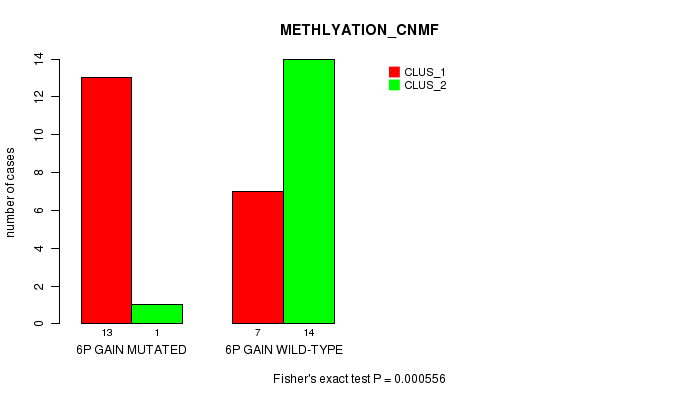
6p gain cnv correlated to 'METHLYATION_CNMF'.
-
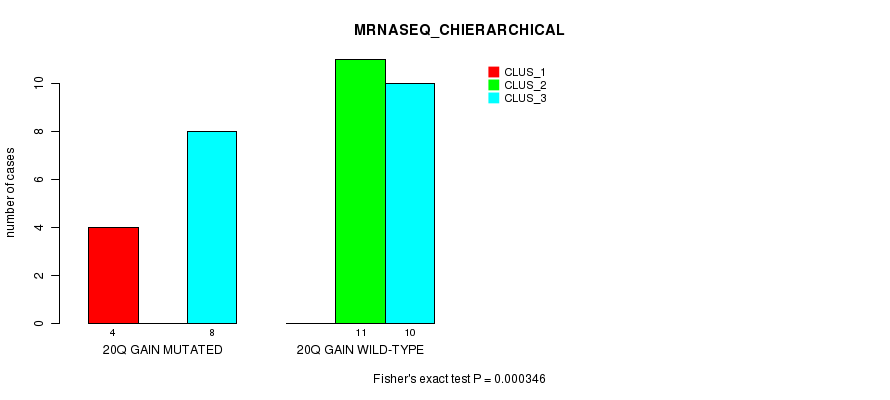
20q gain cnv correlated to 'MRNASEQ_CHIERARCHICAL'.
Table 1. Get Full Table Overview of the association between significant copy number variation of 55 arm-level results and 8 molecular subtypes. Shown in the table are P values (Q values). Thresholded by Q value < 0.25, 2 significant findings detected.
|
Molecular subtypes |
CN CNMF |
METHLYATION CNMF |
RPPA CNMF |
RPPA CHIERARCHICAL |
MRNASEQ CNMF |
MRNASEQ CHIERARCHICAL |
MIRSEQ CNMF |
MIRSEQ CHIERARCHICAL |
||
| nCNV (%) | nWild-Type | Fisher's exact test | Fisher's exact test | Fisher's exact test | Fisher's exact test | Fisher's exact test | Fisher's exact test | Fisher's exact test | Fisher's exact test | |
| 6p gain | 14 (40%) | 21 |
0.0153 (1.00) |
0.000556 (0.229) |
0.197 (1.00) |
0.257 (1.00) |
0.0328 (1.00) |
0.13 (1.00) |
0.079 (1.00) |
0.0167 (1.00) |
| 20q gain | 12 (34%) | 23 |
0.289 (1.00) |
0.163 (1.00) |
0.653 (1.00) |
0.0839 (1.00) |
0.022 (1.00) |
0.000346 (0.142) |
0.271 (1.00) |
1 (1.00) |
| 1p gain | 4 (11%) | 31 |
0.603 (1.00) |
0.619 (1.00) |
1 (1.00) |
0.284 (1.00) |
0.215 (1.00) |
1 (1.00) |
0.828 (1.00) |
|
| 1q gain | 12 (34%) | 23 |
0.0116 (1.00) |
0.034 (1.00) |
0.642 (1.00) |
0.57 (1.00) |
0.249 (1.00) |
0.5 (1.00) |
0.152 (1.00) |
0.0489 (1.00) |
| 2p gain | 3 (9%) | 32 |
1 (1.00) |
1 (1.00) |
0.479 (1.00) |
0.284 (1.00) |
0.51 (1.00) |
0.238 (1.00) |
0.515 (1.00) |
|
| 3p gain | 3 (9%) | 32 |
0.229 (1.00) |
0.244 (1.00) |
0.479 (1.00) |
0.523 (1.00) |
1 (1.00) |
0.757 (1.00) |
||
| 3q gain | 4 (11%) | 31 |
0.603 (1.00) |
0.619 (1.00) |
1 (1.00) |
0.754 (1.00) |
0.284 (1.00) |
0.215 (1.00) |
1 (1.00) |
1 (1.00) |
| 4p gain | 8 (23%) | 27 |
0.0408 (1.00) |
0.101 (1.00) |
0.157 (1.00) |
0.0291 (1.00) |
1 (1.00) |
0.226 (1.00) |
0.0529 (1.00) |
0.0845 (1.00) |
| 4q gain | 4 (11%) | 31 |
0.104 (1.00) |
0.119 (1.00) |
0.218 (1.00) |
0.00877 (1.00) |
1 (1.00) |
0.575 (1.00) |
0.113 (1.00) |
0.293 (1.00) |
| 5p gain | 4 (11%) | 31 |
0.104 (1.00) |
0.119 (1.00) |
0.479 (1.00) |
1 (1.00) |
1 (1.00) |
0.238 (1.00) |
0.0919 (1.00) |
|
| 5q gain | 4 (11%) | 31 |
0.104 (1.00) |
0.119 (1.00) |
0.479 (1.00) |
1 (1.00) |
1 (1.00) |
0.238 (1.00) |
0.0919 (1.00) |
|
| 6q gain | 3 (9%) | 32 |
0.603 (1.00) |
0.244 (1.00) |
1 (1.00) |
0.0886 (1.00) |
1 (1.00) |
1 (1.00) |
0.238 (1.00) |
0.0919 (1.00) |
| 7p gain | 10 (29%) | 25 |
0.711 (1.00) |
0.458 (1.00) |
1 (1.00) |
0.848 (1.00) |
0.71 (1.00) |
0.00816 (1.00) |
0.24 (1.00) |
0.886 (1.00) |
| 7q gain | 9 (26%) | 26 |
1 (1.00) |
0.7 (1.00) |
1 (1.00) |
0.848 (1.00) |
1 (1.00) |
0.00475 (1.00) |
0.257 (1.00) |
0.681 (1.00) |
| 8p gain | 8 (23%) | 27 |
0.228 (1.00) |
0.101 (1.00) |
1 (1.00) |
0.503 (1.00) |
0.0319 (1.00) |
0.0618 (1.00) |
0.1 (1.00) |
0.681 (1.00) |
| 8q gain | 11 (31%) | 24 |
0.0275 (1.00) |
0.00947 (1.00) |
0.642 (1.00) |
0.334 (1.00) |
0.00498 (1.00) |
0.0153 (1.00) |
0.718 (1.00) |
0.207 (1.00) |
| 12p gain | 4 (11%) | 31 |
1 (1.00) |
0.619 (1.00) |
1 (1.00) |
0.503 (1.00) |
0.271 (1.00) |
0.314 (1.00) |
1 (1.00) |
0.515 (1.00) |
| 12q gain | 3 (9%) | 32 |
0.603 (1.00) |
1 (1.00) |
0.566 (1.00) |
1 (1.00) |
0.284 (1.00) |
0.215 (1.00) |
0.571 (1.00) |
0.515 (1.00) |
| 13q gain | 3 (9%) | 32 |
0.603 (1.00) |
0.244 (1.00) |
0.189 (1.00) |
1 (1.00) |
1 (1.00) |
1 (1.00) |
0.757 (1.00) |
|
| 15q gain | 4 (11%) | 31 |
0.603 (1.00) |
0.119 (1.00) |
0.479 (1.00) |
1 (1.00) |
1 (1.00) |
0.238 (1.00) |
0.515 (1.00) |
|
| 17q gain | 5 (14%) | 30 |
0.0455 (1.00) |
0.057 (1.00) |
0.218 (1.00) |
0.22 (1.00) |
0.63 (1.00) |
0.811 (1.00) |
0.113 (1.00) |
0.0249 (1.00) |
| 18p gain | 8 (23%) | 27 |
0.228 (1.00) |
0.419 (1.00) |
0.157 (1.00) |
0.334 (1.00) |
0.0299 (1.00) |
0.0363 (1.00) |
1 (1.00) |
0.467 (1.00) |
| 18q gain | 4 (11%) | 31 |
0.603 (1.00) |
0.619 (1.00) |
1 (1.00) |
0.15 (1.00) |
0.271 (1.00) |
0.0576 (1.00) |
1 (1.00) |
0.293 (1.00) |
| 19q gain | 3 (9%) | 32 |
1 (1.00) |
1 (1.00) |
0.479 (1.00) |
0.523 (1.00) |
1 (1.00) |
0.515 (1.00) |
||
| 20p gain | 10 (29%) | 25 |
0.264 (1.00) |
0.134 (1.00) |
0.406 (1.00) |
0.0219 (1.00) |
0.0545 (1.00) |
0.00489 (1.00) |
0.24 (1.00) |
0.715 (1.00) |
| 21q gain | 5 (14%) | 30 |
0.338 (1.00) |
0.057 (1.00) |
1 (1.00) |
0.00877 (1.00) |
0.63 (1.00) |
0.811 (1.00) |
1 (1.00) |
0.583 (1.00) |
| 22q gain | 7 (20%) | 28 |
0.0877 (1.00) |
0.199 (1.00) |
0.319 (1.00) |
0.22 (1.00) |
0.0648 (1.00) |
0.0576 (1.00) |
1 (1.00) |
0.444 (1.00) |
| 1p loss | 4 (11%) | 31 |
0.603 (1.00) |
0.119 (1.00) |
1 (1.00) |
0.271 (1.00) |
0.314 (1.00) |
0.299 (1.00) |
1 (1.00) |
|
| 2p loss | 4 (11%) | 31 |
0.603 (1.00) |
1 (1.00) |
0.479 (1.00) |
0.61 (1.00) |
0.41 (1.00) |
0.113 (1.00) |
0.515 (1.00) |
|
| 2q loss | 5 (14%) | 30 |
0.338 (1.00) |
1 (1.00) |
0.479 (1.00) |
1 (1.00) |
0.66 (1.00) |
0.0526 (1.00) |
0.243 (1.00) |
|
| 4p loss | 4 (11%) | 31 |
0.603 (1.00) |
0.119 (1.00) |
1 (1.00) |
0.271 (1.00) |
0.234 (1.00) |
0.613 (1.00) |
0.293 (1.00) |
|
| 4q loss | 3 (9%) | 32 |
0.229 (1.00) |
0.244 (1.00) |
0.284 (1.00) |
0.51 (1.00) |
0.187 (1.00) |
|||
| 6p loss | 4 (11%) | 31 |
0.603 (1.00) |
1 (1.00) |
1 (1.00) |
1 (1.00) |
0.575 (1.00) |
0.613 (1.00) |
0.828 (1.00) |
|
| 6q loss | 9 (26%) | 26 |
0.121 (1.00) |
0.7 (1.00) |
0.642 (1.00) |
1 (1.00) |
0.107 (1.00) |
0.139 (1.00) |
0.257 (1.00) |
0.599 (1.00) |
| 8p loss | 3 (9%) | 32 |
0.229 (1.00) |
0.244 (1.00) |
0.479 (1.00) |
0.284 (1.00) |
0.51 (1.00) |
0.492 (1.00) |
||
| 9p loss | 14 (40%) | 21 |
0.733 (1.00) |
0.728 (1.00) |
0.67 (1.00) |
0.844 (1.00) |
0.486 (1.00) |
0.323 (1.00) |
0.079 (1.00) |
0.228 (1.00) |
| 9q loss | 10 (29%) | 25 |
0.711 (1.00) |
1 (1.00) |
0.642 (1.00) |
1 (1.00) |
0.71 (1.00) |
0.104 (1.00) |
0.24 (1.00) |
0.167 (1.00) |
| 10p loss | 15 (43%) | 20 |
0.176 (1.00) |
0.492 (1.00) |
1 (1.00) |
0.169 (1.00) |
0.16 (1.00) |
0.0947 (1.00) |
0.495 (1.00) |
0.0489 (1.00) |
| 10q loss | 13 (37%) | 22 |
0.489 (1.00) |
0.737 (1.00) |
1 (1.00) |
0.0542 (1.00) |
0.278 (1.00) |
0.12 (1.00) |
0.476 (1.00) |
0.365 (1.00) |
| 11p loss | 9 (26%) | 26 |
0.443 (1.00) |
0.7 (1.00) |
0.642 (1.00) |
0.334 (1.00) |
0.107 (1.00) |
0.175 (1.00) |
0.697 (1.00) |
0.0558 (1.00) |
| 11q loss | 11 (31%) | 24 |
0.146 (1.00) |
0.0693 (1.00) |
0.197 (1.00) |
0.00799 (1.00) |
0.00207 (0.848) |
0.00946 (1.00) |
0.451 (1.00) |
0.413 (1.00) |
| 12p loss | 3 (9%) | 32 |
0.229 (1.00) |
0.244 (1.00) |
0.479 (1.00) |
0.284 (1.00) |
0.215 (1.00) |
0.492 (1.00) |
||
| 12q loss | 4 (11%) | 31 |
0.603 (1.00) |
0.619 (1.00) |
0.218 (1.00) |
0.435 (1.00) |
0.271 (1.00) |
0.314 (1.00) |
0.613 (1.00) |
0.293 (1.00) |
| 13q loss | 6 (17%) | 29 |
0.658 (1.00) |
0.68 (1.00) |
0.591 (1.00) |
0.503 (1.00) |
1 (1.00) |
0.218 (1.00) |
0.196 (1.00) |
0.654 (1.00) |
| 14q loss | 5 (14%) | 30 |
1 (1.00) |
0.365 (1.00) |
0.591 (1.00) |
1 (1.00) |
0.63 (1.00) |
0.811 (1.00) |
1 (1.00) |
0.583 (1.00) |
| 15q loss | 3 (9%) | 32 |
1 (1.00) |
1 (1.00) |
0.479 (1.00) |
0.284 (1.00) |
0.51 (1.00) |
1 (1.00) |
0.515 (1.00) |
|
| 16p loss | 5 (14%) | 30 |
0.338 (1.00) |
1 (1.00) |
1 (1.00) |
0.63 (1.00) |
0.811 (1.00) |
0.613 (1.00) |
0.828 (1.00) |
|
| 16q loss | 8 (23%) | 27 |
0.691 (1.00) |
0.419 (1.00) |
1 (1.00) |
1 (1.00) |
0.678 (1.00) |
0.855 (1.00) |
0.104 (1.00) |
0.654 (1.00) |
| 17p loss | 3 (9%) | 32 |
1 (1.00) |
1 (1.00) |
1 (1.00) |
1 (1.00) |
1 (1.00) |
0.215 (1.00) |
0.238 (1.00) |
0.515 (1.00) |
| 17q loss | 3 (9%) | 32 |
0.603 (1.00) |
1 (1.00) |
0.566 (1.00) |
1 (1.00) |
1 (1.00) |
0.215 (1.00) |
1 (1.00) |
1 (1.00) |
| 18p loss | 3 (9%) | 32 |
0.603 (1.00) |
0.565 (1.00) |
0.189 (1.00) |
1 (1.00) |
0.0326 (1.00) |
1 (1.00) |
0.294 (1.00) |
|
| 18q loss | 4 (11%) | 31 |
1 (1.00) |
1 (1.00) |
0.566 (1.00) |
0.582 (1.00) |
1 (1.00) |
0.0576 (1.00) |
0.613 (1.00) |
0.828 (1.00) |
| 19q loss | 3 (9%) | 32 |
1 (1.00) |
1 (1.00) |
1 (1.00) |
0.284 (1.00) |
0.0326 (1.00) |
0.571 (1.00) |
1 (1.00) |
|
| 21q loss | 5 (14%) | 30 |
1 (1.00) |
0.631 (1.00) |
1 (1.00) |
0.798 (1.00) |
1 (1.00) |
0.168 (1.00) |
0.355 (1.00) |
0.487 (1.00) |
| 22q loss | 3 (9%) | 32 |
1 (1.00) |
0.244 (1.00) |
0.479 (1.00) |
1 (1.00) |
1 (1.00) |
0.492 (1.00) |
P value = 0.000556 (Fisher's exact test), Q value = 0.23
Table S1. Gene #10: '6p gain mutation analysis' versus Clinical Feature #2: 'METHLYATION_CNMF'
| nPatients | CLUS_1 | CLUS_2 |
|---|---|---|
| ALL | 20 | 15 |
| 6P GAIN MUTATED | 13 | 1 |
| 6P GAIN WILD-TYPE | 7 | 14 |
Figure S1. Get High-res Image Gene #10: '6p gain mutation analysis' versus Clinical Feature #2: 'METHLYATION_CNMF'
P value = 0.000346 (Fisher's exact test), Q value = 0.14
Table S2. Gene #25: '20q gain mutation analysis' versus Clinical Feature #6: 'MRNASEQ_CHIERARCHICAL'
| nPatients | CLUS_1 | CLUS_2 | CLUS_3 |
|---|---|---|---|
| ALL | 4 | 11 | 18 |
| 20Q GAIN MUTATED | 4 | 0 | 8 |
| 20Q GAIN WILD-TYPE | 0 | 11 | 10 |
Figure S2. Get High-res Image Gene #25: '20q gain mutation analysis' versus Clinical Feature #6: 'MRNASEQ_CHIERARCHICAL'
-
Mutation data file = broad_values_by_arm.mutsig.cluster.txt
-
Molecular subtypes file = SKCM-WT.transferedmergedcluster.txt
-
Number of patients = 35
-
Number of significantly arm-level cnvs = 55
-
Number of molecular subtypes = 8
-
Exclude genes that fewer than K tumors have mutations, K = 3
For binary or multi-class clinical features (nominal or ordinal), two-tailed Fisher's exact tests (Fisher 1922) were used to estimate the P values using the 'fisher.test' function in R
For multiple hypothesis correction, Q value is the False Discovery Rate (FDR) analogue of the P value (Benjamini and Hochberg 1995), defined as the minimum FDR at which the test may be called significant. We used the 'Benjamini and Hochberg' method of 'p.adjust' function in R to convert P values into Q values.
This is an experimental feature. The full results of the analysis summarized in this report can be downloaded from the TCGA Data Coordination Center.