This pipeline uses various statistical tests to identify RPPAs whose expression levels correlated to selected clinical features.
Testing the association between 175 genes and 5 clinical features across 155 samples, statistically thresholded by Q value < 0.05, 4 clinical features related to at least one genes.
-
18 genes correlated to 'AGE'.
-
SNAI2|SNAIL-M-C , AKT1 AKT2 AKT3|AKT_PS473-R-V , EEF2|EEF2-R-V , EGFR|EGFR_PY1068-R-V , PIK3R1|PI3K-P85-R-V , ...
-
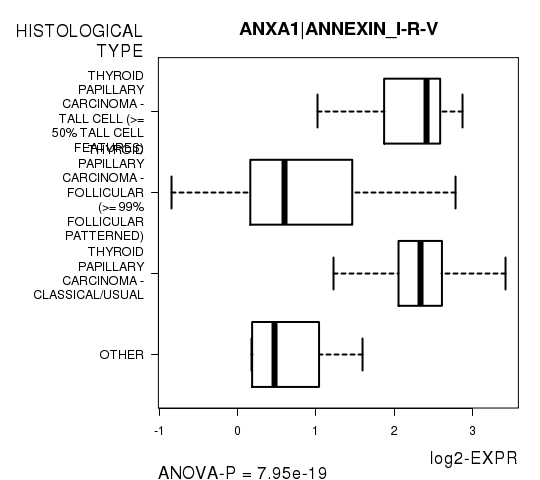
46 genes correlated to 'HISTOLOGICAL.TYPE'.
-
ANXA1|ANNEXIN_I-R-V , FN1|FIBRONECTIN-R-C , CHEK2|CHK2-M-C , IRS1|IRS1-R-V , C12ORF5|TIGAR-R-V , ...
-
8 genes correlated to 'RADIATIONS.RADIATION.REGIMENINDICATION'.
-
ERBB2|HER2_PY1248-R-V , ARID1A|ARID1A-M-V , WWTR1|TAZ_PS89-R-C , CDKN1B|P27_PT157-R-C , MET|C-MET-M-C , ...
-
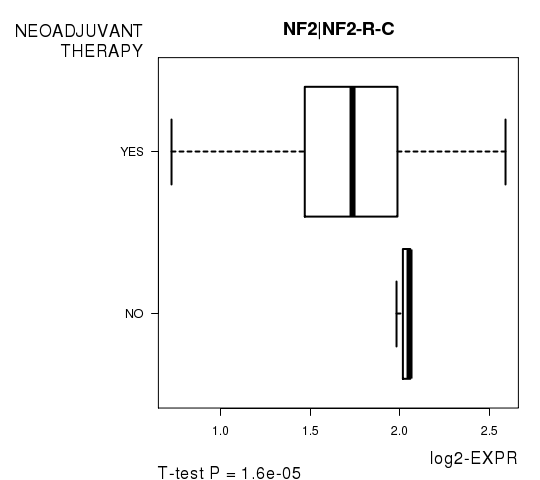
2 genes correlated to 'NEOADJUVANT.THERAPY'.
-
NF2|NF2-R-C , EIF4E|EIF4E-R-V
-
No genes correlated to 'GENDER'
Complete statistical result table is provided in Supplement Table 1
Table 1. Get Full Table This table shows the clinical features, statistical methods used, and the number of genes that are significantly associated with each clinical feature at Q value < 0.05.
| Clinical feature | Statistical test | Significant genes | Associated with | Associated with | ||
|---|---|---|---|---|---|---|
| AGE | Spearman correlation test | N=18 | older | N=8 | younger | N=10 |
| GENDER | t test | N=0 | ||||
| HISTOLOGICAL TYPE | ANOVA test | N=46 | ||||
| RADIATIONS RADIATION REGIMENINDICATION | t test | N=8 | yes | N=6 | no | N=2 |
| NEOADJUVANT THERAPY | t test | N=2 | yes | N=0 | no | N=2 |
Table S1. Basic characteristics of clinical feature: 'AGE'
| AGE | Mean (SD) | 46.58 (16) |
| Significant markers | N = 18 | |
| pos. correlated | 8 | |
| neg. correlated | 10 |
Table S2. Get Full Table List of top 10 genes significantly correlated to 'AGE' by Spearman correlation test
| SpearmanCorr | corrP | Q | |
|---|---|---|---|
| SNAI2|SNAIL-M-C | 0.3726 | 1.801e-06 | 0.000315 |
| AKT1 AKT2 AKT3|AKT_PS473-R-V | 0.3708 | 2.044e-06 | 0.000356 |
| EEF2|EEF2-R-V | -0.3662 | 2.777e-06 | 0.00048 |
| EGFR|EGFR_PY1068-R-V | 0.3483 | 8.944e-06 | 0.00154 |
| PIK3R1|PI3K-P85-R-V | -0.3411 | 1.403e-05 | 0.0024 |
| ATM|ATM-R-C | -0.3361 | 1.91e-05 | 0.00325 |
| MAPK8|JNK_PT183_PT185-R-V | 0.3346 | 2.089e-05 | 0.00353 |
| YAP1|YAP_PS127-R-C | -0.3291 | 2.894e-05 | 0.00486 |
| AKT1 AKT2 AKT3|AKT_PT308-R-V | 0.3283 | 3.034e-05 | 0.00507 |
| BID|BID-R-C | -0.3283 | 3.043e-05 | 0.00507 |
Figure S1. Get High-res Image As an example, this figure shows the association of SNAI2|SNAIL-M-C to 'AGE'. P value = 1.8e-06 with Spearman correlation analysis. The straight line presents the best linear regression.
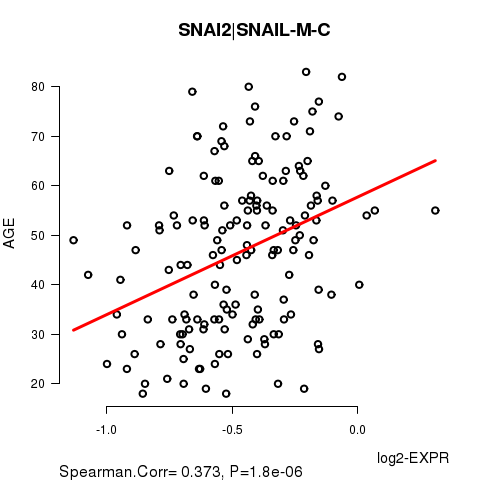
Table S3. Basic characteristics of clinical feature: 'GENDER'
| GENDER | Labels | N |
| FEMALE | 106 | |
| MALE | 49 | |
| Significant markers | N = 0 |
Table S4. Basic characteristics of clinical feature: 'HISTOLOGICAL.TYPE'
| HISTOLOGICAL.TYPE | Labels | N |
| OTHER | 7 | |
| THYROID PAPILLARY CARCINOMA - CLASSICAL/USUAL | 83 | |
| THYROID PAPILLARY CARCINOMA - FOLLICULAR (>= 99% FOLLICULAR PATTERNED) | 52 | |
| THYROID PAPILLARY CARCINOMA - TALL CELL (>= 50% TALL CELL FEATURES) | 13 | |
| Significant markers | N = 46 |
Table S5. Get Full Table List of top 10 genes differentially expressed by 'HISTOLOGICAL.TYPE'
| ANOVA_P | Q | |
|---|---|---|
| ANXA1|ANNEXIN_I-R-V | 7.948e-19 | 1.39e-16 |
| FN1|FIBRONECTIN-R-C | 4.058e-13 | 7.06e-11 |
| CHEK2|CHK2-M-C | 9.245e-11 | 1.6e-08 |
| IRS1|IRS1-R-V | 1.125e-10 | 1.94e-08 |
| C12ORF5|TIGAR-R-V | 1.268e-10 | 2.17e-08 |
| PIK3R1|PI3K-P85-R-V | 5.673e-10 | 9.64e-08 |
| RAF1|C-RAF_PS338-R-C | 1.018e-09 | 1.72e-07 |
| CDKN1B|P27_PT157-R-C | 1.112e-09 | 1.87e-07 |
| STK11|LKB1-M-C | 8.732e-09 | 1.46e-06 |
| MET|C-MET-M-C | 8.905e-09 | 1.48e-06 |
Figure S2. Get High-res Image As an example, this figure shows the association of ANXA1|ANNEXIN_I-R-V to 'HISTOLOGICAL.TYPE'. P value = 7.95e-19 with ANOVA analysis.
8 genes related to 'RADIATIONS.RADIATION.REGIMENINDICATION'.
Table S6. Basic characteristics of clinical feature: 'RADIATIONS.RADIATION.REGIMENINDICATION'
| RADIATIONS.RADIATION.REGIMENINDICATION | Labels | N |
| NO | 13 | |
| YES | 142 | |
| Significant markers | N = 8 | |
| Higher in YES | 6 | |
| Higher in NO | 2 |
Table S7. Get Full Table List of 8 genes differentially expressed by 'RADIATIONS.RADIATION.REGIMENINDICATION'
| T(pos if higher in 'YES') | ttestP | Q | AUC | |
|---|---|---|---|---|
| ERBB2|HER2_PY1248-R-V | 4.72 | 4.656e-05 | 0.00815 | 0.7161 |
| ARID1A|ARID1A-M-V | 4.48 | 0.0001079 | 0.0188 | 0.7048 |
| WWTR1|TAZ_PS89-R-C | 4.93 | 0.0001088 | 0.0188 | 0.8028 |
| CDKN1B|P27_PT157-R-C | 4.66 | 0.000151 | 0.026 | 0.7557 |
| MET|C-MET-M-C | 4.35 | 0.0001511 | 0.026 | 0.6853 |
| IRS1|IRS1-R-V | 4.5 | 0.0001591 | 0.027 | 0.7183 |
| DVL3|DVL3-R-V | -4.63 | 0.0001852 | 0.0313 | 0.7841 |
| BCL2L1|BCL-XL-R-V | -4.78 | 0.0002339 | 0.0393 | 0.825 |
Figure S3. Get High-res Image As an example, this figure shows the association of ERBB2|HER2_PY1248-R-V to 'RADIATIONS.RADIATION.REGIMENINDICATION'. P value = 4.66e-05 with T-test analysis.
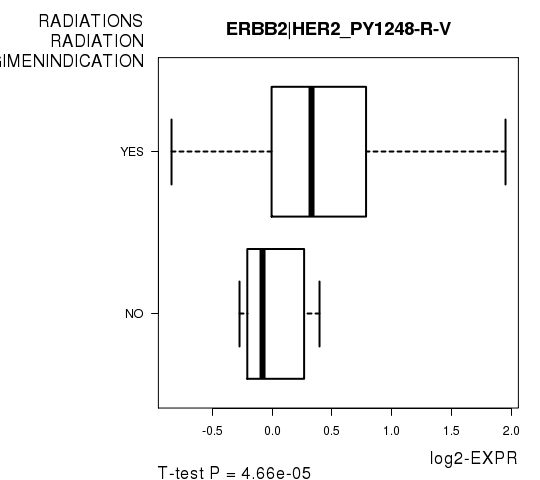
Table S8. Basic characteristics of clinical feature: 'NEOADJUVANT.THERAPY'
| NEOADJUVANT.THERAPY | Labels | N |
| NO | 3 | |
| YES | 152 | |
| Significant markers | N = 2 | |
| Higher in YES | 0 | |
| Higher in NO | 2 |
Table S9. Get Full Table List of 2 genes differentially expressed by 'NEOADJUVANT.THERAPY'
| T(pos if higher in 'YES') | ttestP | Q | AUC | |
|---|---|---|---|---|
| NF2|NF2-R-C | -7.23 | 1.596e-05 | 0.00279 | 0.7939 |
| EIF4E|EIF4E-R-V | -9.72 | 2.247e-05 | 0.00391 | 0.8816 |
Figure S4. Get High-res Image As an example, this figure shows the association of NF2|NF2-R-C to 'NEOADJUVANT.THERAPY'. P value = 1.6e-05 with T-test analysis.
-
Expresson data file = THCA.rppa.txt
-
Clinical data file = THCA.clin.merged.picked.txt
-
Number of patients = 155
-
Number of genes = 175
-
Number of clinical features = 5
For continuous numerical clinical features, Spearman's rank correlation coefficients (Spearman 1904) and two-tailed P values were estimated using 'cor.test' function in R
For two-class clinical features, two-tailed Student's t test with unequal variance (Lehmann and Romano 2005) was applied to compare the log2-expression levels between the two clinical classes using 't.test' function in R
For multi-class clinical features (ordinal or nominal), one-way analysis of variance (Howell 2002) was applied to compare the log2-expression levels between different clinical classes using 'anova' function in R
For multiple hypothesis correction, Q value is the False Discovery Rate (FDR) analogue of the P value (Benjamini and Hochberg 1995), defined as the minimum FDR at which the test may be called significant. We used the 'Benjamini and Hochberg' method of 'p.adjust' function in R to convert P values into Q values.
This is an experimental feature. The full results of the analysis summarized in this report can be downloaded from the TCGA Data Coordination Center.