This pipeline uses various statistical tests to identify mRNAs whose expression levels correlated to selected clinical features.
Testing the association between 17972 genes and 5 clinical features across 173 samples, statistically thresholded by Q value < 0.05, 5 clinical features related to at least one genes.
-
35 genes correlated to 'AGE'.
-
CD97|976 , C12ORF52|84934 , KBTBD2|25948 , GPR173|54328 , GOT2|2806 , ...
-
35 genes correlated to 'GENDER'.
-
DDX3Y|8653 , RPS4Y1|6192 , ZFY|7544 , USP9Y|8287 , UTY|7404 , ...
-
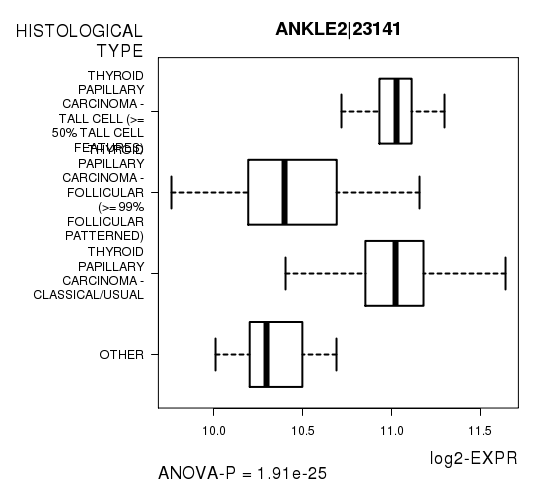
3273 genes correlated to 'HISTOLOGICAL.TYPE'.
-
ANKLE2|23141 , FN1|2335 , LDLR|3949 , FAM176A|84141 , TMPRSS6|164656 , ...
-
35 genes correlated to 'RADIATIONS.RADIATION.REGIMENINDICATION'.
-
FLJ37543|285668 , C14ORF180|400258 , A2ML1|144568 , DNAH14|127602 , LOC440173|440173 , ...
-
137 genes correlated to 'NEOADJUVANT.THERAPY'.
-
SH2D1B|117157 , SSR2|6746 , KDM5C|8242 , WBSCR22|114049 , ZNF512|84450 , ...
Complete statistical result table is provided in Supplement Table 1
Table 1. Get Full Table This table shows the clinical features, statistical methods used, and the number of genes that are significantly associated with each clinical feature at Q value < 0.05.
| Clinical feature | Statistical test | Significant genes | Associated with | Associated with | ||
|---|---|---|---|---|---|---|
| AGE | Spearman correlation test | N=35 | older | N=17 | younger | N=18 |
| GENDER | t test | N=35 | male | N=15 | female | N=20 |
| HISTOLOGICAL TYPE | ANOVA test | N=3273 | ||||
| RADIATIONS RADIATION REGIMENINDICATION | t test | N=35 | yes | N=21 | no | N=14 |
| NEOADJUVANT THERAPY | t test | N=137 | yes | N=49 | no | N=88 |
Table S1. Basic characteristics of clinical feature: 'AGE'
| AGE | Mean (SD) | 47.29 (16) |
| Significant markers | N = 35 | |
| pos. correlated | 17 | |
| neg. correlated | 18 |
Table S2. Get Full Table List of top 10 genes significantly correlated to 'AGE' by Spearman correlation test
| SpearmanCorr | corrP | Q | |
|---|---|---|---|
| CD97|976 | -0.42 | 8.821e-09 | 0.000159 |
| C12ORF52|84934 | 0.4072 | 2.695e-08 | 0.000484 |
| KBTBD2|25948 | -0.3929 | 8.932e-08 | 0.00161 |
| GPR173|54328 | -0.3903 | 1.201e-07 | 0.00216 |
| GOT2|2806 | 0.3834 | 1.929e-07 | 0.00347 |
| HADH|3033 | 0.3813 | 2.268e-07 | 0.00407 |
| ANO10|55129 | 0.3738 | 4.064e-07 | 0.0073 |
| ZNF518B|85460 | -0.3733 | 4.222e-07 | 0.00758 |
| RBMXL1|494115 | -0.3707 | 5.15e-07 | 0.00925 |
| ZCCHC12|170261 | -0.3693 | 5.748e-07 | 0.0103 |
Figure S1. Get High-res Image As an example, this figure shows the association of CD97|976 to 'AGE'. P value = 8.82e-09 with Spearman correlation analysis. The straight line presents the best linear regression.
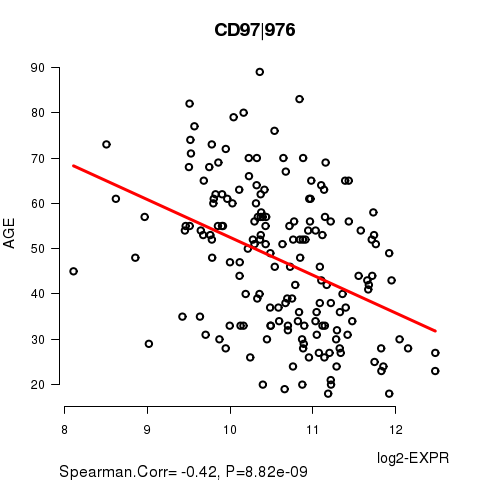
Table S3. Basic characteristics of clinical feature: 'GENDER'
| GENDER | Labels | N |
| FEMALE | 124 | |
| MALE | 49 | |
| Significant markers | N = 35 | |
| Higher in MALE | 15 | |
| Higher in FEMALE | 20 |
Table S4. Get Full Table List of top 10 genes differentially expressed by 'GENDER'
| T(pos if higher in 'MALE') | ttestP | Q | AUC | |
|---|---|---|---|---|
| DDX3Y|8653 | 68.6 | 1.735e-91 | 3.12e-87 | 1 |
| RPS4Y1|6192 | 56.21 | 8.425e-87 | 1.51e-82 | 1 |
| ZFY|7544 | 58.49 | 7.266e-81 | 1.31e-76 | 1 |
| USP9Y|8287 | 58.77 | 8.898e-73 | 1.6e-68 | 1 |
| UTY|7404 | 59.57 | 1.72e-68 | 3.09e-64 | 1 |
| KDM5D|8284 | 60.13 | 1.562e-63 | 2.81e-59 | 1 |
| NLGN4Y|22829 | 42.15 | 3.579e-58 | 6.43e-54 | 1 |
| PRKY|5616 | 26.12 | 6.148e-58 | 1.1e-53 | 0.9977 |
| CYORF15A|246126 | 47.28 | 3.441e-49 | 6.18e-45 | 1 |
| CYORF15B|84663 | 45.91 | 1.438e-47 | 2.58e-43 | 1 |
Figure S2. Get High-res Image As an example, this figure shows the association of DDX3Y|8653 to 'GENDER'. P value = 1.73e-91 with T-test analysis.
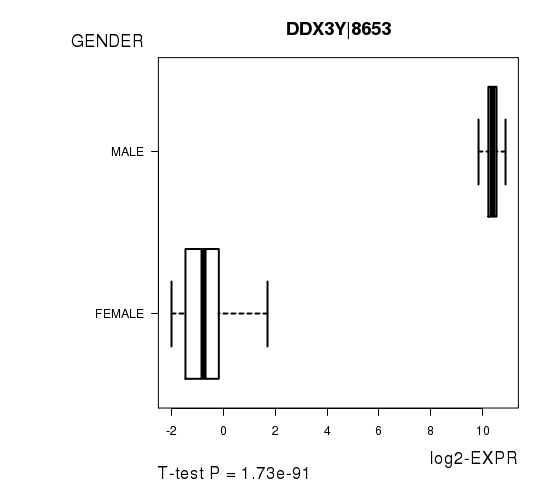
Table S5. Basic characteristics of clinical feature: 'HISTOLOGICAL.TYPE'
| HISTOLOGICAL.TYPE | Labels | N |
| OTHER | 7 | |
| THYROID PAPILLARY CARCINOMA - CLASSICAL/USUAL | 92 | |
| THYROID PAPILLARY CARCINOMA - FOLLICULAR (>= 99% FOLLICULAR PATTERNED) | 54 | |
| THYROID PAPILLARY CARCINOMA - TALL CELL (>= 50% TALL CELL FEATURES) | 20 | |
| Significant markers | N = 3273 |
Table S6. Get Full Table List of top 10 genes differentially expressed by 'HISTOLOGICAL.TYPE'
| ANOVA_P | Q | |
|---|---|---|
| ANKLE2|23141 | 1.911e-25 | 3.43e-21 |
| FN1|2335 | 5.338e-25 | 9.59e-21 |
| LDLR|3949 | 4.187e-24 | 7.52e-20 |
| FAM176A|84141 | 8.629e-24 | 1.55e-19 |
| TMPRSS6|164656 | 4.312e-23 | 7.75e-19 |
| PTPRE|5791 | 1.649e-22 | 2.96e-18 |
| ITGA3|3675 | 5.806e-22 | 1.04e-17 |
| CREB5|9586 | 7.454e-22 | 1.34e-17 |
| GABRB2|2561 | 1.389e-21 | 2.5e-17 |
| SFTPB|6439 | 1.715e-21 | 3.08e-17 |
Figure S3. Get High-res Image As an example, this figure shows the association of ANKLE2|23141 to 'HISTOLOGICAL.TYPE'. P value = 1.91e-25 with ANOVA analysis.
35 genes related to 'RADIATIONS.RADIATION.REGIMENINDICATION'.
Table S7. Basic characteristics of clinical feature: 'RADIATIONS.RADIATION.REGIMENINDICATION'
| RADIATIONS.RADIATION.REGIMENINDICATION | Labels | N |
| NO | 12 | |
| YES | 161 | |
| Significant markers | N = 35 | |
| Higher in YES | 21 | |
| Higher in NO | 14 |
Table S8. Get Full Table List of top 10 genes differentially expressed by 'RADIATIONS.RADIATION.REGIMENINDICATION'
| T(pos if higher in 'YES') | ttestP | Q | AUC | |
|---|---|---|---|---|
| FLJ37543|285668 | 10.35 | 2.498e-14 | 4.47e-10 | 0.8601 |
| C14ORF180|400258 | 7.47 | 2.348e-10 | 4.21e-06 | 0.8444 |
| A2ML1|144568 | 7.31 | 2.073e-09 | 3.71e-05 | 0.7921 |
| DNAH14|127602 | -8.51 | 9.407e-09 | 0.000168 | 0.8799 |
| LOC440173|440173 | 7.17 | 1.739e-08 | 0.000311 | 0.9012 |
| HPR|3250 | 7.24 | 9.212e-08 | 0.00165 | 0.9138 |
| HCFC1|3054 | -7.96 | 9.399e-08 | 0.00168 | 0.8665 |
| TMEM20|159371 | 7.21 | 1.462e-07 | 0.00262 | 0.8245 |
| ENPP3|5169 | 6.96 | 1.49e-07 | 0.00267 | 0.836 |
| DOCK3|1795 | -6.56 | 1.936e-07 | 0.00347 | 0.8163 |
Figure S4. Get High-res Image As an example, this figure shows the association of FLJ37543|285668 to 'RADIATIONS.RADIATION.REGIMENINDICATION'. P value = 2.5e-14 with T-test analysis.
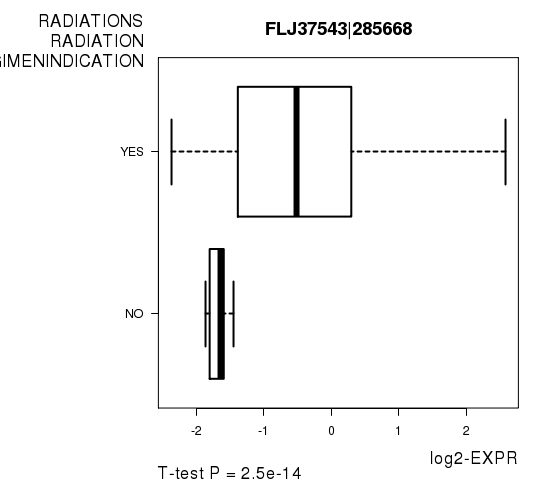
Table S9. Basic characteristics of clinical feature: 'NEOADJUVANT.THERAPY'
| NEOADJUVANT.THERAPY | Labels | N |
| NO | 3 | |
| YES | 170 | |
| Significant markers | N = 137 | |
| Higher in YES | 49 | |
| Higher in NO | 88 |
Table S10. Get Full Table List of top 10 genes differentially expressed by 'NEOADJUVANT.THERAPY'
| T(pos if higher in 'YES') | ttestP | Q | AUC | |
|---|---|---|---|---|
| SH2D1B|117157 | 20.13 | 3.095e-39 | 5.11e-35 | 0.9444 |
| SSR2|6746 | 16.35 | 1.05e-34 | 1.73e-30 | 0.9098 |
| KDM5C|8242 | -17.39 | 2.235e-34 | 3.69e-30 | 0.9549 |
| WBSCR22|114049 | 15.72 | 2.676e-34 | 4.42e-30 | 0.9039 |
| ZNF512|84450 | -15.39 | 1.142e-32 | 1.89e-28 | 0.9392 |
| L3MBTL|26013 | -18.47 | 3.667e-30 | 6.06e-26 | 0.9412 |
| SGSM1|129049 | -13.92 | 6.37e-30 | 1.05e-25 | 0.9118 |
| PPP1R12A|4659 | -13.41 | 1.031e-27 | 1.7e-23 | 0.9412 |
| POLDIP3|84271 | -12.48 | 8.763e-26 | 1.45e-21 | 0.8647 |
| FCRL5|83416 | 17.79 | 5.804e-25 | 9.58e-21 | 0.9514 |
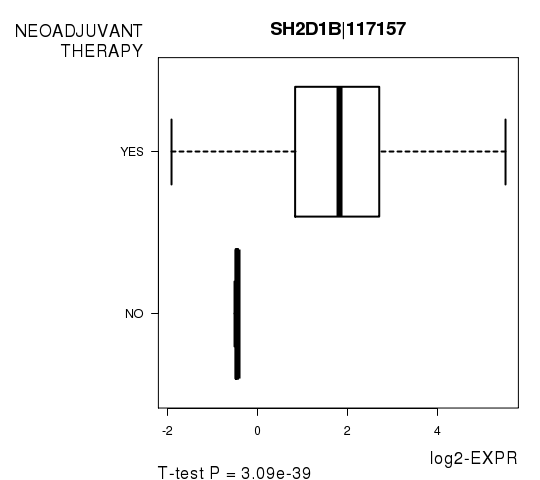
Figure S5. Get High-res Image As an example, this figure shows the association of SH2D1B|117157 to 'NEOADJUVANT.THERAPY'. P value = 3.09e-39 with T-test analysis.
-
Expresson data file = THCA.uncv2.mRNAseq_RSEM_normalized_log2.txt
-
Clinical data file = THCA.clin.merged.picked.txt
-
Number of patients = 173
-
Number of genes = 17972
-
Number of clinical features = 5
For continuous numerical clinical features, Spearman's rank correlation coefficients (Spearman 1904) and two-tailed P values were estimated using 'cor.test' function in R
For two-class clinical features, two-tailed Student's t test with unequal variance (Lehmann and Romano 2005) was applied to compare the log2-expression levels between the two clinical classes using 't.test' function in R
For multi-class clinical features (ordinal or nominal), one-way analysis of variance (Howell 2002) was applied to compare the log2-expression levels between different clinical classes using 'anova' function in R
For multiple hypothesis correction, Q value is the False Discovery Rate (FDR) analogue of the P value (Benjamini and Hochberg 1995), defined as the minimum FDR at which the test may be called significant. We used the 'Benjamini and Hochberg' method of 'p.adjust' function in R to convert P values into Q values.
This is an experimental feature. The full results of the analysis summarized in this report can be downloaded from the TCGA Data Coordination Center.