This pipeline uses various statistical tests to identify genes whose promoter methylation levels correlated to selected clinical features.
Testing the association between 17042 genes and 5 clinical features across 170 samples, statistically thresholded by Q value < 0.05, 5 clinical features related to at least one genes.
-
46 genes correlated to 'AGE'.
-
KIAA1143 , C1ORF59 , INA , DLK2 , CBLN1 , ...
-
8 genes correlated to 'GENDER'.
-
UTP14C , KIF4B , METTL1 , ANKRD20A4 , WBP11P1 , ...
-
1117 genes correlated to 'HISTOLOGICAL.TYPE'.
-
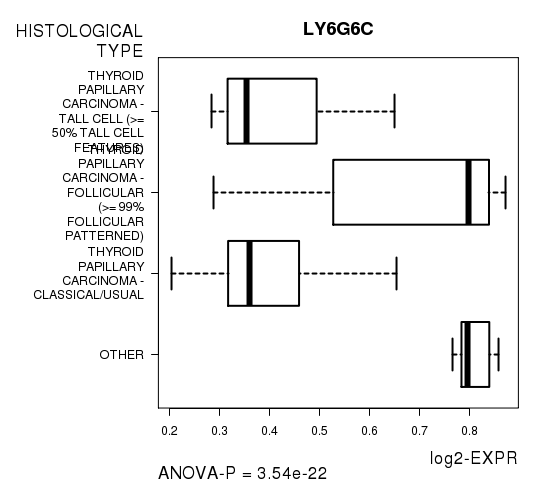
LY6G6C , PON2 , EMP1 , CLCF1 , LEPR , ...
-
24 genes correlated to 'RADIATIONS.RADIATION.REGIMENINDICATION'.
-
MAP3K3 , STX17 , KIF15 , PLEKHF2 , AHRR , ...
-
316 genes correlated to 'NEOADJUVANT.THERAPY'.
-
PSMD1 , FBXO40 , MTMR15 , RBM39 , SLC7A6 , ...
Complete statistical result table is provided in Supplement Table 1
Table 1. Get Full Table This table shows the clinical features, statistical methods used, and the number of genes that are significantly associated with each clinical feature at Q value < 0.05.
| Clinical feature | Statistical test | Significant genes | Associated with | Associated with | ||
|---|---|---|---|---|---|---|
| AGE | Spearman correlation test | N=46 | older | N=46 | younger | N=0 |
| GENDER | t test | N=8 | male | N=5 | female | N=3 |
| HISTOLOGICAL TYPE | ANOVA test | N=1117 | ||||
| RADIATIONS RADIATION REGIMENINDICATION | t test | N=24 | yes | N=12 | no | N=12 |
| NEOADJUVANT THERAPY | t test | N=316 | yes | N=168 | no | N=148 |
Table S1. Basic characteristics of clinical feature: 'AGE'
| AGE | Mean (SD) | 47.09 (16) |
| Significant markers | N = 46 | |
| pos. correlated | 46 | |
| neg. correlated | 0 |
Table S2. Get Full Table List of top 10 genes significantly correlated to 'AGE' by Spearman correlation test
| SpearmanCorr | corrP | Q | |
|---|---|---|---|
| KIAA1143 | 0.5207 | 3.377e-13 | 5.76e-09 |
| C1ORF59 | 0.5124 | 9.101e-13 | 1.55e-08 |
| INA | 0.489 | 1.322e-11 | 2.25e-07 |
| DLK2 | 0.4886 | 1.384e-11 | 2.36e-07 |
| CBLN1 | 0.4872 | 1.607e-11 | 2.74e-07 |
| C7ORF13 | 0.4803 | 3.39e-11 | 5.78e-07 |
| ZNF518B | 0.4795 | 3.717e-11 | 6.33e-07 |
| ZNF274 | 0.4746 | 6.246e-11 | 1.06e-06 |
| ANKRD43 | 0.4677 | 1.272e-10 | 2.17e-06 |
| SYNGR3 | 0.452 | 6.112e-10 | 1.04e-05 |
Figure S1. Get High-res Image As an example, this figure shows the association of KIAA1143 to 'AGE'. P value = 3.38e-13 with Spearman correlation analysis. The straight line presents the best linear regression.
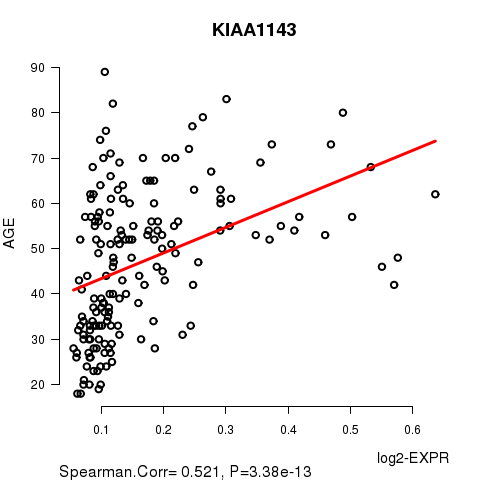
Table S3. Basic characteristics of clinical feature: 'GENDER'
| GENDER | Labels | N |
| FEMALE | 124 | |
| MALE | 46 | |
| Significant markers | N = 8 | |
| Higher in MALE | 5 | |
| Higher in FEMALE | 3 |
Table S4. Get Full Table List of 8 genes differentially expressed by 'GENDER'
| T(pos if higher in 'MALE') | ttestP | Q | AUC | |
|---|---|---|---|---|
| UTP14C | 24.59 | 4.563e-53 | 7.78e-49 | 0.9988 |
| KIF4B | -11.73 | 3.222e-20 | 5.49e-16 | 0.9313 |
| METTL1 | 7.68 | 7.481e-11 | 1.27e-06 | 0.8671 |
| ANKRD20A4 | 6.02 | 4.244e-08 | 0.000723 | 0.7702 |
| WBP11P1 | 6 | 8.434e-08 | 0.00144 | 0.8124 |
| CCDC121 | 5.8 | 1.024e-07 | 0.00175 | 0.7437 |
| FAM35A | -5.58 | 1.063e-07 | 0.00181 | 0.8029 |
| RAB12 | -4.98 | 2.279e-06 | 0.0388 | 0.6974 |
Figure S2. Get High-res Image As an example, this figure shows the association of UTP14C to 'GENDER'. P value = 4.56e-53 with T-test analysis.
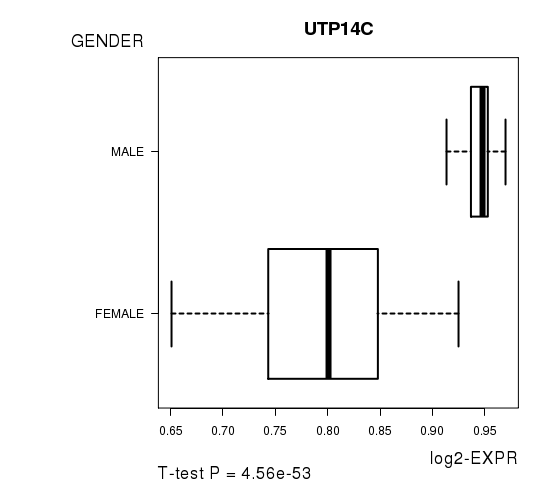
Table S5. Basic characteristics of clinical feature: 'HISTOLOGICAL.TYPE'
| HISTOLOGICAL.TYPE | Labels | N |
| OTHER | 7 | |
| THYROID PAPILLARY CARCINOMA - CLASSICAL/USUAL | 92 | |
| THYROID PAPILLARY CARCINOMA - FOLLICULAR (>= 99% FOLLICULAR PATTERNED) | 51 | |
| THYROID PAPILLARY CARCINOMA - TALL CELL (>= 50% TALL CELL FEATURES) | 20 | |
| Significant markers | N = 1117 |
Table S6. Get Full Table List of top 10 genes differentially expressed by 'HISTOLOGICAL.TYPE'
| ANOVA_P | Q | |
|---|---|---|
| LY6G6C | 3.542e-22 | 6.04e-18 |
| PON2 | 4.82e-22 | 8.21e-18 |
| EMP1 | 8.902e-22 | 1.52e-17 |
| CLCF1 | 1.905e-21 | 3.25e-17 |
| LEPR | 3.496e-21 | 5.96e-17 |
| LEPROT | 3.496e-21 | 5.96e-17 |
| LOC100126784 | 6.189e-21 | 1.05e-16 |
| LAMP3 | 1.918e-20 | 3.27e-16 |
| ZNRF2 | 7.387e-20 | 1.26e-15 |
| CLEC16A | 9.221e-20 | 1.57e-15 |
Figure S3. Get High-res Image As an example, this figure shows the association of LY6G6C to 'HISTOLOGICAL.TYPE'. P value = 3.54e-22 with ANOVA analysis.
24 genes related to 'RADIATIONS.RADIATION.REGIMENINDICATION'.
Table S7. Basic characteristics of clinical feature: 'RADIATIONS.RADIATION.REGIMENINDICATION'
| RADIATIONS.RADIATION.REGIMENINDICATION | Labels | N |
| NO | 12 | |
| YES | 158 | |
| Significant markers | N = 24 | |
| Higher in YES | 12 | |
| Higher in NO | 12 |
Table S8. Get Full Table List of top 10 genes differentially expressed by 'RADIATIONS.RADIATION.REGIMENINDICATION'
| T(pos if higher in 'YES') | ttestP | Q | AUC | |
|---|---|---|---|---|
| MAP3K3 | -9.28 | 6.397e-13 | 1.09e-08 | 0.8486 |
| STX17 | 7.6 | 2.236e-12 | 3.81e-08 | 0.6619 |
| KIF15 | 6.97 | 6.774e-11 | 1.15e-06 | 0.7853 |
| PLEKHF2 | -7.75 | 5.988e-10 | 1.02e-05 | 0.8291 |
| AHRR | -6.56 | 6.53e-10 | 1.11e-05 | 0.6487 |
| KIAA1143 | 6.66 | 1.863e-09 | 3.17e-05 | 0.7231 |
| SIK1 | 6.22 | 3.822e-09 | 6.51e-05 | 0.6999 |
| FAM180B | -6.82 | 6.579e-09 | 0.000112 | 0.759 |
| GPR120 | 6.1 | 1.475e-08 | 0.000251 | 0.6524 |
| NDUFB8 | 5.81 | 4.191e-08 | 0.000714 | 0.7083 |
Figure S4. Get High-res Image As an example, this figure shows the association of MAP3K3 to 'RADIATIONS.RADIATION.REGIMENINDICATION'. P value = 6.4e-13 with T-test analysis.
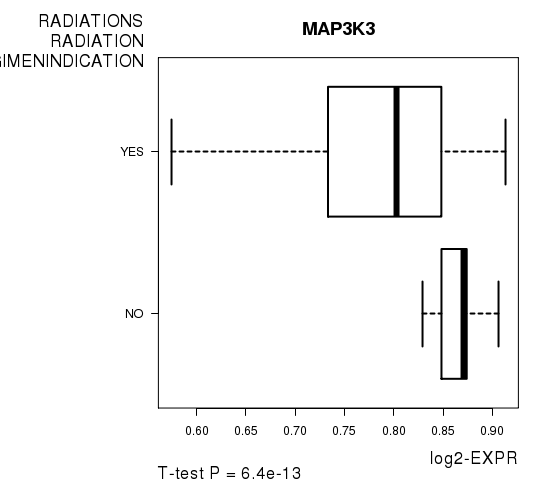
Table S9. Basic characteristics of clinical feature: 'NEOADJUVANT.THERAPY'
| NEOADJUVANT.THERAPY | Labels | N |
| NO | 3 | |
| YES | 167 | |
| Significant markers | N = 316 | |
| Higher in YES | 168 | |
| Higher in NO | 148 |
Table S10. Get Full Table List of top 10 genes differentially expressed by 'NEOADJUVANT.THERAPY'
| T(pos if higher in 'YES') | ttestP | Q | AUC | |
|---|---|---|---|---|
| PSMD1 | -18.75 | 5.287e-43 | 9.01e-39 | 0.9102 |
| FBXO40 | -16.49 | 1.101e-36 | 1.88e-32 | 0.8363 |
| MTMR15 | 16.29 | 2.322e-36 | 3.96e-32 | 0.9361 |
| RBM39 | -17.85 | 5.534e-36 | 9.43e-32 | 0.9182 |
| SLC7A6 | -16.13 | 1.709e-33 | 2.91e-29 | 0.9122 |
| CCDC86 | -13.94 | 8.217e-29 | 1.4e-24 | 0.8862 |
| TSSC1 | 17.22 | 8.788e-29 | 1.5e-24 | 0.9681 |
| MUC15 | 13.49 | 1.939e-28 | 3.3e-24 | 0.9222 |
| CCDC159 | 12.78 | 6.488e-24 | 1.11e-19 | 0.9242 |
| TMEM205 | 12.78 | 6.488e-24 | 1.11e-19 | 0.9242 |
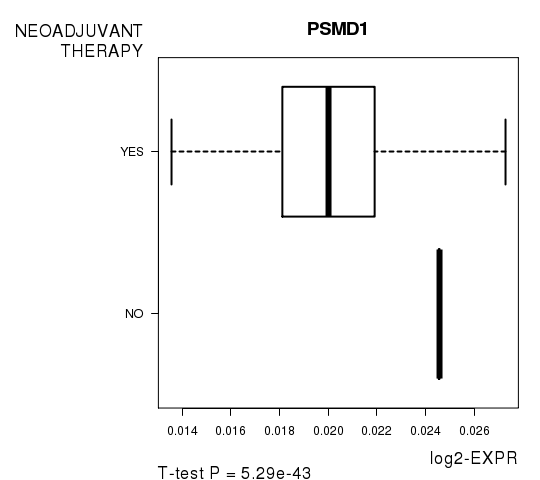
Figure S5. Get High-res Image As an example, this figure shows the association of PSMD1 to 'NEOADJUVANT.THERAPY'. P value = 5.29e-43 with T-test analysis.
-
Expresson data file = THCA.meth.for_correlation.filtered_data.txt
-
Clinical data file = THCA.clin.merged.picked.txt
-
Number of patients = 170
-
Number of genes = 17042
-
Number of clinical features = 5
For continuous numerical clinical features, Spearman's rank correlation coefficients (Spearman 1904) and two-tailed P values were estimated using 'cor.test' function in R
For two-class clinical features, two-tailed Student's t test with unequal variance (Lehmann and Romano 2005) was applied to compare the log2-expression levels between the two clinical classes using 't.test' function in R
For multi-class clinical features (ordinal or nominal), one-way analysis of variance (Howell 2002) was applied to compare the log2-expression levels between different clinical classes using 'anova' function in R
For multiple hypothesis correction, Q value is the False Discovery Rate (FDR) analogue of the P value (Benjamini and Hochberg 1995), defined as the minimum FDR at which the test may be called significant. We used the 'Benjamini and Hochberg' method of 'p.adjust' function in R to convert P values into Q values.
This is an experimental feature. The full results of the analysis summarized in this report can be downloaded from the TCGA Data Coordination Center.