This pipeline computes the correlation between cancer subtypes identified by different molecular patterns and selected clinical features.
Testing the association between subtypes identified by 8 different clustering approaches and 6 clinical features across 211 patients, 23 significant findings detected with P value < 0.05.
-
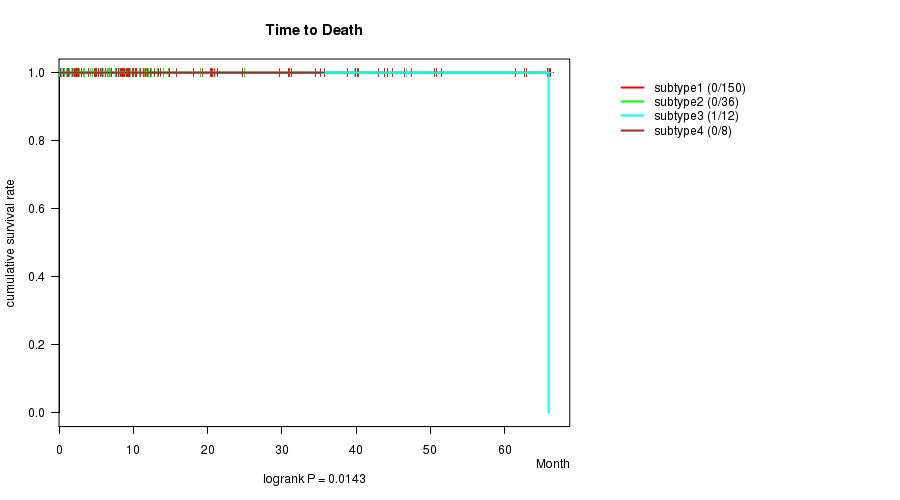
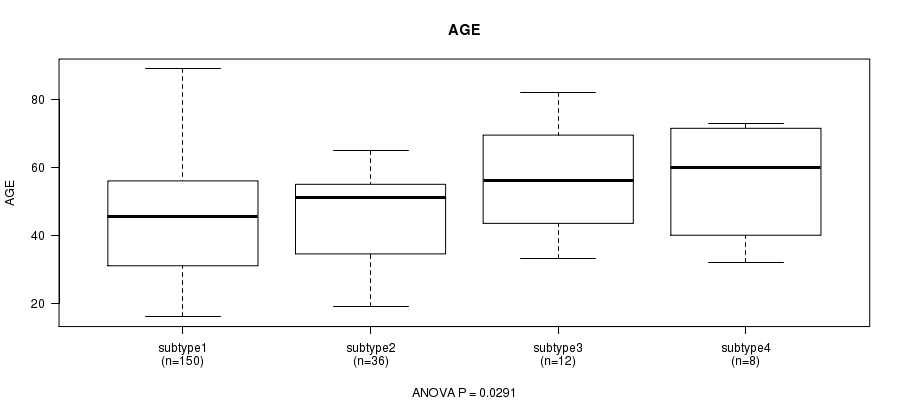
4 subtypes identified in current cancer cohort by 'CN CNMF'. These subtypes correlate to 'Time to Death' and 'AGE'.
-
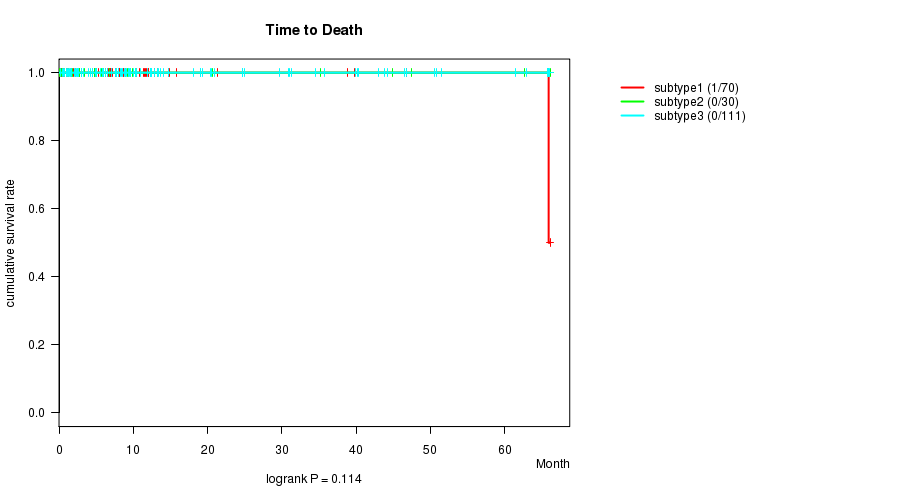
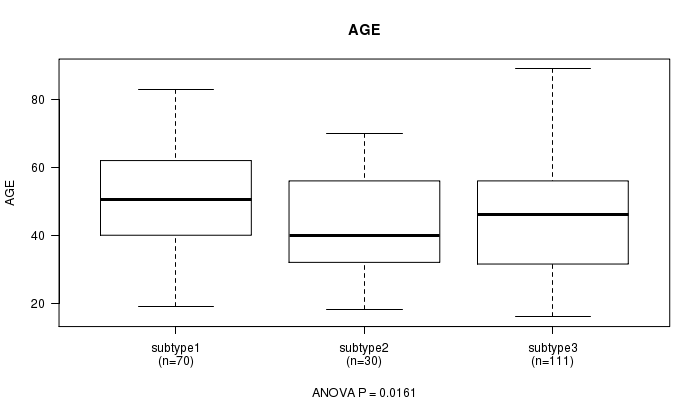
3 subtypes identified in current cancer cohort by 'METHLYATION CNMF'. These subtypes correlate to 'AGE' and 'HISTOLOGICAL.TYPE'.
-
CNMF clustering analysis on RPPA data identified 3 subtypes that correlate to 'AGE', 'HISTOLOGICAL.TYPE', and 'RADIATIONS.RADIATION.REGIMENINDICATION'.
-
Consensus hierarchical clustering analysis on RPPA data identified 3 subtypes that correlate to 'Time to Death', 'AGE', and 'HISTOLOGICAL.TYPE'.
-
CNMF clustering analysis on sequencing-based mRNA expression data identified 4 subtypes that correlate to 'Time to Death', 'AGE', 'HISTOLOGICAL.TYPE', and 'RADIATIONS.RADIATION.REGIMENINDICATION'.
-
Consensus hierarchical clustering analysis on sequencing-based mRNA expression data identified 2 subtypes that correlate to 'Time to Death', 'AGE', and 'HISTOLOGICAL.TYPE'.
-
CNMF clustering analysis on sequencing-based miR expression data identified 3 subtypes that correlate to 'Time to Death' and 'HISTOLOGICAL.TYPE'.
-
Consensus hierarchical clustering analysis on sequencing-based miR expression data identified 3 subtypes that correlate to 'Time to Death', 'AGE', 'HISTOLOGICAL.TYPE', and 'RADIATIONS.RADIATION.REGIMENINDICATION'.
Table 1. Get Full Table Overview of the association between subtypes identified by 8 different clustering approaches and 6 clinical features. Shown in the table are P values from statistical tests. Thresholded by P value < 0.05, 23 significant findings detected.
|
Clinical Features |
Time to Death |
AGE | GENDER |
HISTOLOGICAL TYPE |
RADIATIONS RADIATION REGIMENINDICATION |
NEOADJUVANT THERAPY |
| Statistical Tests | logrank test | ANOVA | Fisher's exact test | Chi-square test | Fisher's exact test | Fisher's exact test |
| CN CNMF | 0.0143 | 0.0291 | 1 | 0.512 | 0.467 | 1 |
| METHLYATION CNMF | 0.114 | 0.0161 | 0.692 | 1.39e-16 | 0.0596 | 1 |
| RPPA CNMF subtypes | 0.414 | 0.000166 | 0.906 | 2.64e-06 | 0.00958 | 0.779 |
| RPPA cHierClus subtypes | 0.0455 | 0.001 | 0.39 | 1.74e-11 | 0.331 | 1 |
| RNAseq CNMF subtypes | 0.0253 | 0.0495 | 0.623 | 6.02e-15 | 0.003 | 1 |
| RNAseq cHierClus subtypes | 0.0253 | 0.04 | 0.292 | 1.11e-16 | 0.0999 | 1 |
| MIRseq CNMF subtypes | 0.0143 | 0.0559 | 0.432 | 2.47e-17 | 0.393 | 0.63 |
| MIRseq cHierClus subtypes | 0.0143 | 0.00353 | 0.229 | 1.65e-19 | 0.0362 | 0.637 |
Table S1. Get Full Table Description of clustering approach #1: 'CN CNMF'
| Cluster Labels | 1 | 2 | 3 | 4 |
|---|---|---|---|---|
| Number of samples | 150 | 36 | 12 | 8 |
P value = 0.0143 (logrank test)
Table S2. Clustering Approach #1: 'CN CNMF' versus Clinical Feature #1: 'Time to Death'
| nPatients | nDeath | Duration Range (Median), Month | |
|---|---|---|---|
| ALL | 206 | 1 | 0.0 - 66.1 (8.5) |
| subtype1 | 150 | 0 | 0.1 - 66.1 (8.1) |
| subtype2 | 36 | 0 | 0.0 - 65.9 (9.0) |
| subtype3 | 12 | 1 | 0.3 - 65.9 (7.5) |
| subtype4 | 8 | 0 | 9.3 - 35.2 (13.5) |
Figure S1. Get High-res Image Clustering Approach #1: 'CN CNMF' versus Clinical Feature #1: 'Time to Death'
P value = 0.0291 (ANOVA)
Table S3. Clustering Approach #1: 'CN CNMF' versus Clinical Feature #2: 'AGE'
| nPatients | Mean (Std.Dev) | |
|---|---|---|
| ALL | 206 | 46.4 (16.0) |
| subtype1 | 150 | 45.1 (16.4) |
| subtype2 | 36 | 46.1 (12.4) |
| subtype3 | 12 | 56.8 (16.2) |
| subtype4 | 8 | 56.0 (16.9) |
Figure S2. Get High-res Image Clustering Approach #1: 'CN CNMF' versus Clinical Feature #2: 'AGE'
P value = 1 (Fisher's exact test)
Table S4. Clustering Approach #1: 'CN CNMF' versus Clinical Feature #3: 'GENDER'
| nPatients | FEMALE | MALE |
|---|---|---|
| ALL | 153 | 53 |
| subtype1 | 111 | 39 |
| subtype2 | 27 | 9 |
| subtype3 | 9 | 3 |
| subtype4 | 6 | 2 |
Figure S3. Get High-res Image Clustering Approach #1: 'CN CNMF' versus Clinical Feature #3: 'GENDER'
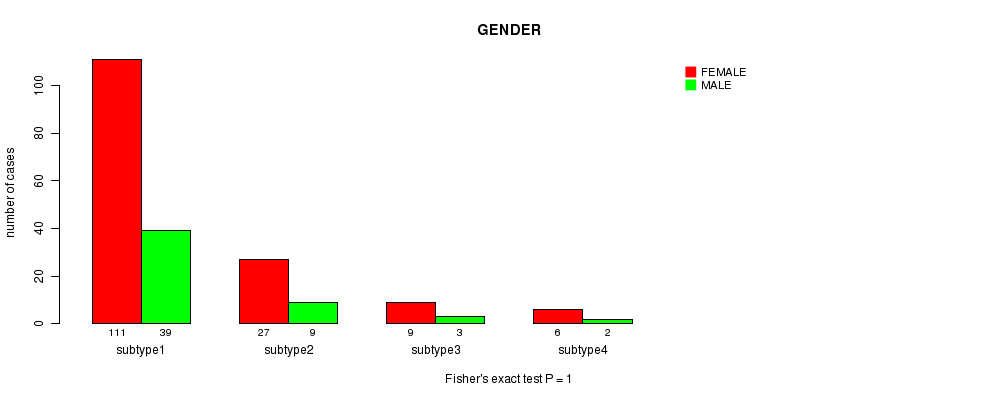
P value = 0.512 (Chi-square test)
Table S5. Clustering Approach #1: 'CN CNMF' versus Clinical Feature #4: 'HISTOLOGICAL.TYPE'
| nPatients | OTHER | THYROID PAPILLARY CARCINOMA - CLASSICAL/USUAL | THYROID PAPILLARY CARCINOMA - FOLLICULAR (>= 99% FOLLICULAR PATTERNED) | THYROID PAPILLARY CARCINOMA - TALL CELL (>= 50% TALL CELL FEATURES) |
|---|---|---|---|---|
| ALL | 8 | 115 | 61 | 22 |
| subtype1 | 4 | 88 | 41 | 17 |
| subtype2 | 2 | 16 | 14 | 4 |
| subtype3 | 1 | 6 | 5 | 0 |
| subtype4 | 1 | 5 | 1 | 1 |
Figure S4. Get High-res Image Clustering Approach #1: 'CN CNMF' versus Clinical Feature #4: 'HISTOLOGICAL.TYPE'
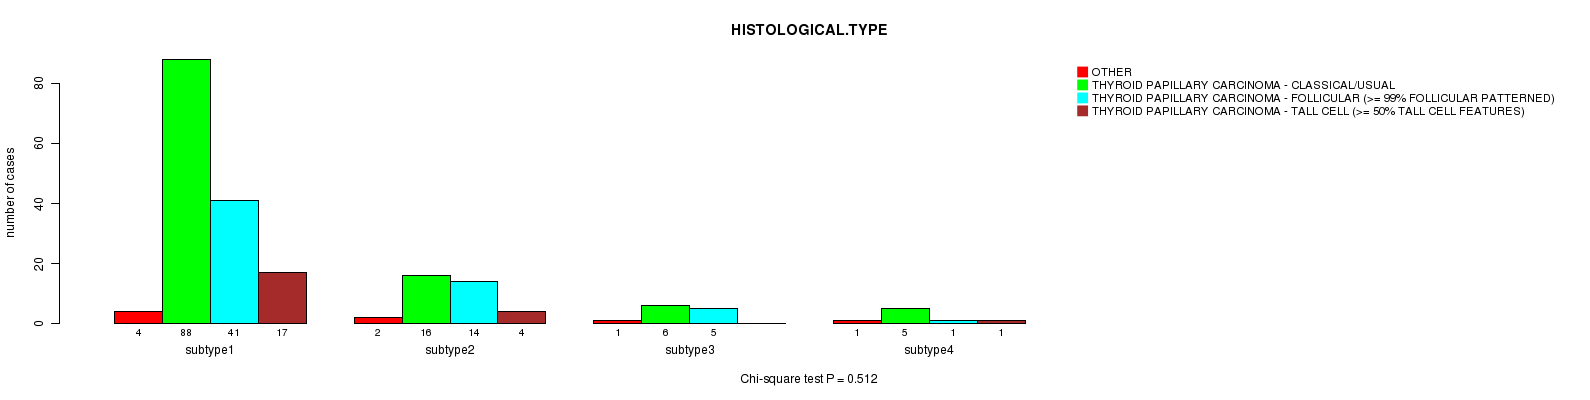
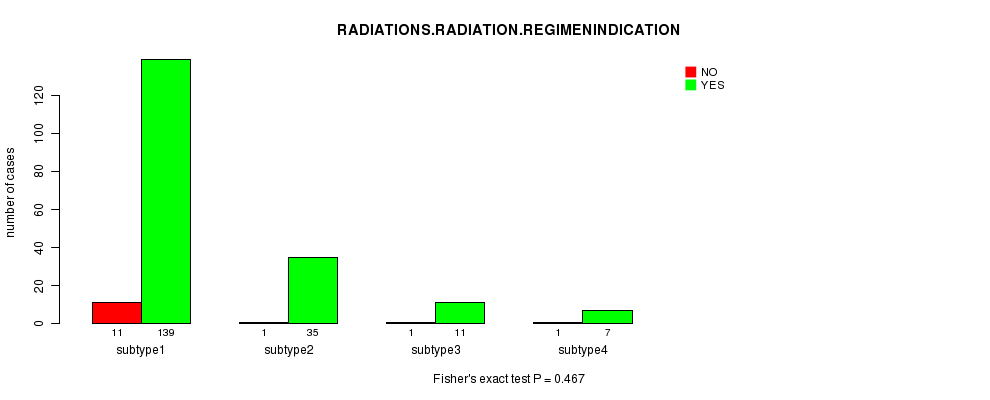
P value = 0.467 (Fisher's exact test)
Table S6. Clustering Approach #1: 'CN CNMF' versus Clinical Feature #5: 'RADIATIONS.RADIATION.REGIMENINDICATION'
| nPatients | NO | YES |
|---|---|---|
| ALL | 14 | 192 |
| subtype1 | 11 | 139 |
| subtype2 | 1 | 35 |
| subtype3 | 1 | 11 |
| subtype4 | 1 | 7 |
Figure S5. Get High-res Image Clustering Approach #1: 'CN CNMF' versus Clinical Feature #5: 'RADIATIONS.RADIATION.REGIMENINDICATION'
P value = 1 (Fisher's exact test)
Table S7. Clustering Approach #1: 'CN CNMF' versus Clinical Feature #6: 'NEOADJUVANT.THERAPY'
| nPatients | NO | YES |
|---|---|---|
| ALL | 3 | 203 |
| subtype1 | 3 | 147 |
| subtype2 | 0 | 36 |
| subtype3 | 0 | 12 |
| subtype4 | 0 | 8 |
Figure S6. Get High-res Image Clustering Approach #1: 'CN CNMF' versus Clinical Feature #6: 'NEOADJUVANT.THERAPY'
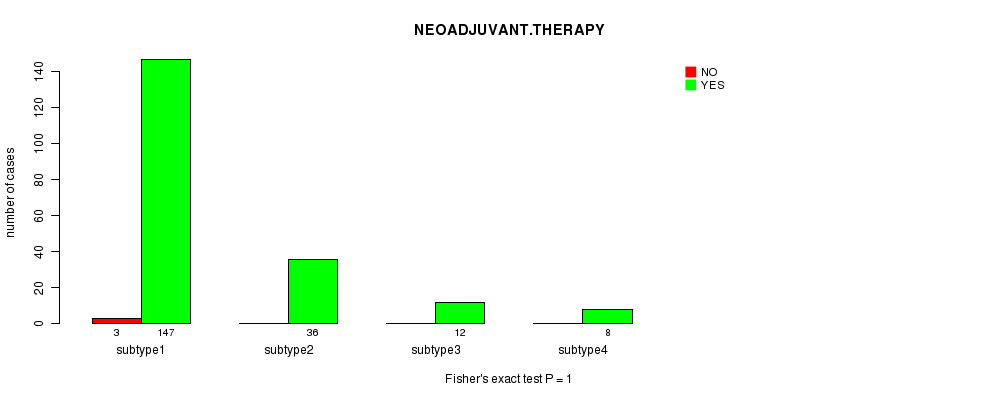
Table S8. Get Full Table Description of clustering approach #2: 'METHLYATION CNMF'
| Cluster Labels | 1 | 2 | 3 |
|---|---|---|---|
| Number of samples | 70 | 30 | 111 |
P value = 0.114 (logrank test)
Table S9. Clustering Approach #2: 'METHLYATION CNMF' versus Clinical Feature #1: 'Time to Death'
| nPatients | nDeath | Duration Range (Median), Month | |
|---|---|---|---|
| ALL | 211 | 1 | 0.0 - 66.1 (8.2) |
| subtype1 | 70 | 1 | 0.0 - 66.1 (7.0) |
| subtype2 | 30 | 0 | 0.1 - 66.1 (6.9) |
| subtype3 | 111 | 0 | 0.2 - 66.1 (10.0) |
Figure S7. Get High-res Image Clustering Approach #2: 'METHLYATION CNMF' versus Clinical Feature #1: 'Time to Death'
P value = 0.0161 (ANOVA)
Table S10. Clustering Approach #2: 'METHLYATION CNMF' versus Clinical Feature #2: 'AGE'
| nPatients | Mean (Std.Dev) | |
|---|---|---|
| ALL | 211 | 46.5 (16.0) |
| subtype1 | 70 | 50.9 (16.0) |
| subtype2 | 30 | 42.9 (15.2) |
| subtype3 | 111 | 44.7 (15.8) |
Figure S8. Get High-res Image Clustering Approach #2: 'METHLYATION CNMF' versus Clinical Feature #2: 'AGE'
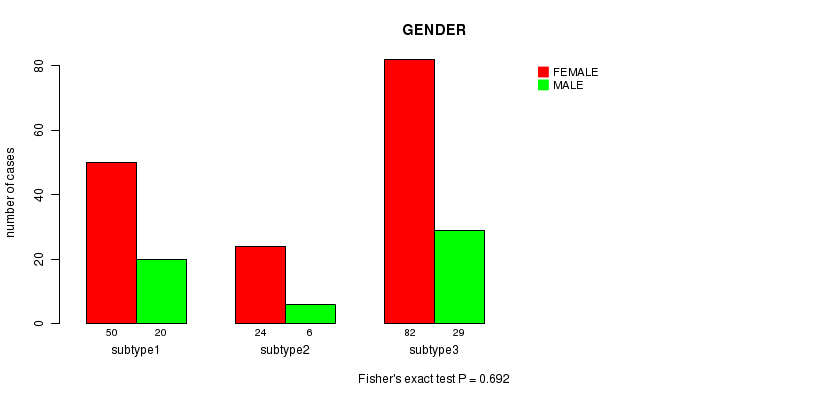
P value = 0.692 (Fisher's exact test)
Table S11. Clustering Approach #2: 'METHLYATION CNMF' versus Clinical Feature #3: 'GENDER'
| nPatients | FEMALE | MALE |
|---|---|---|
| ALL | 156 | 55 |
| subtype1 | 50 | 20 |
| subtype2 | 24 | 6 |
| subtype3 | 82 | 29 |
Figure S9. Get High-res Image Clustering Approach #2: 'METHLYATION CNMF' versus Clinical Feature #3: 'GENDER'
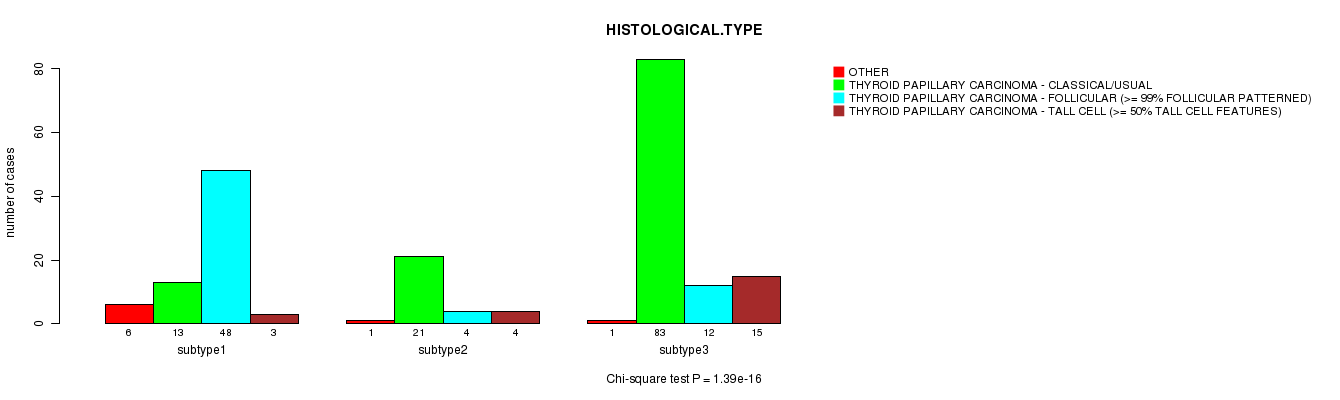
P value = 1.39e-16 (Chi-square test)
Table S12. Clustering Approach #2: 'METHLYATION CNMF' versus Clinical Feature #4: 'HISTOLOGICAL.TYPE'
| nPatients | OTHER | THYROID PAPILLARY CARCINOMA - CLASSICAL/USUAL | THYROID PAPILLARY CARCINOMA - FOLLICULAR (>= 99% FOLLICULAR PATTERNED) | THYROID PAPILLARY CARCINOMA - TALL CELL (>= 50% TALL CELL FEATURES) |
|---|---|---|---|---|
| ALL | 8 | 117 | 64 | 22 |
| subtype1 | 6 | 13 | 48 | 3 |
| subtype2 | 1 | 21 | 4 | 4 |
| subtype3 | 1 | 83 | 12 | 15 |
Figure S10. Get High-res Image Clustering Approach #2: 'METHLYATION CNMF' versus Clinical Feature #4: 'HISTOLOGICAL.TYPE'
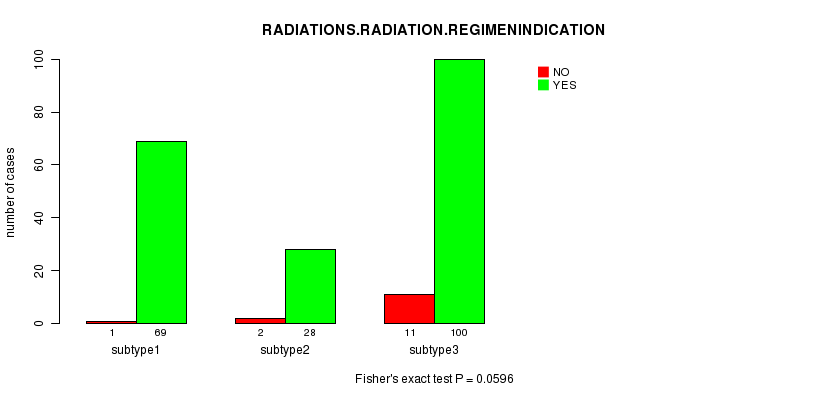
P value = 0.0596 (Fisher's exact test)
Table S13. Clustering Approach #2: 'METHLYATION CNMF' versus Clinical Feature #5: 'RADIATIONS.RADIATION.REGIMENINDICATION'
| nPatients | NO | YES |
|---|---|---|
| ALL | 14 | 197 |
| subtype1 | 1 | 69 |
| subtype2 | 2 | 28 |
| subtype3 | 11 | 100 |
Figure S11. Get High-res Image Clustering Approach #2: 'METHLYATION CNMF' versus Clinical Feature #5: 'RADIATIONS.RADIATION.REGIMENINDICATION'
P value = 1 (Fisher's exact test)
Table S14. Clustering Approach #2: 'METHLYATION CNMF' versus Clinical Feature #6: 'NEOADJUVANT.THERAPY'
| nPatients | NO | YES |
|---|---|---|
| ALL | 3 | 208 |
| subtype1 | 1 | 69 |
| subtype2 | 0 | 30 |
| subtype3 | 2 | 109 |
Figure S12. Get High-res Image Clustering Approach #2: 'METHLYATION CNMF' versus Clinical Feature #6: 'NEOADJUVANT.THERAPY'
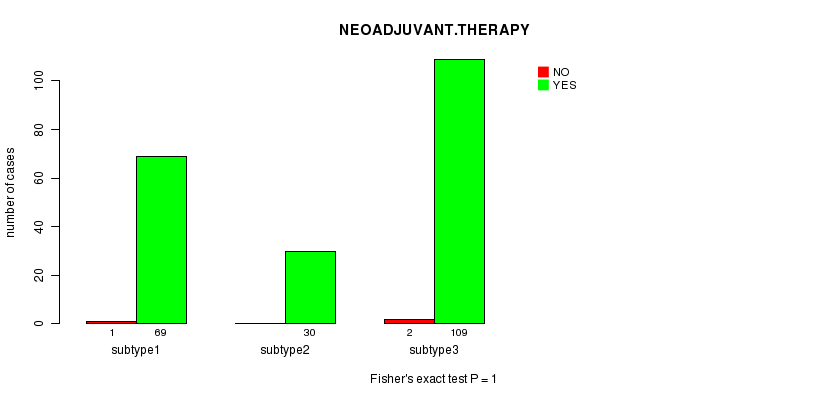
Table S15. Get Full Table Description of clustering approach #3: 'RPPA CNMF subtypes'
| Cluster Labels | 1 | 2 | 3 |
|---|---|---|---|
| Number of samples | 43 | 55 | 57 |
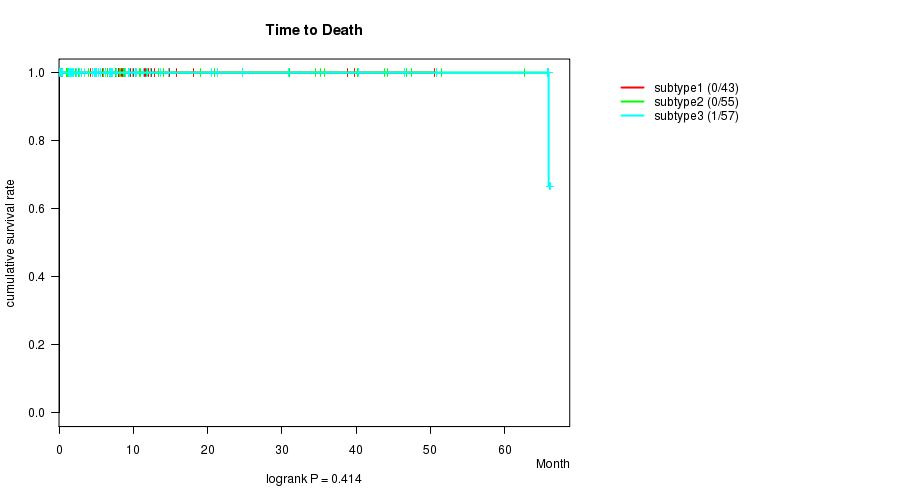
P value = 0.414 (logrank test)
Table S16. Clustering Approach #3: 'RPPA CNMF subtypes' versus Clinical Feature #1: 'Time to Death'
| nPatients | nDeath | Duration Range (Median), Month | |
|---|---|---|---|
| ALL | 155 | 1 | 0.1 - 66.1 (8.2) |
| subtype1 | 43 | 0 | 0.3 - 50.5 (8.1) |
| subtype2 | 55 | 0 | 0.2 - 65.9 (9.3) |
| subtype3 | 57 | 1 | 0.1 - 66.1 (7.7) |
Figure S13. Get High-res Image Clustering Approach #3: 'RPPA CNMF subtypes' versus Clinical Feature #1: 'Time to Death'
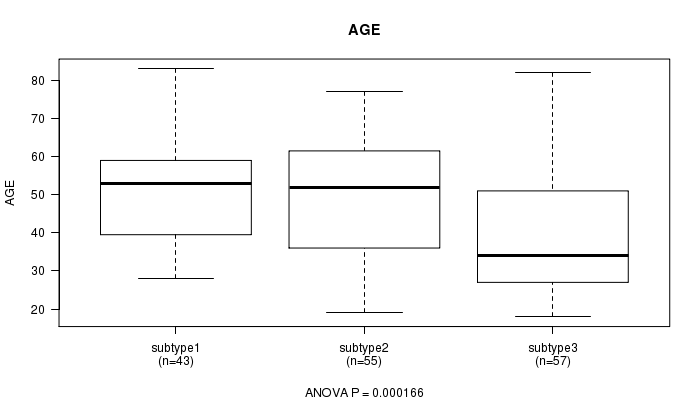
P value = 0.000166 (ANOVA)
Table S17. Clustering Approach #3: 'RPPA CNMF subtypes' versus Clinical Feature #2: 'AGE'
| nPatients | Mean (Std.Dev) | |
|---|---|---|
| ALL | 155 | 46.6 (16.2) |
| subtype1 | 43 | 50.8 (13.7) |
| subtype2 | 55 | 50.5 (16.2) |
| subtype3 | 57 | 39.6 (15.7) |
Figure S14. Get High-res Image Clustering Approach #3: 'RPPA CNMF subtypes' versus Clinical Feature #2: 'AGE'
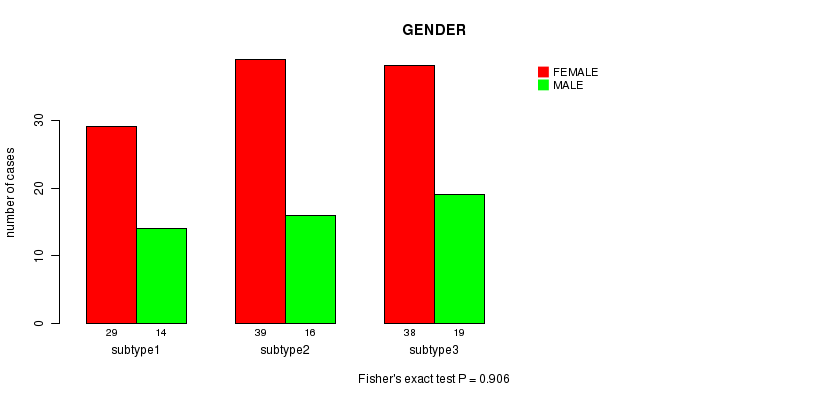
P value = 0.906 (Fisher's exact test)
Table S18. Clustering Approach #3: 'RPPA CNMF subtypes' versus Clinical Feature #3: 'GENDER'
| nPatients | FEMALE | MALE |
|---|---|---|
| ALL | 106 | 49 |
| subtype1 | 29 | 14 |
| subtype2 | 39 | 16 |
| subtype3 | 38 | 19 |
Figure S15. Get High-res Image Clustering Approach #3: 'RPPA CNMF subtypes' versus Clinical Feature #3: 'GENDER'
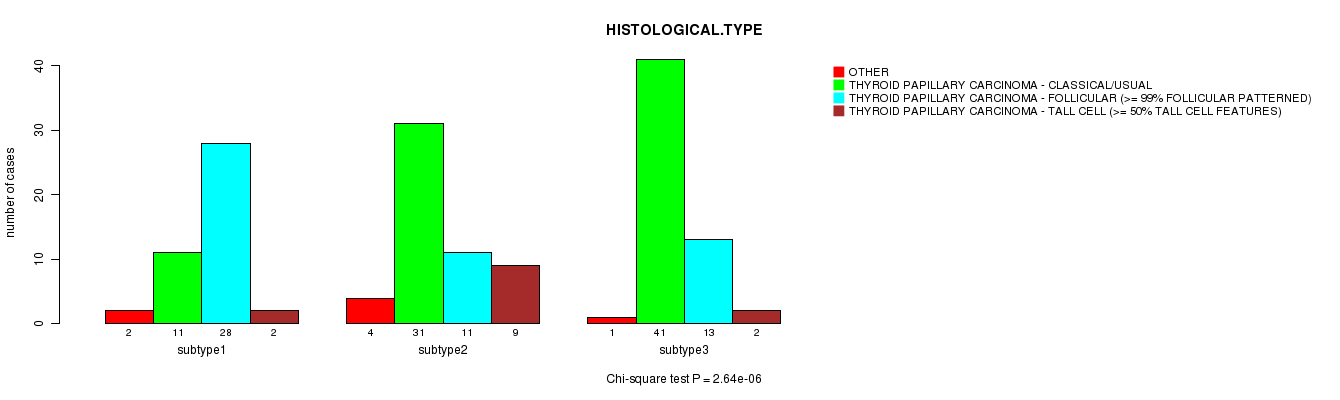
P value = 2.64e-06 (Chi-square test)
Table S19. Clustering Approach #3: 'RPPA CNMF subtypes' versus Clinical Feature #4: 'HISTOLOGICAL.TYPE'
| nPatients | OTHER | THYROID PAPILLARY CARCINOMA - CLASSICAL/USUAL | THYROID PAPILLARY CARCINOMA - FOLLICULAR (>= 99% FOLLICULAR PATTERNED) | THYROID PAPILLARY CARCINOMA - TALL CELL (>= 50% TALL CELL FEATURES) |
|---|---|---|---|---|
| ALL | 7 | 83 | 52 | 13 |
| subtype1 | 2 | 11 | 28 | 2 |
| subtype2 | 4 | 31 | 11 | 9 |
| subtype3 | 1 | 41 | 13 | 2 |
Figure S16. Get High-res Image Clustering Approach #3: 'RPPA CNMF subtypes' versus Clinical Feature #4: 'HISTOLOGICAL.TYPE'
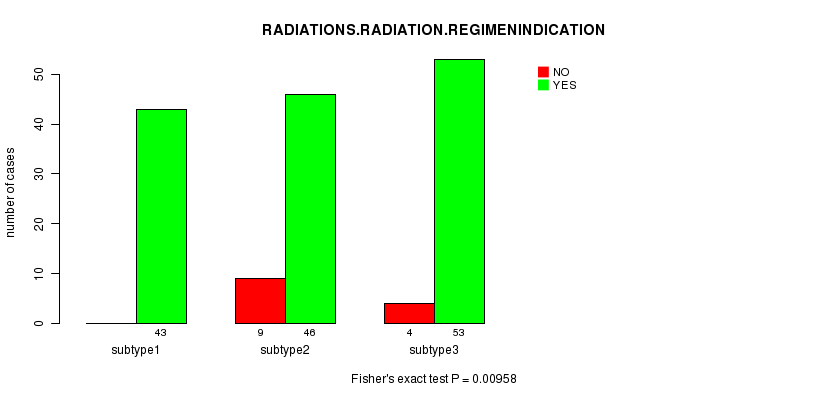
P value = 0.00958 (Fisher's exact test)
Table S20. Clustering Approach #3: 'RPPA CNMF subtypes' versus Clinical Feature #5: 'RADIATIONS.RADIATION.REGIMENINDICATION'
| nPatients | NO | YES |
|---|---|---|
| ALL | 13 | 142 |
| subtype1 | 0 | 43 |
| subtype2 | 9 | 46 |
| subtype3 | 4 | 53 |
Figure S17. Get High-res Image Clustering Approach #3: 'RPPA CNMF subtypes' versus Clinical Feature #5: 'RADIATIONS.RADIATION.REGIMENINDICATION'
P value = 0.779 (Fisher's exact test)
Table S21. Clustering Approach #3: 'RPPA CNMF subtypes' versus Clinical Feature #6: 'NEOADJUVANT.THERAPY'
| nPatients | NO | YES |
|---|---|---|
| ALL | 3 | 152 |
| subtype1 | 0 | 43 |
| subtype2 | 1 | 54 |
| subtype3 | 2 | 55 |
Figure S18. Get High-res Image Clustering Approach #3: 'RPPA CNMF subtypes' versus Clinical Feature #6: 'NEOADJUVANT.THERAPY'
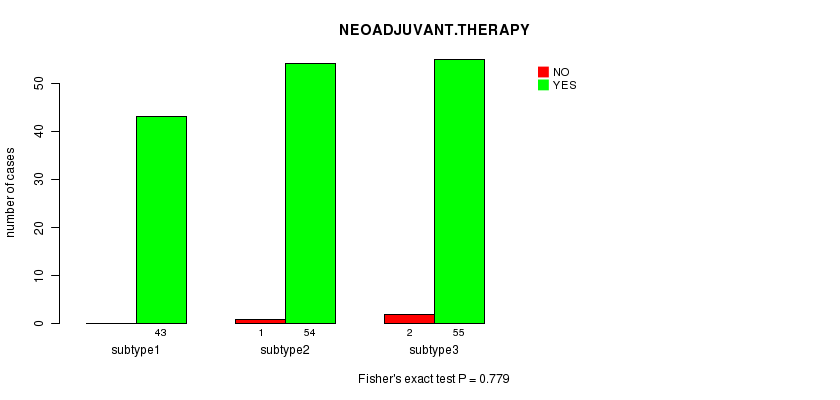
Table S22. Get Full Table Description of clustering approach #4: 'RPPA cHierClus subtypes'
| Cluster Labels | 1 | 2 | 3 |
|---|---|---|---|
| Number of samples | 23 | 66 | 66 |
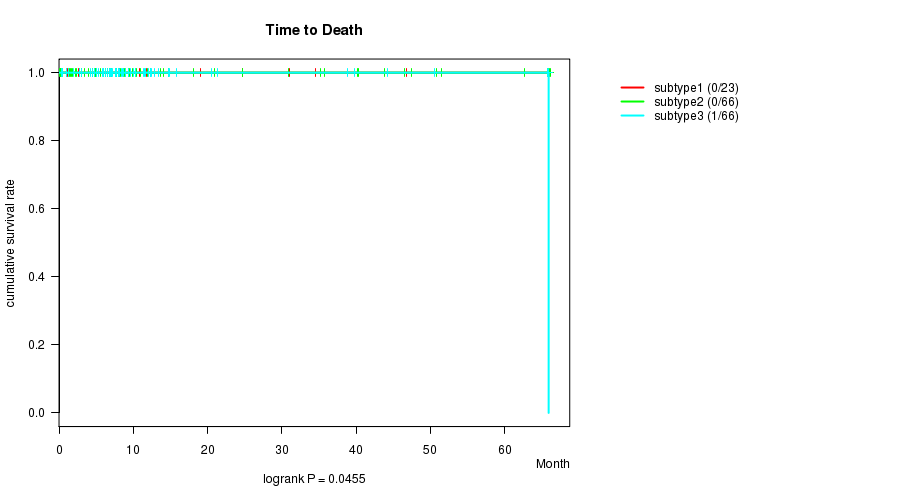
P value = 0.0455 (logrank test)
Table S23. Clustering Approach #4: 'RPPA cHierClus subtypes' versus Clinical Feature #1: 'Time to Death'
| nPatients | nDeath | Duration Range (Median), Month | |
|---|---|---|---|
| ALL | 155 | 1 | 0.1 - 66.1 (8.2) |
| subtype1 | 23 | 0 | 1.1 - 65.9 (8.1) |
| subtype2 | 66 | 0 | 0.1 - 66.1 (9.2) |
| subtype3 | 66 | 1 | 0.3 - 65.9 (8.0) |
Figure S19. Get High-res Image Clustering Approach #4: 'RPPA cHierClus subtypes' versus Clinical Feature #1: 'Time to Death'
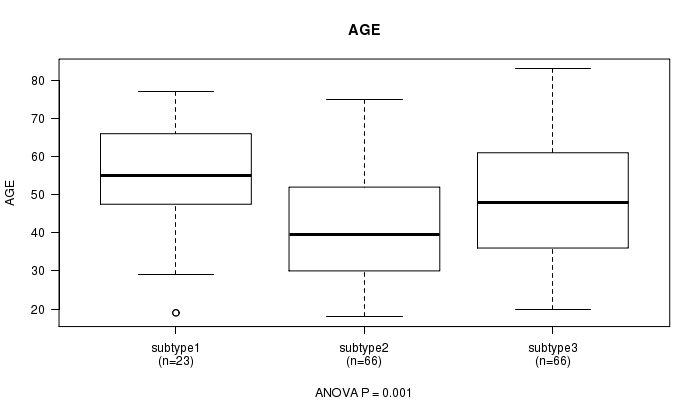
P value = 0.001 (ANOVA)
Table S24. Clustering Approach #4: 'RPPA cHierClus subtypes' versus Clinical Feature #2: 'AGE'
| nPatients | Mean (Std.Dev) | |
|---|---|---|
| ALL | 155 | 46.6 (16.2) |
| subtype1 | 23 | 53.6 (16.7) |
| subtype2 | 66 | 41.3 (15.0) |
| subtype3 | 66 | 49.4 (15.7) |
Figure S20. Get High-res Image Clustering Approach #4: 'RPPA cHierClus subtypes' versus Clinical Feature #2: 'AGE'
P value = 0.39 (Fisher's exact test)
Table S25. Clustering Approach #4: 'RPPA cHierClus subtypes' versus Clinical Feature #3: 'GENDER'
| nPatients | FEMALE | MALE |
|---|---|---|
| ALL | 106 | 49 |
| subtype1 | 17 | 6 |
| subtype2 | 48 | 18 |
| subtype3 | 41 | 25 |
Figure S21. Get High-res Image Clustering Approach #4: 'RPPA cHierClus subtypes' versus Clinical Feature #3: 'GENDER'
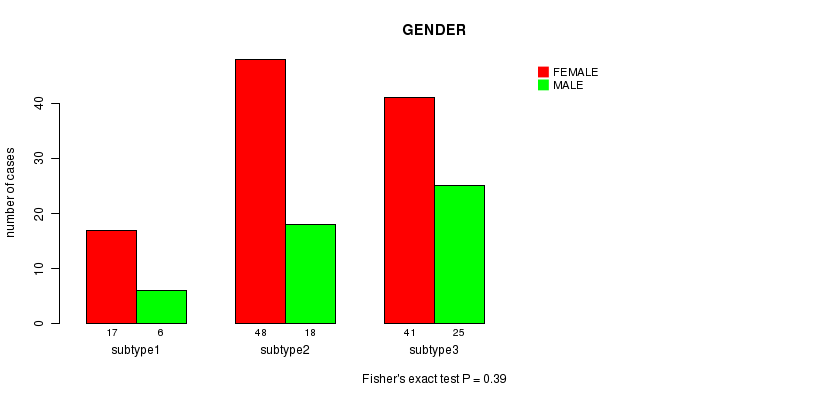
P value = 1.74e-11 (Chi-square test)
Table S26. Clustering Approach #4: 'RPPA cHierClus subtypes' versus Clinical Feature #4: 'HISTOLOGICAL.TYPE'
| nPatients | OTHER | THYROID PAPILLARY CARCINOMA - CLASSICAL/USUAL | THYROID PAPILLARY CARCINOMA - FOLLICULAR (>= 99% FOLLICULAR PATTERNED) | THYROID PAPILLARY CARCINOMA - TALL CELL (>= 50% TALL CELL FEATURES) |
|---|---|---|---|---|
| ALL | 7 | 83 | 52 | 13 |
| subtype1 | 5 | 7 | 10 | 1 |
| subtype2 | 1 | 53 | 4 | 8 |
| subtype3 | 1 | 23 | 38 | 4 |
Figure S22. Get High-res Image Clustering Approach #4: 'RPPA cHierClus subtypes' versus Clinical Feature #4: 'HISTOLOGICAL.TYPE'
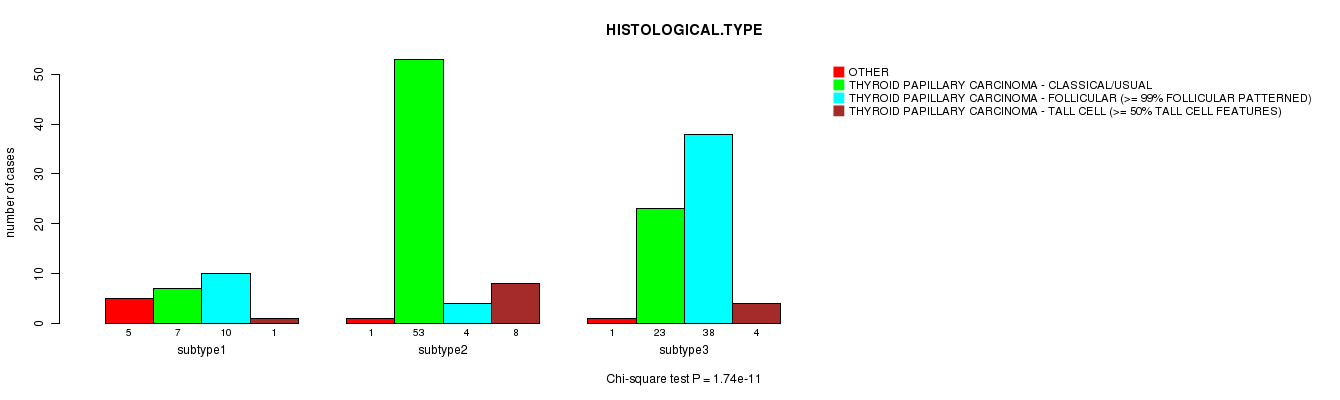
P value = 0.331 (Fisher's exact test)
Table S27. Clustering Approach #4: 'RPPA cHierClus subtypes' versus Clinical Feature #5: 'RADIATIONS.RADIATION.REGIMENINDICATION'
| nPatients | NO | YES |
|---|---|---|
| ALL | 13 | 142 |
| subtype1 | 2 | 21 |
| subtype2 | 8 | 58 |
| subtype3 | 3 | 63 |
Figure S23. Get High-res Image Clustering Approach #4: 'RPPA cHierClus subtypes' versus Clinical Feature #5: 'RADIATIONS.RADIATION.REGIMENINDICATION'
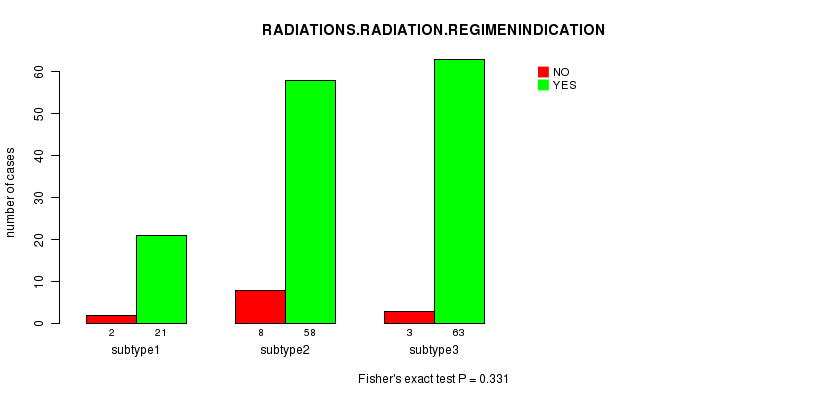
P value = 1 (Fisher's exact test)
Table S28. Clustering Approach #4: 'RPPA cHierClus subtypes' versus Clinical Feature #6: 'NEOADJUVANT.THERAPY'
| nPatients | NO | YES |
|---|---|---|
| ALL | 3 | 152 |
| subtype1 | 0 | 23 |
| subtype2 | 2 | 64 |
| subtype3 | 1 | 65 |
Figure S24. Get High-res Image Clustering Approach #4: 'RPPA cHierClus subtypes' versus Clinical Feature #6: 'NEOADJUVANT.THERAPY'
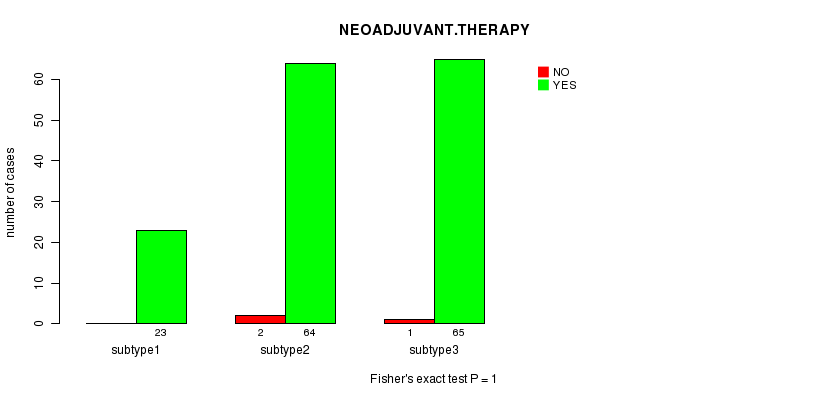
Table S29. Get Full Table Description of clustering approach #5: 'RNAseq CNMF subtypes'
| Cluster Labels | 1 | 2 | 3 | 4 |
|---|---|---|---|---|
| Number of samples | 58 | 16 | 43 | 56 |
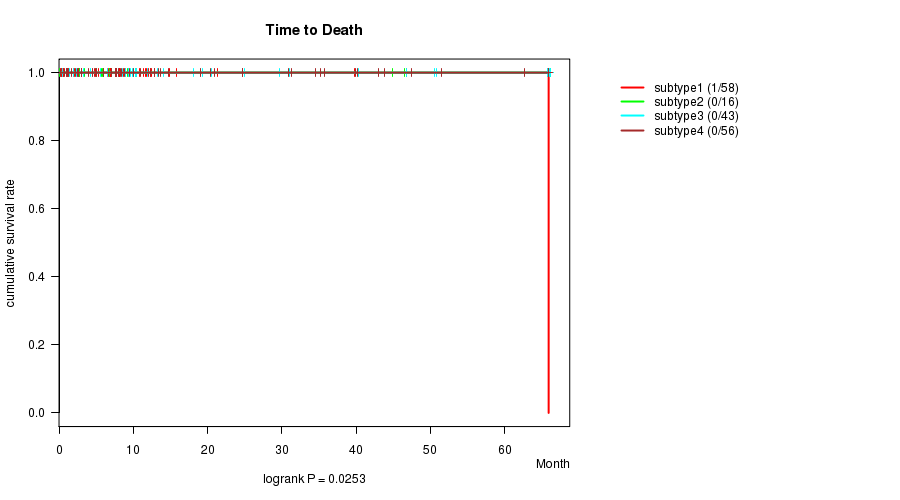
P value = 0.0253 (logrank test)
Table S30. Clustering Approach #5: 'RNAseq CNMF subtypes' versus Clinical Feature #1: 'Time to Death'
| nPatients | nDeath | Duration Range (Median), Month | |
|---|---|---|---|
| ALL | 173 | 1 | 0.1 - 66.1 (8.2) |
| subtype1 | 58 | 1 | 0.3 - 65.9 (6.9) |
| subtype2 | 16 | 0 | 0.1 - 66.1 (6.4) |
| subtype3 | 43 | 0 | 0.2 - 66.1 (10.0) |
| subtype4 | 56 | 0 | 0.2 - 65.9 (11.6) |
Figure S25. Get High-res Image Clustering Approach #5: 'RNAseq CNMF subtypes' versus Clinical Feature #1: 'Time to Death'
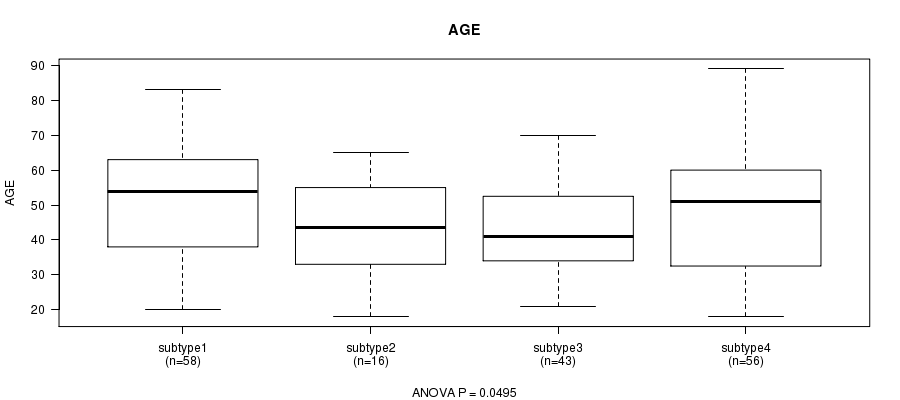
P value = 0.0495 (ANOVA)
Table S31. Clustering Approach #5: 'RNAseq CNMF subtypes' versus Clinical Feature #2: 'AGE'
| nPatients | Mean (Std.Dev) | |
|---|---|---|
| ALL | 173 | 47.3 (16.0) |
| subtype1 | 58 | 51.3 (17.1) |
| subtype2 | 16 | 43.2 (14.6) |
| subtype3 | 43 | 43.0 (12.6) |
| subtype4 | 56 | 47.6 (16.9) |
Figure S26. Get High-res Image Clustering Approach #5: 'RNAseq CNMF subtypes' versus Clinical Feature #2: 'AGE'
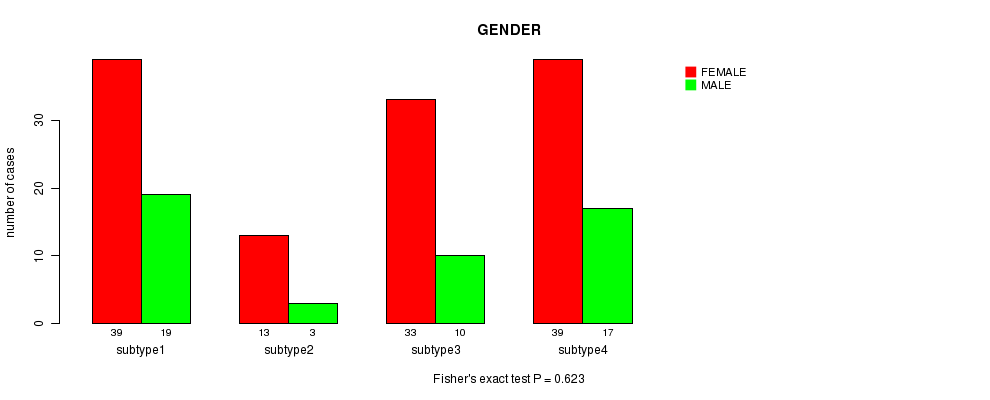
P value = 0.623 (Fisher's exact test)
Table S32. Clustering Approach #5: 'RNAseq CNMF subtypes' versus Clinical Feature #3: 'GENDER'
| nPatients | FEMALE | MALE |
|---|---|---|
| ALL | 124 | 49 |
| subtype1 | 39 | 19 |
| subtype2 | 13 | 3 |
| subtype3 | 33 | 10 |
| subtype4 | 39 | 17 |
Figure S27. Get High-res Image Clustering Approach #5: 'RNAseq CNMF subtypes' versus Clinical Feature #3: 'GENDER'
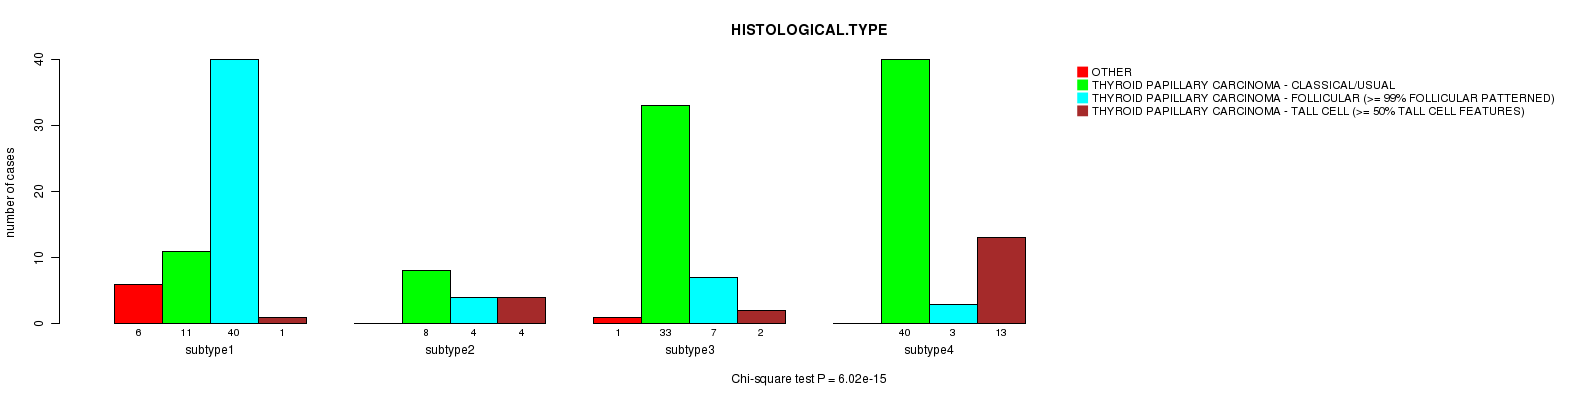
P value = 6.02e-15 (Chi-square test)
Table S33. Clustering Approach #5: 'RNAseq CNMF subtypes' versus Clinical Feature #4: 'HISTOLOGICAL.TYPE'
| nPatients | OTHER | THYROID PAPILLARY CARCINOMA - CLASSICAL/USUAL | THYROID PAPILLARY CARCINOMA - FOLLICULAR (>= 99% FOLLICULAR PATTERNED) | THYROID PAPILLARY CARCINOMA - TALL CELL (>= 50% TALL CELL FEATURES) |
|---|---|---|---|---|
| ALL | 7 | 92 | 54 | 20 |
| subtype1 | 6 | 11 | 40 | 1 |
| subtype2 | 0 | 8 | 4 | 4 |
| subtype3 | 1 | 33 | 7 | 2 |
| subtype4 | 0 | 40 | 3 | 13 |
Figure S28. Get High-res Image Clustering Approach #5: 'RNAseq CNMF subtypes' versus Clinical Feature #4: 'HISTOLOGICAL.TYPE'
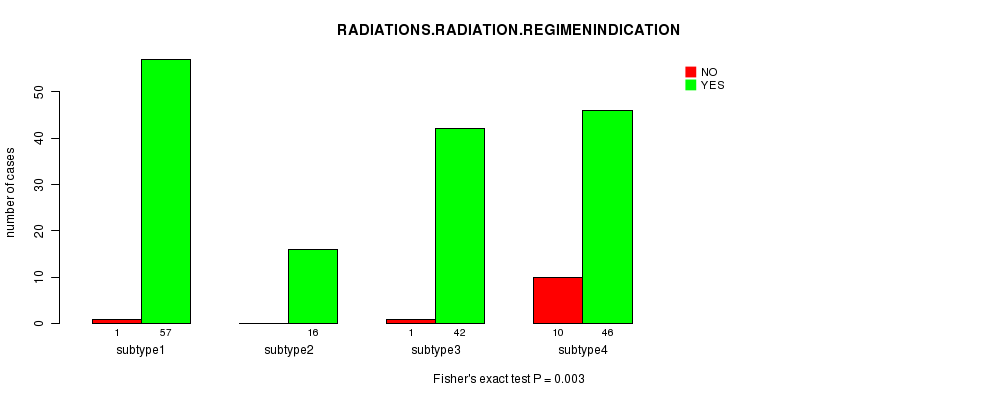
P value = 0.003 (Fisher's exact test)
Table S34. Clustering Approach #5: 'RNAseq CNMF subtypes' versus Clinical Feature #5: 'RADIATIONS.RADIATION.REGIMENINDICATION'
| nPatients | NO | YES |
|---|---|---|
| ALL | 12 | 161 |
| subtype1 | 1 | 57 |
| subtype2 | 0 | 16 |
| subtype3 | 1 | 42 |
| subtype4 | 10 | 46 |
Figure S29. Get High-res Image Clustering Approach #5: 'RNAseq CNMF subtypes' versus Clinical Feature #5: 'RADIATIONS.RADIATION.REGIMENINDICATION'
P value = 1 (Fisher's exact test)
Table S35. Clustering Approach #5: 'RNAseq CNMF subtypes' versus Clinical Feature #6: 'NEOADJUVANT.THERAPY'
| nPatients | NO | YES |
|---|---|---|
| ALL | 3 | 170 |
| subtype1 | 1 | 57 |
| subtype2 | 0 | 16 |
| subtype3 | 1 | 42 |
| subtype4 | 1 | 55 |
Figure S30. Get High-res Image Clustering Approach #5: 'RNAseq CNMF subtypes' versus Clinical Feature #6: 'NEOADJUVANT.THERAPY'
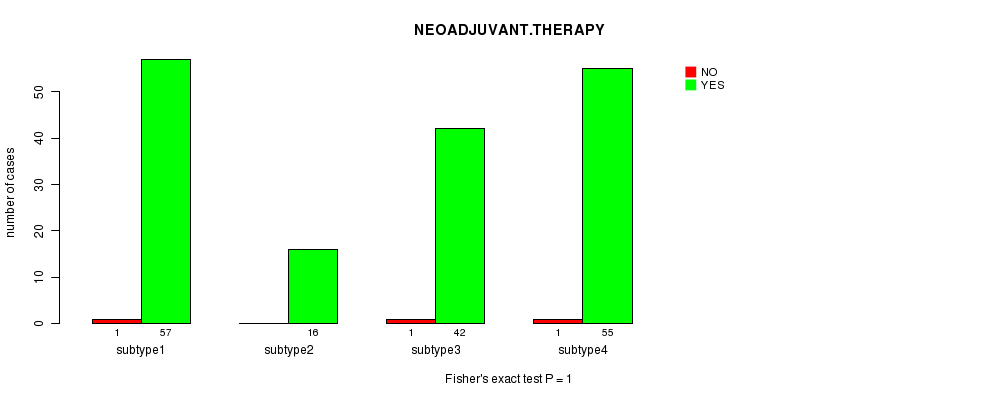
Table S36. Get Full Table Description of clustering approach #6: 'RNAseq cHierClus subtypes'
| Cluster Labels | 1 | 2 | 3 |
|---|---|---|---|
| Number of samples | 1 | 110 | 62 |
P value = 0.0253 (logrank test)
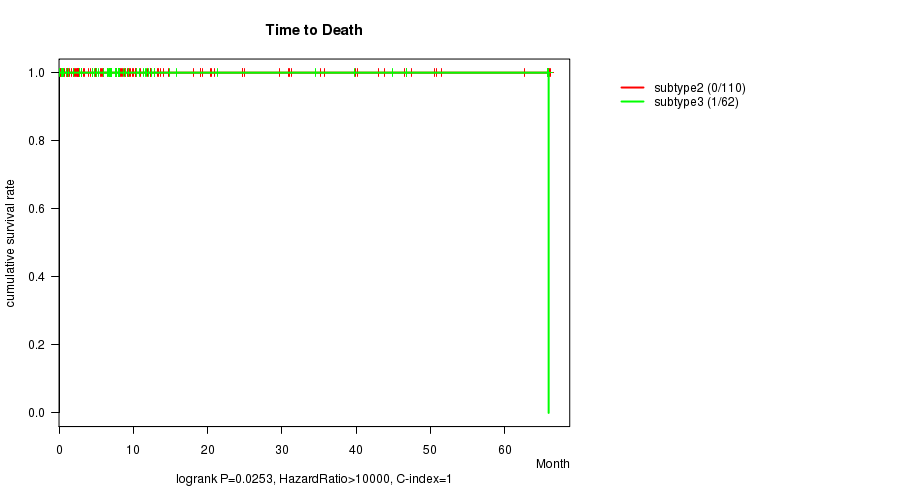
Table S37. Clustering Approach #6: 'RNAseq cHierClus subtypes' versus Clinical Feature #1: 'Time to Death'
| nPatients | nDeath | Duration Range (Median), Month | |
|---|---|---|---|
| ALL | 172 | 1 | 0.1 - 66.1 (8.2) |
| subtype2 | 110 | 0 | 0.2 - 66.1 (9.5) |
| subtype3 | 62 | 1 | 0.1 - 65.9 (7.0) |
Figure S31. Get High-res Image Clustering Approach #6: 'RNAseq cHierClus subtypes' versus Clinical Feature #1: 'Time to Death'
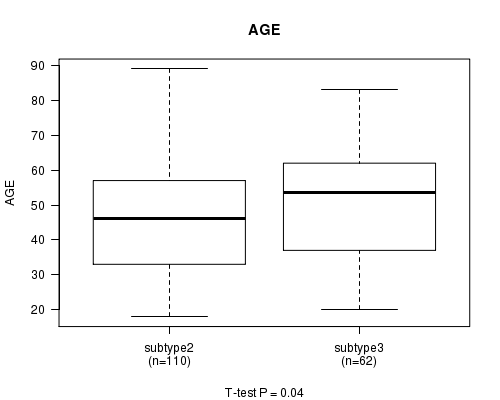
P value = 0.04 (t-test)
Table S38. Clustering Approach #6: 'RNAseq cHierClus subtypes' versus Clinical Feature #2: 'AGE'
| nPatients | Mean (Std.Dev) | |
|---|---|---|
| ALL | 172 | 47.4 (16.0) |
| subtype2 | 110 | 45.5 (15.2) |
| subtype3 | 62 | 50.9 (16.7) |
Figure S32. Get High-res Image Clustering Approach #6: 'RNAseq cHierClus subtypes' versus Clinical Feature #2: 'AGE'
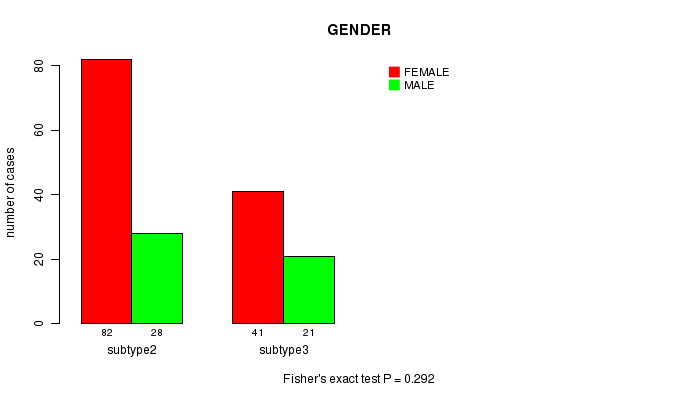
P value = 0.292 (Fisher's exact test)
Table S39. Clustering Approach #6: 'RNAseq cHierClus subtypes' versus Clinical Feature #3: 'GENDER'
| nPatients | FEMALE | MALE |
|---|---|---|
| ALL | 123 | 49 |
| subtype2 | 82 | 28 |
| subtype3 | 41 | 21 |
Figure S33. Get High-res Image Clustering Approach #6: 'RNAseq cHierClus subtypes' versus Clinical Feature #3: 'GENDER'
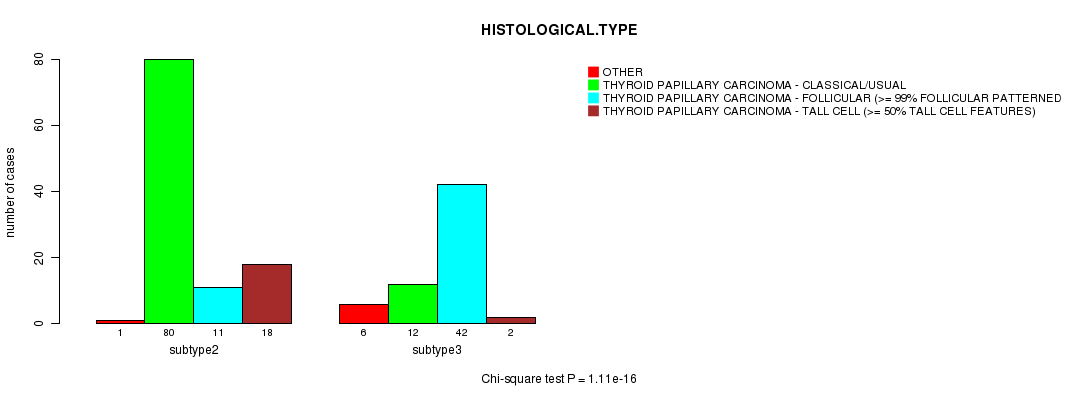
P value = 1.11e-16 (Chi-square test)
Table S40. Clustering Approach #6: 'RNAseq cHierClus subtypes' versus Clinical Feature #4: 'HISTOLOGICAL.TYPE'
| nPatients | OTHER | THYROID PAPILLARY CARCINOMA - CLASSICAL/USUAL | THYROID PAPILLARY CARCINOMA - FOLLICULAR (>= 99% FOLLICULAR PATTERNED) | THYROID PAPILLARY CARCINOMA - TALL CELL (>= 50% TALL CELL FEATURES) |
|---|---|---|---|---|
| ALL | 7 | 92 | 53 | 20 |
| subtype2 | 1 | 80 | 11 | 18 |
| subtype3 | 6 | 12 | 42 | 2 |
Figure S34. Get High-res Image Clustering Approach #6: 'RNAseq cHierClus subtypes' versus Clinical Feature #4: 'HISTOLOGICAL.TYPE'
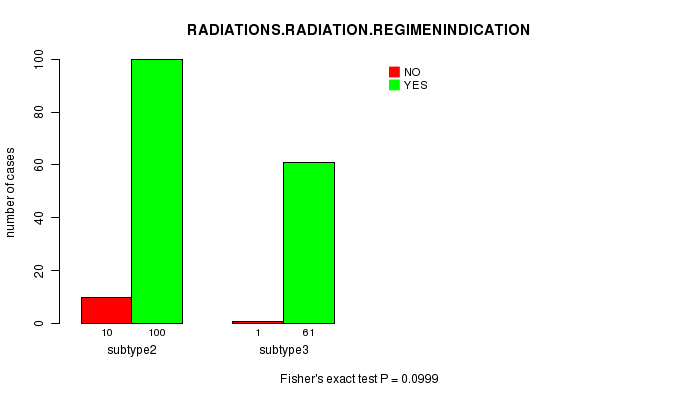
P value = 0.0999 (Fisher's exact test)
Table S41. Clustering Approach #6: 'RNAseq cHierClus subtypes' versus Clinical Feature #5: 'RADIATIONS.RADIATION.REGIMENINDICATION'
| nPatients | NO | YES |
|---|---|---|
| ALL | 11 | 161 |
| subtype2 | 10 | 100 |
| subtype3 | 1 | 61 |
Figure S35. Get High-res Image Clustering Approach #6: 'RNAseq cHierClus subtypes' versus Clinical Feature #5: 'RADIATIONS.RADIATION.REGIMENINDICATION'
P value = 1 (Fisher's exact test)
Table S42. Clustering Approach #6: 'RNAseq cHierClus subtypes' versus Clinical Feature #6: 'NEOADJUVANT.THERAPY'
| nPatients | NO | YES |
|---|---|---|
| ALL | 2 | 170 |
| subtype2 | 1 | 109 |
| subtype3 | 1 | 61 |
Figure S36. Get High-res Image Clustering Approach #6: 'RNAseq cHierClus subtypes' versus Clinical Feature #6: 'NEOADJUVANT.THERAPY'
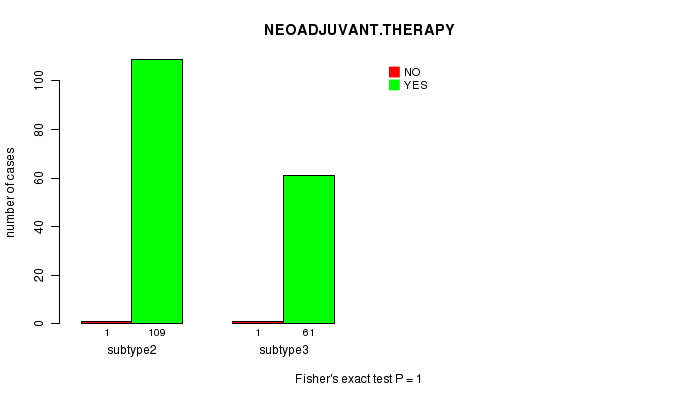
Table S43. Get Full Table Description of clustering approach #7: 'MIRseq CNMF subtypes'
| Cluster Labels | 1 | 2 | 3 |
|---|---|---|---|
| Number of samples | 71 | 81 | 58 |
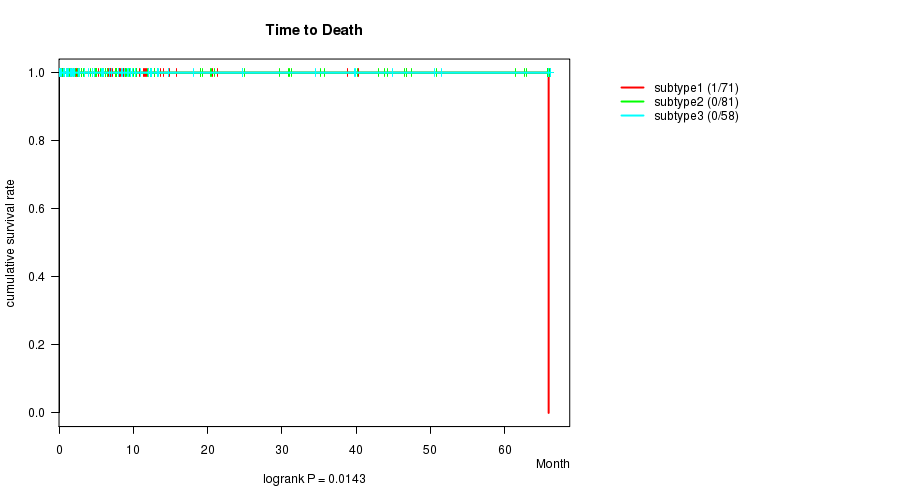
P value = 0.0143 (logrank test)
Table S44. Clustering Approach #7: 'MIRseq CNMF subtypes' versus Clinical Feature #1: 'Time to Death'
| nPatients | nDeath | Duration Range (Median), Month | |
|---|---|---|---|
| ALL | 210 | 1 | 0.0 - 66.1 (8.2) |
| subtype1 | 71 | 1 | 0.3 - 65.9 (7.2) |
| subtype2 | 81 | 0 | 0.2 - 66.1 (10.4) |
| subtype3 | 58 | 0 | 0.0 - 66.1 (8.0) |
Figure S37. Get High-res Image Clustering Approach #7: 'MIRseq CNMF subtypes' versus Clinical Feature #1: 'Time to Death'
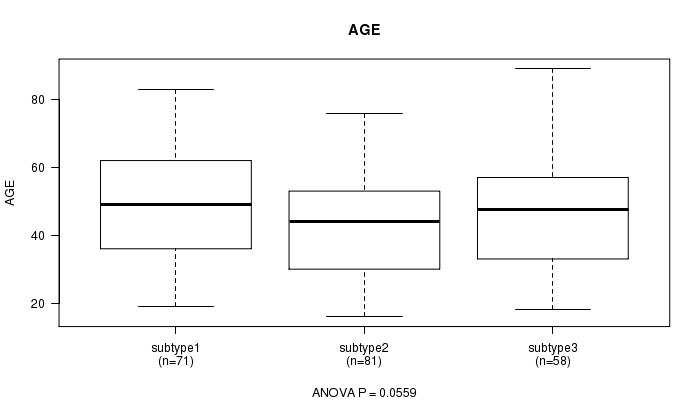
P value = 0.0559 (ANOVA)
Table S45. Clustering Approach #7: 'MIRseq CNMF subtypes' versus Clinical Feature #2: 'AGE'
| nPatients | Mean (Std.Dev) | |
|---|---|---|
| ALL | 210 | 46.6 (16.0) |
| subtype1 | 71 | 49.7 (16.9) |
| subtype2 | 81 | 43.5 (15.1) |
| subtype3 | 58 | 47.2 (15.5) |
Figure S38. Get High-res Image Clustering Approach #7: 'MIRseq CNMF subtypes' versus Clinical Feature #2: 'AGE'
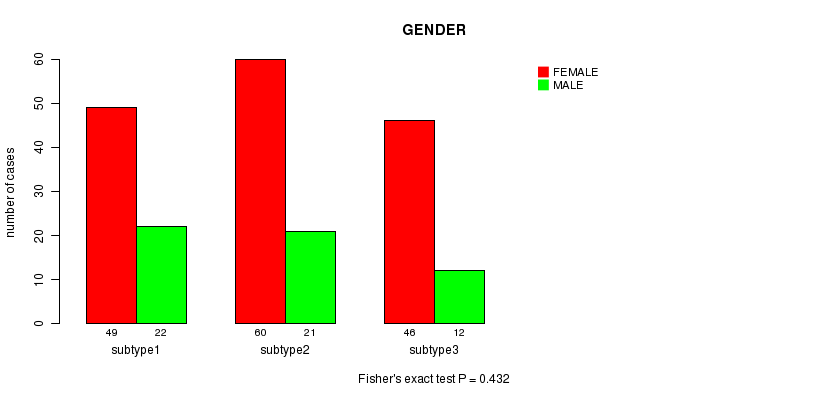
P value = 0.432 (Fisher's exact test)
Table S46. Clustering Approach #7: 'MIRseq CNMF subtypes' versus Clinical Feature #3: 'GENDER'
| nPatients | FEMALE | MALE |
|---|---|---|
| ALL | 155 | 55 |
| subtype1 | 49 | 22 |
| subtype2 | 60 | 21 |
| subtype3 | 46 | 12 |
Figure S39. Get High-res Image Clustering Approach #7: 'MIRseq CNMF subtypes' versus Clinical Feature #3: 'GENDER'
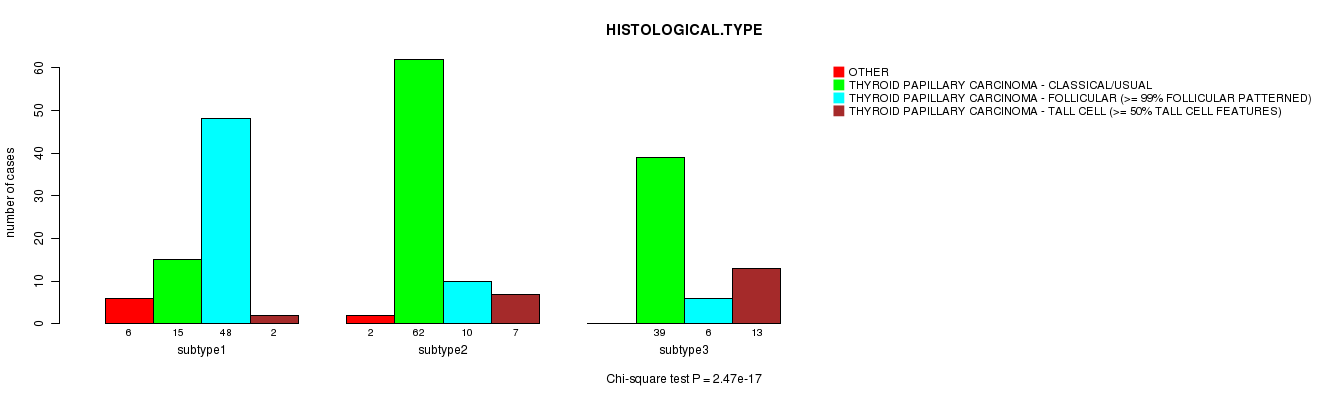
P value = 2.47e-17 (Chi-square test)
Table S47. Clustering Approach #7: 'MIRseq CNMF subtypes' versus Clinical Feature #4: 'HISTOLOGICAL.TYPE'
| nPatients | OTHER | THYROID PAPILLARY CARCINOMA - CLASSICAL/USUAL | THYROID PAPILLARY CARCINOMA - FOLLICULAR (>= 99% FOLLICULAR PATTERNED) | THYROID PAPILLARY CARCINOMA - TALL CELL (>= 50% TALL CELL FEATURES) |
|---|---|---|---|---|
| ALL | 8 | 116 | 64 | 22 |
| subtype1 | 6 | 15 | 48 | 2 |
| subtype2 | 2 | 62 | 10 | 7 |
| subtype3 | 0 | 39 | 6 | 13 |
Figure S40. Get High-res Image Clustering Approach #7: 'MIRseq CNMF subtypes' versus Clinical Feature #4: 'HISTOLOGICAL.TYPE'
P value = 0.393 (Fisher's exact test)
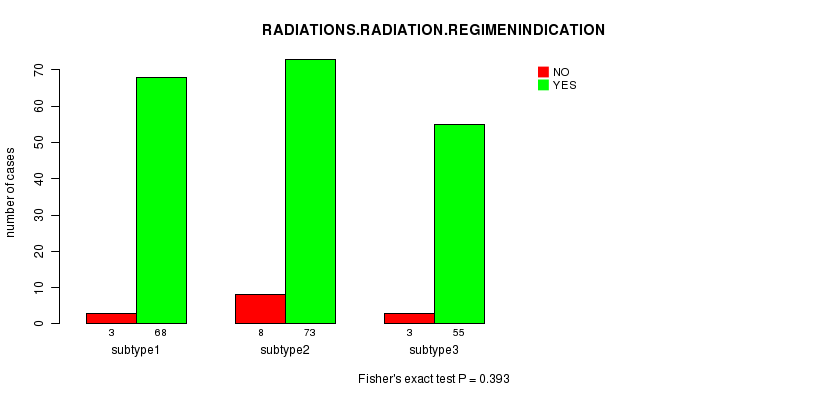
Table S48. Clustering Approach #7: 'MIRseq CNMF subtypes' versus Clinical Feature #5: 'RADIATIONS.RADIATION.REGIMENINDICATION'
| nPatients | NO | YES |
|---|---|---|
| ALL | 14 | 196 |
| subtype1 | 3 | 68 |
| subtype2 | 8 | 73 |
| subtype3 | 3 | 55 |
Figure S41. Get High-res Image Clustering Approach #7: 'MIRseq CNMF subtypes' versus Clinical Feature #5: 'RADIATIONS.RADIATION.REGIMENINDICATION'
P value = 0.63 (Fisher's exact test)
Table S49. Clustering Approach #7: 'MIRseq CNMF subtypes' versus Clinical Feature #6: 'NEOADJUVANT.THERAPY'
| nPatients | NO | YES |
|---|---|---|
| ALL | 3 | 207 |
| subtype1 | 2 | 69 |
| subtype2 | 1 | 80 |
| subtype3 | 0 | 58 |
Figure S42. Get High-res Image Clustering Approach #7: 'MIRseq CNMF subtypes' versus Clinical Feature #6: 'NEOADJUVANT.THERAPY'
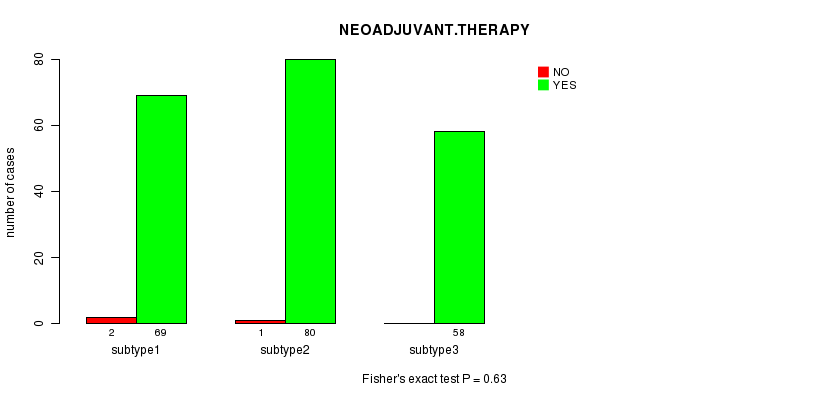
Table S50. Get Full Table Description of clustering approach #8: 'MIRseq cHierClus subtypes'
| Cluster Labels | 1 | 2 | 3 |
|---|---|---|---|
| Number of samples | 65 | 82 | 63 |
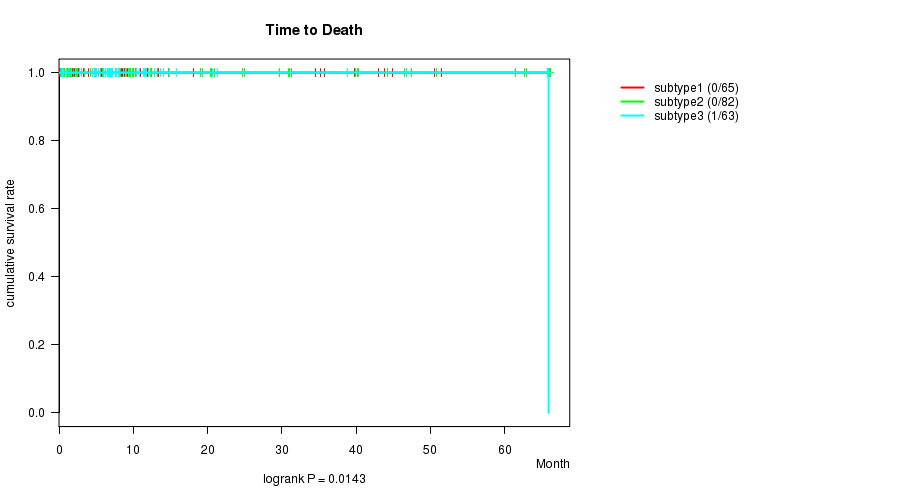
P value = 0.0143 (logrank test)
Table S51. Clustering Approach #8: 'MIRseq cHierClus subtypes' versus Clinical Feature #1: 'Time to Death'
| nPatients | nDeath | Duration Range (Median), Month | |
|---|---|---|---|
| ALL | 210 | 1 | 0.0 - 66.1 (8.2) |
| subtype1 | 65 | 0 | 0.0 - 66.1 (8.0) |
| subtype2 | 82 | 0 | 0.2 - 66.1 (9.9) |
| subtype3 | 63 | 1 | 0.3 - 65.9 (7.1) |
Figure S43. Get High-res Image Clustering Approach #8: 'MIRseq cHierClus subtypes' versus Clinical Feature #1: 'Time to Death'
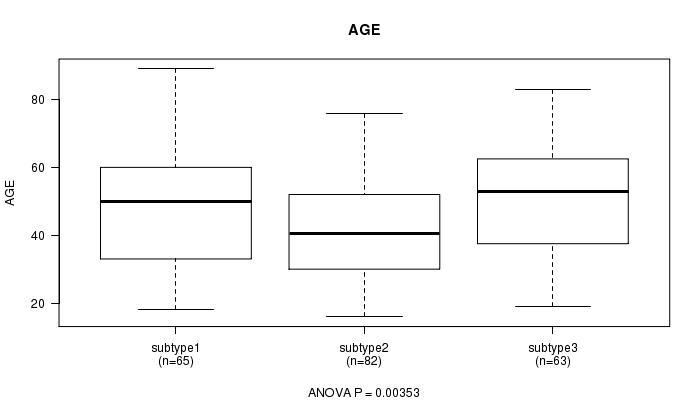
P value = 0.00353 (ANOVA)
Table S52. Clustering Approach #8: 'MIRseq cHierClus subtypes' versus Clinical Feature #2: 'AGE'
| nPatients | Mean (Std.Dev) | |
|---|---|---|
| ALL | 210 | 46.6 (16.0) |
| subtype1 | 65 | 48.1 (15.9) |
| subtype2 | 82 | 42.2 (14.8) |
| subtype3 | 63 | 50.8 (16.3) |
Figure S44. Get High-res Image Clustering Approach #8: 'MIRseq cHierClus subtypes' versus Clinical Feature #2: 'AGE'
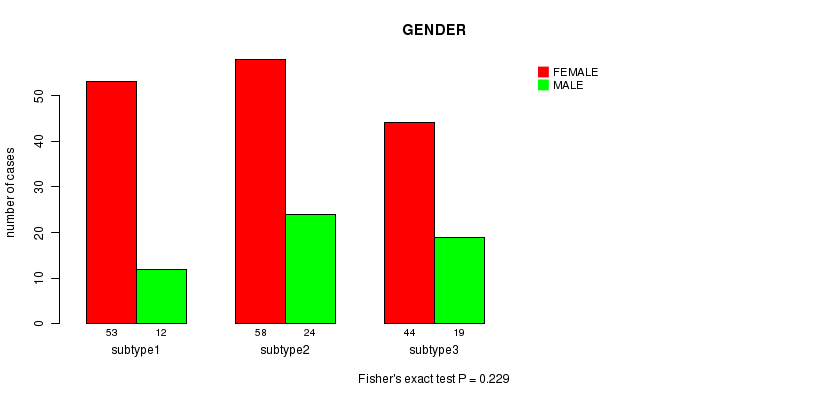
P value = 0.229 (Fisher's exact test)
Table S53. Clustering Approach #8: 'MIRseq cHierClus subtypes' versus Clinical Feature #3: 'GENDER'
| nPatients | FEMALE | MALE |
|---|---|---|
| ALL | 155 | 55 |
| subtype1 | 53 | 12 |
| subtype2 | 58 | 24 |
| subtype3 | 44 | 19 |
Figure S45. Get High-res Image Clustering Approach #8: 'MIRseq cHierClus subtypes' versus Clinical Feature #3: 'GENDER'
P value = 1.65e-19 (Chi-square test)
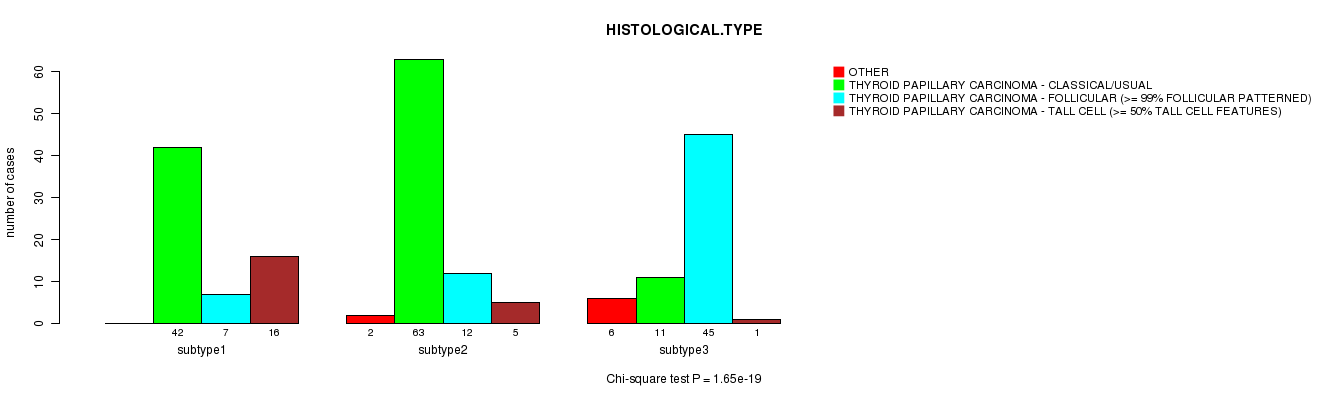
Table S54. Clustering Approach #8: 'MIRseq cHierClus subtypes' versus Clinical Feature #4: 'HISTOLOGICAL.TYPE'
| nPatients | OTHER | THYROID PAPILLARY CARCINOMA - CLASSICAL/USUAL | THYROID PAPILLARY CARCINOMA - FOLLICULAR (>= 99% FOLLICULAR PATTERNED) | THYROID PAPILLARY CARCINOMA - TALL CELL (>= 50% TALL CELL FEATURES) |
|---|---|---|---|---|
| ALL | 8 | 116 | 64 | 22 |
| subtype1 | 0 | 42 | 7 | 16 |
| subtype2 | 2 | 63 | 12 | 5 |
| subtype3 | 6 | 11 | 45 | 1 |
Figure S46. Get High-res Image Clustering Approach #8: 'MIRseq cHierClus subtypes' versus Clinical Feature #4: 'HISTOLOGICAL.TYPE'
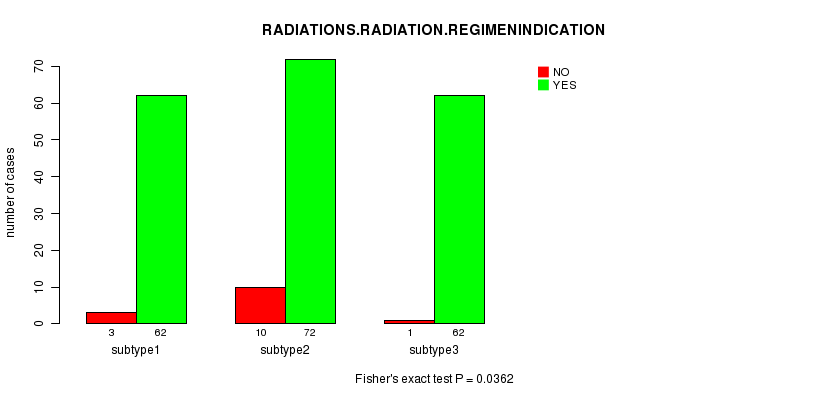
P value = 0.0362 (Fisher's exact test)
Table S55. Clustering Approach #8: 'MIRseq cHierClus subtypes' versus Clinical Feature #5: 'RADIATIONS.RADIATION.REGIMENINDICATION'
| nPatients | NO | YES |
|---|---|---|
| ALL | 14 | 196 |
| subtype1 | 3 | 62 |
| subtype2 | 10 | 72 |
| subtype3 | 1 | 62 |
Figure S47. Get High-res Image Clustering Approach #8: 'MIRseq cHierClus subtypes' versus Clinical Feature #5: 'RADIATIONS.RADIATION.REGIMENINDICATION'
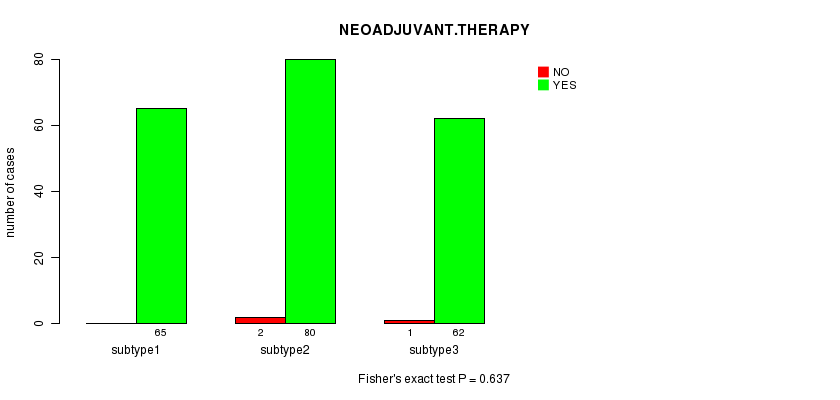
P value = 0.637 (Fisher's exact test)
Table S56. Clustering Approach #8: 'MIRseq cHierClus subtypes' versus Clinical Feature #6: 'NEOADJUVANT.THERAPY'
| nPatients | NO | YES |
|---|---|---|
| ALL | 3 | 207 |
| subtype1 | 0 | 65 |
| subtype2 | 2 | 80 |
| subtype3 | 1 | 62 |
Figure S48. Get High-res Image Clustering Approach #8: 'MIRseq cHierClus subtypes' versus Clinical Feature #6: 'NEOADJUVANT.THERAPY'
-
Cluster data file = THCA.mergedcluster.txt
-
Clinical data file = THCA.clin.merged.picked.txt
-
Number of patients = 211
-
Number of clustering approaches = 8
-
Number of selected clinical features = 6
-
Exclude small clusters that include fewer than K patients, K = 3
consensus non-negative matrix factorization clustering approach (Brunet et al. 2004)
Resampling-based clustering method (Monti et al. 2003)
For survival clinical features, the Kaplan-Meier survival curves of tumors with and without gene mutations were plotted and the statistical significance P values were estimated by logrank test (Bland and Altman 2004) using the 'survdiff' function in R
For continuous numerical clinical features, one-way analysis of variance (Howell 2002) was applied to compare the clinical values between tumor subtypes using 'anova' function in R
For binary clinical features, two-tailed Fisher's exact tests (Fisher 1922) were used to estimate the P values using the 'fisher.test' function in R
For multi-class clinical features (nominal or ordinal), Chi-square tests (Greenwood and Nikulin 1996) were used to estimate the P values using the 'chisq.test' function in R
For continuous numerical clinical features, two-tailed Student's t test with unequal variance (Lehmann and Romano 2005) was applied to compare the clinical values between two tumor subtypes using 't.test' function in R
This is an experimental feature. The full results of the analysis summarized in this report can be downloaded from the TCGA Data Coordination Center.