This report serves to describe the mutational landscape and properties of a given individual set, as well as rank genes and genesets according to mutational significance. MutSig v2.0 was used to generate the results found in this report.
-
Working with individual set: THCA
-
Number of patients in set: 323
The input for this pipeline is a set of individuals with the following files associated for each:
-
An annotated .maf file describing the mutations called for the respective individual, and their properties.
-
A .wig file that contains information about the coverage of the sample.
-
MAF used for this analysis:THCA.final_analysis_set.maf
-
Significantly mutated genes (q ≤ 0.1): 41
-
Mutations seen in COSMIC: 249
-
Significantly mutated genes in COSMIC territory: 11
-
Genes with clustered mutations (≤ 3 aa apart): 47
-
Significantly mutated genesets: 77
-
Significantly mutated genesets: (excluding sig. mutated genes):0
-
Read 323 MAFs of type "Broad"
-
Total number of mutations in input MAFs: 11439
-
After removing 99 mutations outside chr1-24: 11340
-
After removing 1339 blacklisted mutations: 10001
-
After removing 3104 noncoding mutations: 6897
-
After collapsing adjacent/redundant mutations: 6895
-
Number of mutations before filtering: 6895
-
After removing 289 mutations outside gene set: 6606
-
After removing 2 mutations outside category set: 6604
Table 1. Get Full Table Table representing breakdown of mutations by type.
| type | count |
|---|---|
| Frame_Shift_Del | 317 |
| Frame_Shift_Ins | 112 |
| In_Frame_Del | 117 |
| In_Frame_Ins | 18 |
| Missense_Mutation | 4143 |
| Nonsense_Mutation | 194 |
| Nonstop_Mutation | 4 |
| Silent | 1572 |
| Splice_Site | 120 |
| Translation_Start_Site | 7 |
| Total | 6604 |
Table 2. Get Full Table A breakdown of mutation rates per category discovered for this individual set.
| category | n | N | rate | rate_per_mb | relative_rate | exp_ns_s_ratio |
|---|---|---|---|---|---|---|
| *CpG->T | 782 | 526711238 | 1.5e-06 | 1.5 | 2.8 | 2.1 |
| *Cp(A/C/T)->T | 980 | 4313476957 | 2.3e-07 | 0.23 | 0.43 | 1.7 |
| A->G | 826 | 4649186676 | 1.8e-07 | 0.18 | 0.34 | 2.3 |
| transver | 1558 | 9489374871 | 1.6e-07 | 0.16 | 0.31 | 5 |
| indel+null | 884 | 9489374871 | 9.3e-08 | 0.093 | 0.18 | NaN |
| double_null | 2 | 9489374871 | 2.1e-10 | 0.00021 | 0.0004 | NaN |
| Total | 5032 | 9489374871 | 5.3e-07 | 0.53 | 1 | 3.5 |
The x axis represents the samples. The y axis represents the exons, one row per exon, and they are sorted by average coverage across samples. For exons with exactly the same average coverage, they are sorted next by the %GC of the exon. (The secondary sort is especially useful for the zero-coverage exons at the bottom).
Figure 1.
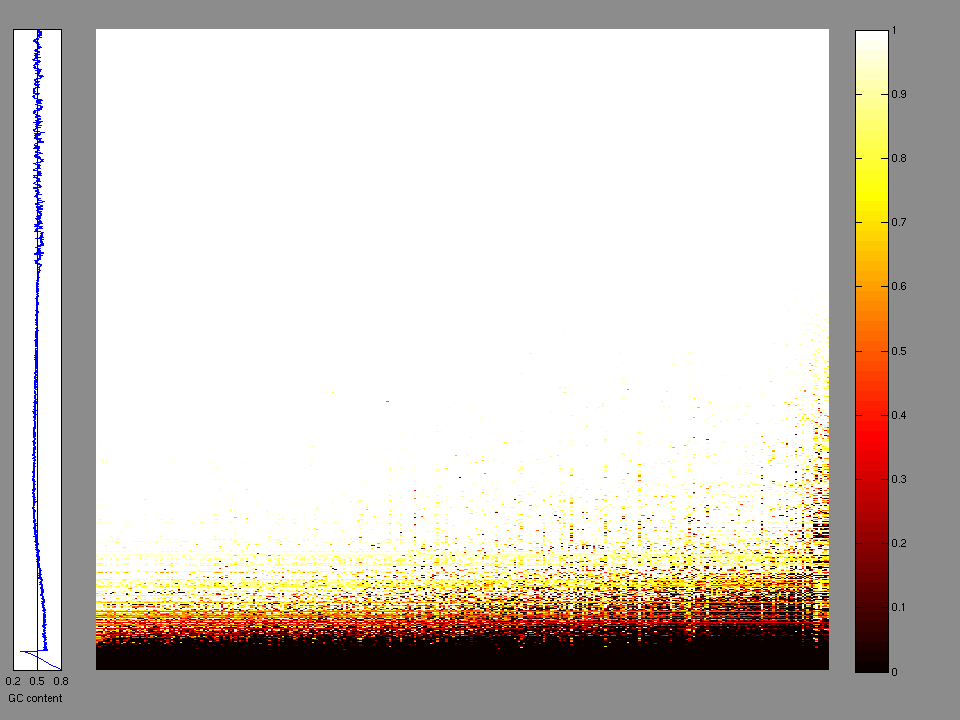
Figure 2. Patients counts and rates file used to generate this plot: THCA.patients.counts_and_rates.txt
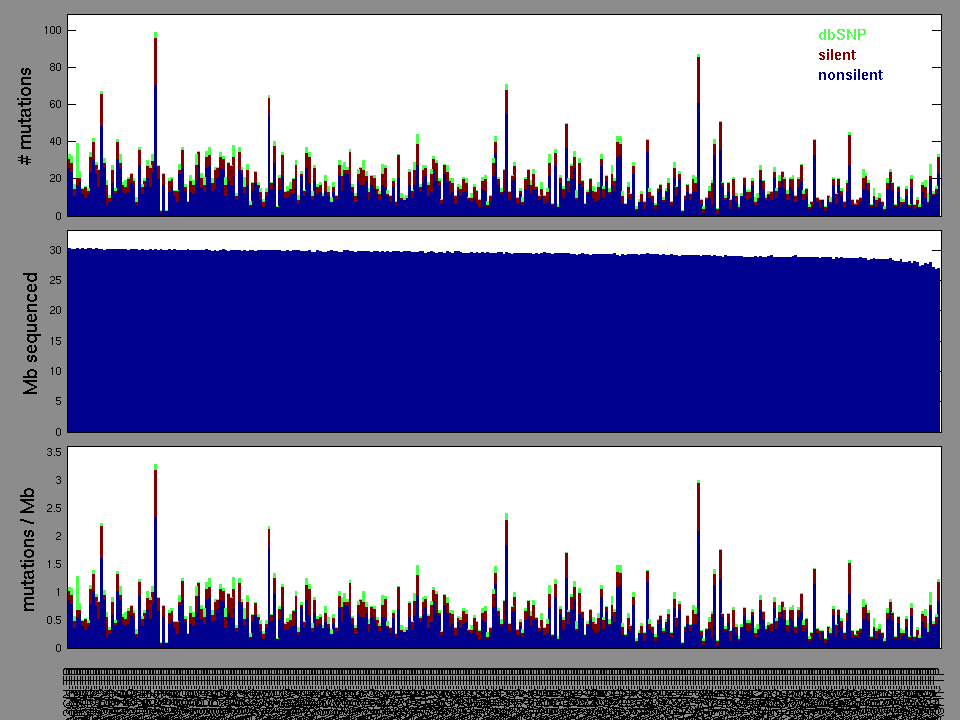
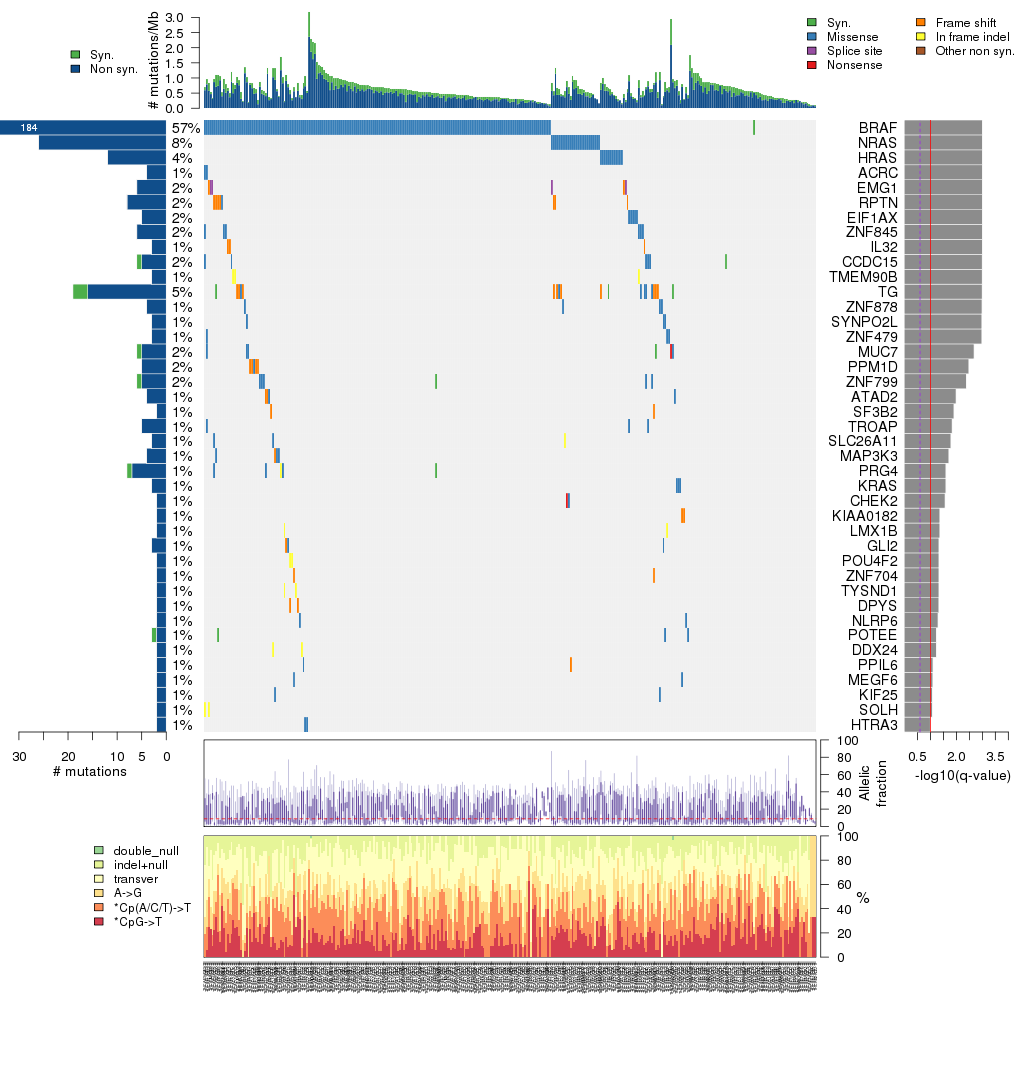
Figure 3. Get High-res Image The matrix in the center of the figure represents individual mutations in patient samples, color-coded by type of mutation, for the significantly mutated genes. The rate of synonymous and non-synonymous mutations is displayed at the top of the matrix. The barplot on the left of the matrix shows the number of mutations in each gene. The percentages represent the fraction of tumors with at least one mutation in the specified gene. The barplot to the right of the matrix displays the q-values for the most significantly mutated genes. The purple boxplots below the matrix (only displayed if required columns are present in the provided MAF) represent the distributions of allelic fractions observed in each sample. The plot at the bottom represents the base substitution distribution of individual samples, using the same categories that were used to calculate significance.
Column Descriptions:
-
N = number of sequenced bases in this gene across the individual set
-
n = number of (nonsilent) mutations in this gene across the individual set
-
npat = number of patients (individuals) with at least one nonsilent mutation
-
nsite = number of unique sites having a non-silent mutation
-
nsil = number of silent mutations in this gene across the individual set
-
n1 = number of nonsilent mutations of type: *CpG->T
-
n2 = number of nonsilent mutations of type: *Cp(A/C/T)->T
-
n3 = number of nonsilent mutations of type: A->G
-
n4 = number of nonsilent mutations of type: transver
-
n5 = number of nonsilent mutations of type: indel+null
-
n6 = number of nonsilent mutations of type: double_null
-
p_classic = p-value for the observed amount of nonsilent mutations being elevated in this gene
-
p_ns_s = p-value for the observed nonsilent/silent ratio being elevated in this gene
-
p_ks = p-value for clustering of mutations (Kolmogorov-Smirnoff test)
-
p_cons = p-value for enrichment of mutations at evolutionarily most-conserved sites in gene
-
p_joint = p-value for clustering + conservation
-
p = p-value (overall)
-
q = q-value, False Discovery Rate (Benjamini-Hochberg procedure)
Table 3. Get Full Table A Ranked List of Significantly Mutated Genes. Number of significant genes found: 41. Number of genes displayed: 35. Click on a gene name to display its stick figure depicting the distribution of mutations and mutation types across the chosen gene (this feature may not be available for all significant genes).
| rank | gene | description | N | n | npat | nsite | nsil | n1 | n2 | n3 | n4 | n5 | n6 | p_classic | p_ns_s | p_ks | p_cons | p_joint | p | q |
|---|---|---|---|---|---|---|---|---|---|---|---|---|---|---|---|---|---|---|---|---|
| 1 | BRAF | v-raf murine sarcoma viral oncogene homolog B1 | 718092 | 183 | 183 | 2 | 1 | 0 | 0 | 1 | 182 | 0 | 0 | <1.00e-15 | 5e-14 | 2e-07 | 2e-07 | 0 | <1.00e-15 | <4.52e-12 |
| 2 | NRAS | neuroblastoma RAS viral (v-ras) oncogene homolog | 189273 | 26 | 26 | 2 | 0 | 0 | 0 | 20 | 6 | 0 | 0 | 5.22e-15 | 0.00016 | 2e-07 | 0.0002 | 0 | <1.00e-15 | <4.52e-12 |
| 3 | HRAS | v-Ha-ras Harvey rat sarcoma viral oncogene homolog | 209181 | 12 | 12 | 2 | 0 | 0 | 0 | 9 | 3 | 0 | 0 | 1.52e-14 | 0.13 | 2e-07 | 0.000079 | 0 | <1.00e-15 | <4.52e-12 |
| 4 | ACRC | acidic repeat containing | 609349 | 4 | 2 | 2 | 0 | 0 | 2 | 0 | 2 | 0 | 0 | 0.00945 | 0.37 | 2e-07 | 0.72 | 0 | <1.00e-15 | <4.52e-12 |
| 5 | EMG1 | EMG1 nucleolar protein homolog (S. cerevisiae) | 220090 | 6 | 6 | 2 | 0 | 0 | 0 | 0 | 0 | 6 | 0 | 3.82e-10 | 1 | 2e-07 | 0.89 | 9.8e-06 | 1.28e-13 | 4.64e-10 |
| 6 | RPTN | repetin | 763230 | 8 | 8 | 6 | 0 | 0 | 0 | 1 | 0 | 7 | 0 | 2.46e-09 | 0.65 | 0.00082 | 0.12 | 0.00065 | 4.53e-11 | 1.37e-07 |
| 7 | EIF1AX | eukaryotic translation initiation factor 1A, X-linked | 142447 | 5 | 5 | 4 | 0 | 0 | 4 | 0 | 1 | 0 | 0 | 6.88e-10 | 0.27 | 0.014 | 0.014 | 0.0051 | 9.68e-11 | 2.50e-07 |
| 8 | ZNF845 | zinc finger protein 845 | 928346 | 6 | 6 | 3 | 0 | 0 | 3 | 3 | 0 | 0 | 0 | 3.35e-06 | 0.09 | 2e-06 | 1 | 0.000015 | 1.24e-09 | 2.81e-06 |
| 9 | IL32 | interleukin 32 | 168065 | 3 | 3 | 1 | 0 | 0 | 0 | 0 | 0 | 3 | 0 | 1.64e-05 | 1 | 2.6e-06 | 0.91 | 6.8e-06 | 2.66e-09 | 5.35e-06 |
| 10 | CCDC15 | coiled-coil domain containing 15 | 671425 | 5 | 5 | 1 | 1 | 0 | 0 | 0 | 5 | 0 | 0 | 1.93e-05 | 0.72 | 2e-07 | 1 | 0.000017 | 7.40e-09 | 1.34e-05 |
| 11 | TMEM90B | 254847 | 3 | 3 | 1 | 0 | 0 | 0 | 0 | 0 | 3 | 0 | 0.000228 | 1 | 2e-06 | 0.85 | 1.6e-06 | 8.31e-09 | 1.37e-05 | |
| 12 | TG | thyroglobulin | 2717568 | 16 | 16 | 16 | 3 | 1 | 0 | 1 | 4 | 10 | 0 | 3.11e-09 | 0.82 | 0.1 | 0.46 | 0.19 | 1.29e-08 | 1.95e-05 |
| 13 | ZNF878 | zinc finger protein 878 | 523994 | 4 | 4 | 2 | 0 | 0 | 0 | 0 | 4 | 0 | 0 | 9.45e-05 | 0.54 | 2e-07 | 1 | 0.000012 | 2.45e-08 | 3.41e-05 |
| 14 | SYNPO2L | synaptopodin 2-like | 692797 | 3 | 3 | 1 | 0 | 0 | 0 | 3 | 0 | 0 | 0 | 0.00171 | 0.27 | 2.6e-06 | 0.0018 | 1.4e-06 | 4.98e-08 | 6.44e-05 |
| 15 | ZNF479 | zinc finger protein 479 | 507416 | 3 | 3 | 1 | 0 | 0 | 0 | 0 | 3 | 0 | 0 | 0.00167 | 0.65 | 4e-07 | 1 | 1.8e-06 | 6.19e-08 | 7.46e-05 |
| 16 | MUC7 | mucin 7, secreted | 368847 | 5 | 5 | 5 | 1 | 0 | 2 | 2 | 0 | 1 | 0 | 3.82e-07 | 0.41 | 0.3 | 0.08 | 0.14 | 9.62e-07 | 0.00109 |
| 17 | PPM1D | protein phosphatase 1D magnesium-dependent, delta isoform | 502843 | 5 | 5 | 5 | 0 | 0 | 1 | 0 | 0 | 4 | 0 | 2.08e-06 | 0.7 | 0.026 | 0.78 | 0.064 | 2.25e-06 | 0.00239 |
| 18 | ZNF799 | zinc finger protein 799 | 607484 | 5 | 5 | 2 | 1 | 0 | 0 | 5 | 0 | 0 | 0 | 6.50e-06 | 0.26 | 0.011 | 0.98 | 0.029 | 3.11e-06 | 0.00312 |
| 19 | ATAD2 | ATPase family, AAA domain containing 2 | 1353048 | 4 | 4 | 3 | 0 | 0 | 1 | 1 | 0 | 2 | 0 | 0.00324 | 0.45 | 0.00016 | 0.17 | 0.0002 | 9.79e-06 | 0.00932 |
| 20 | SF3B2 | splicing factor 3b, subunit 2, 145kDa | 883027 | 2 | 2 | 1 | 0 | 0 | 0 | 0 | 0 | 2 | 0 | 0.0587 | 1 | 0.00036 | 0.0049 | 0.000014 | 1.27e-05 | 0.0115 |
| 21 | TROAP | trophinin associated protein (tastin) | 787729 | 5 | 3 | 3 | 0 | 0 | 1 | 2 | 2 | 0 | 0 | 0.00655 | 0.17 | 0.000015 | 1 | 0.00016 | 1.58e-05 | 0.0136 |
| 22 | SLC26A11 | solute carrier family 26, member 11 | 571218 | 3 | 3 | 2 | 0 | 0 | 0 | 0 | 2 | 1 | 0 | 0.00420 | 0.62 | 8e-05 | 0.78 | 0.00031 | 1.88e-05 | 0.0154 |
| 23 | MAP3K3 | mitogen-activated protein kinase kinase kinase 3 | 653710 | 4 | 4 | 4 | 0 | 0 | 2 | 0 | 1 | 1 | 0 | 0.000190 | 0.28 | 0.0036 | 0.23 | 0.0087 | 2.37e-05 | 0.0187 |
| 24 | PRG4 | proteoglycan 4 | 1374896 | 7 | 4 | 7 | 1 | 0 | 1 | 1 | 2 | 3 | 0 | 0.00317 | 0.55 | 0.00018 | 0.99 | 0.00074 | 3.27e-05 | 0.0245 |
| 25 | KRAS | v-Ki-ras2 Kirsten rat sarcoma viral oncogene homolog | 224332 | 3 | 3 | 3 | 0 | 0 | 0 | 1 | 2 | 0 | 0 | 0.000119 | 0.48 | 0.12 | 0.01 | 0.02 | 3.39e-05 | 0.0245 |
| 26 | CHEK2 | CHK2 checkpoint homolog (S. pombe) | 515569 | 2 | 2 | 2 | 0 | 0 | 0 | 0 | 1 | 1 | 0 | 0.0205 | 0.71 | 0.00013 | 0.77 | 0.00013 | 3.80e-05 | 0.0264 |
| 27 | KIAA0182 | KIAA0182 | 1037502 | 2 | 2 | 1 | 0 | 0 | 0 | 0 | 0 | 2 | 0 | 0.0583 | 1 | 0.00028 | 0.081 | 0.000085 | 6.55e-05 | 0.0428 |
| 28 | LMX1B | LIM homeobox transcription factor 1, beta | 315824 | 2 | 2 | 1 | 0 | 0 | 0 | 0 | 0 | 2 | 0 | 0.00366 | 1 | 0.00078 | 0.031 | 0.0014 | 6.63e-05 | 0.0428 |
| 29 | GLI2 | GLI-Kruppel family member GLI2 | 1335844 | 3 | 3 | 3 | 0 | 2 | 0 | 0 | 0 | 1 | 0 | 0.0183 | 0.36 | 0.48 | 0.00024 | 0.00032 | 7.64e-05 | 0.0463 |
| 30 | POU4F2 | POU class 4 homeobox 2 | 346504 | 2 | 2 | 1 | 0 | 0 | 0 | 0 | 0 | 2 | 0 | 0.00753 | 1 | 0.00082 | 0.98 | 0.00082 | 8.02e-05 | 0.0463 |
| 31 | ZNF704 | zinc finger protein 704 | 396074 | 2 | 2 | 1 | 0 | 0 | 0 | 0 | 0 | 2 | 0 | 0.00803 | 1 | 0.00078 | 0.73 | 0.00078 | 8.15e-05 | 0.0463 |
| 32 | TYSND1 | trypsin domain containing 1 | 238129 | 2 | 2 | 1 | 0 | 0 | 0 | 0 | 0 | 2 | 0 | 0.00274 | 1 | 0.00056 | 0.91 | 0.0023 | 8.18e-05 | 0.0463 |
| 33 | DPYS | dihydropyrimidinase | 428837 | 2 | 2 | 1 | 0 | 0 | 0 | 0 | 0 | 2 | 0 | 0.0104 | 1 | 0.00064 | 0.82 | 0.00064 | 8.61e-05 | 0.0472 |
| 34 | NLRP6 | NLR family, pyrin domain containing 6 | 591829 | 2 | 2 | 1 | 0 | 0 | 0 | 2 | 0 | 0 | 0 | 0.00802 | 0.69 | 0.0013 | 0.001 | 0.00092 | 9.41e-05 | 0.0501 |
| 35 | POTEE | POTE ankyrin domain family, member E | 694920 | 2 | 2 | 1 | 1 | 0 | 0 | 2 | 0 | 0 | 0 | 0.0102 | 0.79 | 0.00086 | 0.81 | 0.00086 | 0.000111 | 0.0575 |
Figure S1. This figure depicts the distribution of mutations and mutation types across the BRAF significant gene.
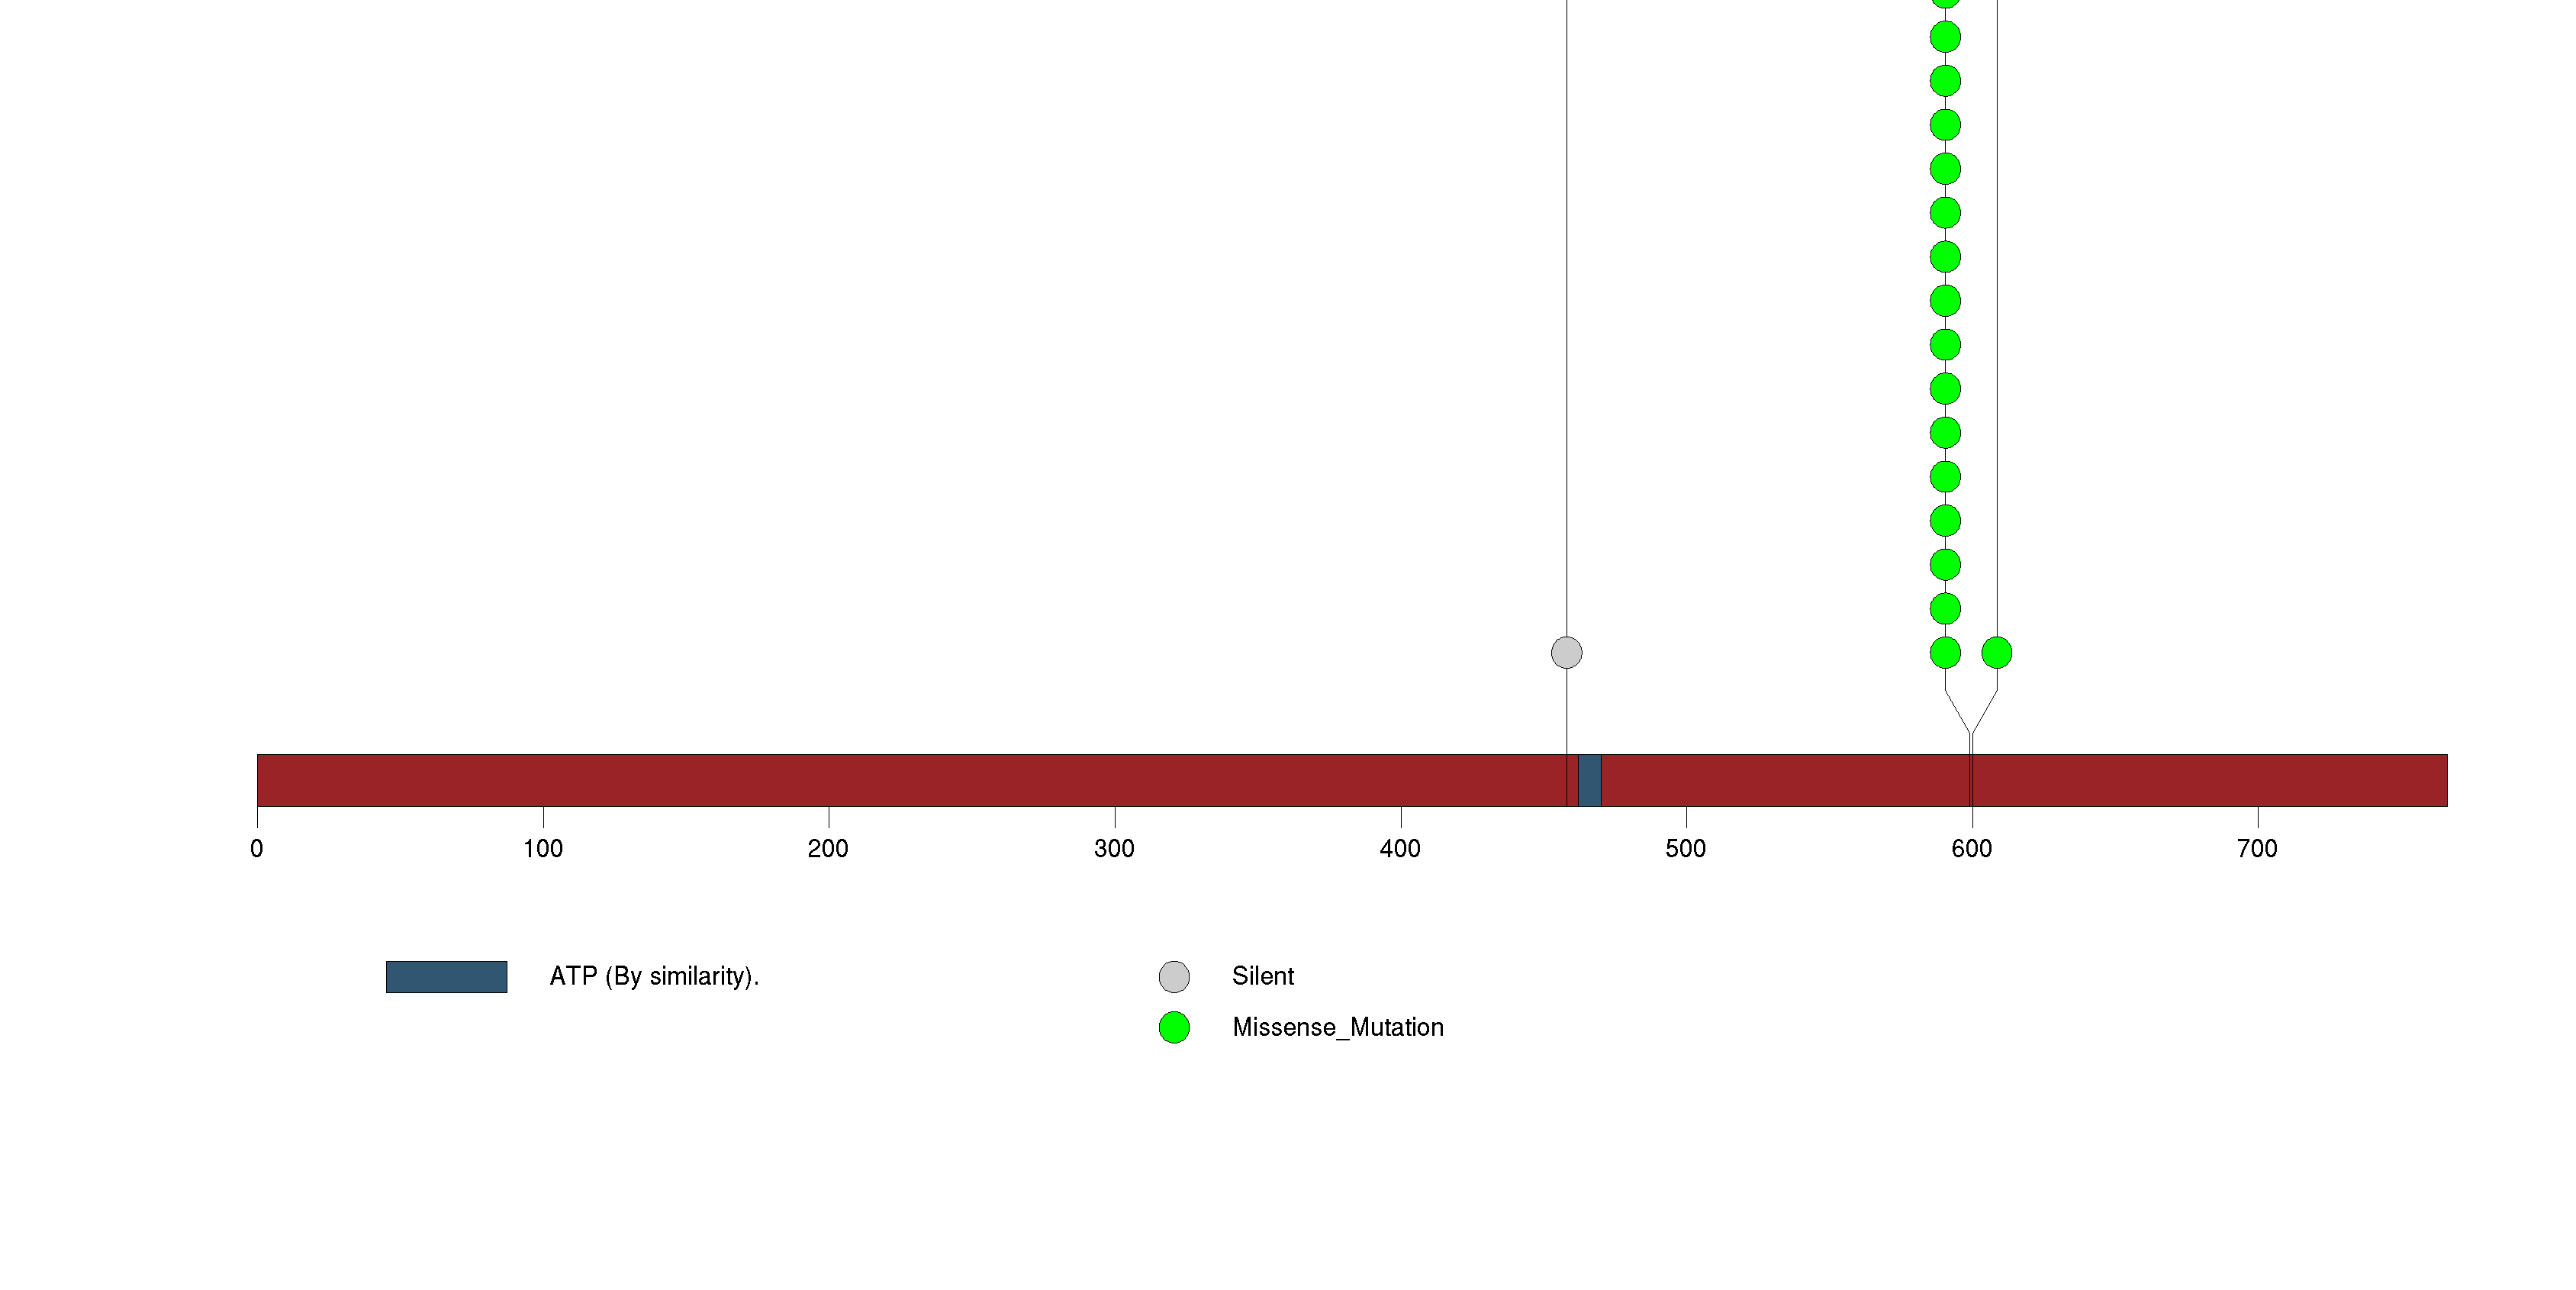
Figure S2. This figure depicts the distribution of mutations and mutation types across the NRAS significant gene.
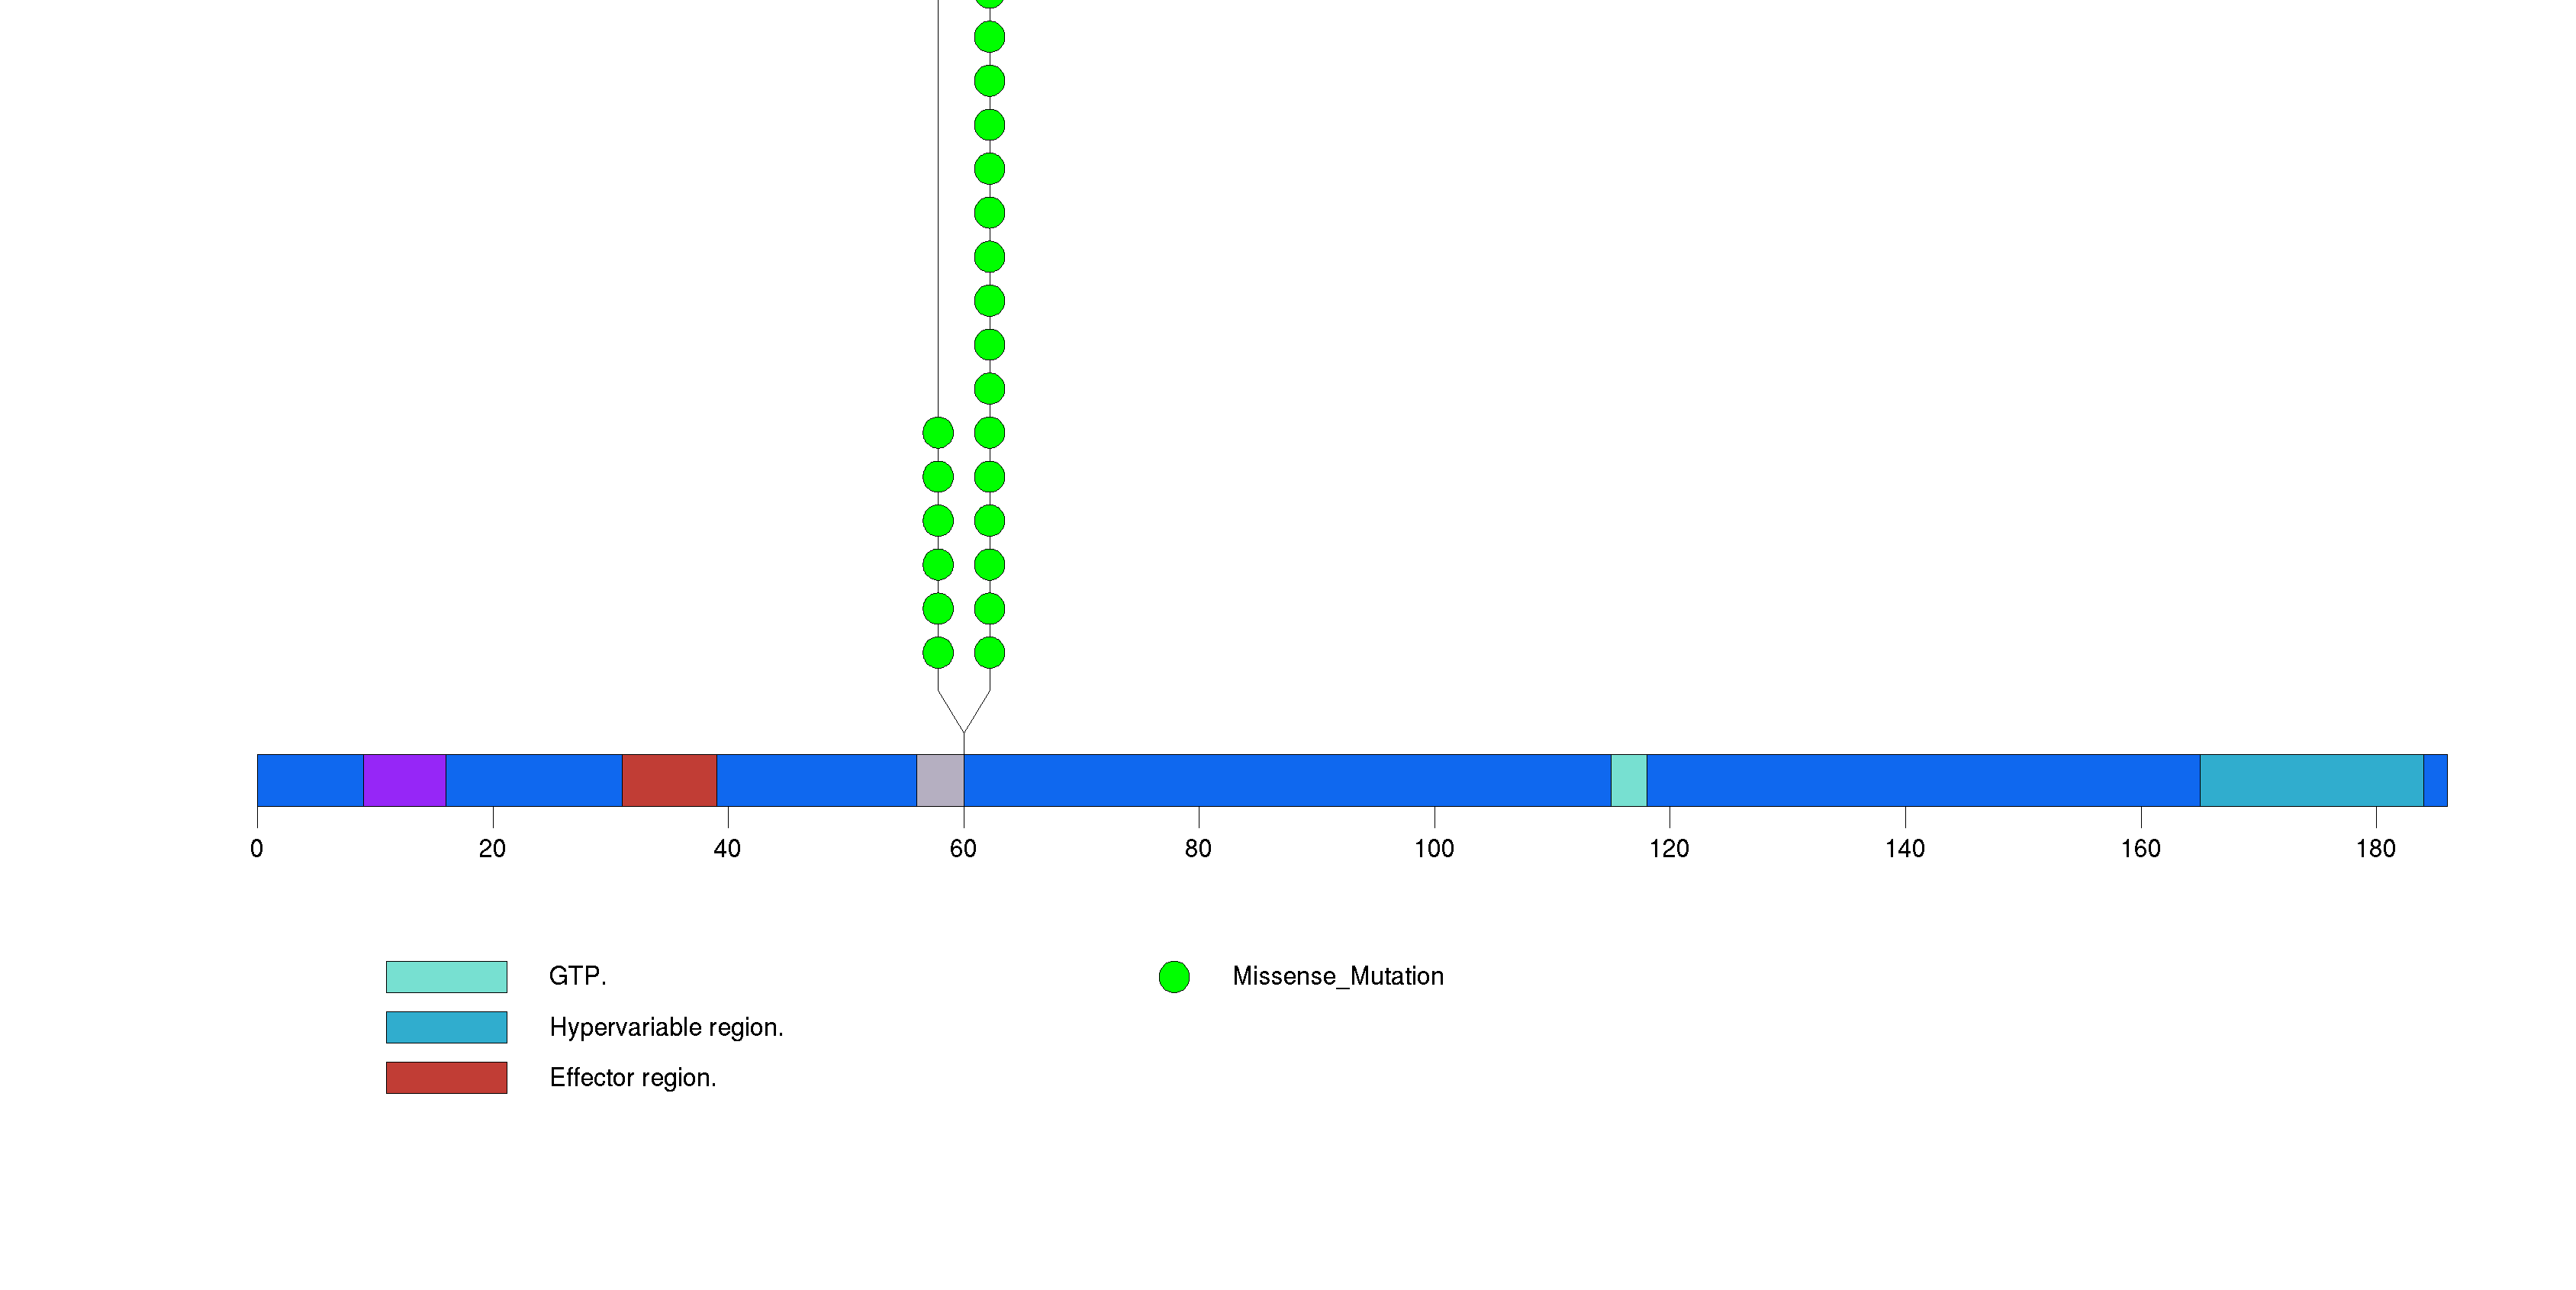
Figure S3. This figure depicts the distribution of mutations and mutation types across the HRAS significant gene.
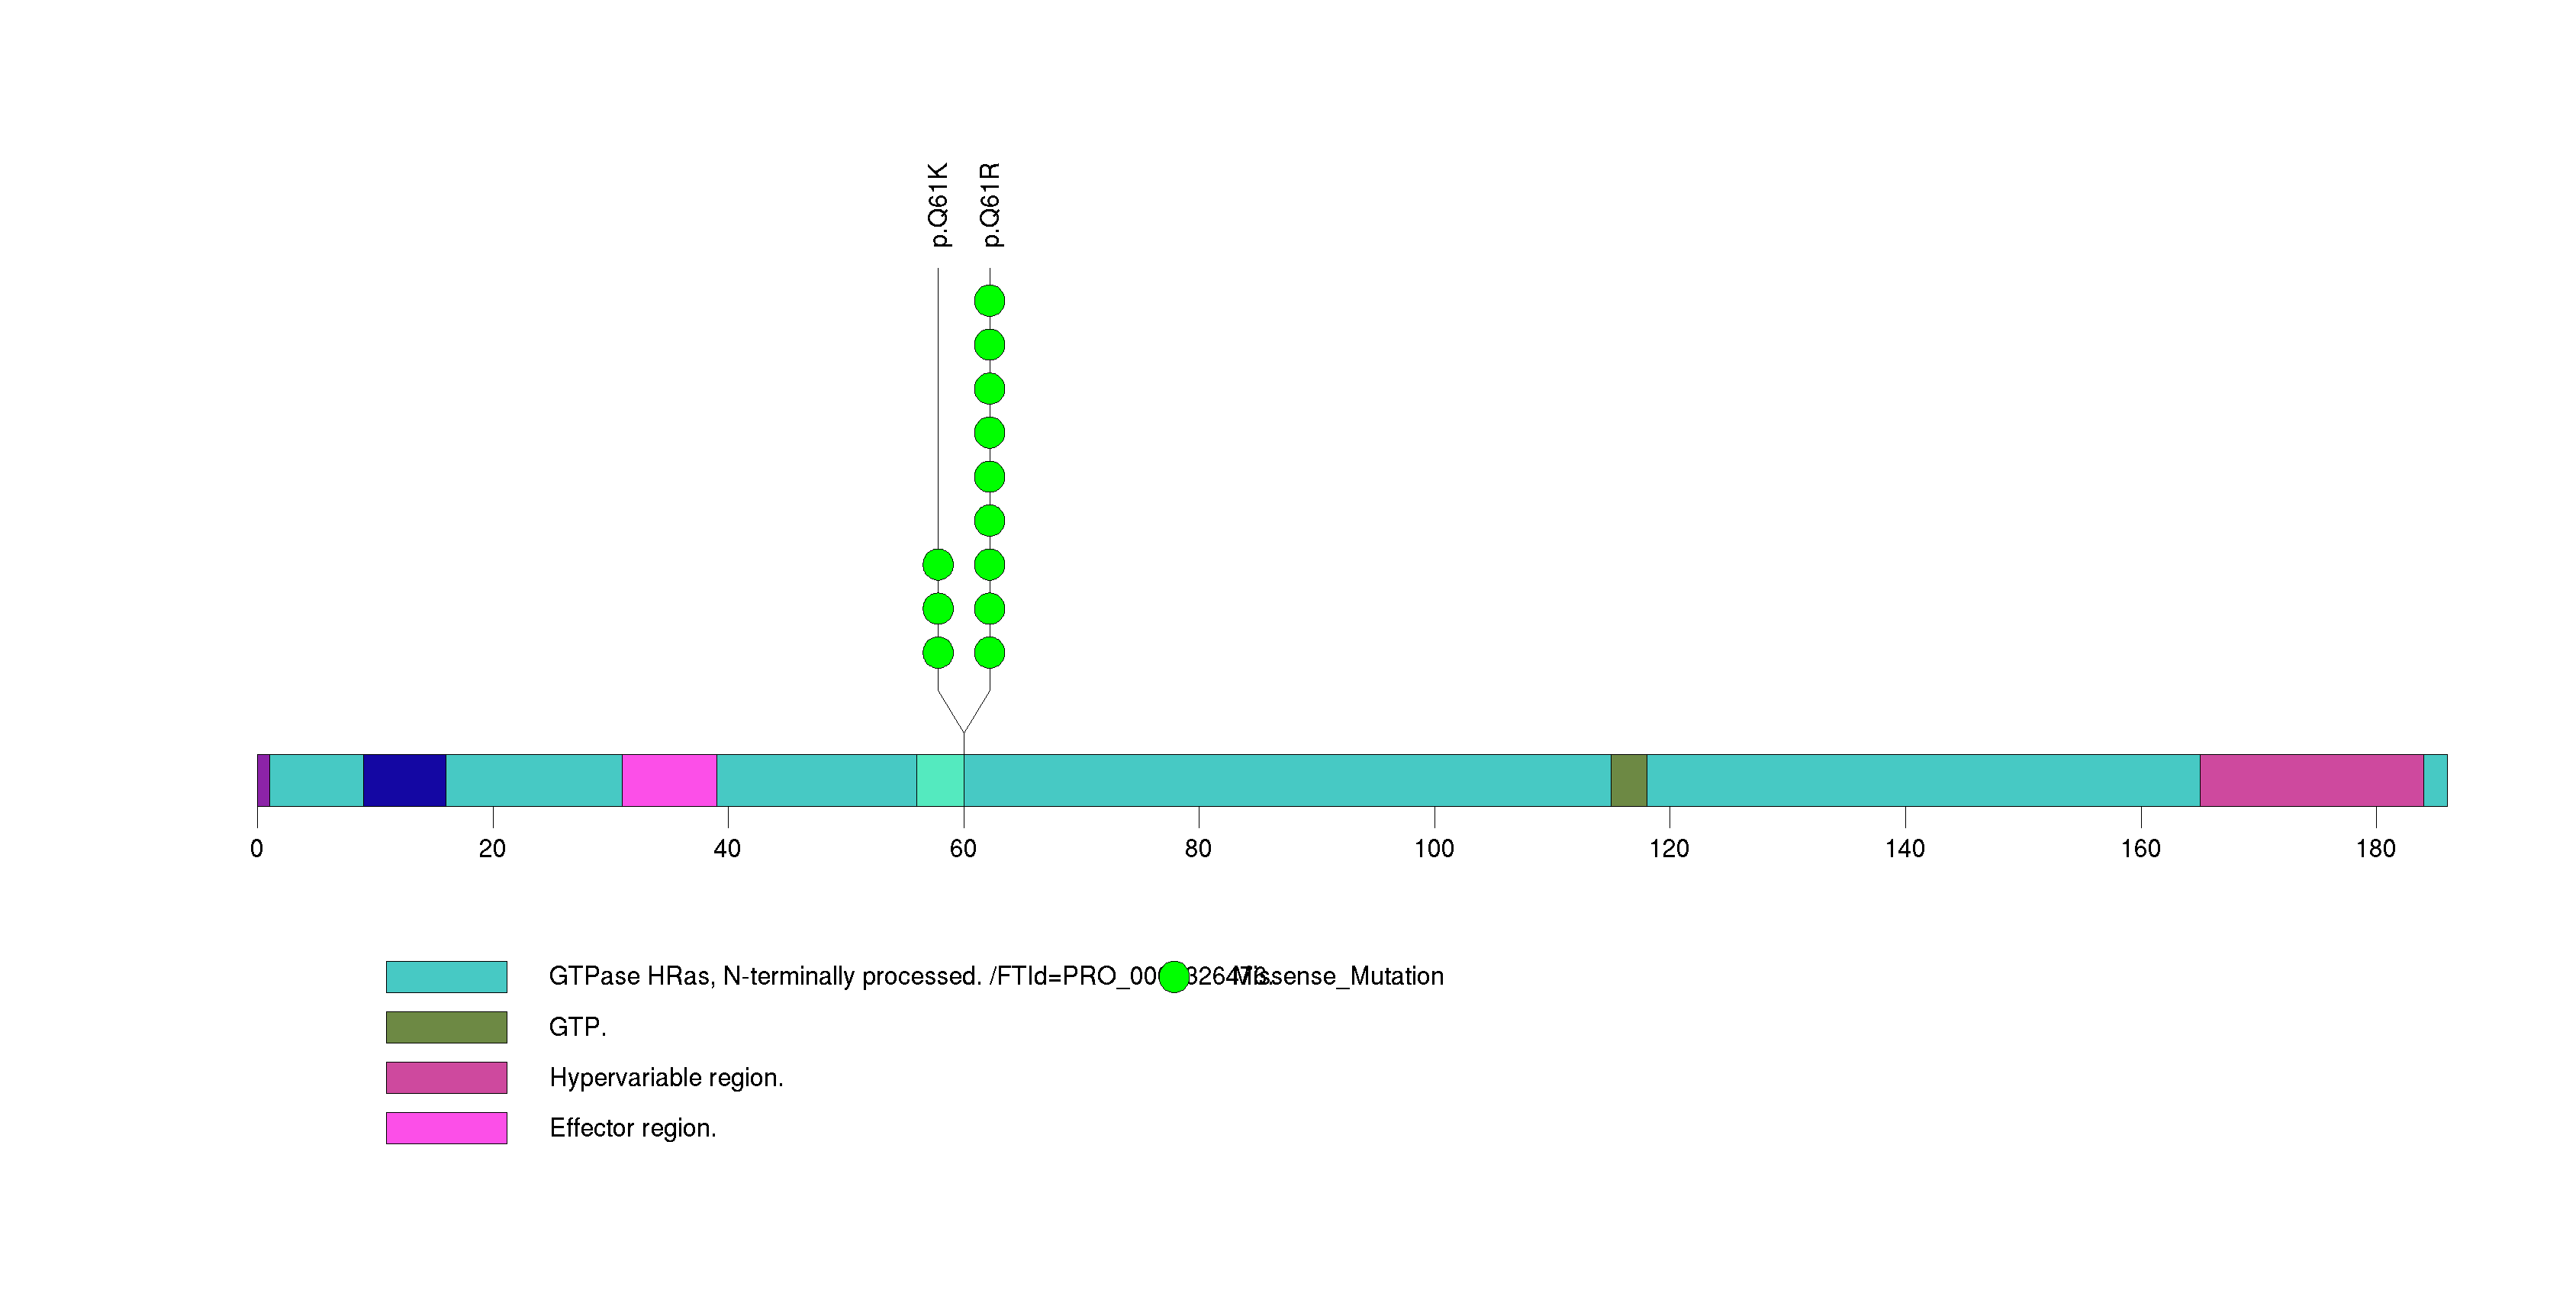
Figure S4. This figure depicts the distribution of mutations and mutation types across the ACRC significant gene.
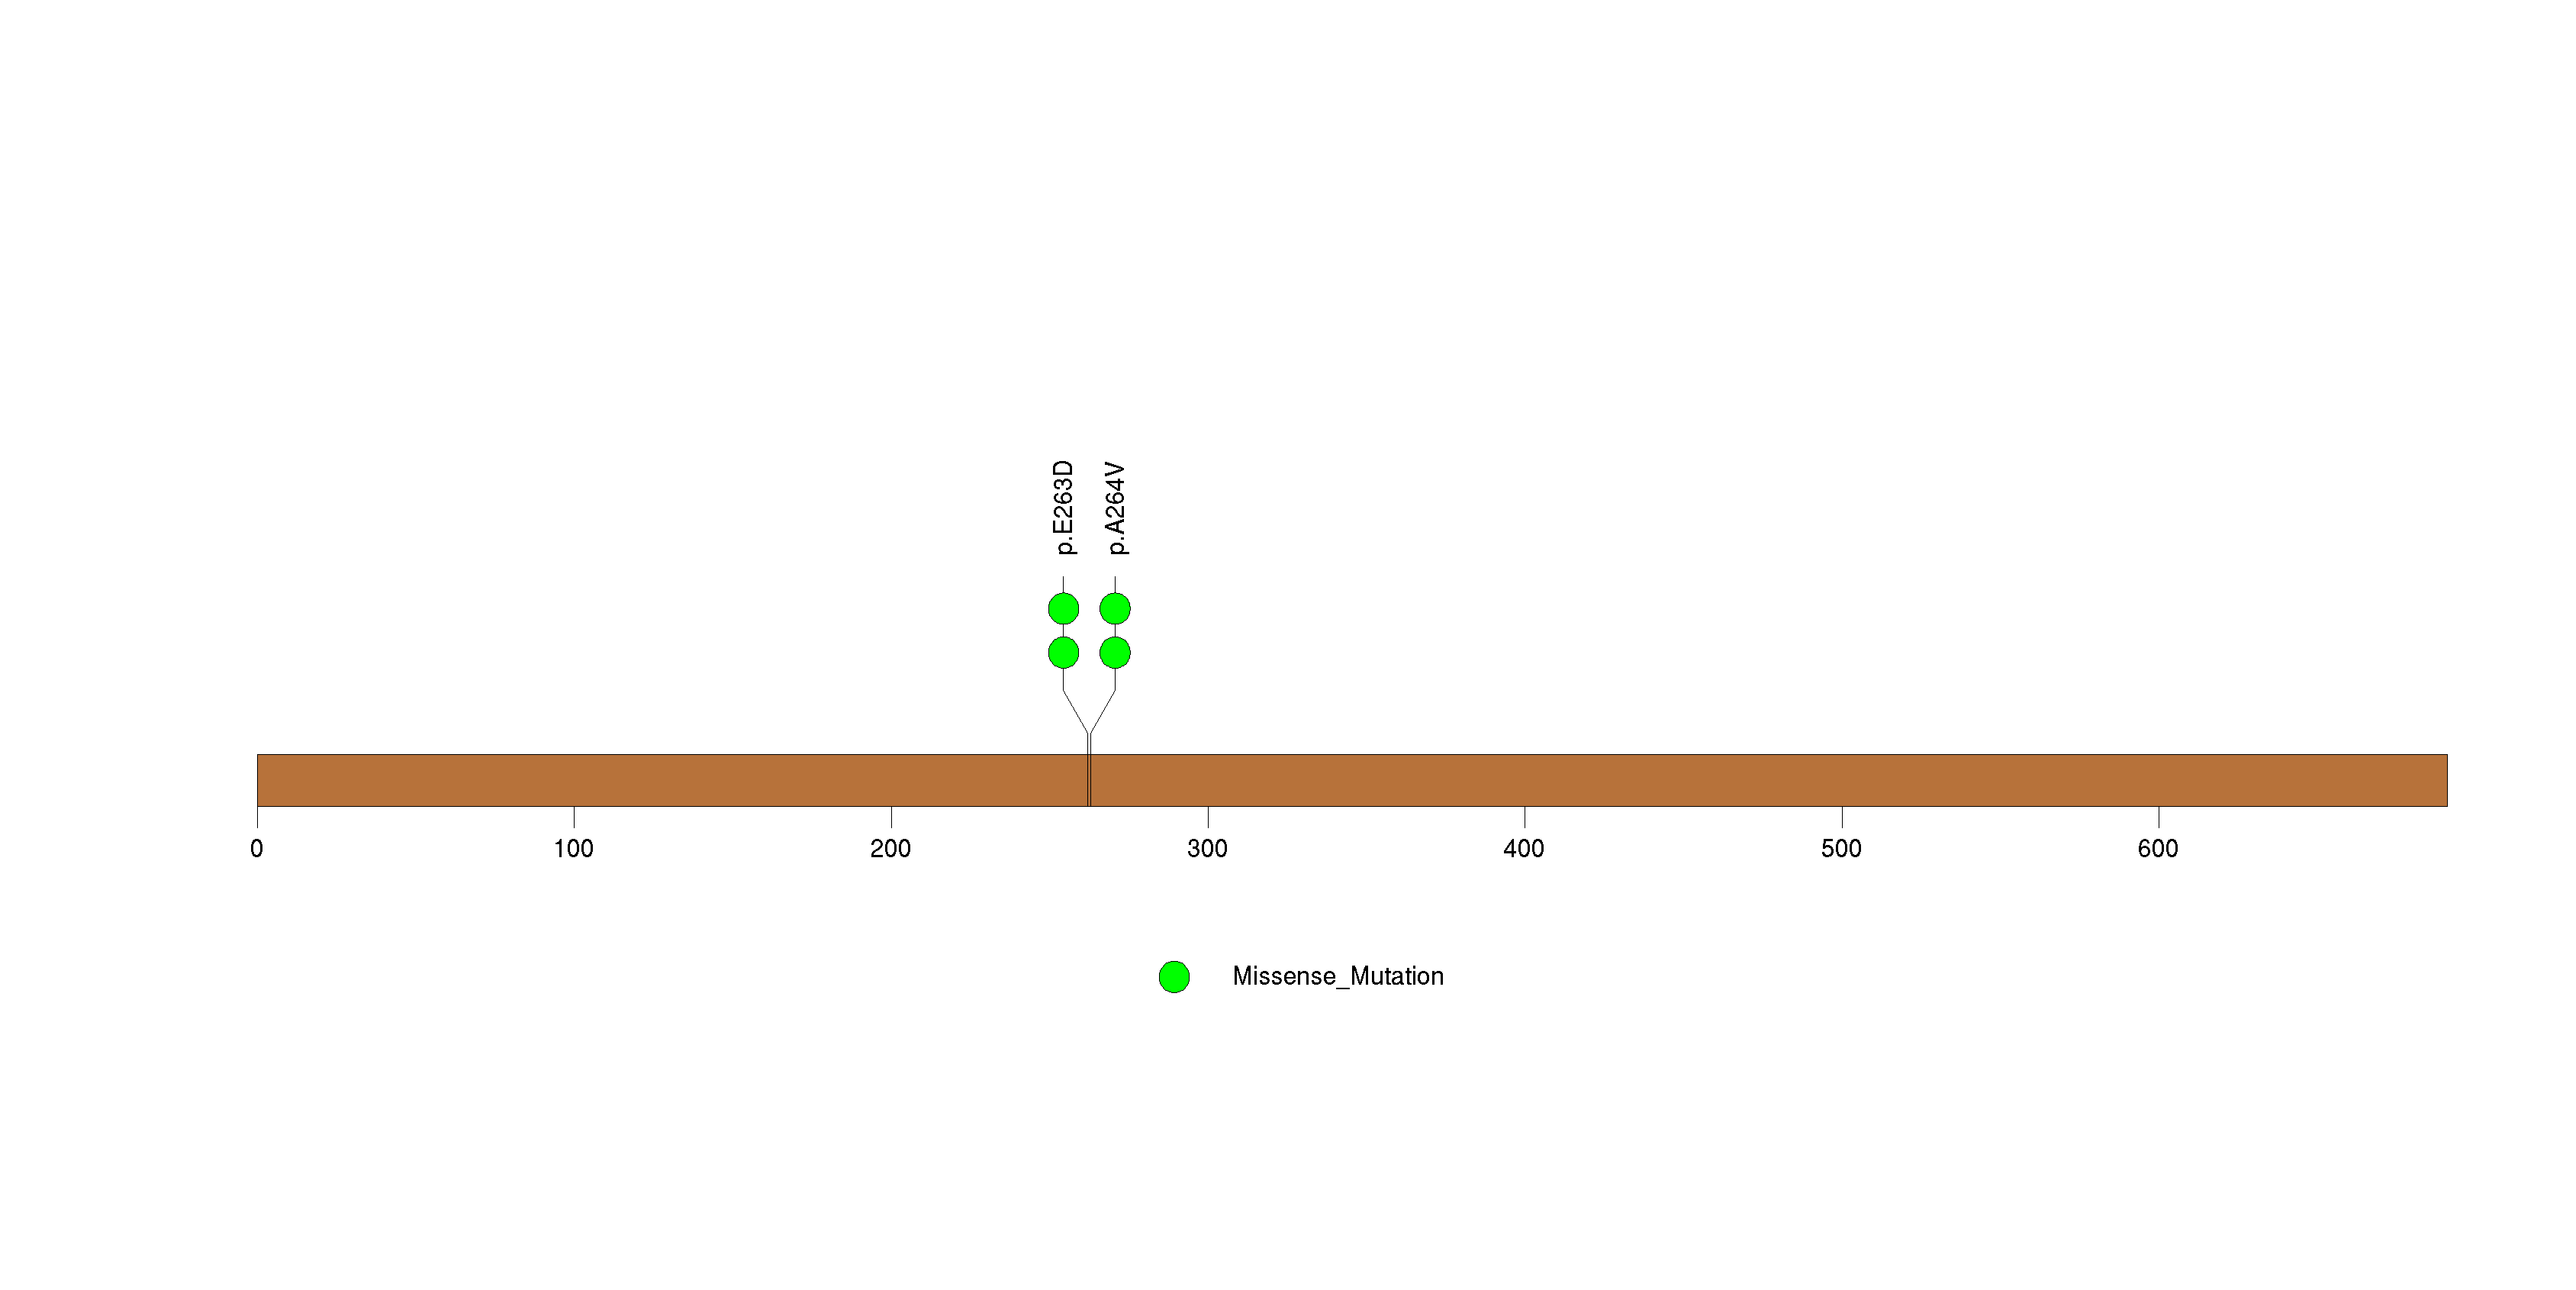
Figure S5. This figure depicts the distribution of mutations and mutation types across the EMG1 significant gene.
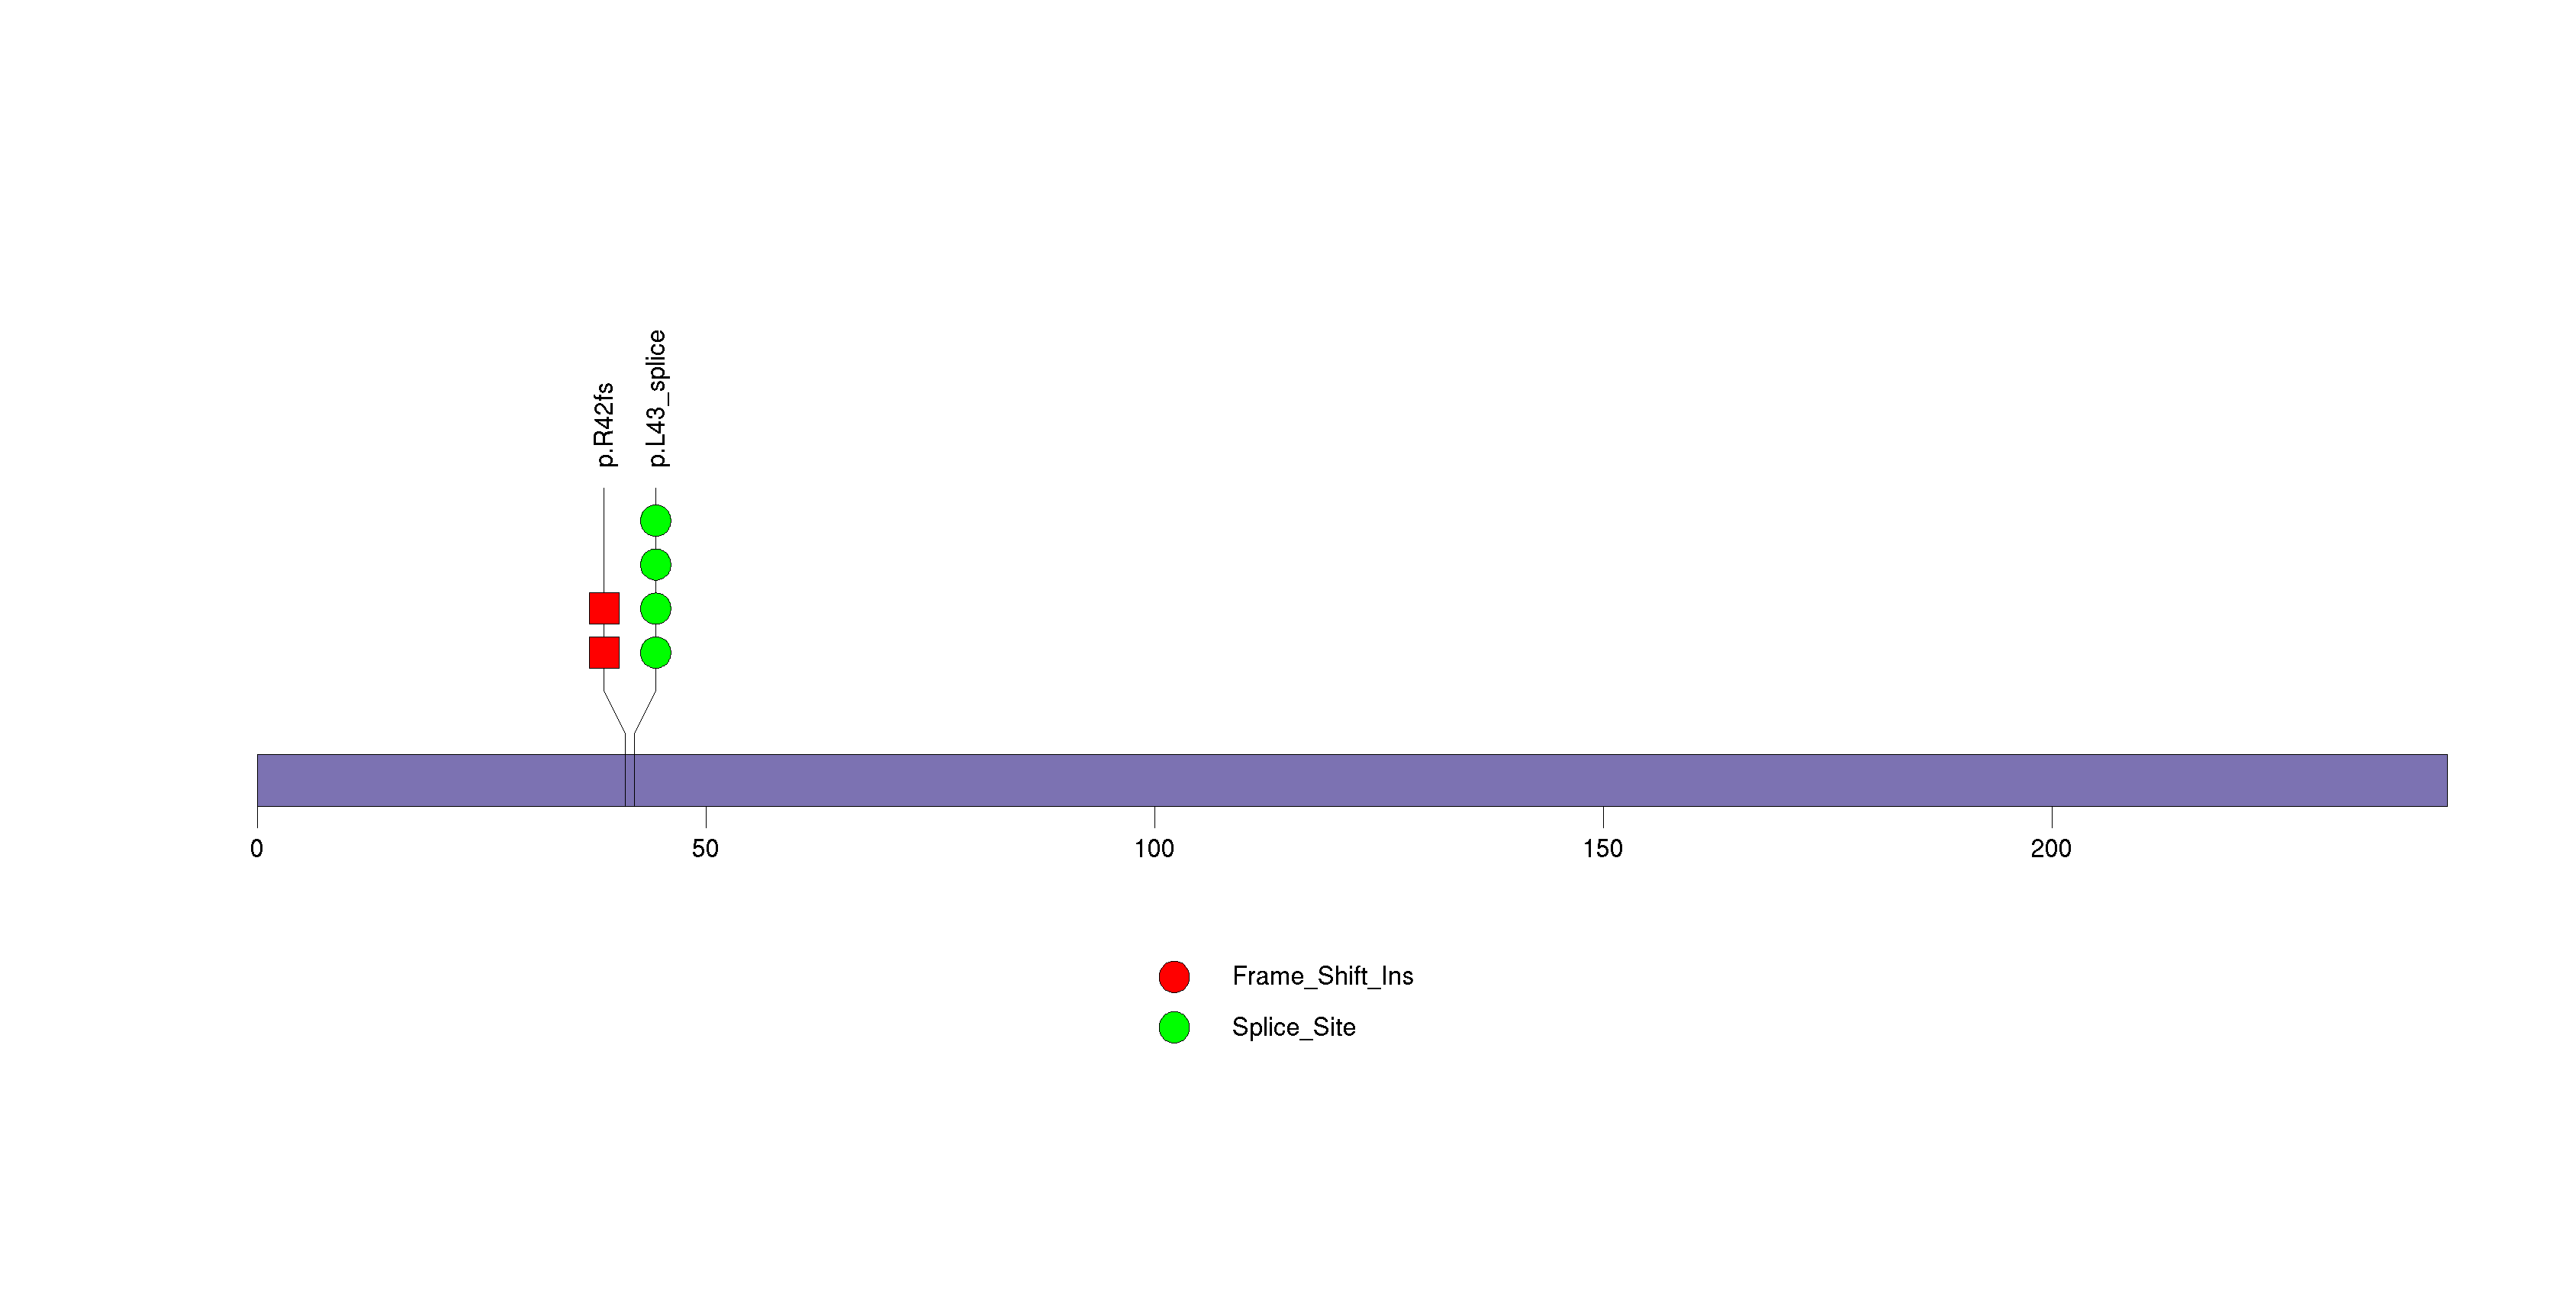
Figure S6. This figure depicts the distribution of mutations and mutation types across the RPTN significant gene.
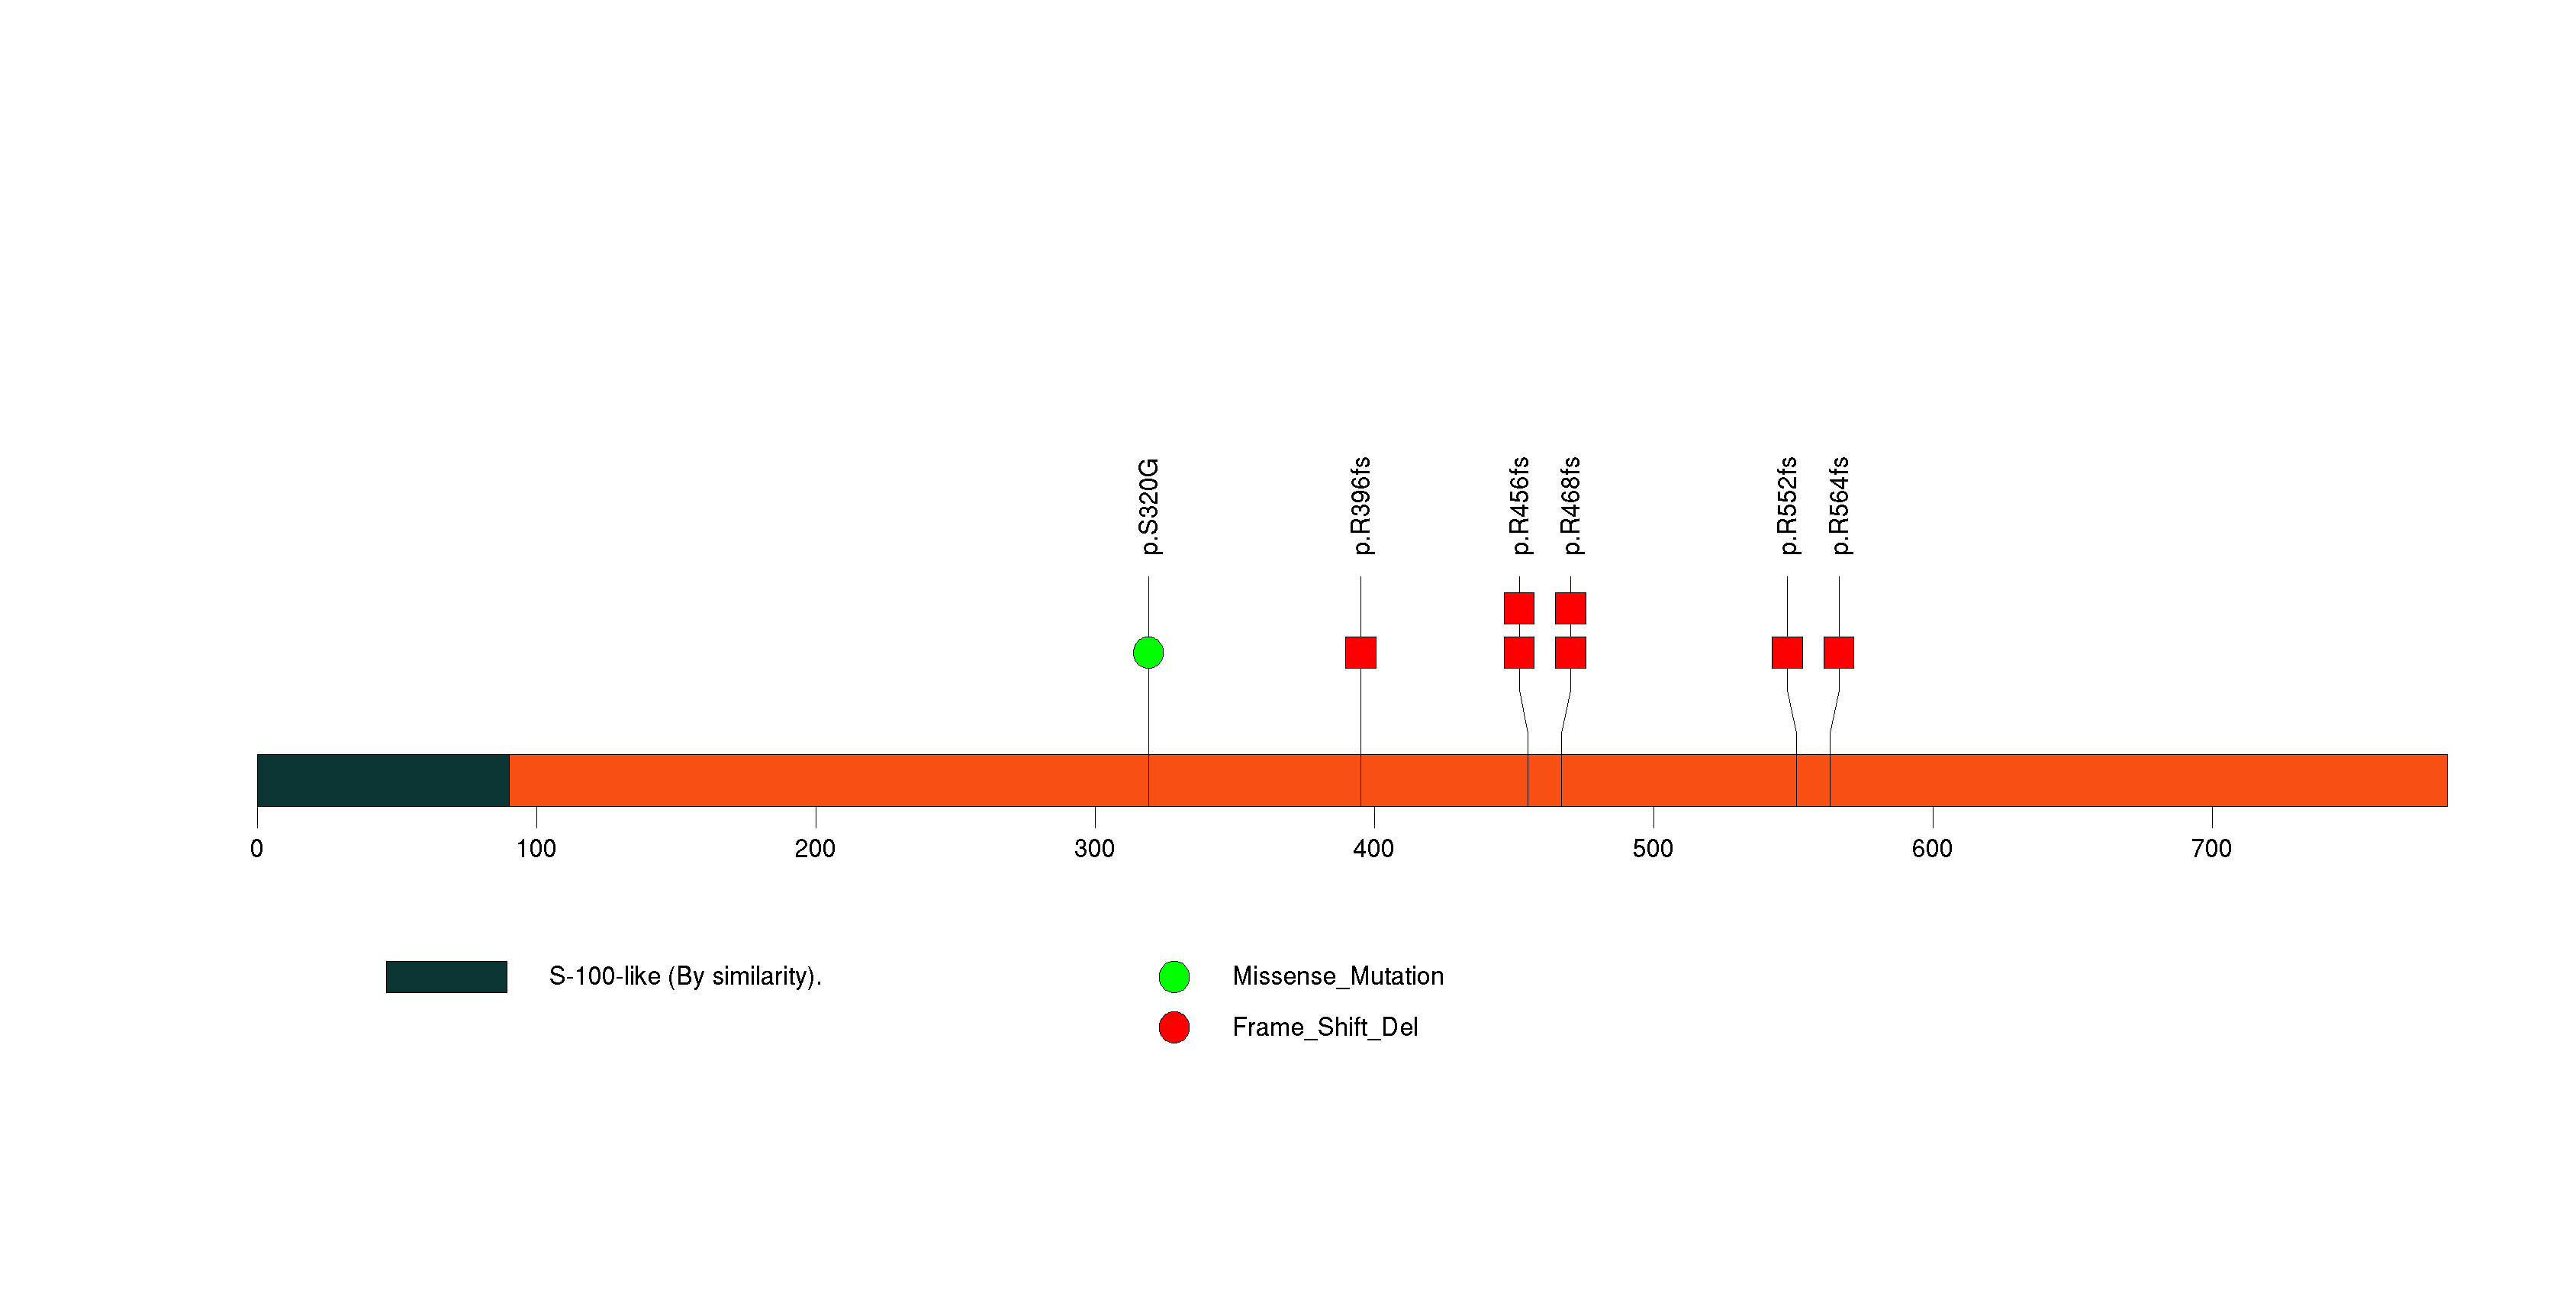
Figure S7. This figure depicts the distribution of mutations and mutation types across the EIF1AX significant gene.
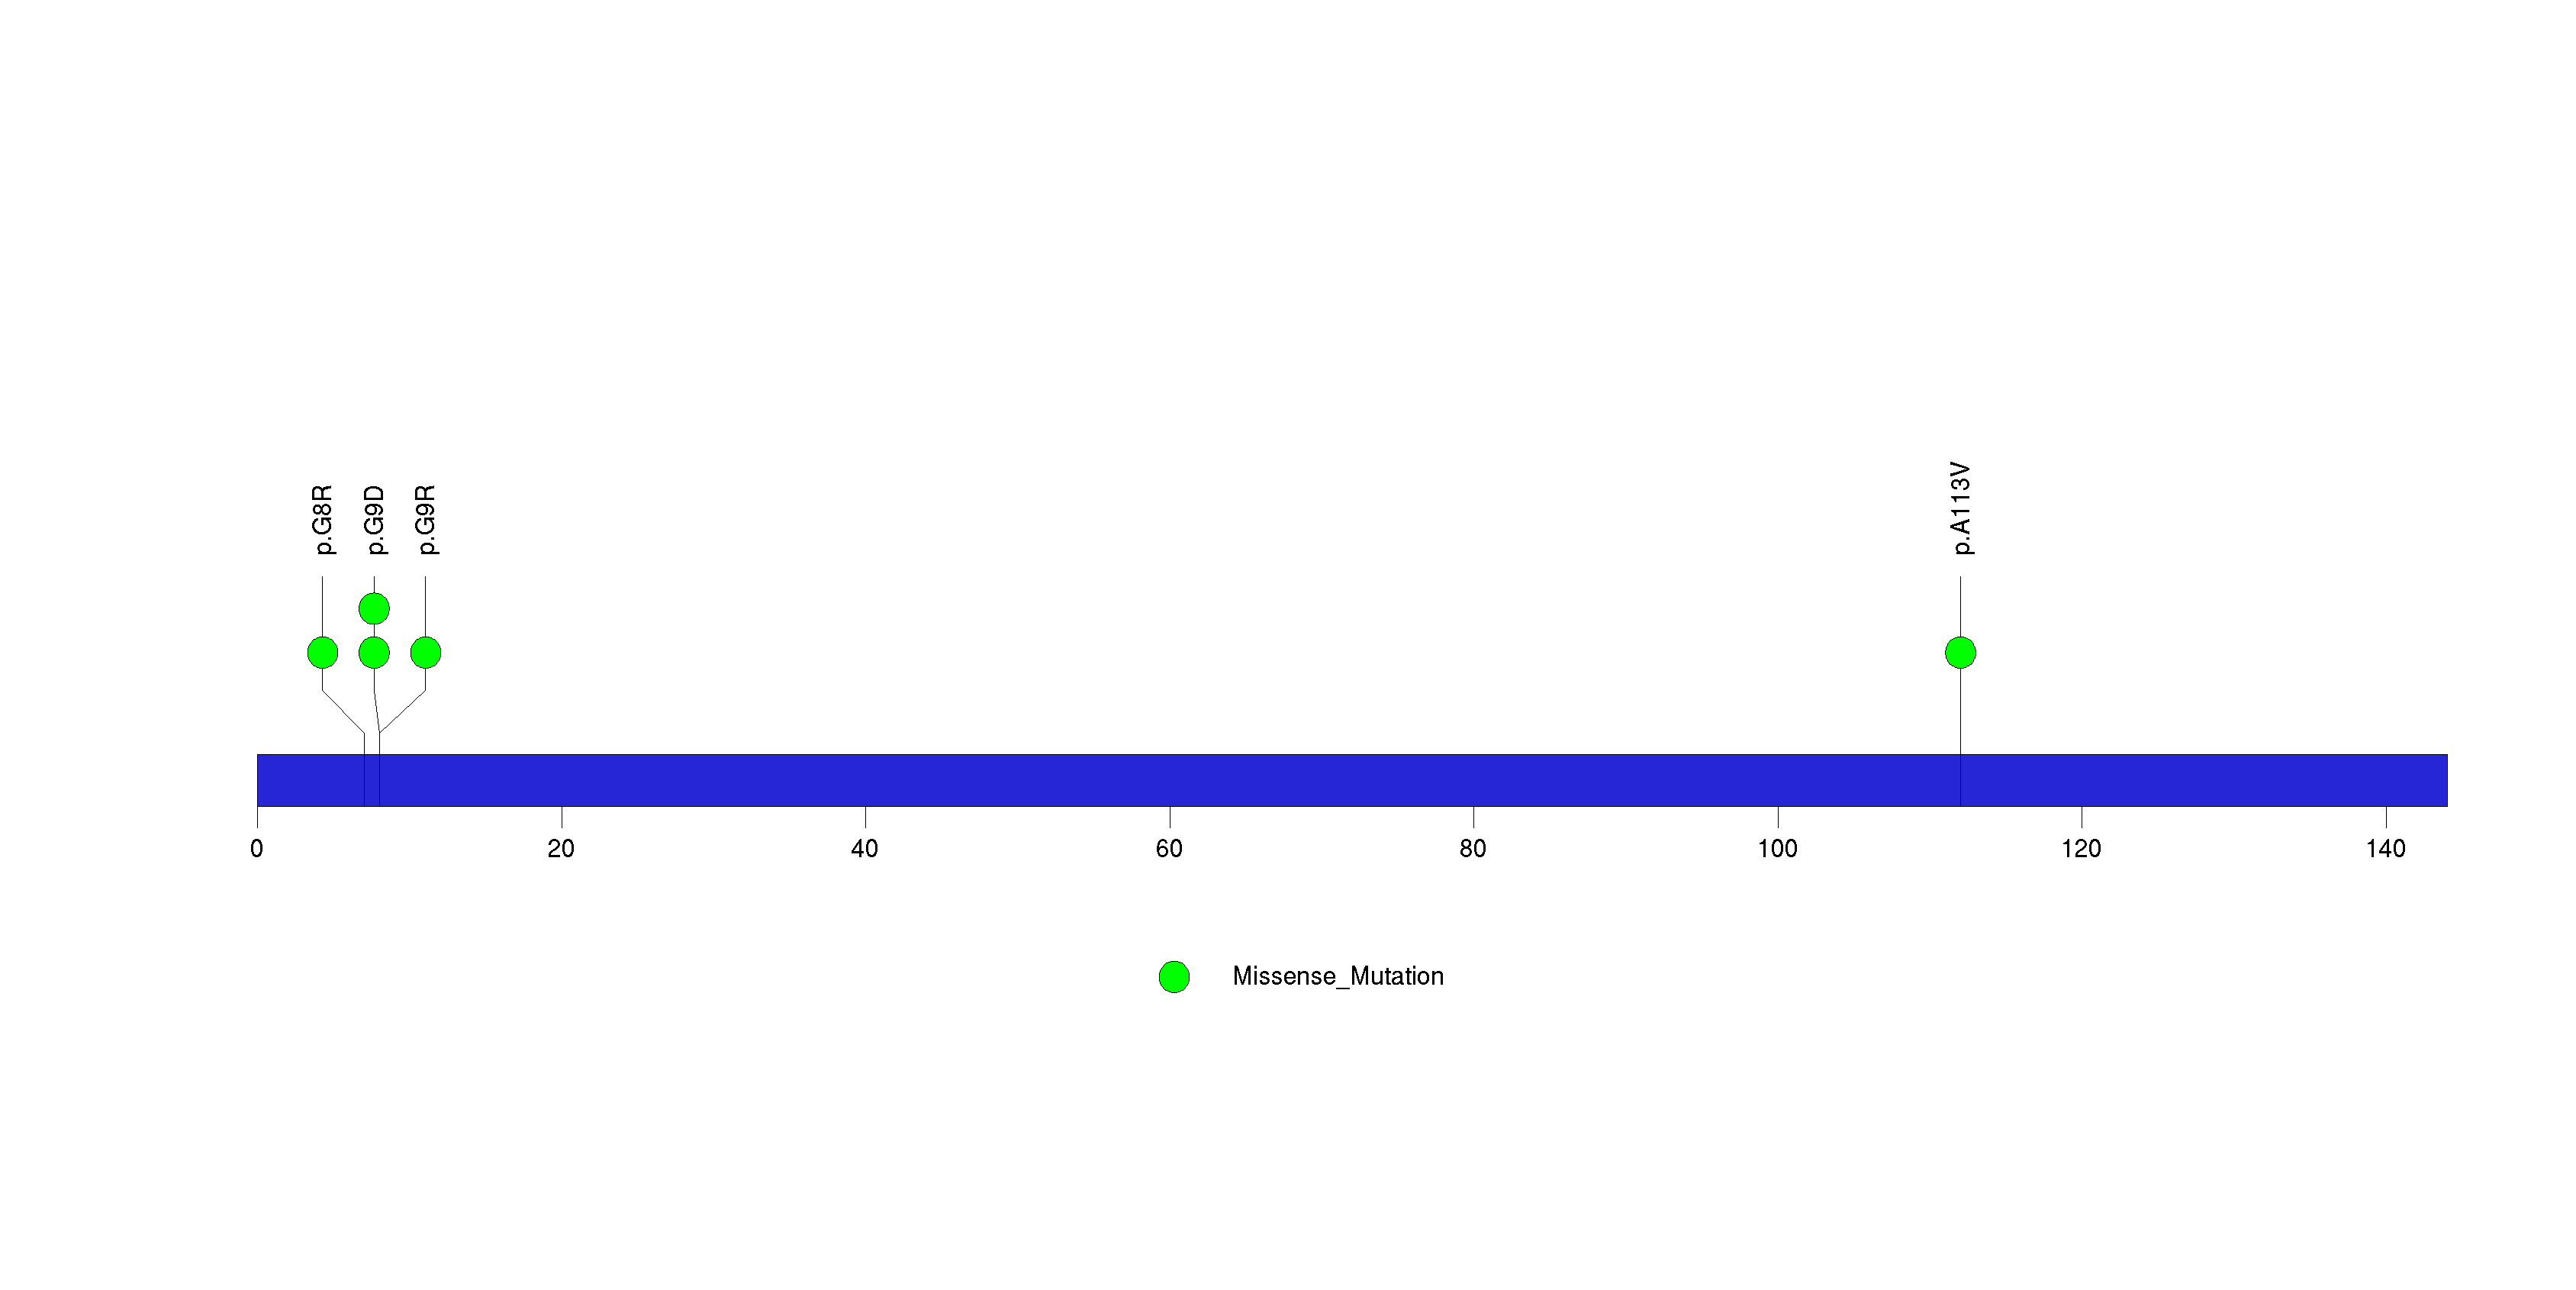
Figure S8. This figure depicts the distribution of mutations and mutation types across the ZNF845 significant gene.
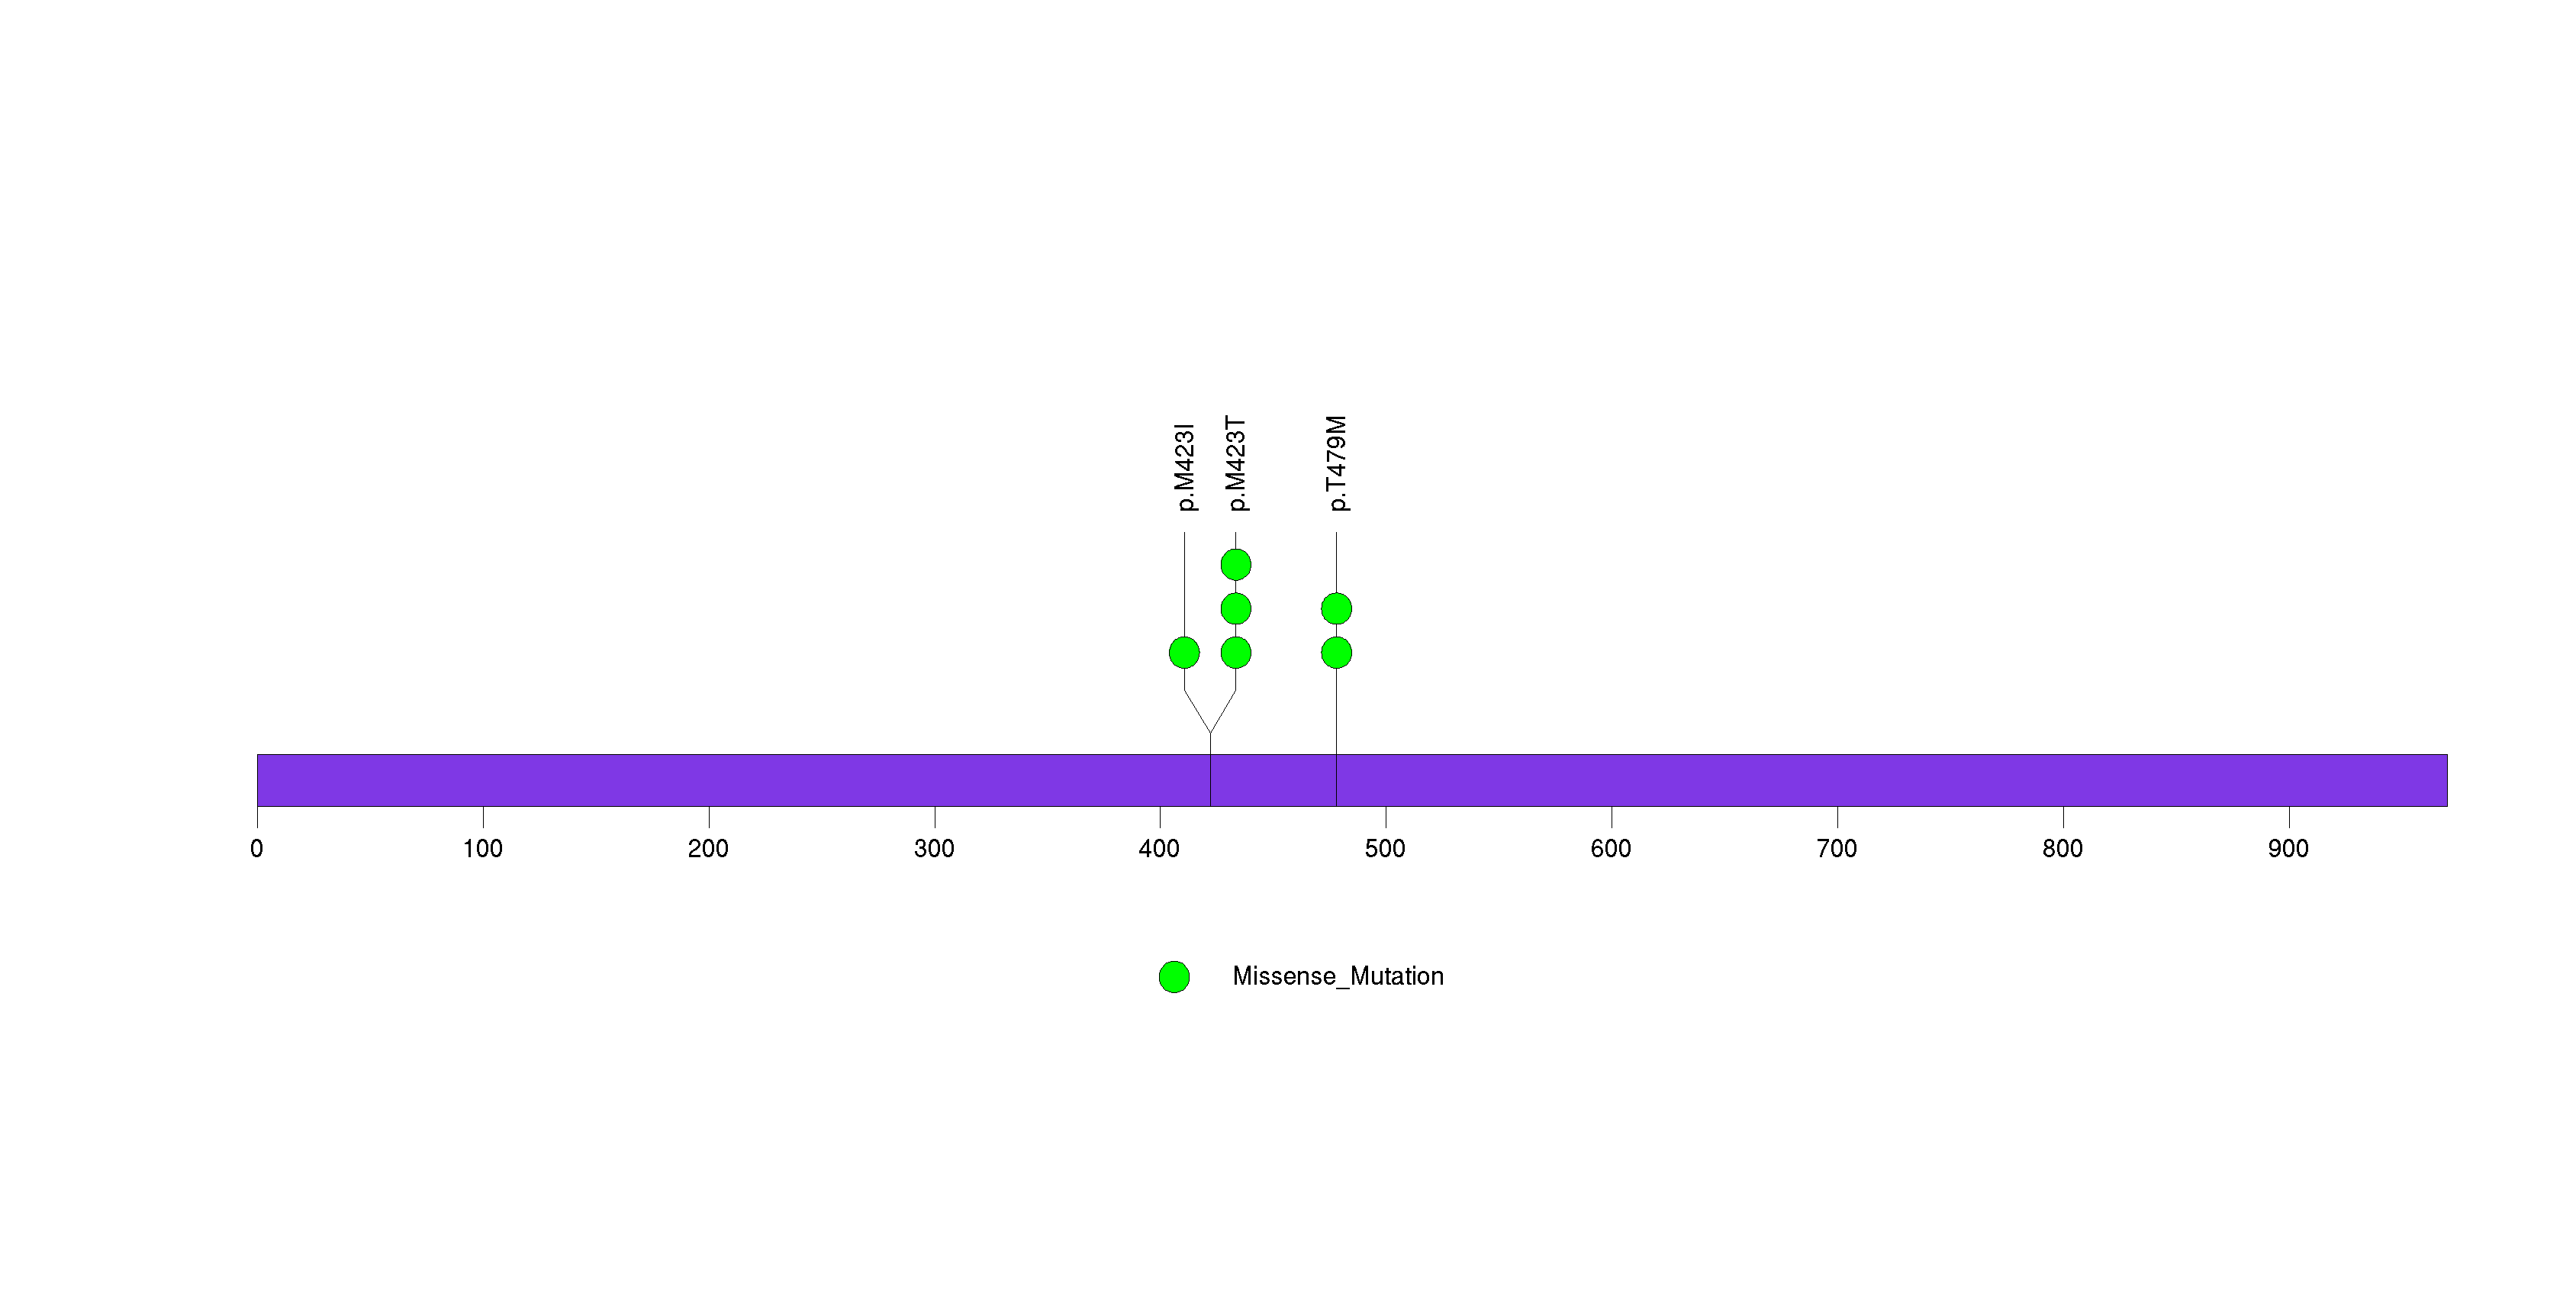
Figure S9. This figure depicts the distribution of mutations and mutation types across the IL32 significant gene.
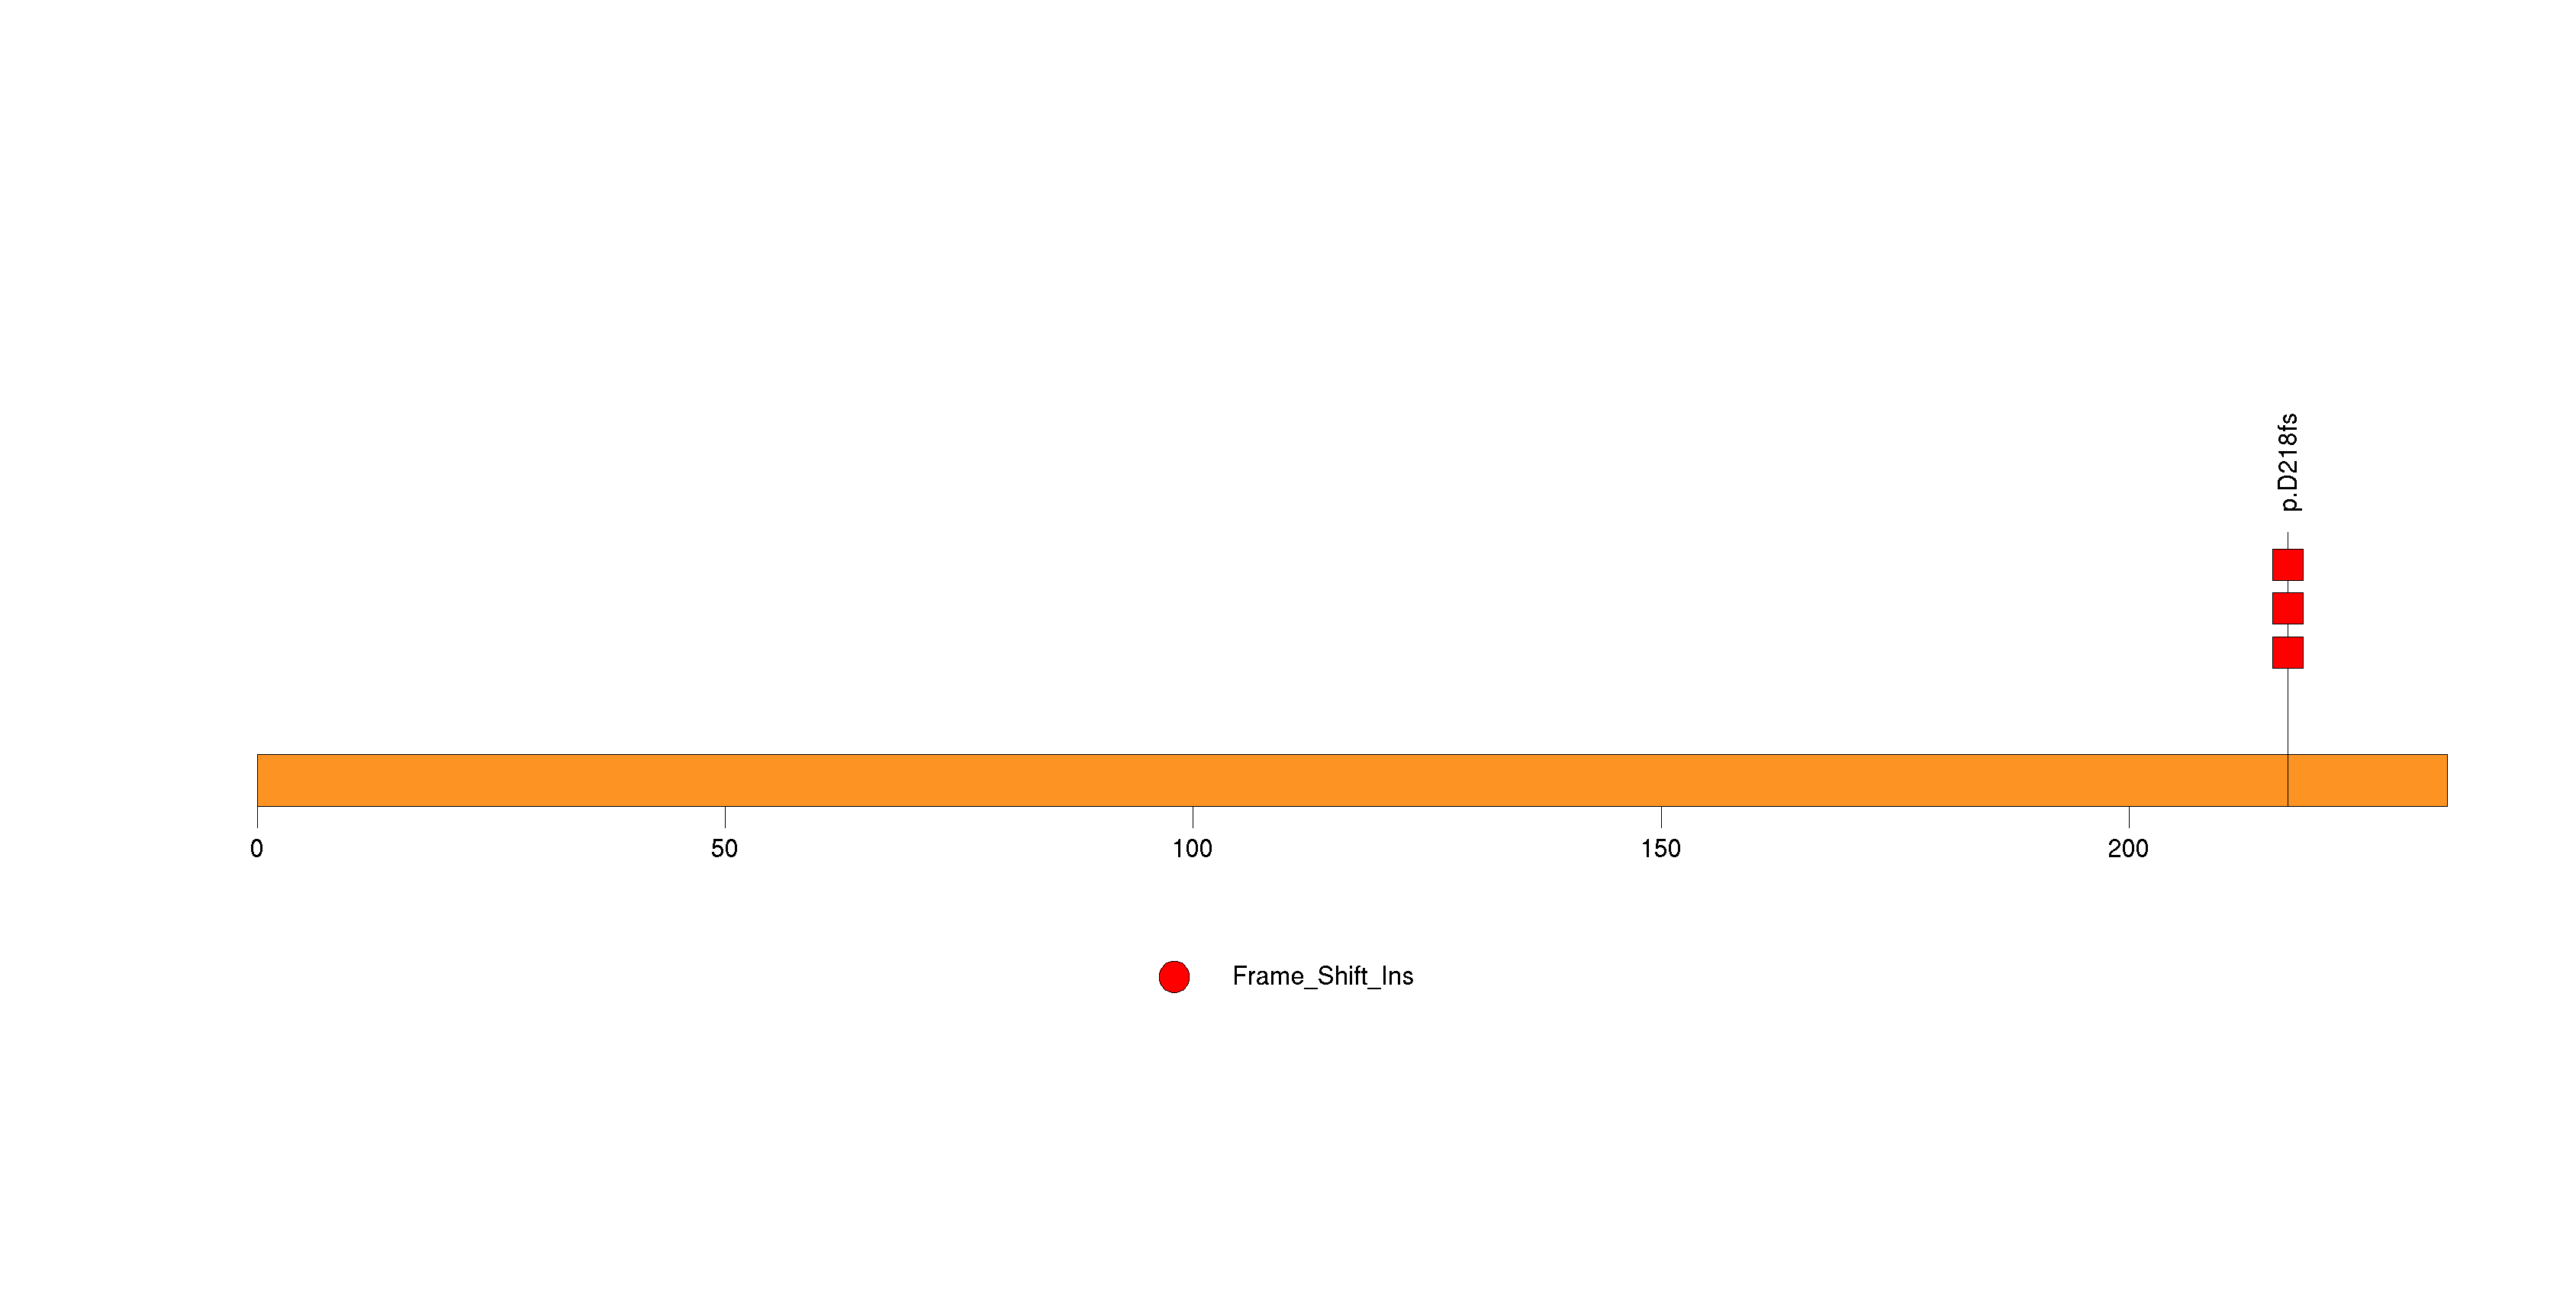
Figure S10. This figure depicts the distribution of mutations and mutation types across the CCDC15 significant gene.
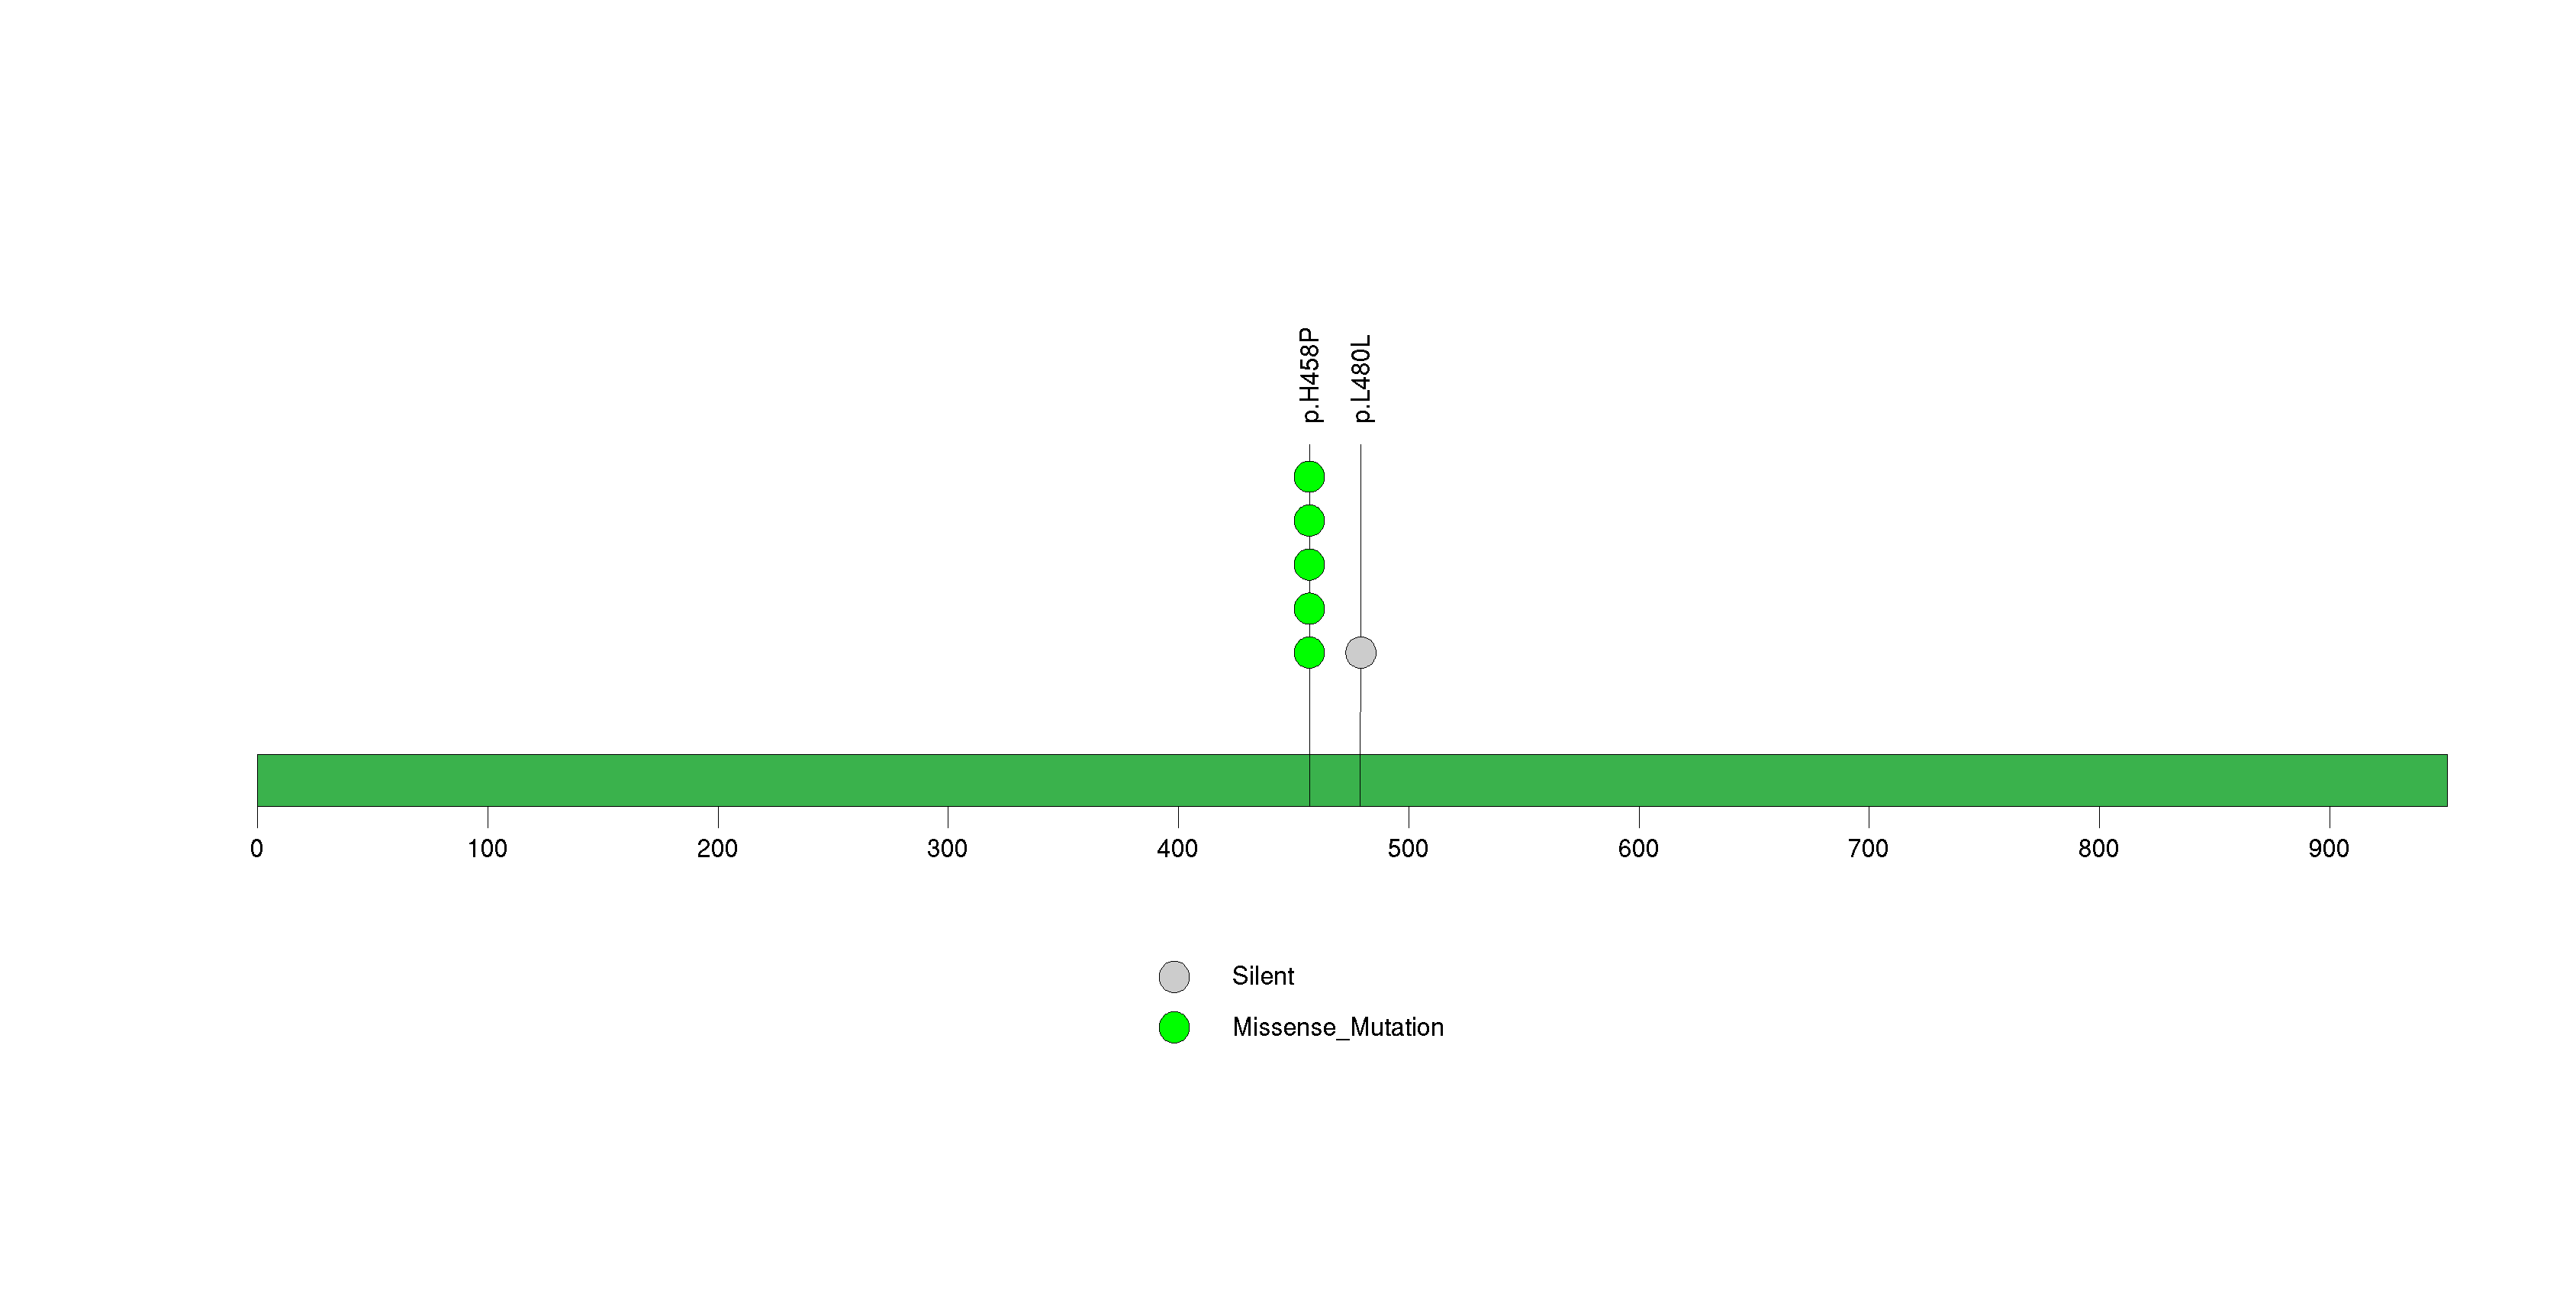
Figure S11. This figure depicts the distribution of mutations and mutation types across the TG significant gene.
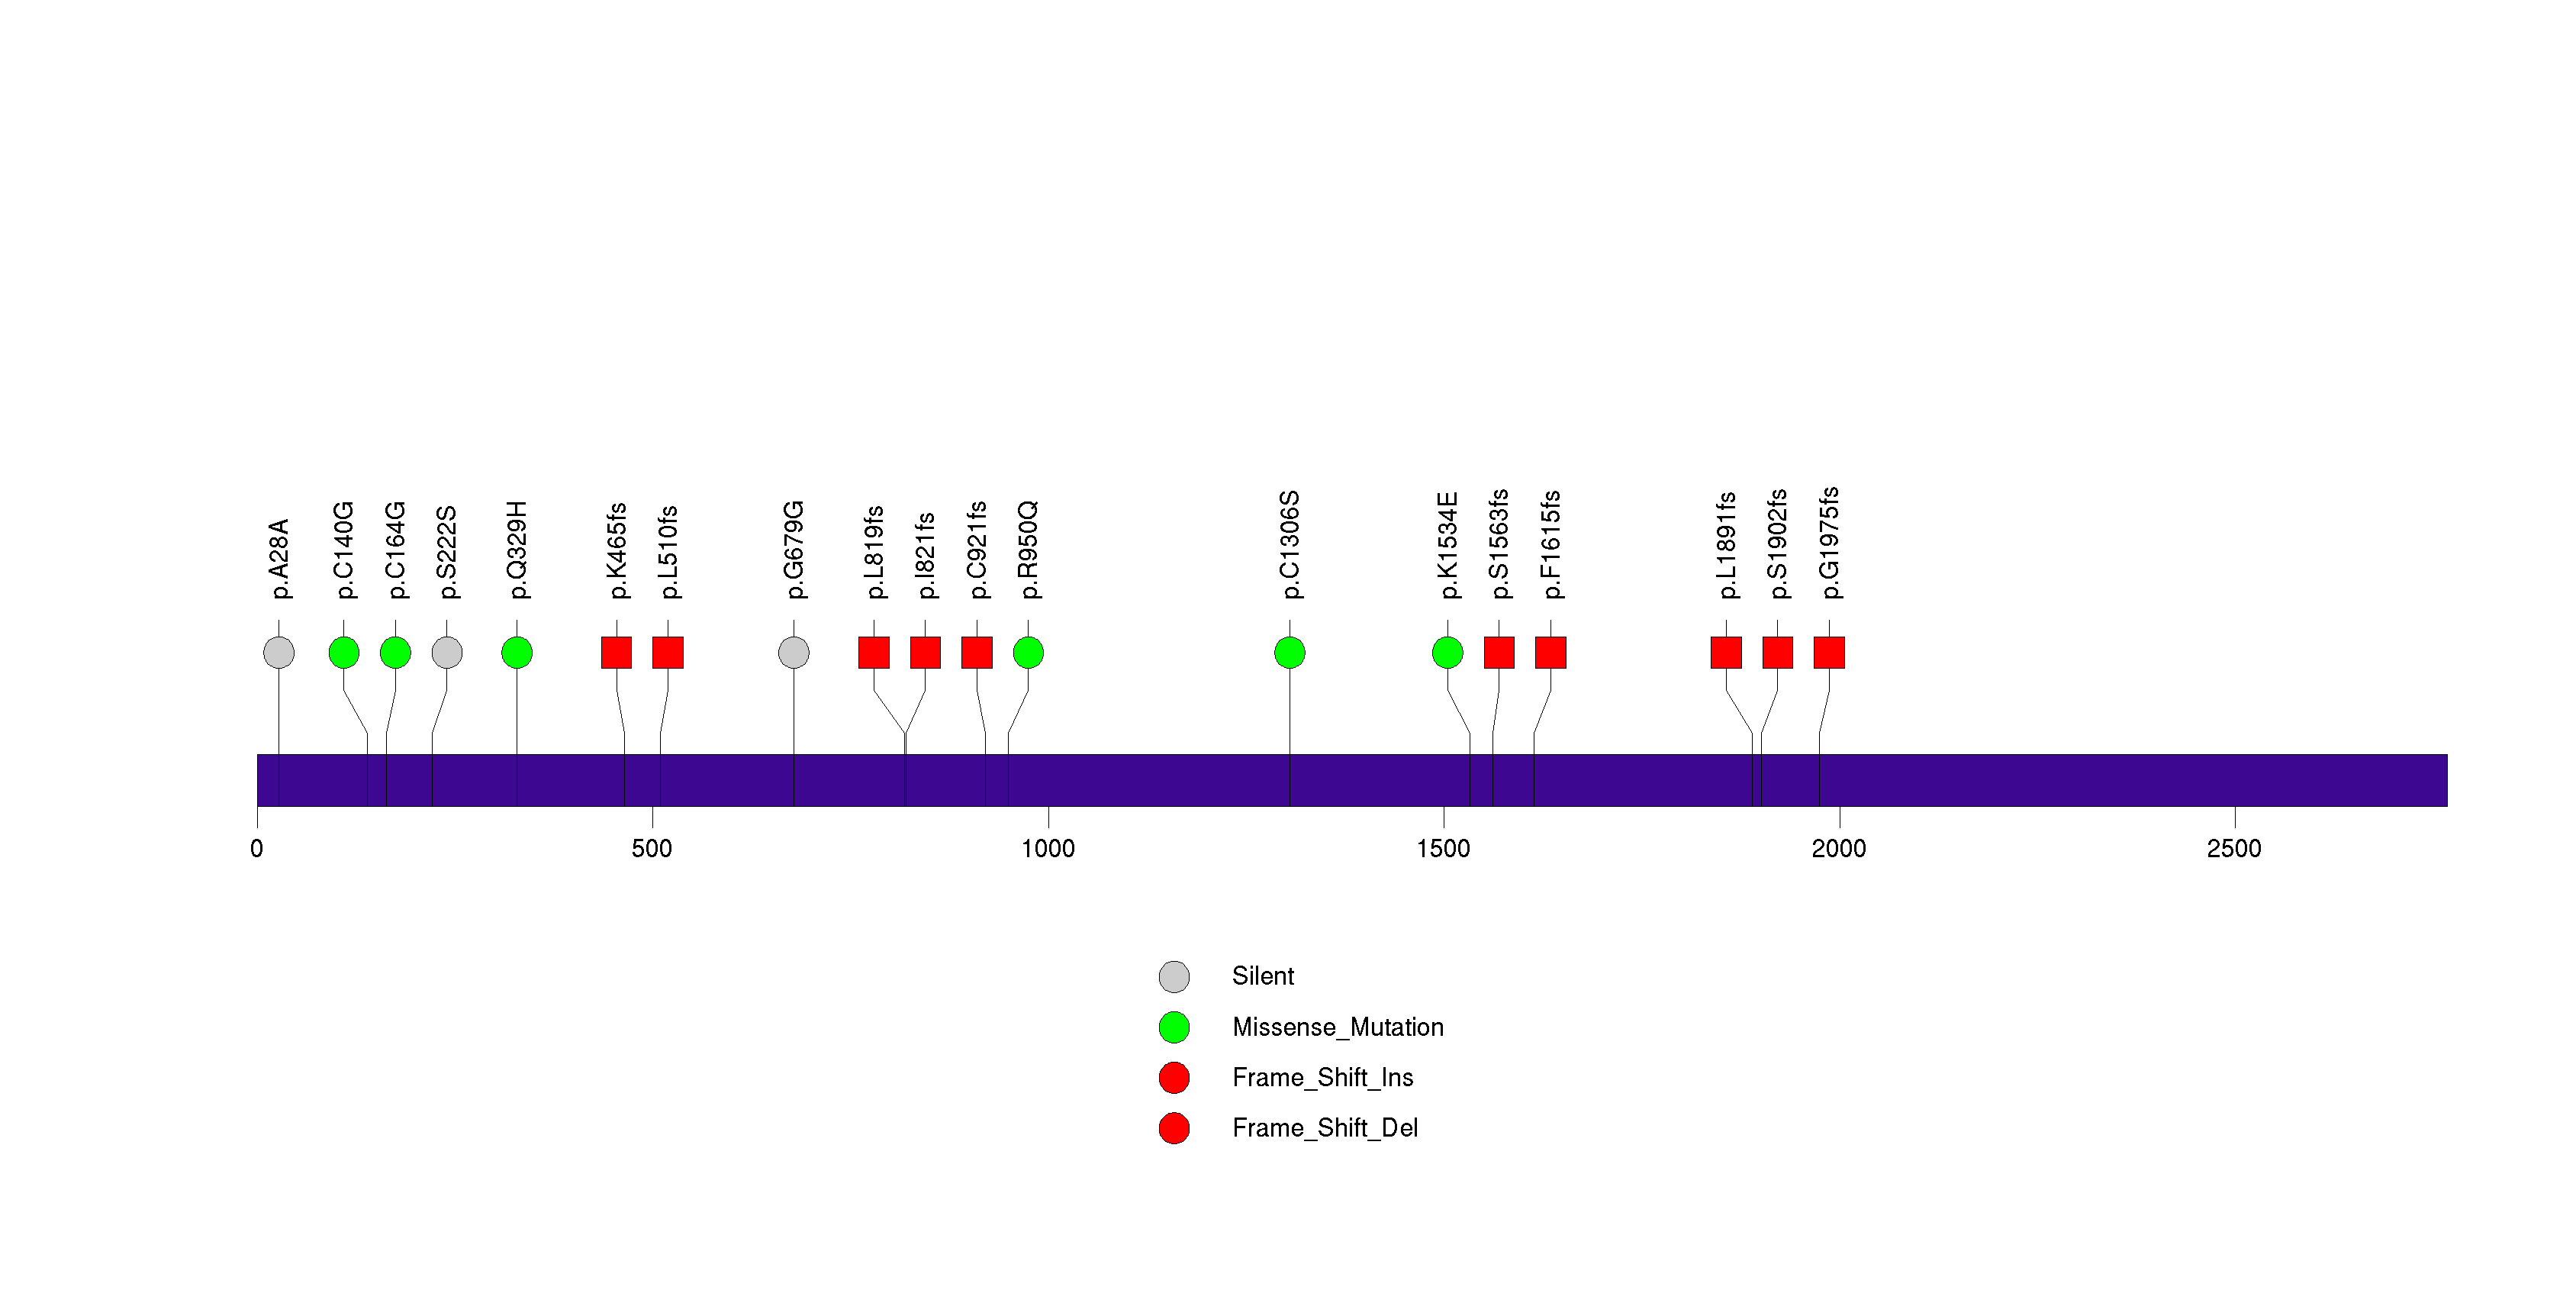
Figure S12. This figure depicts the distribution of mutations and mutation types across the ZNF878 significant gene.
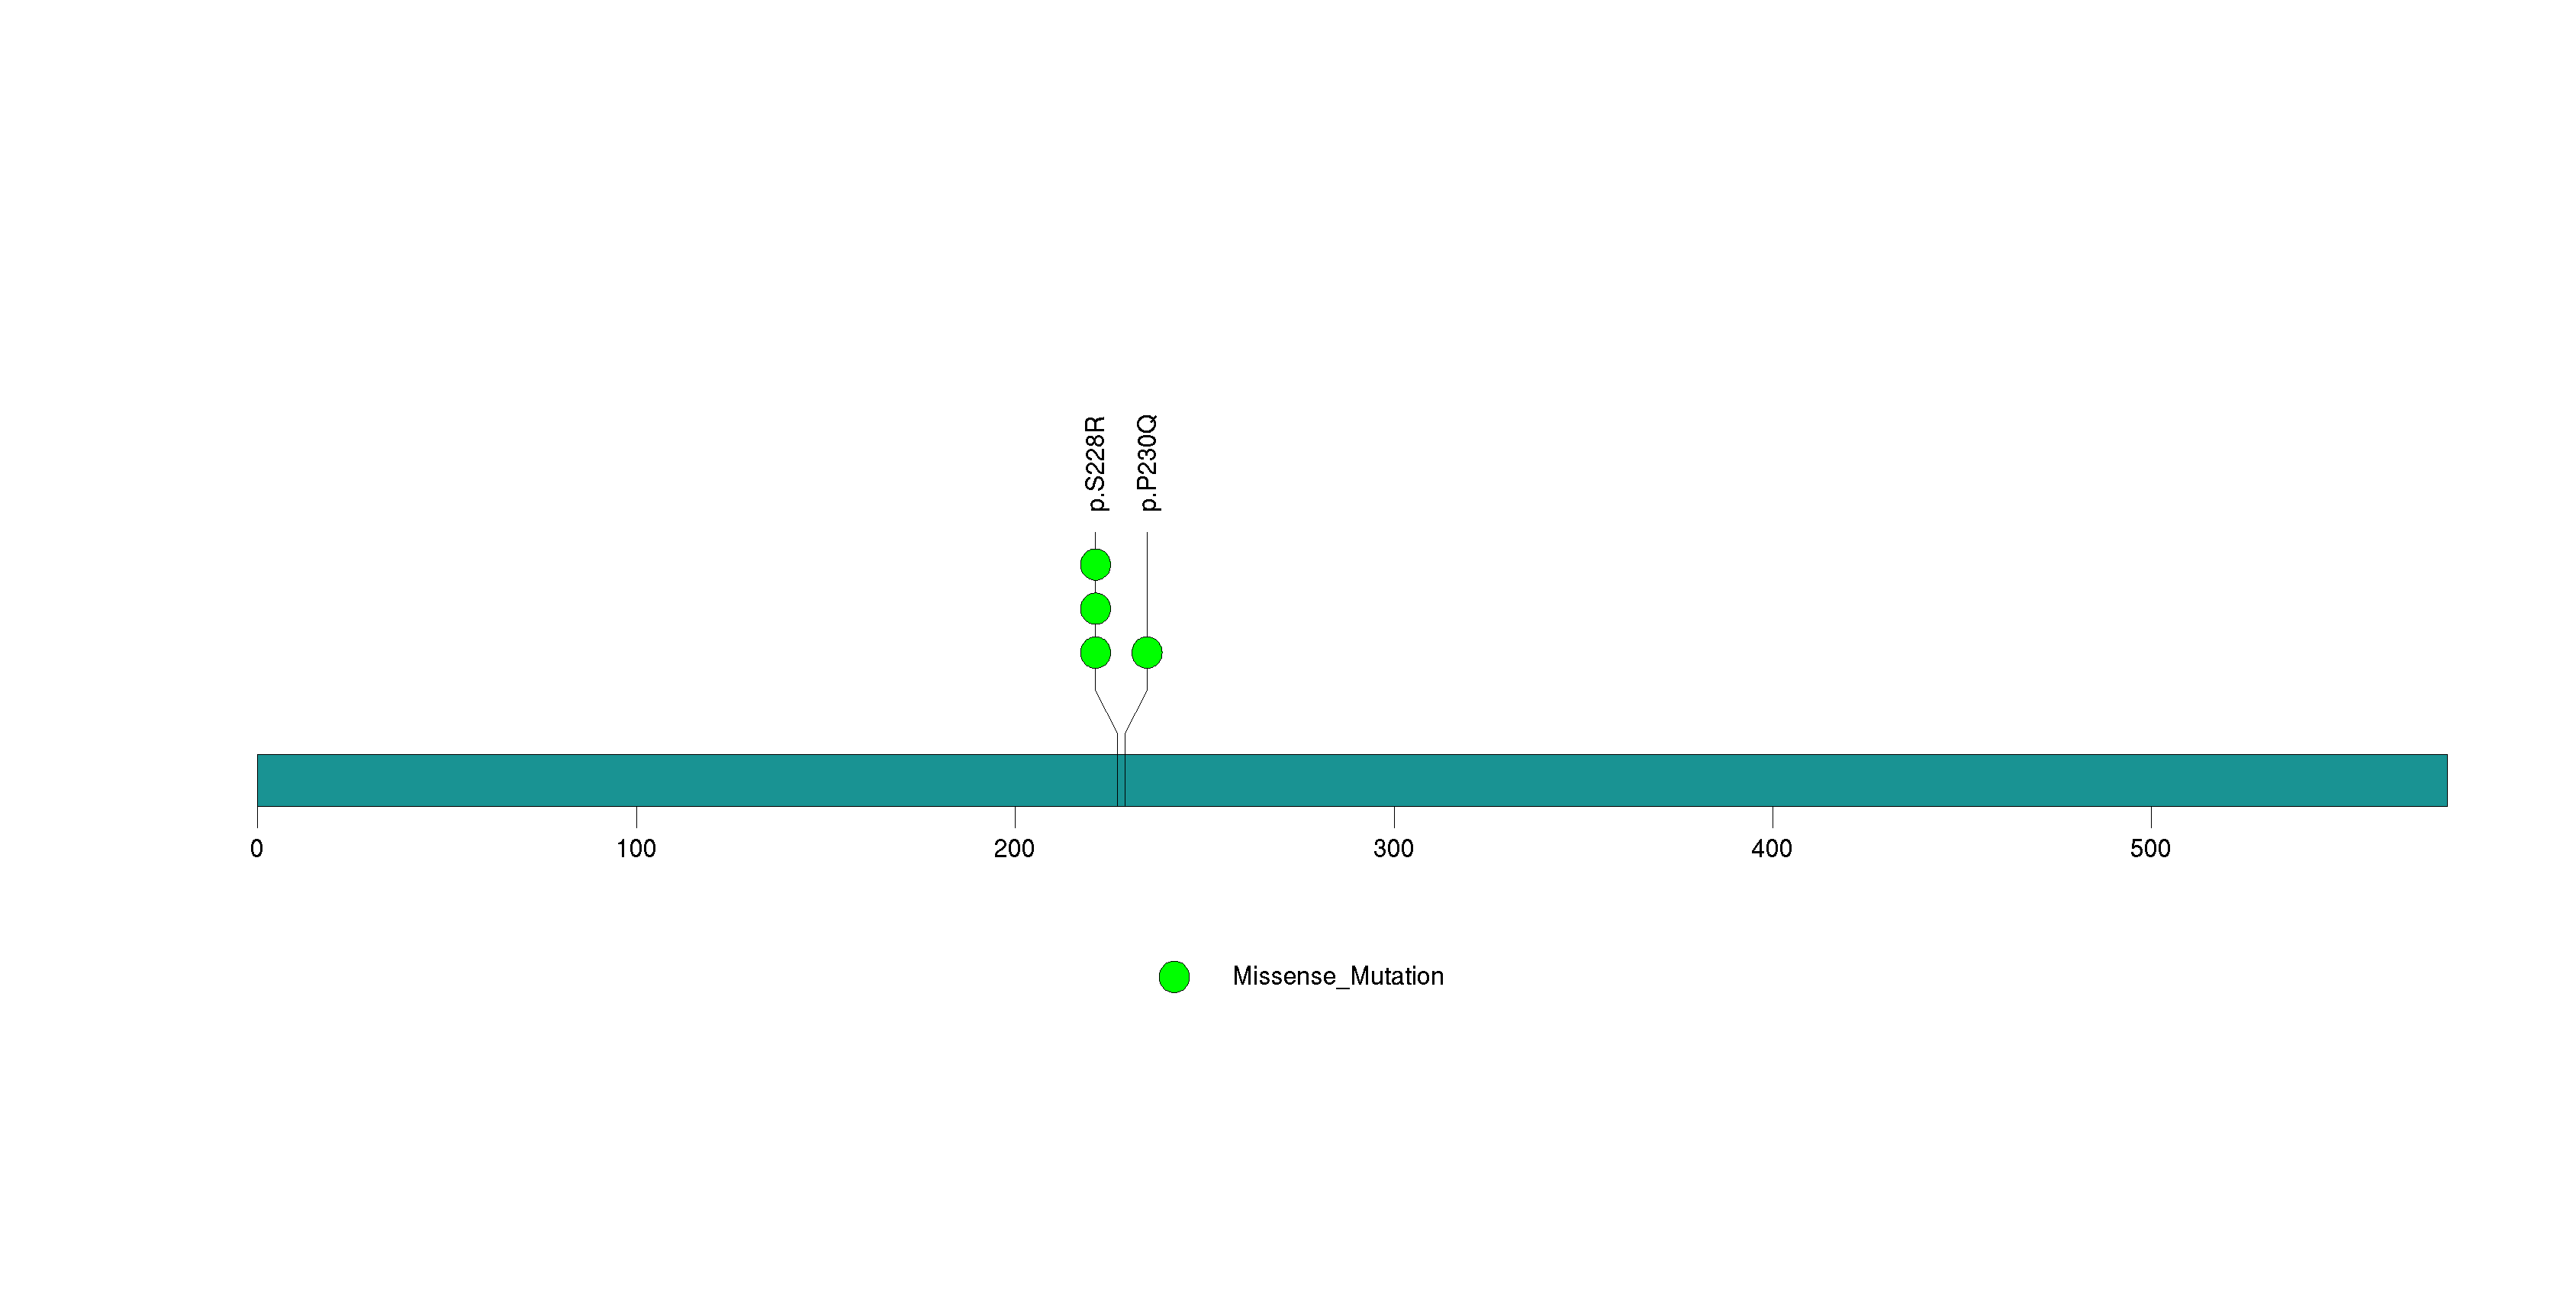
Figure S13. This figure depicts the distribution of mutations and mutation types across the SYNPO2L significant gene.
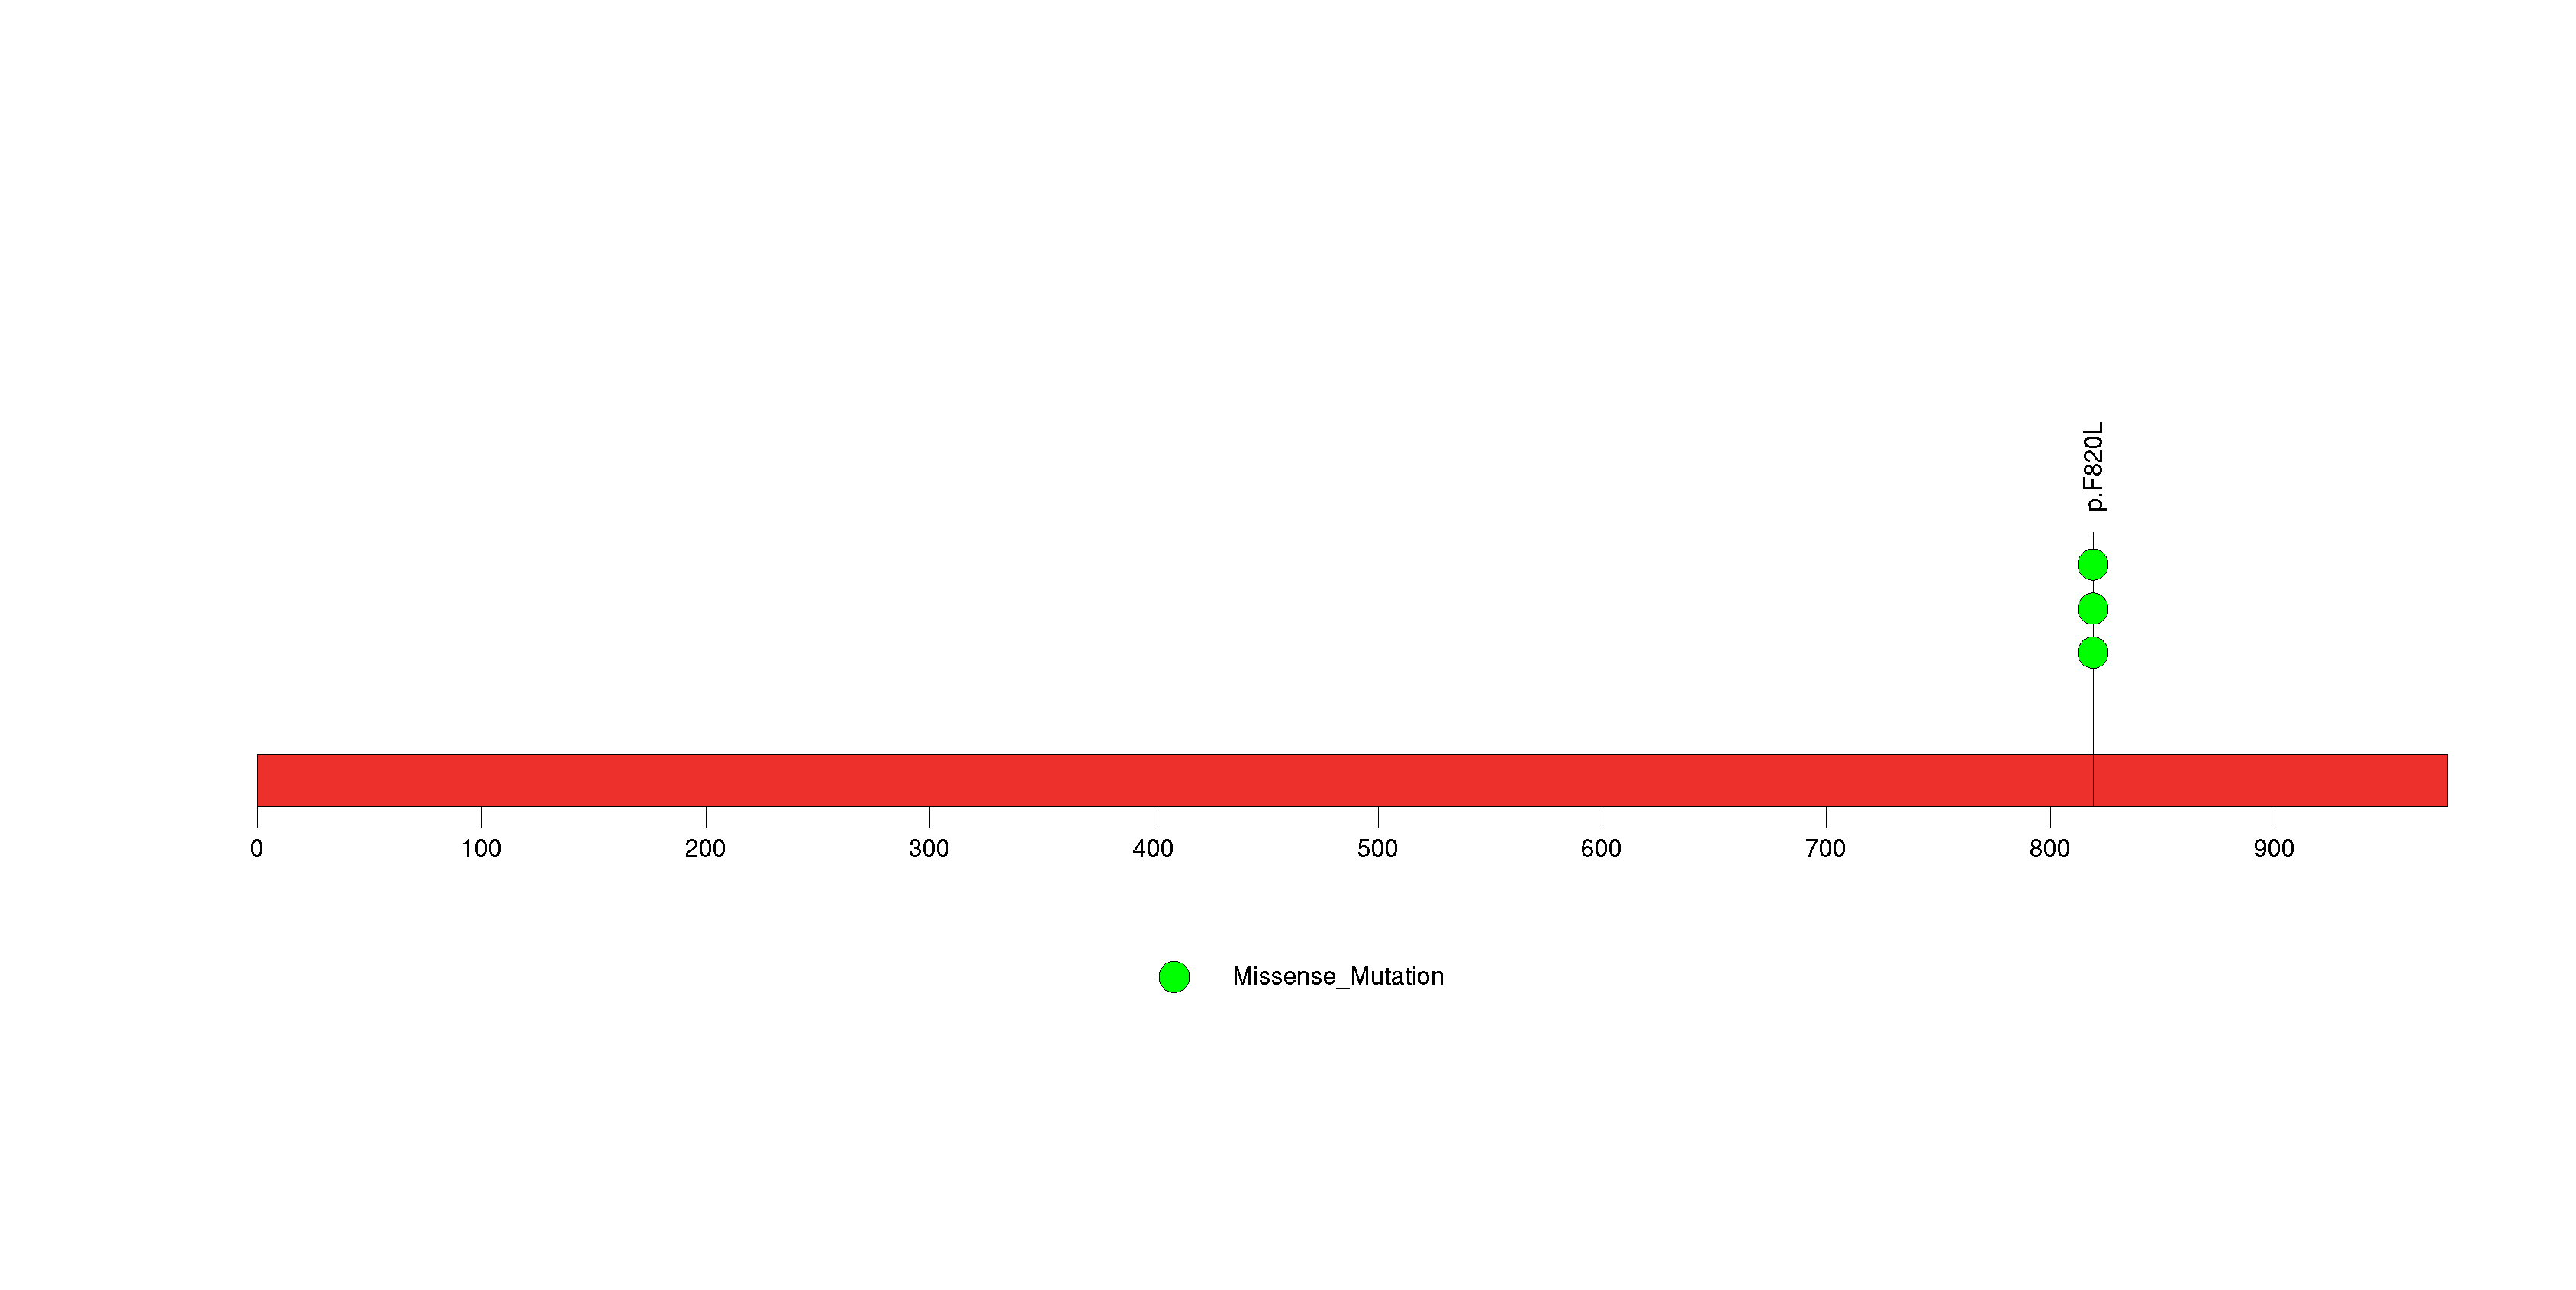
Figure S14. This figure depicts the distribution of mutations and mutation types across the ZNF479 significant gene.
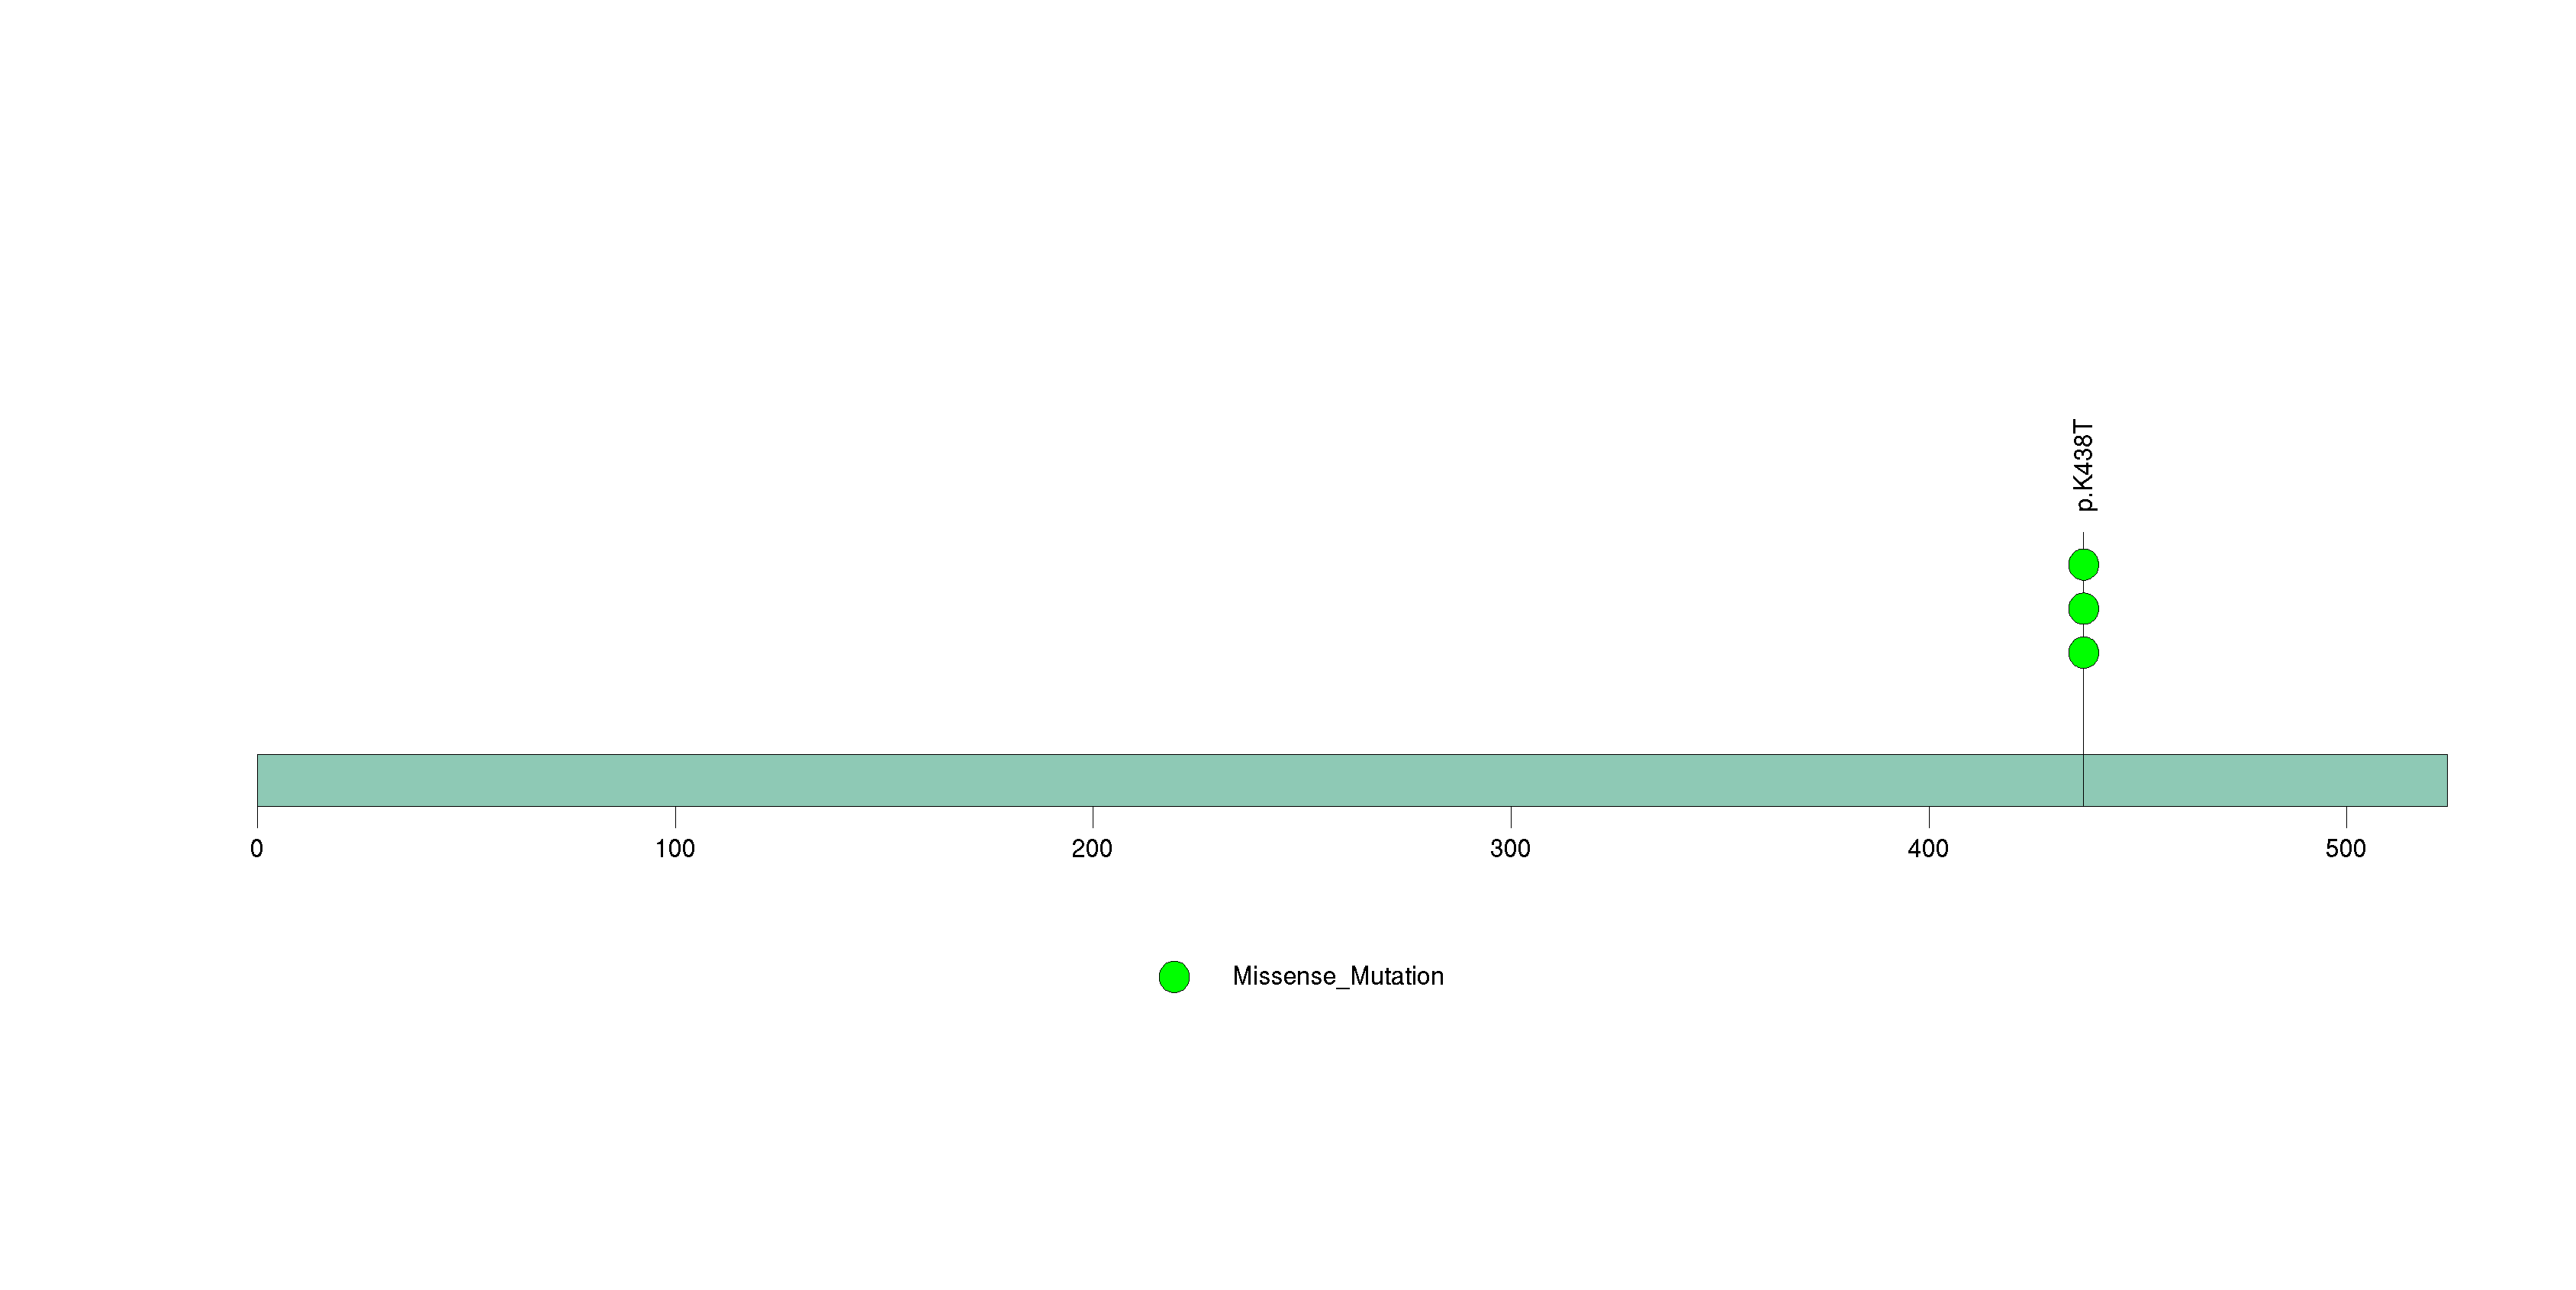
Figure S15. This figure depicts the distribution of mutations and mutation types across the MUC7 significant gene.
Figure S16. This figure depicts the distribution of mutations and mutation types across the PPM1D significant gene.
Figure S17. This figure depicts the distribution of mutations and mutation types across the ZNF799 significant gene.
Figure S18. This figure depicts the distribution of mutations and mutation types across the ATAD2 significant gene.
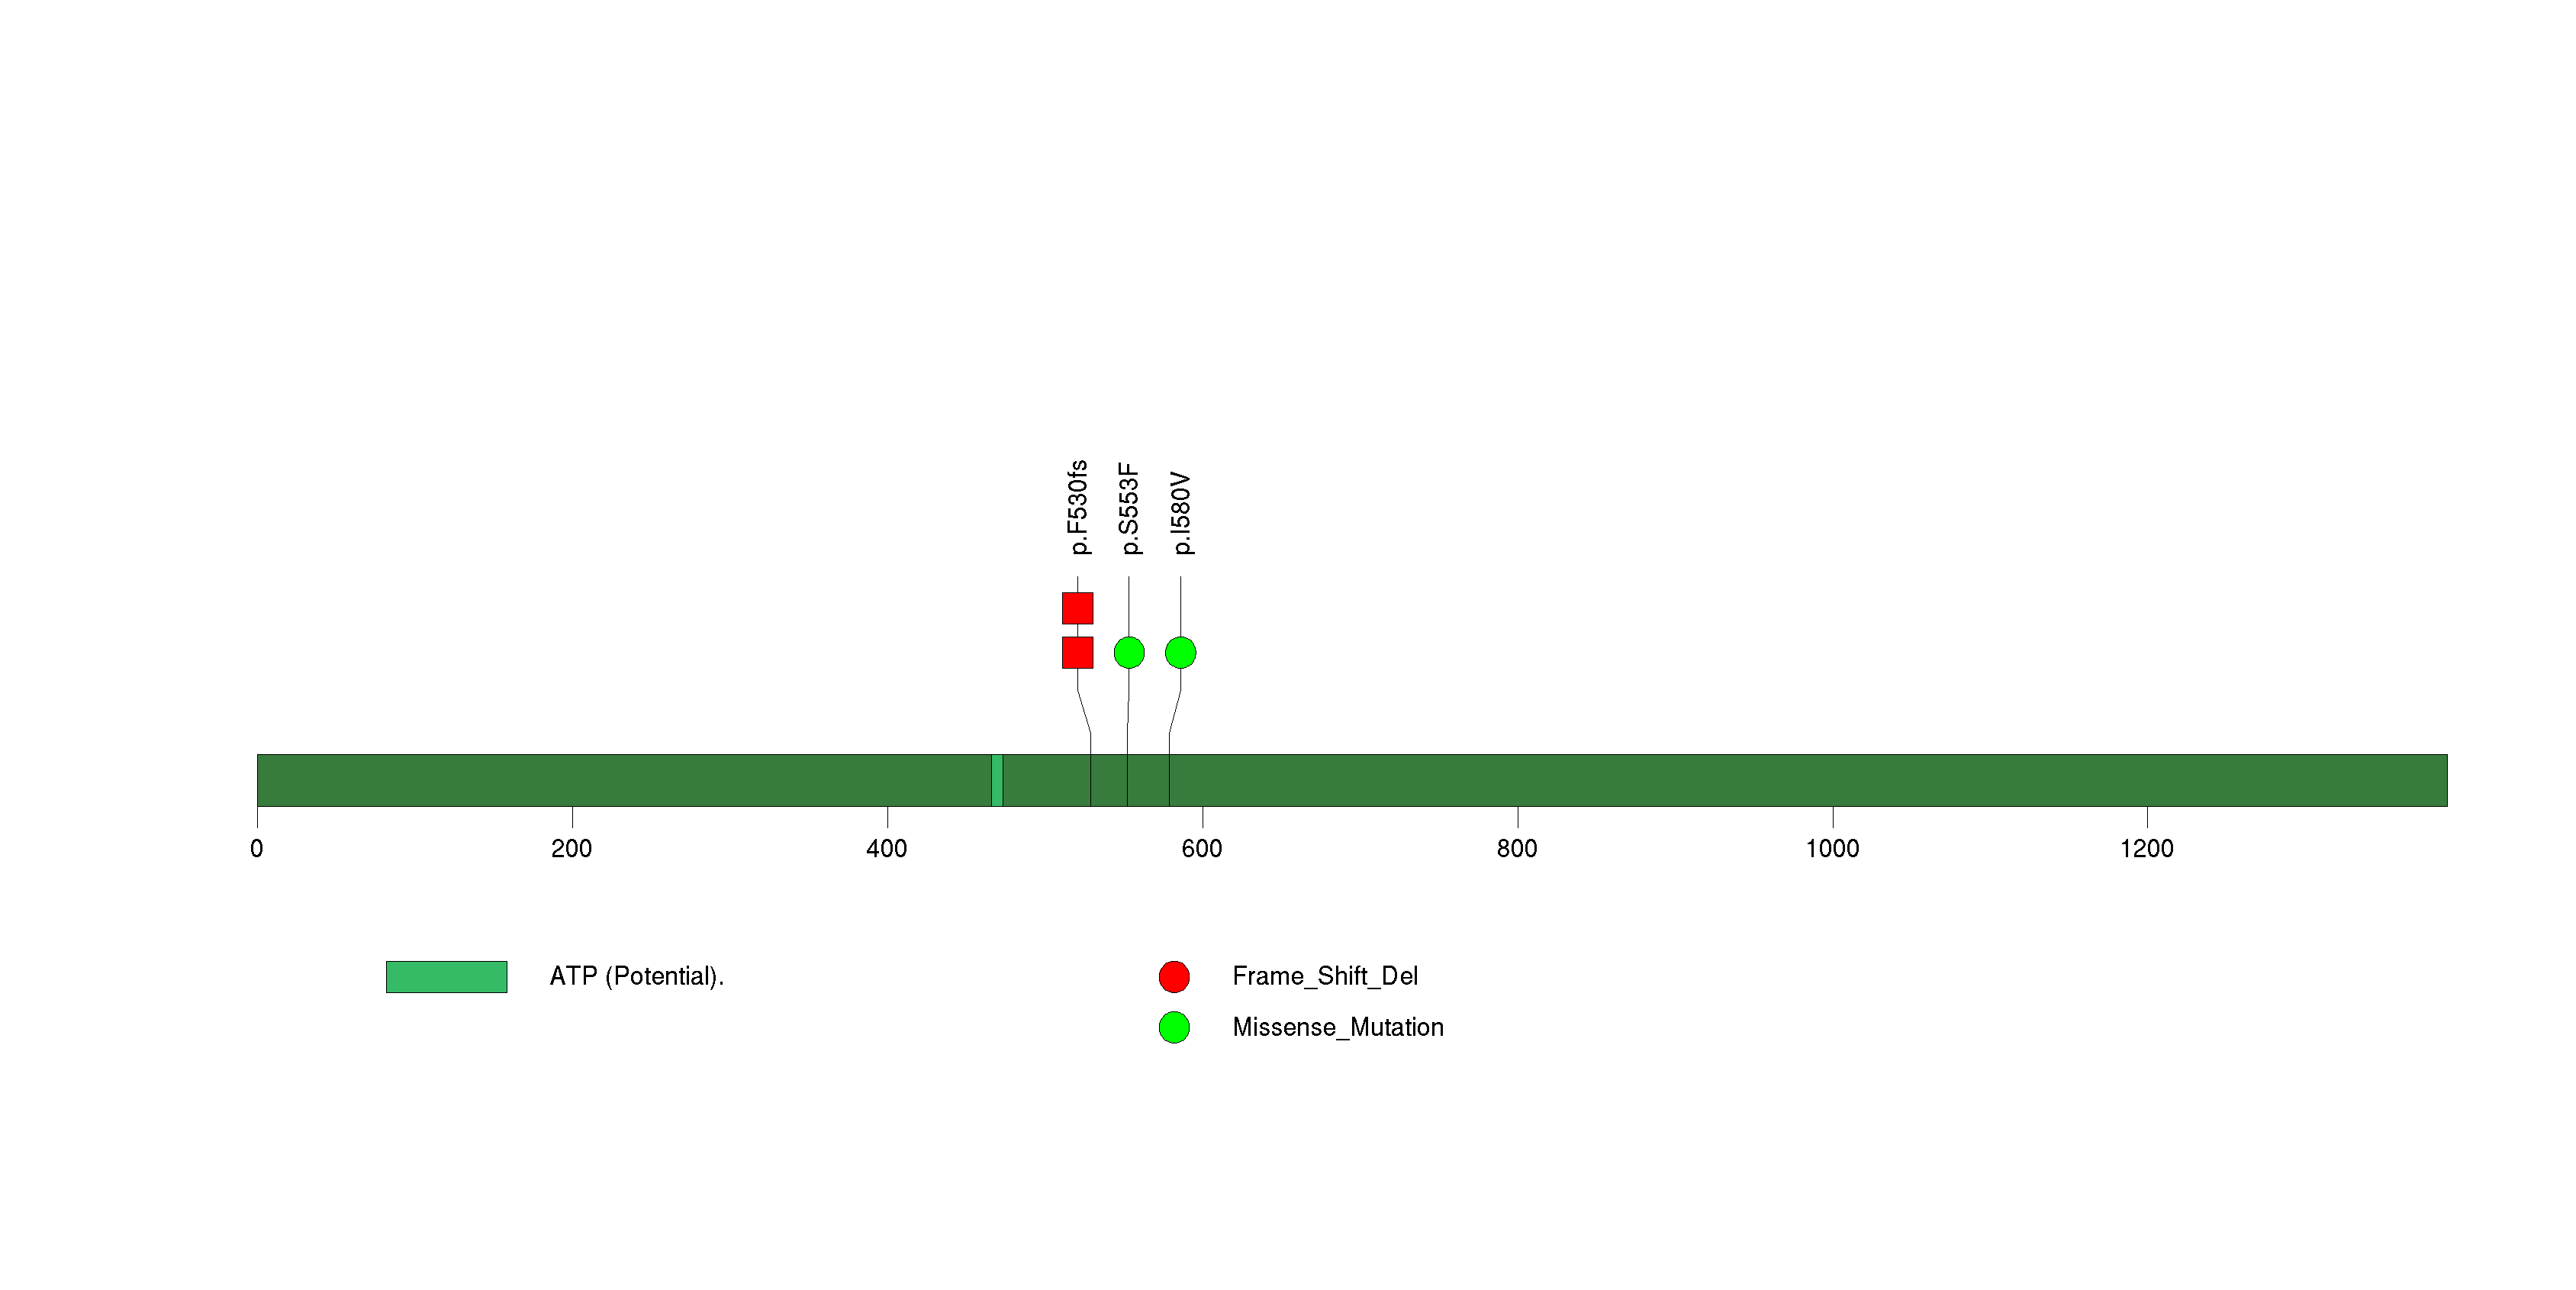
Figure S19. This figure depicts the distribution of mutations and mutation types across the SF3B2 significant gene.
Figure S20. This figure depicts the distribution of mutations and mutation types across the TROAP significant gene.
Figure S21. This figure depicts the distribution of mutations and mutation types across the SLC26A11 significant gene.
Figure S22. This figure depicts the distribution of mutations and mutation types across the MAP3K3 significant gene.
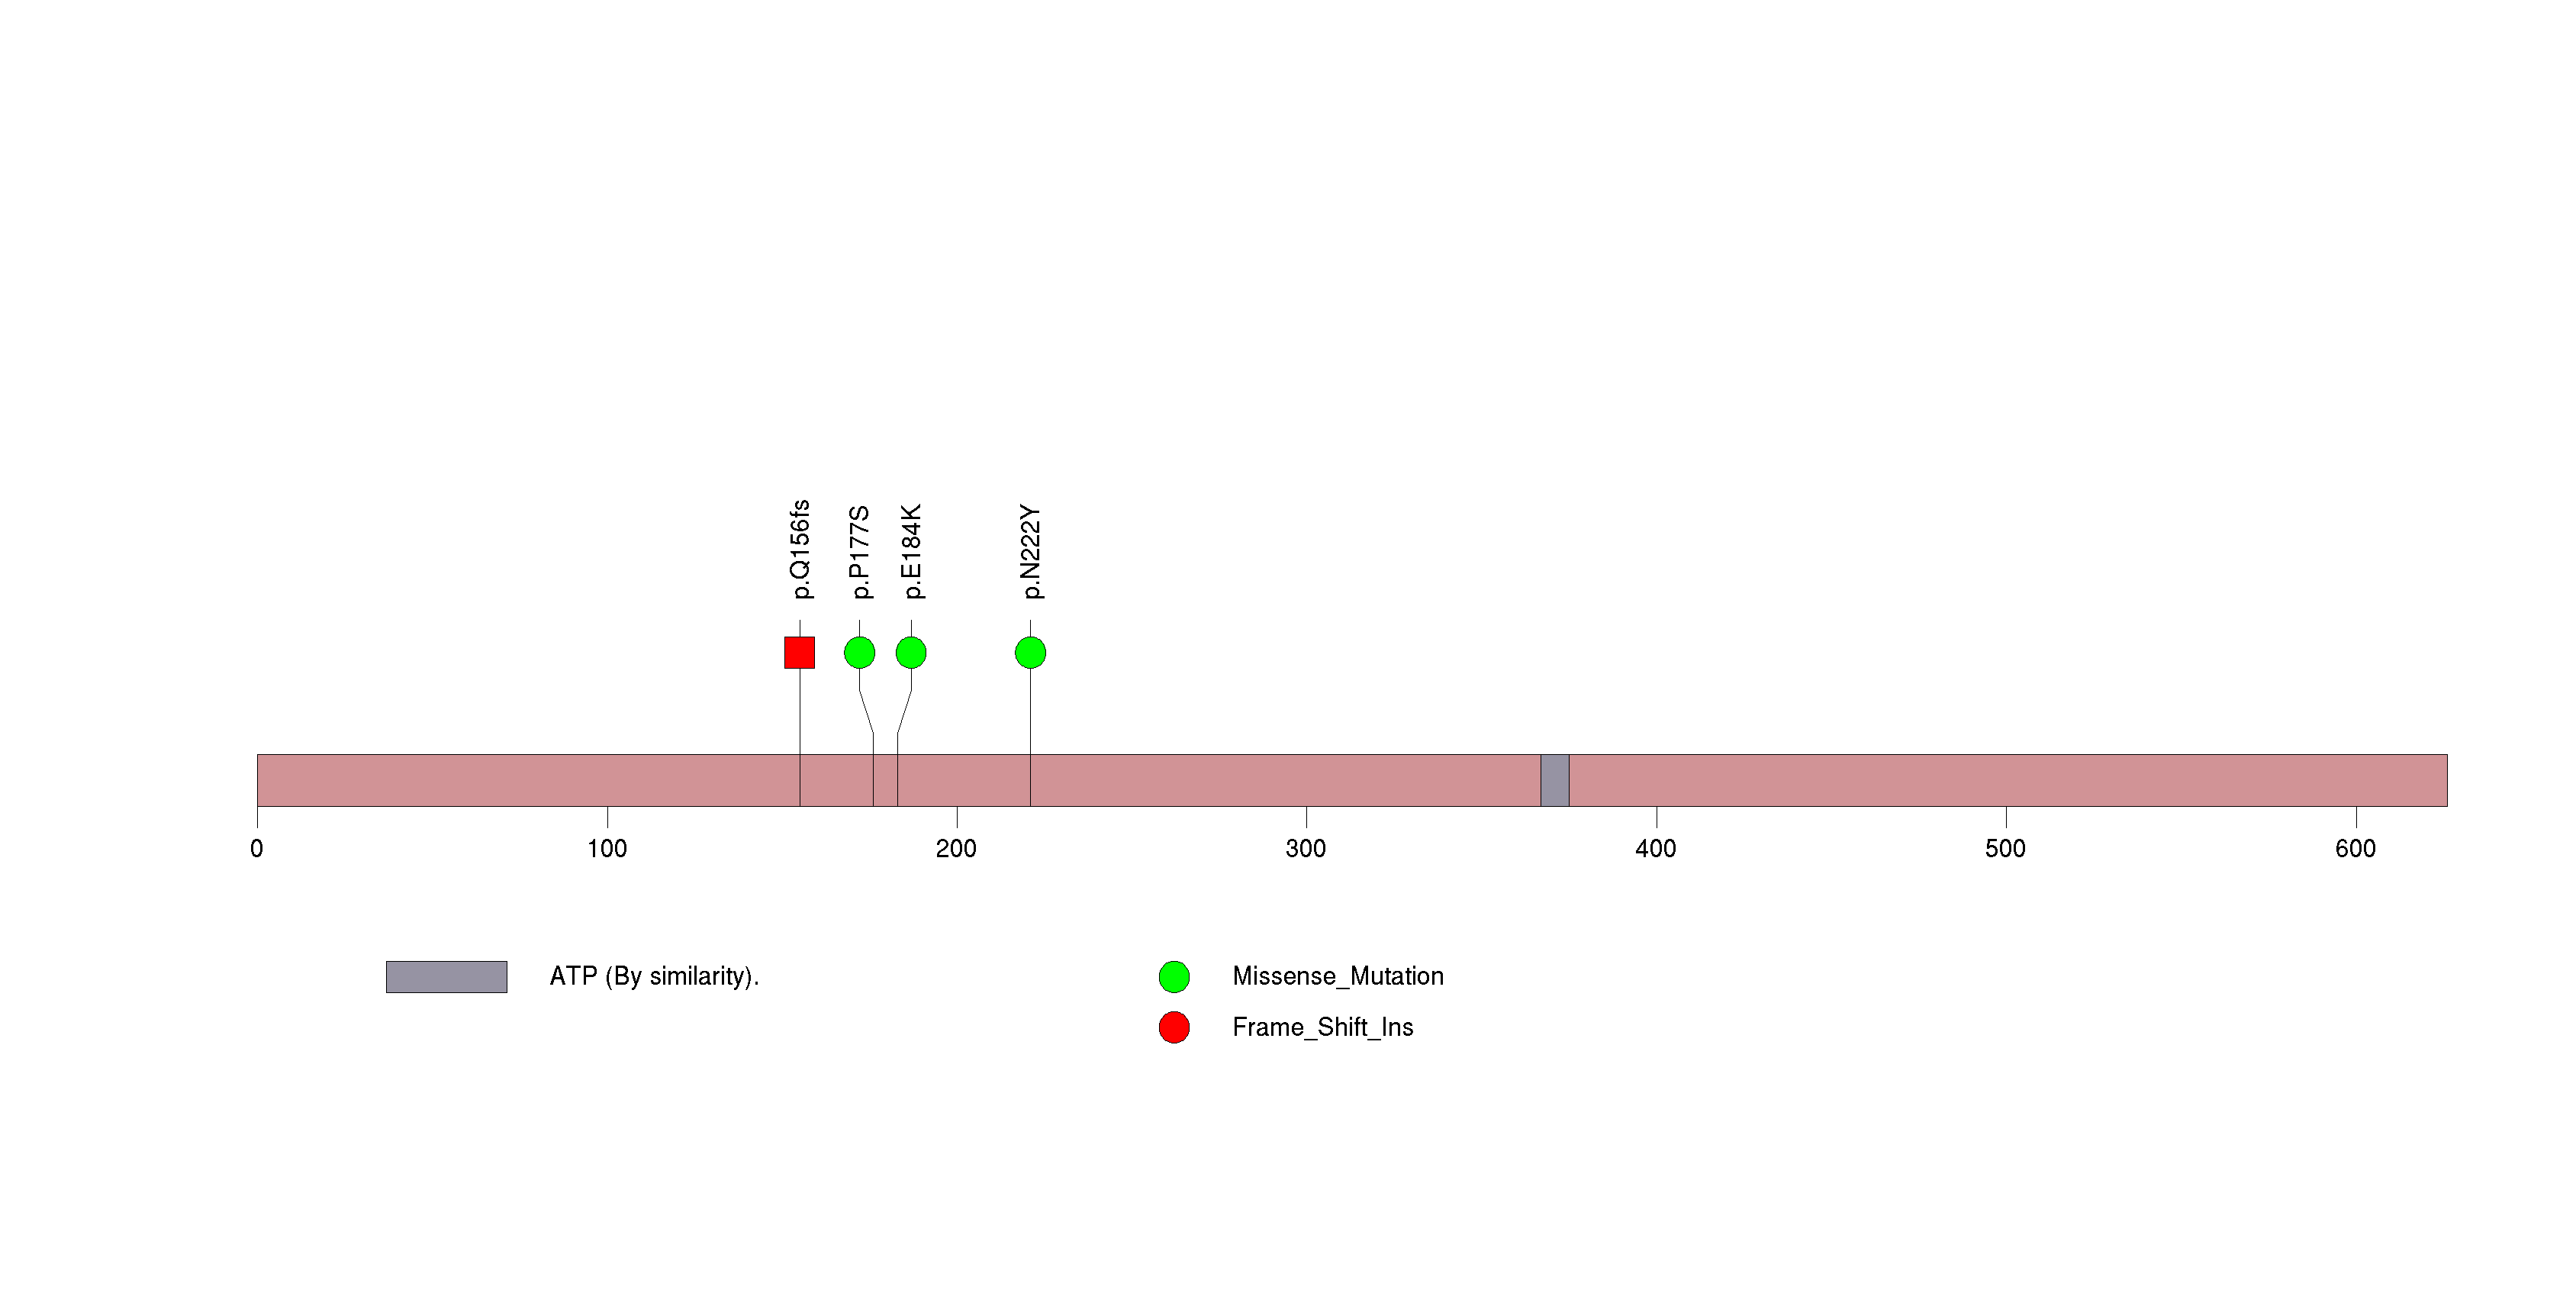
Figure S23. This figure depicts the distribution of mutations and mutation types across the PRG4 significant gene.
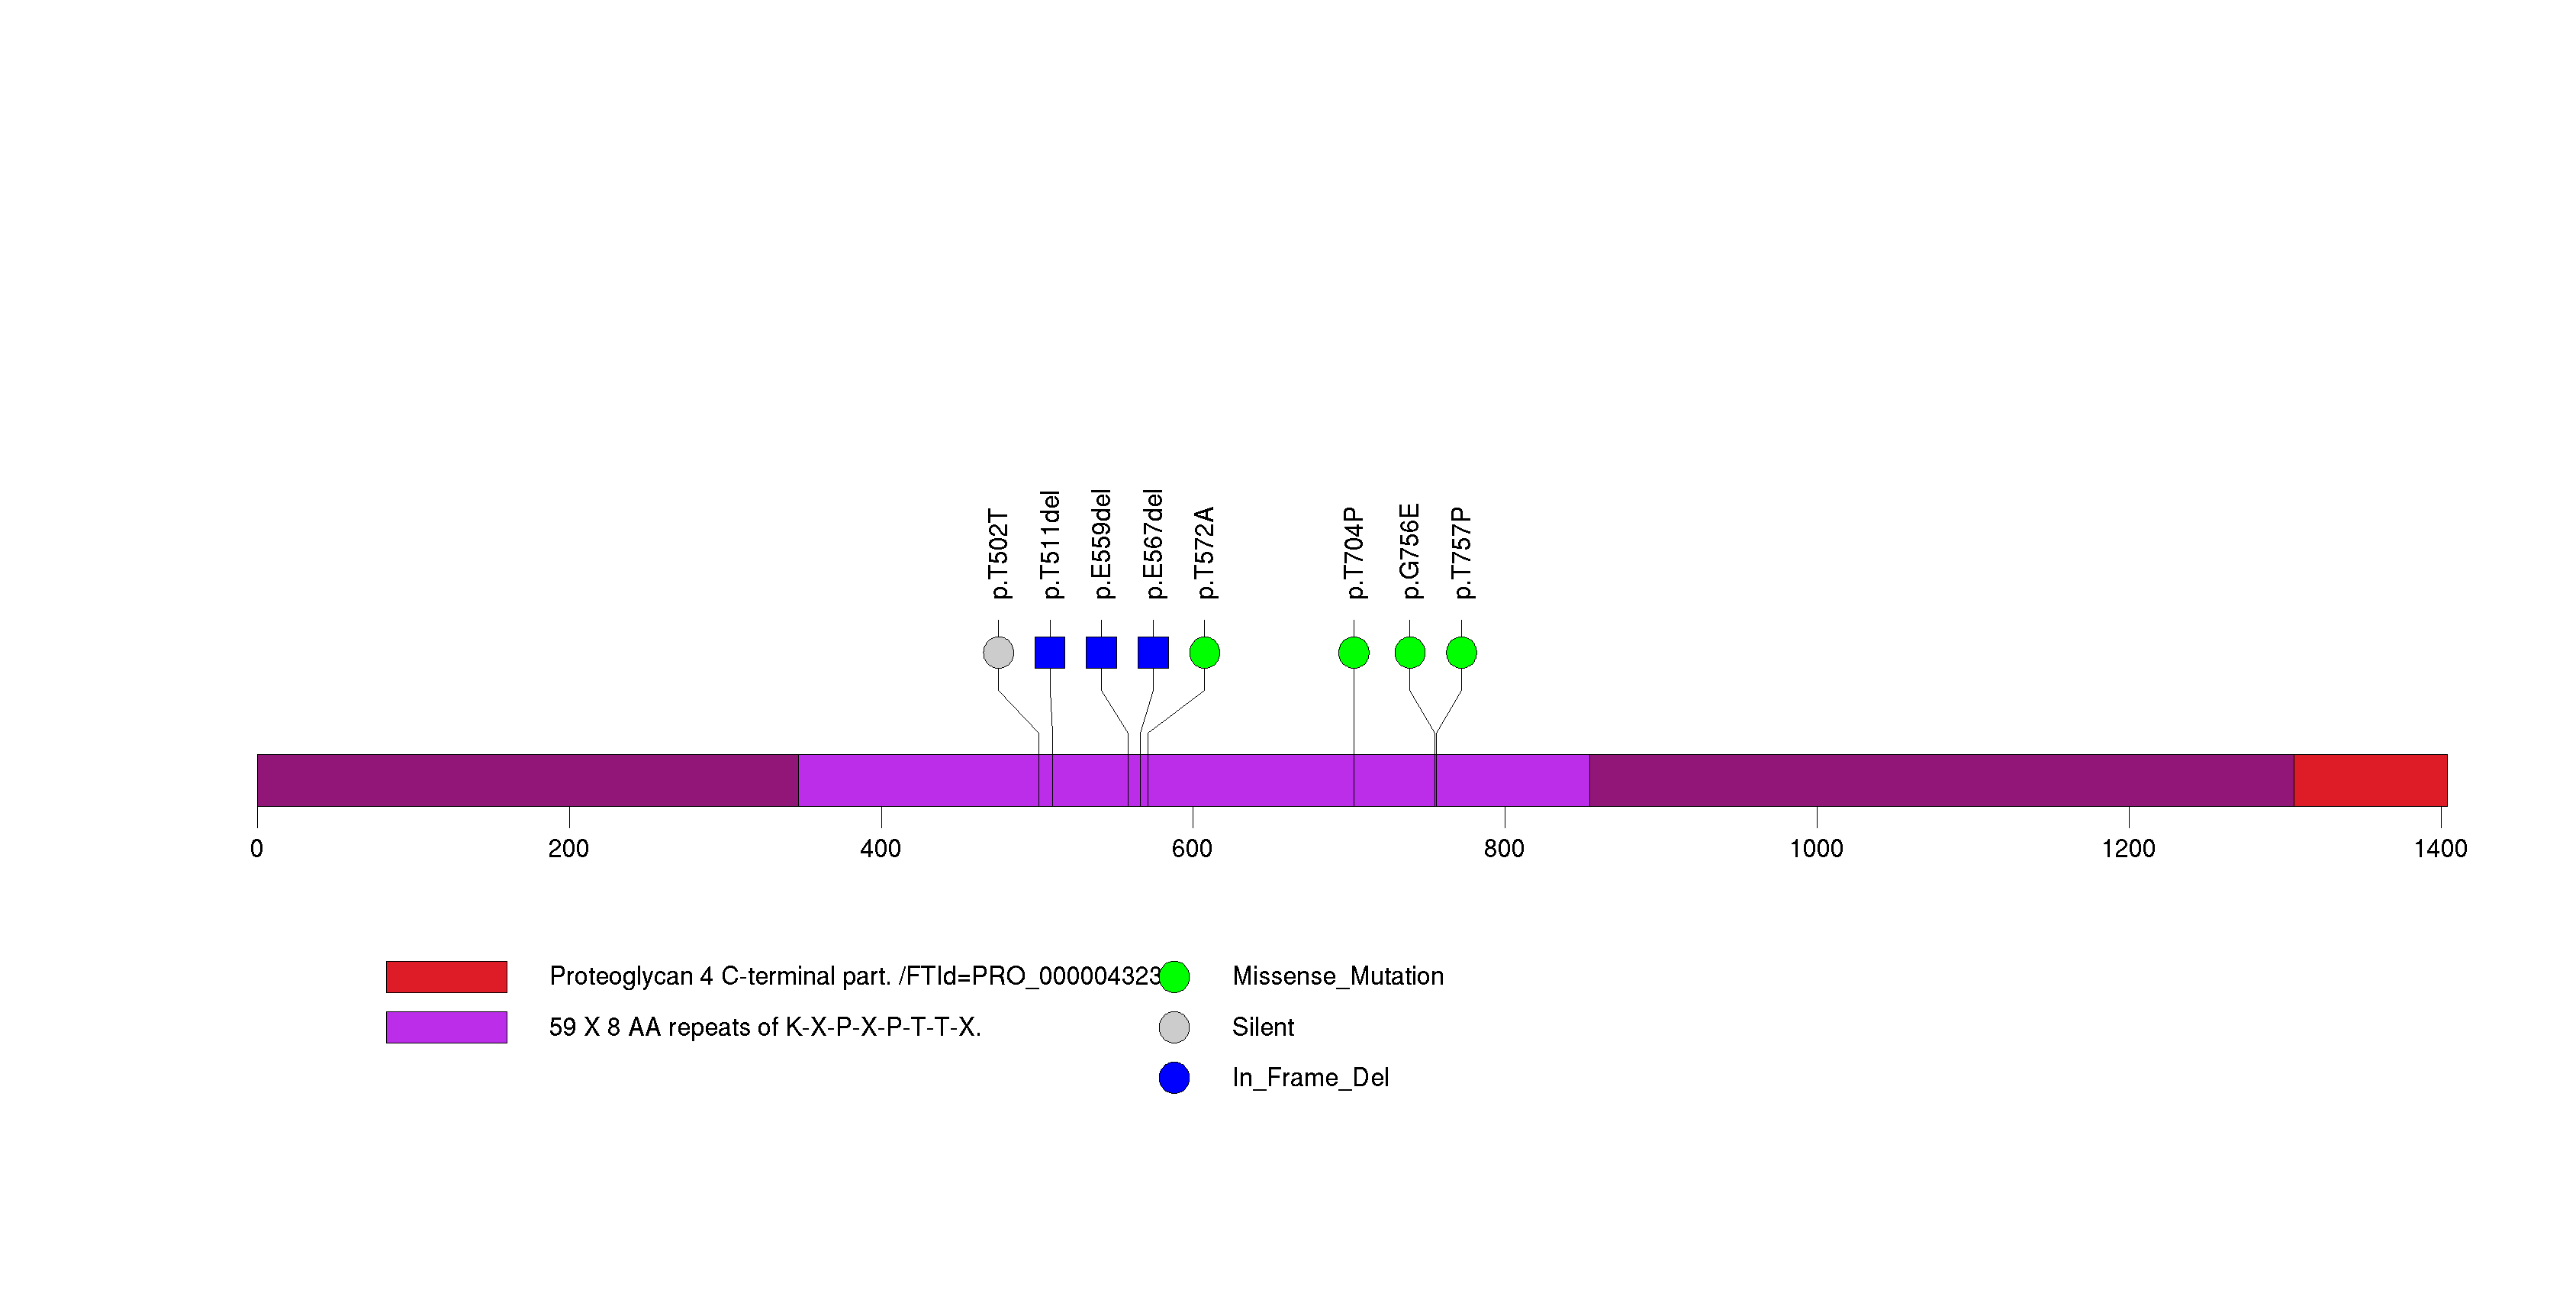
Figure S24. This figure depicts the distribution of mutations and mutation types across the KRAS significant gene.
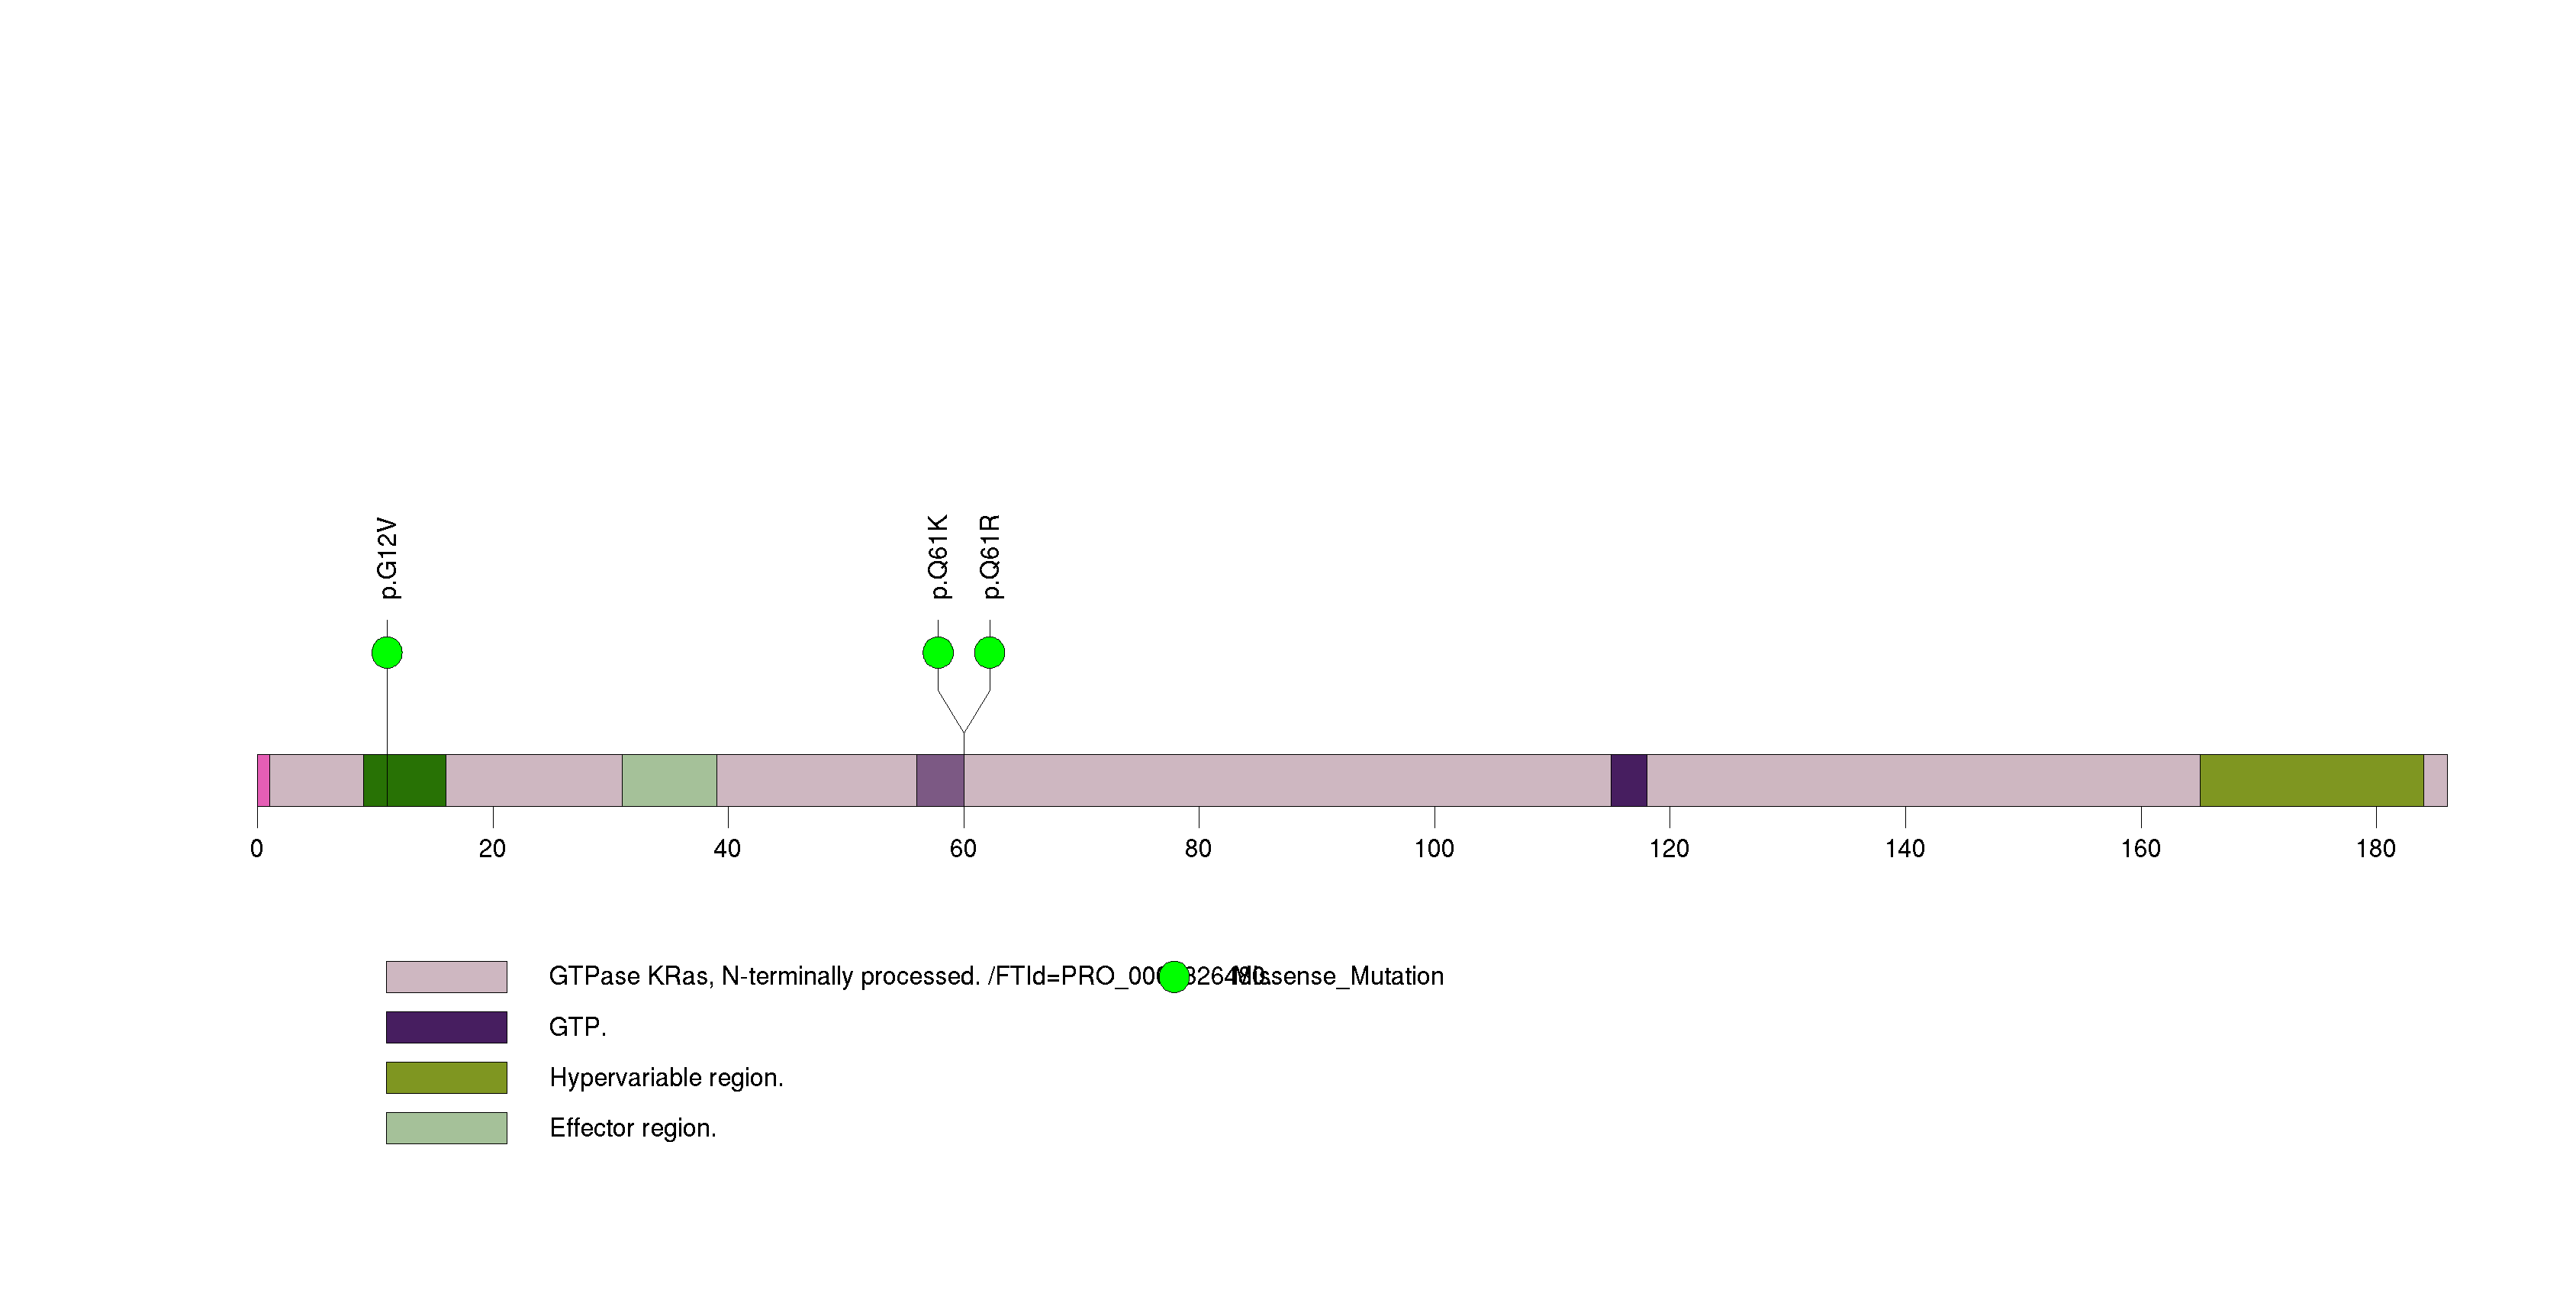
Figure S25. This figure depicts the distribution of mutations and mutation types across the CHEK2 significant gene.
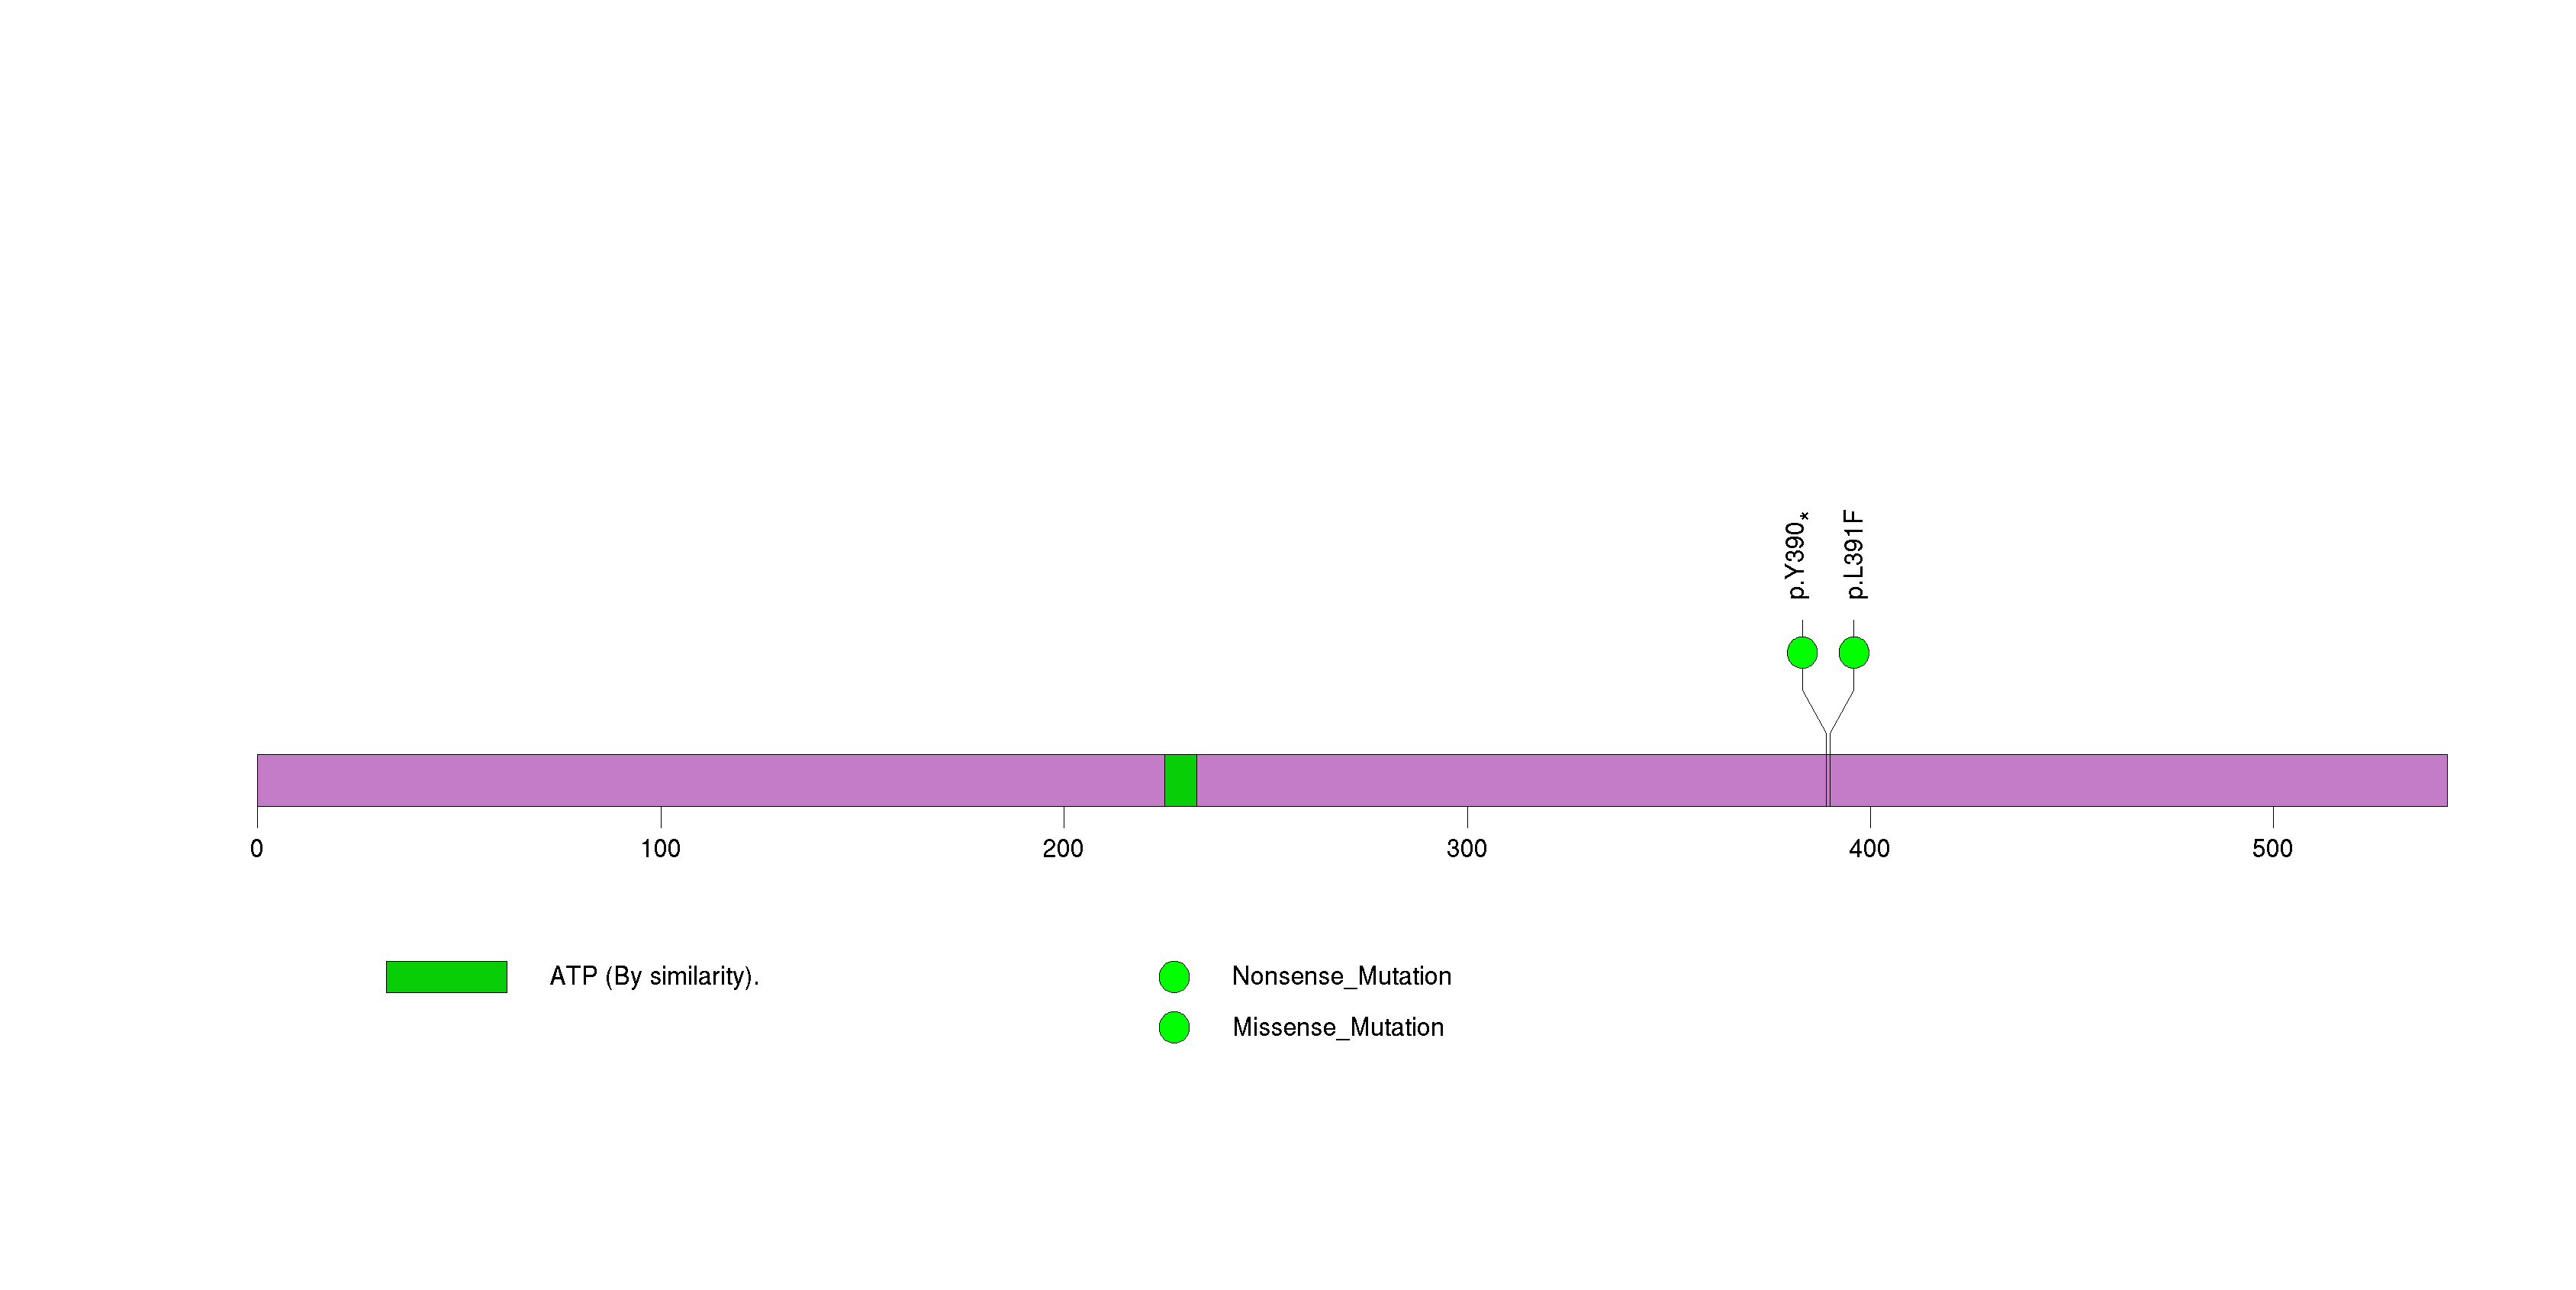
Figure S26. This figure depicts the distribution of mutations and mutation types across the KIAA0182 significant gene.
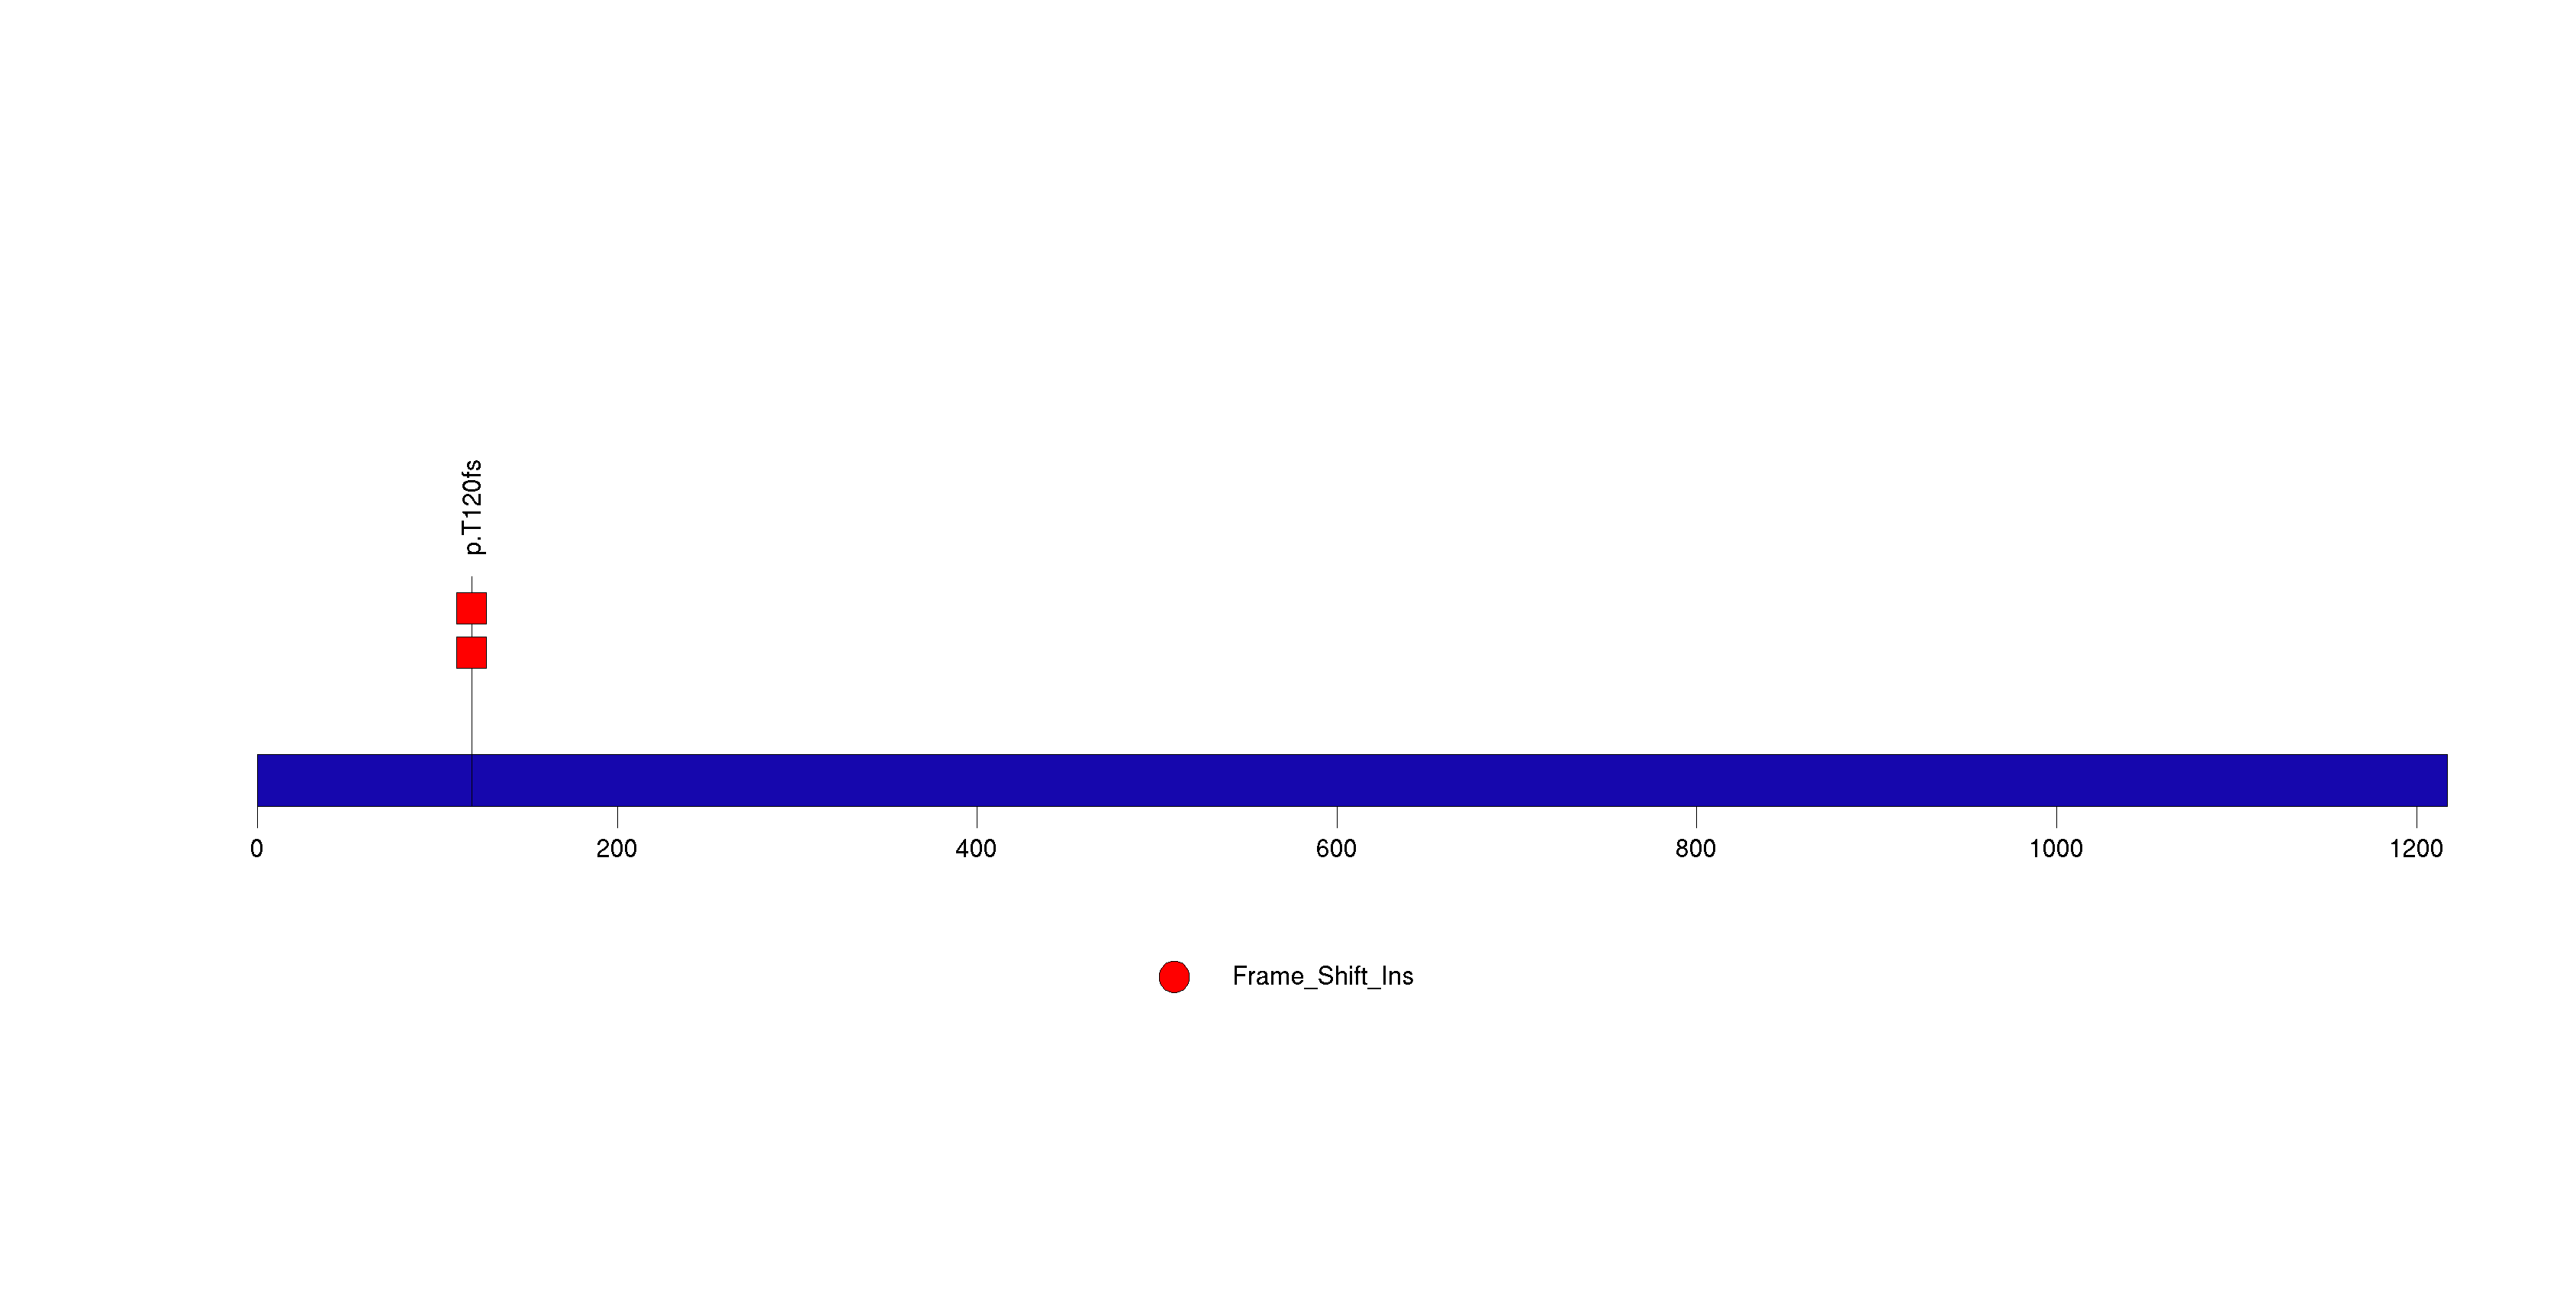
Figure S27. This figure depicts the distribution of mutations and mutation types across the LMX1B significant gene.
Figure S28. This figure depicts the distribution of mutations and mutation types across the GLI2 significant gene.
Figure S29. This figure depicts the distribution of mutations and mutation types across the POU4F2 significant gene.
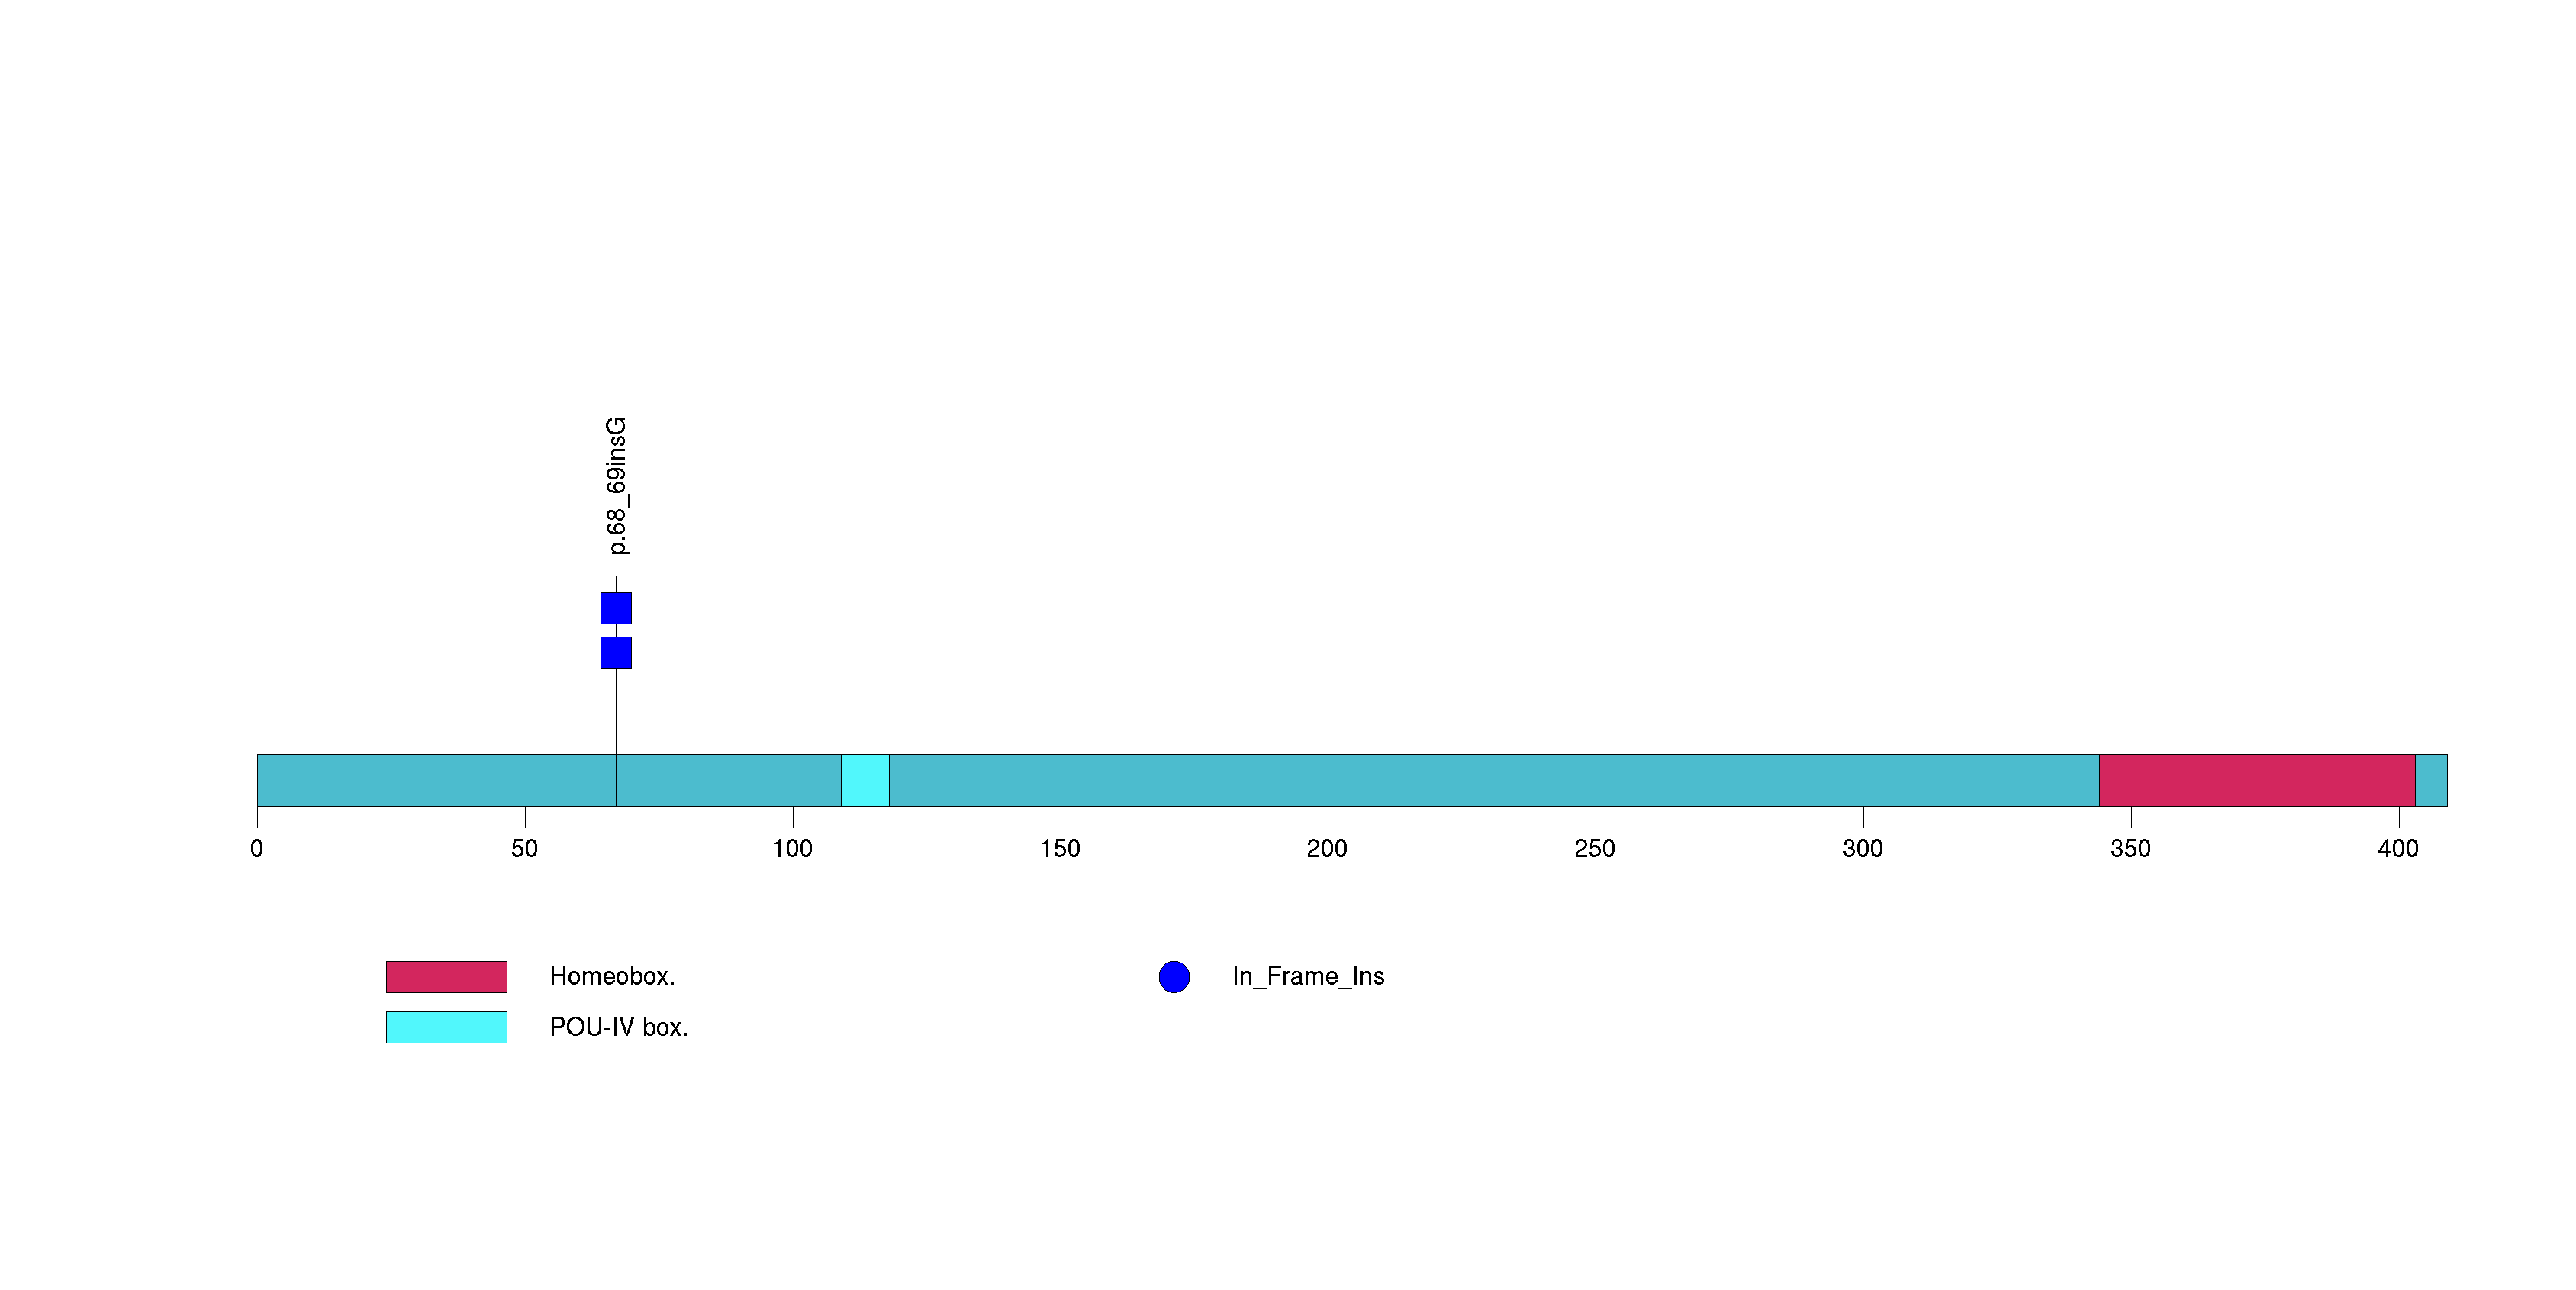
Figure S30. This figure depicts the distribution of mutations and mutation types across the ZNF704 significant gene.
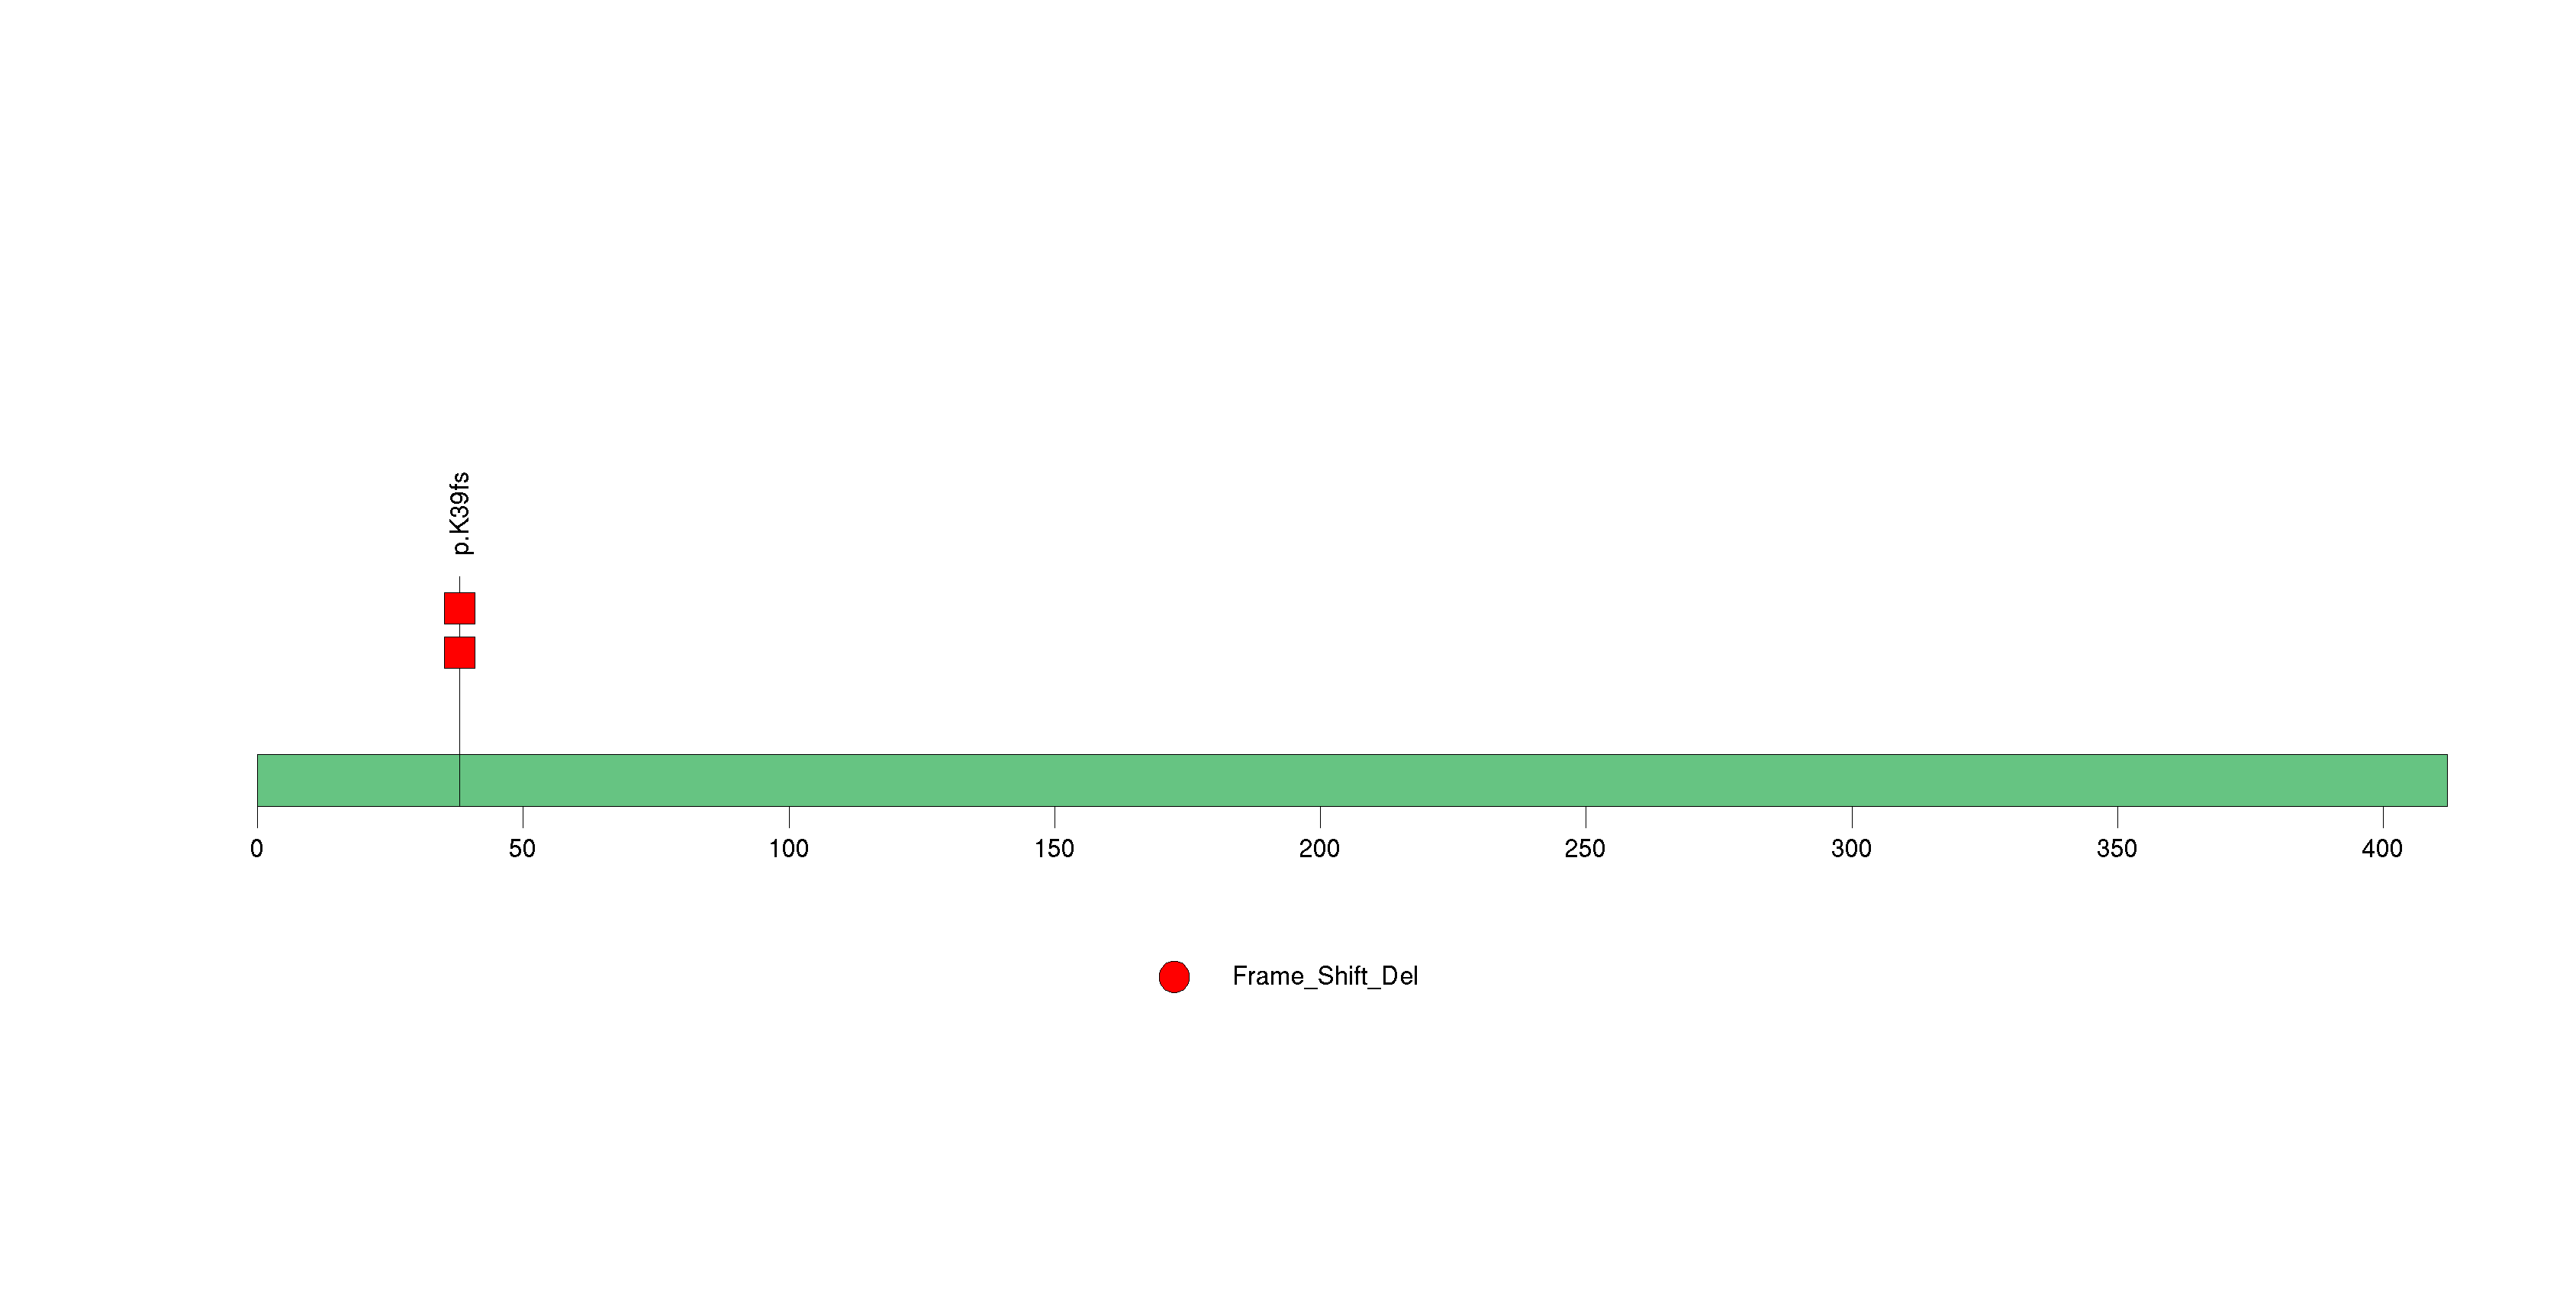
Figure S31. This figure depicts the distribution of mutations and mutation types across the TYSND1 significant gene.
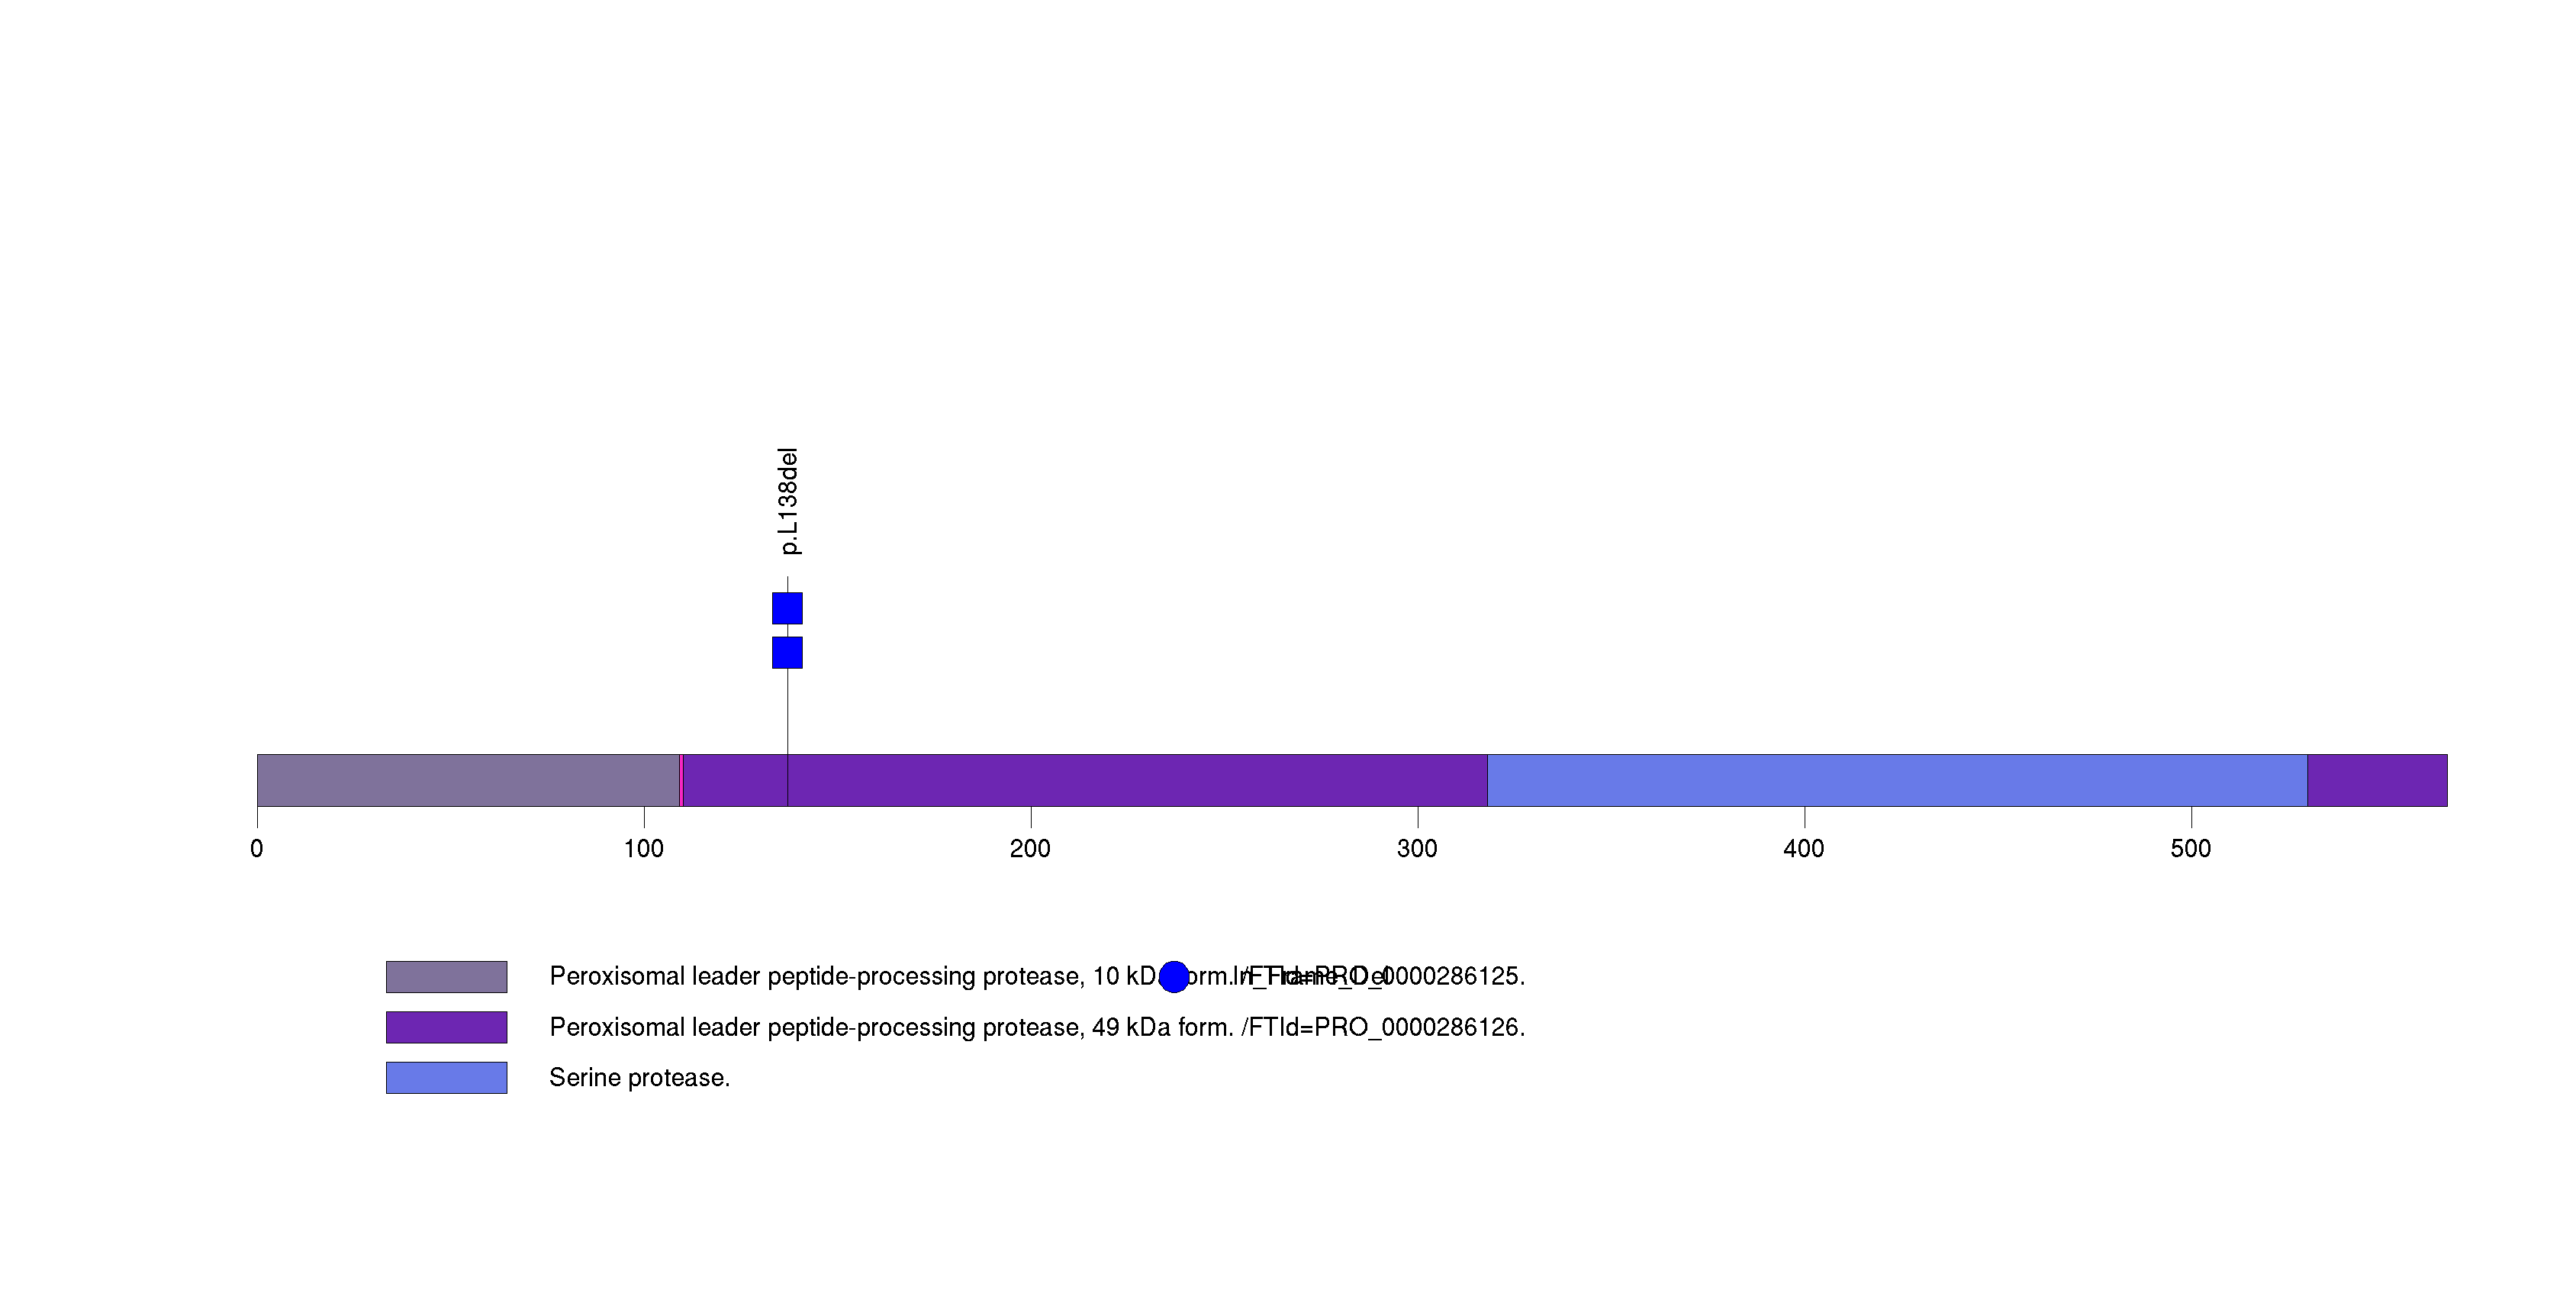
Figure S32. This figure depicts the distribution of mutations and mutation types across the DPYS significant gene.
Figure S33. This figure depicts the distribution of mutations and mutation types across the NLRP6 significant gene.
In this analysis, COSMIC is used as a filter to increase power by restricting the territory of each gene. Cosmic version: v48.
Table 4. Get Full Table Significantly mutated genes (COSMIC territory only). To access the database please go to: COSMIC. Number of significant genes found: 11. Number of genes displayed: 10
| rank | gene | description | n | cos | n_cos | N_cos | cos_ev | p | q |
|---|---|---|---|---|---|---|---|---|---|
| 1 | BRAF | v-raf murine sarcoma viral oncogene homolog B1 | 183 | 88 | 183 | 28424 | 1922790 | 0 | 0 |
| 2 | NRAS | neuroblastoma RAS viral (v-ras) oncogene homolog | 26 | 28 | 26 | 9044 | 33748 | 0 | 0 |
| 3 | HRAS | v-Ha-ras Harvey rat sarcoma viral oncogene homolog | 12 | 19 | 12 | 6137 | 2496 | 0 | 0 |
| 4 | KRAS | v-Ki-ras2 Kirsten rat sarcoma viral oncogene homolog | 3 | 51 | 3 | 16473 | 14910 | 1.1e-07 | 0.00012 |
| 5 | PIK3CA | phosphoinositide-3-kinase, catalytic, alpha polypeptide | 3 | 184 | 3 | 59432 | 51 | 5.1e-06 | 0.0046 |
| 6 | C4BPA | complement component 4 binding protein, alpha | 1 | 1 | 1 | 323 | 1 | 0.00017 | 0.07 |
| 7 | PCGF2 | polycomb group ring finger 2 | 2 | 1 | 1 | 323 | 1 | 0.00017 | 0.07 |
| 8 | SEZ6L | seizure related 6 homolog (mouse)-like | 2 | 1 | 1 | 323 | 1 | 0.00017 | 0.07 |
| 9 | SMC3 | structural maintenance of chromosomes 3 | 1 | 1 | 1 | 323 | 1 | 0.00017 | 0.07 |
| 10 | TNFRSF9 | tumor necrosis factor receptor superfamily, member 9 | 1 | 1 | 1 | 323 | 1 | 0.00017 | 0.07 |
Note:
n - number of (nonsilent) mutations in this gene across the individual set.
cos = number of unique mutated sites in this gene in COSMIC
n_cos = overlap between n and cos.
N_cos = number of individuals times cos.
cos_ev = total evidence: number of reports in COSMIC for mutations seen in this gene.
p = p-value for seeing the observed amount of overlap in this gene)
q = q-value, False Discovery Rate (Benjamini-Hochberg procedure)
Table 5. Get Full Table Genes with Clustered Mutations
| num | gene | desc | n | mindist | nmuts0 | nmuts3 | nmuts12 | npairs0 | npairs3 | npairs12 |
|---|---|---|---|---|---|---|---|---|---|---|
| 345 | BRAF | v-raf murine sarcoma viral oncogene homolog B1 | 183 | 0 | 16471 | 16653 | 16653 | 16471 | 16653 | 16653 |
| 2147 | NRAS | neuroblastoma RAS viral (v-ras) oncogene homolog | 26 | 0 | 325 | 325 | 325 | 325 | 325 | 325 |
| 1440 | HRAS | v-Ha-ras Harvey rat sarcoma viral oncogene homolog | 12 | 0 | 66 | 66 | 66 | 66 | 66 | 66 |
| 529 | CCDC15 | coiled-coil domain containing 15 | 5 | 0 | 10 | 10 | 10 | 10 | 10 | 10 |
| 3687 | ZNF799 | zinc finger protein 799 | 5 | 0 | 6 | 6 | 6 | 6 | 6 | 6 |
| 3696 | ZNF845 | zinc finger protein 845 | 6 | 0 | 6 | 6 | 6 | 6 | 6 | 6 |
| 991 | EIF1AX | eukaryotic translation initiation factor 1A, X-linked | 4 | 0 | 3 | 6 | 6 | 3 | 6 | 6 |
| 1098 | FAM47C | family with sequence similarity 47, member C | 5 | 0 | 3 | 3 | 3 | 3 | 3 | 3 |
| 3095 | SYNPO2L | synaptopodin 2-like | 3 | 0 | 3 | 3 | 3 | 3 | 3 | 3 |
| 3622 | ZNF443 | zinc finger protein 443 | 4 | 0 | 3 | 3 | 3 | 3 | 3 | 3 |
Note:
n - number of mutations in this gene in the individual set.
mindist - distance (in aa) between closest pair of mutations in this gene
npairs3 - how many pairs of mutations are within 3 aa of each other.
npairs12 - how many pairs of mutations are within 12 aa of each other.
Table 6. Get Full Table A Ranked List of Significantly Mutated Genesets. (Source: MSigDB GSEA Cannonical Pathway Set).Number of significant genesets found: 77. Number of genesets displayed: 10
| rank | geneset | description | genes | N_genes | mut_tally | N | n | npat | nsite | nsil | n1 | n2 | n3 | n4 | n5 | n6 | p_ns_s | p | q |
|---|---|---|---|---|---|---|---|---|---|---|---|---|---|---|---|---|---|---|---|
| 1 | HSA04730_LONG_TERM_DEPRESSION | Genes involved in long-term depression | ARAF, BRAF, C7orf16, CACNA1A, CRH, CRHR1, GNA11, GNA12, GNA13, GNAI1, GNAI2, GNAI3, GNAO1, GNAQ, GNAS, GNAZ, GRIA1, GRIA2, GRIA3, GRID2, GRM1, GRM5, GUCY1A2, GUCY1A3, GUCY1B3, GUCY2C, GUCY2D, GUCY2F, HRAS, IGF1, IGF1R, ITPR1, ITPR2, ITPR3, KRAS, LYN, MAP2K1, MAP2K2, MAPK1, MAPK3, NOS1, NOS2A, NOS3, NPR1, NPR2, NRAS, PLA2G10, PLA2G12A, PLA2G12B, PLA2G1B, PLA2G2A, PLA2G2D, PLA2G2E, PLA2G2F, PLA2G3, PLA2G4A, PLA2G5, PLA2G6, PLCB1, PLCB2, PLCB3, PLCB4, PPP2CA, PPP2CB, PPP2R1A, PPP2R1B, PPP2R2A, PPP2R2B, PPP2R2C, PRKCA, PRKCB1, PRKCG, PRKG1, PRKG2, RAF1, RYR1 | 74 | BRAF(183), CACNA1A(2), GNAS(3), GRIA1(1), GRIA2(2), GRM1(3), HRAS(12), IGF1R(1), ITPR1(2), ITPR2(4), KRAS(3), NPR1(1), NRAS(26), PLA2G5(1), PLCB2(1), PPP2R1A(2), PRKG1(1), RYR1(4) | 53048814 | 252 | 234 | 36 | 8 | 9 | 5 | 32 | 203 | 3 | 0 | 3.60e-14 | <1.00e-15 | <9.57e-14 |
| 2 | HSA04510_FOCAL_ADHESION | Genes involved in focal adhesion | ACTB, ACTG1, ACTN1, ACTN2, ACTN3, ACTN4, AKT1, AKT2, AKT3, ARHGAP5, BAD, BCAR1, BCL2, BIRC2, BIRC3, BIRC4, BRAF, CAPN2, CAV1, CAV2, CAV3, CCND1, CCND2, CCND3, CDC42, CHAD, COL11A1, COL11A2, COL1A1, COL1A2, COL2A1, COL3A1, COL4A1, COL4A2, COL4A4, COL4A6, COL5A1, COL5A2, COL5A3, COL6A1, COL6A2, COL6A3, COL6A6, COMP, CRK, CRKL, CTNNB1, DIAPH1, DOCK1, EGF, EGFR, ELK1, ERBB2, FARP2, FIGF, FLNA, FLNB, FLNC, FLT1, FN1, FYN, GRB2, GRLF1, GSK3B, HGF, HRAS, IBSP, IGF1, IGF1R, ILK, ITGA1, ITGA10, ITGA11, ITGA2, ITGA2B, ITGA3, ITGA4, ITGA5, ITGA6, ITGA7, ITGA8, ITGA9, ITGAV, ITGB1, ITGB3, ITGB4, ITGB5, ITGB6, ITGB7, ITGB8, JUN, KDR, LAMA1, LAMA2, LAMA3, LAMA4, LAMA5, LAMB1, LAMB2, LAMB3, LAMB4, LAMC1, LAMC2, LAMC3, LOC653852, MAP2K1, MAPK1, MAPK10, MAPK3, MAPK8, MAPK9, MET, MLCK, MRCL3, MRLC2, MYL2, MYL5, MYL7, MYL8P, MYL9, MYLC2PL, MYLK, MYLK2, MYLPF, PAK1, PAK2, PAK3, PAK4, PAK6, PAK7, PARVA, PARVB, PARVG, PDGFA, PDGFB, PDGFC, PDGFD, PDGFRA, PDGFRB, PDPK1, PGF, PIK3CA, PIK3CB, PIK3CD, PIK3CG, PIK3R1, PIK3R2, PIK3R3, PIK3R5, PIP5K1C, PPP1CA, PPP1CB, PPP1CC, PPP1R12A, PRKCA, PRKCB1, PRKCG, PTEN, PTK2, PXN, RAC1, RAC2, RAC3, RAF1, RAP1A, RAP1B, RAPGEF1, RELN, RHOA, ROCK1, ROCK2, SHC1, SHC2, SHC3, SHC4, SOS1, SOS2, SPP1, SRC, THBS1, THBS2, THBS3, THBS4, TLN1, TLN2, TNC, TNN, TNR, TNXB, VASP, VAV1, VAV2, VAV3, VCL, VEGFA, VEGFB, VEGFC, VTN, VWF, ZYX | 192 | ACTB(1), BRAF(183), CDC42(1), COL11A1(2), COL11A2(1), COL1A1(1), COL2A1(1), COL3A1(1), COL4A1(3), COL4A2(2), COL4A4(3), COL4A6(1), COL5A1(3), COL5A2(1), COL5A3(6), COL6A2(3), COL6A3(2), COL6A6(1), CTNNB1(2), ERBB2(1), FIGF(1), FLNA(1), FLNC(3), FN1(1), FYN(1), HRAS(12), IGF1R(1), ITGA10(1), ITGA3(2), ITGA8(1), ITGB1(2), ITGB3(1), ITGB4(1), ITGB8(1), JUN(1), KDR(1), LAMA2(1), LAMA3(2), LAMA4(3), LAMA5(1), LAMB1(1), LAMB2(1), LAMB4(1), LAMC1(2), LAMC2(1), LAMC3(1), MAPK10(1), MYLK(2), PAK3(1), PAK7(1), PDGFRB(1), PIK3CA(3), PIK3CB(1), PIK3CG(1), PIK3R1(1), PIK3R5(3), PTEN(2), RAPGEF1(1), RELN(1), SHC1(1), SOS1(1), SRC(1), THBS1(1), THBS2(1), THBS3(1), THBS4(1), TLN1(1), TLN2(2), TNC(1), TNN(1), TNR(3), TNXB(1), VAV2(1), VCL(1), VEGFA(1), VTN(1), VWF(1) | 178619783 | 304 | 226 | 112 | 35 | 18 | 22 | 21 | 221 | 21 | 1 | 1.76e-07 | <1.00e-15 | <9.57e-14 |
| 3 | ST_G_ALPHA_I_PATHWAY | Gi and Go proteins are members of the same family that transduce cellular signals through both their alpha and beta subunits. | AKT1, AKT2, AKT3, ASAH1, BF, BRAF, DAG1, DRD2, EGFR, EPHB2, GRB2, ITPKA, ITPKB, ITPR1, ITPR2, ITPR3, KCNJ3, KCNJ5, KCNJ9, MAPK1, PI3, PIK3CB, PITX2, PLCB1, PLCB2, PLCB3, PLCB4, RAF1, RAP1GA1, RGS20, SHC1, SOS1, SOS2, SRC, STAT3, TERF2IP | 34 | BRAF(183), ITPR1(2), ITPR2(4), PIK3CB(1), PITX2(1), PLCB2(1), SHC1(1), SOS1(1), SRC(1) | 28143487 | 195 | 188 | 14 | 3 | 6 | 2 | 1 | 186 | 0 | 0 | 1.17e-12 | <1.00e-15 | <9.57e-14 |
| 4 | ST_DIFFERENTIATION_PATHWAY_IN_PC12_CELLS | Rat-derived PC12 cells respond to nerve growth factor (NGF) and PACAP to differentiate into neuronal cells. | AKT1, ASAH1, ATF1, BRAF, CAMP, CREB1, CREB3, CREB5, CREBBP, CRKL, DAG1, EGR1, EGR2, EGR3, EGR4, ELK1, FRS2, GAS, GNAQ, GRF2, JUN, MAP1B, MAP2K4, MAP2K7, MAPK1, MAPK10, MAPK3, MAPK8, MAPK8IP1, MAPK8IP2, MAPK8IP3, MAPK9, NTRK1, OPN1LW, PACAP, PIK3C2G, PIK3CA, PIK3CD, PIK3R1, PTPN11, RPS6KA3, SH2B, SHC1, SRC, TERF2IP, TH, TUBA3 | 42 | BRAF(183), CREBBP(1), JUN(1), MAP1B(2), MAPK10(1), MAPK8IP2(1), PIK3C2G(1), PIK3CA(3), PIK3R1(1), SHC1(1), SRC(1) | 24780522 | 196 | 185 | 15 | 4 | 3 | 3 | 1 | 187 | 2 | 0 | 2.22e-12 | <1.00e-15 | <9.57e-14 |
| 5 | ST_ERK1_ERK2_MAPK_PATHWAY | The Erk1 and Erk2 MAP kinase pathways are regulated by Raf, Mos, and Tpl-2. | ARAF1, ATF1, BAD, BRAF, COPEB, CREB1, CREB3, CREB5, DUSP4, DUSP6, DUSP9, EEF2K, EIF4E, GRB2, HTATIP, MAP2K1, MAP2K2, MAP3K8, MAPK1, MAPK3, MKNK1, MKNK2, MOS, NFKB1, RAP1A, RPS6KA1, RPS6KA2, RPS6KA3, SHC1, SOS1, SOS2, TRAF3 | 29 | BRAF(183), EEF2K(1), MAP3K8(1), MKNK2(1), RPS6KA1(1), SHC1(1), SOS1(1) | 14219870 | 189 | 184 | 8 | 3 | 2 | 2 | 1 | 183 | 1 | 0 | 3.38e-12 | <1.00e-15 | <9.57e-14 |
| 6 | HSA04650_NATURAL_KILLER_CELL_MEDIATED_CYTOTOXICITY | Genes involved in natural killer cell mediated cytotoxicity | ARAF, BID, BRAF, CASP3, CD244, CD247, CD48, CHP, CSF2, FAS, FASLG, FCER1G, FCGR3A, FCGR3B, FYN, GRB2, GZMB, HCST, HLA-A, HLA-B, HLA-C, HLA-E, HLA-G, HRAS, ICAM1, ICAM2, IFNA1, IFNA10, IFNA13, IFNA14, IFNA16, IFNA17, IFNA2, IFNA21, IFNA4, IFNA5, IFNA6, IFNA7, IFNA8, IFNAR1, IFNAR2, IFNB1, IFNG, IFNGR1, IFNGR2, ITGAL, ITGB2, KIR2DL1, KIR2DL2, KIR2DL3, KIR2DL4, KIR2DL5A, KIR2DS1, KIR2DS2, KIR3DL1, KIR3DL2, KLRC1, KLRC2, KLRC3, KLRD1, KLRK1, KRAS, LAT, LCK, LCP2, LOC652578, MAP2K1, MAP2K2, MAPK1, MAPK3, MICA, MICB, NCR1, NCR2, NCR3, NFAT5, NFATC1, NFATC2, NFATC3, NFATC4, NRAS, PAK1, PIK3CA, PIK3CB, PIK3CD, PIK3CG, PIK3R1, PIK3R2, PIK3R3, PIK3R5, PLCG1, PLCG2, PPP3CA, PPP3CB, PPP3CC, PPP3R1, PPP3R2, PRF1, PRKCA, PRKCB1, PRKCG, PTK2B, PTPN11, PTPN6, RAC1, RAC2, RAC3, RAF1, SH2D1A, SH2D1B, SH3BP2, SHC1, SHC2, SHC3, SHC4, SOS1, SOS2, SYK, TNF, TNFRSF10A, TNFRSF10B, TNFRSF10C, TNFRSF10D, TNFSF10, TYROBP, ULBP1, ULBP2, ULBP3, VAV1, VAV2, VAV3, ZAP70 | 126 | BRAF(183), FYN(1), HLA-E(1), HRAS(12), IFNA4(1), IFNAR2(1), IFNGR1(2), ITGAL(4), KIR2DL1(1), KIR3DL1(2), KRAS(3), LCK(1), NCR1(1), NFAT5(1), NFATC1(2), NFATC4(2), NRAS(26), PIK3CA(3), PIK3CB(1), PIK3CG(1), PIK3R1(1), PIK3R5(3), PLCG2(1), PPP3R2(1), PTK2B(1), SHC1(1), SOS1(1), SYK(1), VAV2(1) | 54658054 | 260 | 231 | 45 | 13 | 7 | 7 | 35 | 205 | 6 | 0 | 1.44e-12 | 1.11e-15 | 9.57e-14 |
| 7 | MAPKPATHWAY | The mitogen-activated protein (MAP) kinase pathway is a common signaling mechanism and has four main sub-pathways: Erk, JNK/SAPK, p53, and ERK5. | ARAF1, ATF2, BRAF, CEBPA, CHUK, CREB1, DAXX, ELK1, FOS, GRB2, HRAS, IKBKB, JUN, MAP2K1, MAP2K2, MAP2K3, MAP2K4, MAP2K5, MAP2K6, MAP2K7, MAP3K1, MAP3K10, MAP3K11, MAP3K12, MAP3K13, MAP3K14, MAP3K2, MAP3K3, MAP3K4, MAP3K5, MAP3K6, MAP3K7, MAP3K8, MAP3K9, MAP4K1, MAP4K2, MAP4K3, MAP4K4, MAP4K5, MAPK1, MAPK10, MAPK11, MAPK12, MAPK13, MAPK14, MAPK3, MAPK4, MAPK6, MAPK7, MAPK8, MAPK9, MAPKAPK2, MAPKAPK3, MAPKAPK5, MAX, MEF2A, MEF2B, MEF2C, MEF2D, MKNK1, MKNK2, MYC, NFKB1, NFKBIA, PAK1, PAK2, PDZGEF1, RAC1, RAF1, RELA, RIPK1, RPS6KA1, RPS6KA2, RPS6KA3, RPS6KA4, RPS6KA5, RPS6KB1, RPS6KB2, SHC1, SP1, STAT1, TGFB1, TGFB2, TGFB3, TGFBR1, TRADD, TRAF2 | 84 | BRAF(183), HRAS(12), JUN(1), MAP2K5(1), MAP2K6(1), MAP3K1(1), MAP3K3(4), MAP3K6(1), MAP3K8(1), MAP4K4(1), MAPK10(1), MAPK4(1), MAPKAPK3(1), MEF2B(1), MKNK2(1), MYC(1), RPS6KA1(1), RPS6KB2(1), SHC1(1), SP1(1), STAT1(1), TGFB1(1) | 45848909 | 218 | 202 | 27 | 4 | 6 | 4 | 12 | 192 | 4 | 0 | 1.13e-14 | 1.33e-15 | 9.57e-14 |
| 8 | HSA04150_MTOR_SIGNALING_PATHWAY | Genes involved in mTOR signaling pathway | AKT1, AKT2, AKT3, BRAF, CAB39, DDIT4, EIF4B, EIF4EBP1, FIGF, FRAP1, GBL, HIF1A, IGF1, INS, KIAA1303, LYK5, MAPK1, MAPK3, PDPK1, PGF, PIK3CA, PIK3CB, PIK3CD, PIK3CG, PIK3R1, PIK3R2, PIK3R3, PIK3R5, PRKAA1, PRKAA2, RHEB, RICTOR, RPS6, RPS6KA1, RPS6KA2, RPS6KA3, RPS6KA6, RPS6KB1, RPS6KB2, STK11, TSC1, TSC2, ULK1, ULK2, ULK3, VEGFA, VEGFB, VEGFC | 44 | BRAF(183), FIGF(1), PIK3CA(3), PIK3CB(1), PIK3CG(1), PIK3R1(1), PIK3R5(3), RPS6KA1(1), RPS6KB2(1), ULK3(1), VEGFA(1) | 25626228 | 197 | 186 | 16 | 4 | 1 | 2 | 3 | 187 | 4 | 0 | 1.50e-11 | 1.44e-15 | 9.57e-14 |
| 9 | ST_INTEGRIN_SIGNALING_PATHWAY | Integrins are transmembrane receptors that mediate cell growth, survival, and migration by binding to ligands in the extracellular matrix. | ABL1, ACK1, ACTN1, ACTR2, ACTR3, AKT1, AKT2, AKT3, ANGPTL2, ARHGEF6, ARHGEF7, BCAR1, BRAF, CAV1, CDC42, CDKN2A, CRK, CSE1L, DDEF1, DOCK1, EPHB2, FYN, GRAF, GRB2, GRB7, GRF2, GRLF1, ILK, ITGA1, ITGA10, ITGA11, ITGA2, ITGA3, ITGA4, ITGA5, ITGA6, ITGA7, ITGA8, ITGA9, ITGB3BP, MAP2K4, MAP2K7, MAP3K11, MAPK1, MAPK10, MAPK8, MAPK8IP1, MAPK8IP2, MAPK8IP3, MAPK9, MRAS, MYLK, MYLK2, P4HB, PAK1, PAK2, PAK3, PAK4, PAK6, PAK7, PIK3CA, PIK3CB, PKLR, PLCG1, PLCG2, PTEN, PTK2, RAF1, RALA, RHO, ROCK1, ROCK2, SHC1, SOS1, SOS2, SRC, TERF2IP, TLN1, TLN2, VASP, WAS, ZYX | 78 | ABL1(1), ANGPTL2(1), ARHGEF6(1), ARHGEF7(2), BRAF(183), CDC42(1), FYN(1), GRB7(1), ITGA10(1), ITGA3(2), ITGA8(1), MAPK10(1), MAPK8IP2(1), MYLK(2), PAK3(1), PAK7(1), PIK3CA(3), PIK3CB(1), PLCG2(1), PTEN(2), SHC1(1), SOS1(1), SRC(1), TLN1(1), TLN2(2) | 58950476 | 214 | 193 | 33 | 13 | 9 | 5 | 2 | 194 | 3 | 1 | 2.79e-08 | 1.55e-15 | 9.57e-14 |
| 10 | ST_G_ALPHA_S_PATHWAY | The G-alpha-s protein activates adenylyl cyclases, which catalyze cAMP formation. | ASAH1, BF, BFAR, BRAF, CAMP, CREB1, CREB3, CREB5, EPAC, GAS, GRF2, MAPK1, RAF1, SNX13, SRC, TERF2IP | 12 | BFAR(1), BRAF(183), SNX13(1), SRC(1) | 5335473 | 186 | 183 | 5 | 2 | 0 | 0 | 1 | 183 | 2 | 0 | 2.63e-12 | 1.55e-15 | 9.57e-14 |
Table 7. Get Full Table A Ranked List of Significantly Mutated Genesets (Excluding Significantly Mutated Genes). Number of significant genesets found: 0. Number of genesets displayed: 10
| rank | geneset | description | genes | N_genes | mut_tally | N | n | npat | nsite | nsil | n1 | n2 | n3 | n4 | n5 | n6 | p_ns_s | p | q |
|---|---|---|---|---|---|---|---|---|---|---|---|---|---|---|---|---|---|---|---|
| 1 | ATMPATHWAY | The tumor-suppressing protein kinase ATM responds to radiation-induced DNA damage by blocking cell-cycle progression and activating DNA repair. | ABL1, ATM, BRCA1, CDKN1A, CHEK1, CHEK2, GADD45A, JUN, MAPK8, MDM2, MRE11A, NBS1, NFKB1, NFKBIA, RAD50, RAD51, RBBP8, RELA, TP53, TP73 | 18 | ABL1(1), ATM(5), BRCA1(1), CHEK1(1), JUN(1), RAD51(1), RBBP8(1), TP53(3), TP73(3) | 13810530 | 17 | 16 | 17 | 0 | 1 | 6 | 2 | 2 | 6 | 0 | 0.0098 | 0.001 | 0.63 |
| 2 | ARFPATHWAY | Cyclin-dependent kinase inhibitor 2A is a tumor suppressor that induces G1 arrest and can activate the p53 pathway, leading to G2/M arrest. | ABL1, CDKN2A, E2F1, MDM2, MYC, PIK3CA, PIK3R1, POLR1A, POLR1B, POLR1C, POLR1D, RAC1, RB1, TBX2, TP53, TWIST1 | 16 | ABL1(1), MYC(1), PIK3CA(3), PIK3R1(1), POLR1A(1), POLR1B(2), TP53(3), TWIST1(1) | 9760763 | 13 | 13 | 13 | 0 | 1 | 2 | 1 | 2 | 7 | 0 | 0.032 | 0.0021 | 0.65 |
| 3 | PLK3PATHWAY | Active Plk3 phosphorylates CDC25c, blocking the G2/M transition, and phosphorylates p53 to induce apoptosis. | ATM, ATR, CDC25C, CHEK1, CHEK2, CNK, TP53, YWHAH | 6 | ATM(5), ATR(1), CHEK1(1), TP53(3) | 7161679 | 10 | 10 | 10 | 1 | 0 | 1 | 1 | 2 | 6 | 0 | 0.34 | 0.0037 | 0.76 |
| 4 | HSA00760_NICOTINATE_AND_NICOTINAMIDE_METABOLISM | Genes involved in nicotinate and nicotinamide metabolism | AOX1, BST1, C9orf95, CD38, ENPP1, ENPP3, NADK, NADSYN1, NMNAT1, NMNAT2, NMNAT3, NNMT, NNT, NP, NT5C, NT5C1A, NT5C1B, NT5C2, NT5C3, NT5E, NT5M, NUDT12, PBEF1, QPRT | 22 | AOX1(1), C9orf95(1), CD38(1), ENPP1(2), NADK(1), NADSYN1(1), NNT(1), NT5C3(1), NT5E(1), NUDT12(1), QPRT(1) | 10362895 | 12 | 11 | 12 | 1 | 4 | 2 | 4 | 1 | 1 | 0 | 0.069 | 0.0074 | 0.82 |
| 5 | TERTPATHWAY | hTERC, the RNA subunit of telomerase, and hTERT, the catalytic protein subunit, are required for telomerase activity and are overexpressed in many cancers. | HDAC1, MAX, MYC, SP1, SP3, TP53, WT1, ZNF42 | 7 | MYC(1), SP1(1), TP53(3), WT1(1) | 3398513 | 6 | 6 | 6 | 0 | 0 | 0 | 2 | 1 | 3 | 0 | 0.16 | 0.0075 | 0.82 |
| 6 | METHIONINE_METABOLISM | AHCY, BHMT, CBS, CTH, DNMT1, DNMT2, DNMT3A, DNMT3B, MARS, MARS2, MAT1A, MAT2B, MTR | 12 | DNMT1(1), DNMT3A(5), MARS(1), MARS2(1), MAT1A(1), MTR(1) | 8369673 | 10 | 10 | 10 | 0 | 3 | 1 | 0 | 2 | 4 | 0 | 0.047 | 0.0087 | 0.82 | |
| 7 | CTLA4PATHWAY | T cell activation requires interaction with an antigen-MHC-I complex on an antigen-presenting cell (APC), as well as CD28 interaction with the APC's CD80 or 86. | CD28, CD3D, CD3E, CD3G, CD3Z, CD80, CD86, CTLA4, GRB2, HLA-DRA, HLA-DRB1, ICOS, ICOSL, IL2, ITK, LCK, PIK3CA, PIK3R1, PTPN11, TRA@, TRB@ | 17 | CD28(1), CD3D(1), HLA-DRA(1), LCK(1), PIK3CA(3), PIK3R1(1) | 6150701 | 8 | 8 | 8 | 0 | 2 | 1 | 2 | 2 | 1 | 0 | 0.12 | 0.01 | 0.82 |
| 8 | HSA00271_METHIONINE_METABOLISM | Genes involved in methionine metabolism | AHCY, AMD1, BHMT, CBS, CTH, DNMT1, DNMT3A, DNMT3B, KIAA0828, MARS, MARS2, MAT1A, MAT2B, MTAP, MTFMT, MTR, SRM, TAT | 17 | DNMT1(1), DNMT3A(5), MARS(1), MARS2(1), MAT1A(1), MTR(1), TAT(1) | 9989059 | 11 | 11 | 11 | 0 | 3 | 1 | 0 | 2 | 5 | 0 | 0.048 | 0.011 | 0.82 |
| 9 | TCRAPATHWAY | The kinases Lck and Fyn phosphorylate and activate the T cell receptor, which recognizes antigen-bound MHCII and leads to T cell activation. | CD3D, CD3E, CD3G, CD3Z, CD4, FYN, HLA-DRA, HLA-DRB1, LCK, PTPRC, TRA@, TRB@, ZAP70 | 10 | CD3D(1), CD4(1), FYN(1), HLA-DRA(1), LCK(1), PTPRC(1) | 4309898 | 6 | 6 | 6 | 0 | 4 | 0 | 1 | 0 | 1 | 0 | 0.15 | 0.015 | 0.88 |
| 10 | P53PATHWAY | p53 induces cell cycle arrest or apoptosis under conditions of DNA damage. | APAF1, ATM, BAX, BCL2, CCND1, CCNE1, CDK2, CDK4, CDKN1A, E2F1, GADD45A, MDM2, PCNA, RB1, TIMP3, TP53 | 16 | APAF1(2), ATM(5), TP53(3) | 8702713 | 10 | 10 | 10 | 0 | 0 | 1 | 1 | 2 | 6 | 0 | 0.14 | 0.015 | 0.88 |
In brief, we tabulate the number of mutations and the number of covered bases for each gene. The counts are broken down by mutation context category: four context categories that are discovered by MutSig, and one for indel and 'null' mutations, which include indels, nonsense mutations, splice-site mutations, and non-stop (read-through) mutations. For each gene, we calculate the probability of seeing the observed constellation of mutations, i.e. the product P1 x P2 x ... x Pm, or a more extreme one, given the background mutation rates calculated across the dataset. [1]
This is an experimental feature. The full results of the analysis summarized in this report can be downloaded from the TCGA Data Coordination Center.