(primary solid tumor cohort)
This pipeline computes the correlation between significant copy number variation (cnv focal) genes and selected clinical features.
Testing the association between copy number variation 24 arm-level results and 15 clinical features across 303 patients, 15 significant findings detected with Q value < 0.25.
-
Del Peak 2(2p22.3) cnv correlated to 'NUMBER.OF.LYMPH.NODES' and 'NEOPLASM.DISEASESTAGE'.
-
Del Peak 3(2q35) cnv correlated to 'HISTOLOGICAL.TYPE', 'NUMBER.OF.LYMPH.NODES', and 'NEOPLASM.DISEASESTAGE'.
-
Del Peak 10(8q24.22) cnv correlated to 'NUMBER.OF.LYMPH.NODES'.
-
Del Peak 11(9p21.3) cnv correlated to 'NEOPLASM.DISEASESTAGE'.
-
Del Peak 12(9q22.32) cnv correlated to 'NEOPLASM.DISEASESTAGE'.
-
Del Peak 15(11p15.1) cnv correlated to 'NUMBER.OF.LYMPH.NODES'.
-
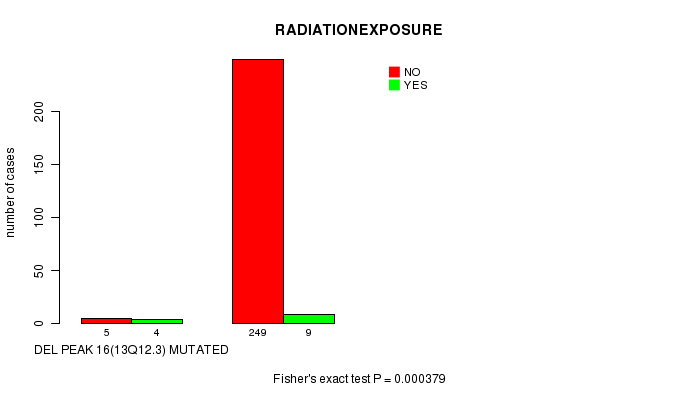
Del Peak 16(13q12.3) cnv correlated to 'RADIATIONEXPOSURE'.
-
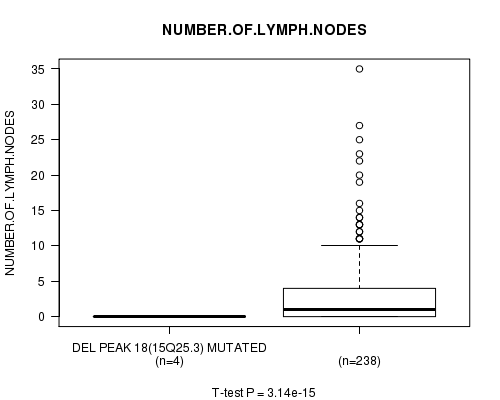
Del Peak 18(15q25.3) cnv correlated to 'NUMBER.OF.LYMPH.NODES'.
-
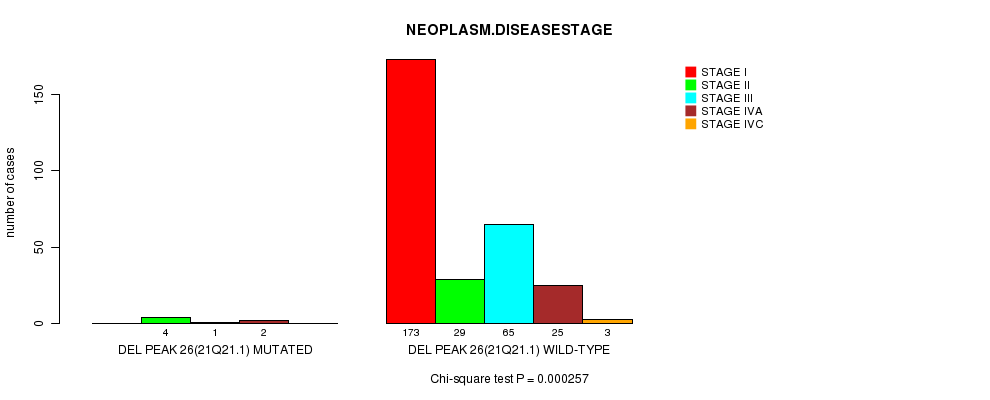
Del Peak 26(21q21.1) cnv correlated to 'NEOPLASM.DISEASESTAGE'.
-
Del Peak 30(Xq22.1) cnv correlated to 'NEOPLASM.DISEASESTAGE'.
-
Del Peak 31(Xq22.3) cnv correlated to 'NUMBER.OF.LYMPH.NODES' and 'NEOPLASM.DISEASESTAGE'.
Table 1. Get Full Table Overview of the association between significant copy number variation of 24 arm-level results and 15 clinical features. Shown in the table are P values (Q values). Thresholded by Q value < 0.25, 15 significant findings detected.
|
Clinical Features |
Time to Death |
AGE | GENDER |
HISTOLOGICAL TYPE |
RADIATIONS RADIATION REGIMENINDICATION |
RADIATIONEXPOSURE |
DISTANT METASTASIS |
EXTRATHYROIDAL EXTENSION |
LYMPH NODE METASTASIS |
COMPLETENESS OF RESECTION |
NUMBER OF LYMPH NODES |
TUMOR STAGECODE |
NEOPLASM DISEASESTAGE |
MULTIFOCALITY |
TUMOR SIZE |
||
| nCNV (%) | nWild-Type | logrank test | t-test | Fisher's exact test | Fisher's exact test | Fisher's exact test | Fisher's exact test | Fisher's exact test | Fisher's exact test | Chi-square test | Fisher's exact test | t-test | t-test | Chi-square test | Fisher's exact test | t-test | |
| Del Peak 3(2q35) | 8 (3%) | 295 |
1 (1.00) |
0.0119 (1.00) |
0.684 (1.00) |
0.000425 (0.137) |
1 (1.00) |
1 (1.00) |
0.361 (1.00) |
0.734 (1.00) |
0.18 (1.00) |
0.174 (1.00) |
3.02e-15 (1e-12) |
9.03e-05 (0.0293) |
1 (1.00) |
0.135 (1.00) |
|
| Del Peak 2(2p22 3) | 9 (3%) | 294 |
1 (1.00) |
0.152 (1.00) |
0.458 (1.00) |
0.0215 (1.00) |
1 (1.00) |
1 (1.00) |
0.273 (1.00) |
0.273 (1.00) |
0.144 (1.00) |
0.585 (1.00) |
2.97e-15 (9.88e-13) |
0.000702 (0.224) |
0.747 (1.00) |
0.864 (1.00) |
|
| Del Peak 31(Xq22 3) | 4 (1%) | 299 |
1 (1.00) |
0.0625 (1.00) |
0.0501 (1.00) |
0.205 (1.00) |
1 (1.00) |
0.14 (1.00) |
0.17 (1.00) |
0.61 (1.00) |
0.374 (1.00) |
0.292 (1.00) |
3.14e-15 (1.04e-12) |
1.17e-06 (0.000383) |
1 (1.00) |
0.387 (1.00) |
|
| Del Peak 10(8q24 22) | 5 (2%) | 298 |
1 (1.00) |
0.0552 (1.00) |
0.103 (1.00) |
0.0333 (1.00) |
1 (1.00) |
1 (1.00) |
0.692 (1.00) |
1 (1.00) |
0.468 (1.00) |
0.359 (1.00) |
3.19e-15 (1.05e-12) |
0.00396 (1.00) |
0.681 (1.00) |
0.158 (1.00) |
|
| Del Peak 11(9p21 3) | 7 (2%) | 296 |
1 (1.00) |
0.0379 (1.00) |
0.684 (1.00) |
0.626 (1.00) |
1 (1.00) |
1 (1.00) |
0.502 (1.00) |
0.311 (1.00) |
0.323 (1.00) |
0.289 (1.00) |
0.00285 (0.904) |
1.14e-05 (0.00373) |
0.277 (1.00) |
0.211 (1.00) |
|
| Del Peak 12(9q22 32) | 10 (3%) | 293 |
1 (1.00) |
0.121 (1.00) |
1 (1.00) |
0.237 (1.00) |
0.381 (1.00) |
0.366 (1.00) |
0.221 (1.00) |
0.563 (1.00) |
0.0953 (1.00) |
0.63 (1.00) |
0.366 (1.00) |
6.48e-05 (0.0211) |
1 (1.00) |
0.967 (1.00) |
|
| Del Peak 15(11p15 1) | 4 (1%) | 299 |
0.00468 (1.00) |
0.0307 (1.00) |
0.262 (1.00) |
0.171 (1.00) |
0.173 (1.00) |
1 (1.00) |
0.17 (1.00) |
0.61 (1.00) |
0.374 (1.00) |
0.292 (1.00) |
3.14e-15 (1.04e-12) |
0.502 (1.00) |
0.623 (1.00) |
0.204 (1.00) |
|
| Del Peak 16(13q12 3) | 10 (3%) | 293 |
0.00468 (1.00) |
0.0126 (1.00) |
0.129 (1.00) |
0.143 (1.00) |
0.381 (1.00) |
0.000379 (0.122) |
0.221 (1.00) |
0.563 (1.00) |
0.291 (1.00) |
0.462 (1.00) |
0.0348 (1.00) |
0.106 (1.00) |
0.75 (1.00) |
0.105 (1.00) |
|
| Del Peak 18(15q25 3) | 4 (1%) | 299 |
1 (1.00) |
0.24 (1.00) |
0.575 (1.00) |
0.171 (1.00) |
1 (1.00) |
1 (1.00) |
0.17 (1.00) |
1 (1.00) |
0.374 (1.00) |
0.477 (1.00) |
3.14e-15 (1.04e-12) |
0.0429 (1.00) |
0.623 (1.00) |
0.529 (1.00) |
|
| Del Peak 26(21q21 1) | 7 (2%) | 296 |
1 (1.00) |
0.00405 (1.00) |
1 (1.00) |
0.441 (1.00) |
1 (1.00) |
1 (1.00) |
0.502 (1.00) |
1 (1.00) |
0.338 (1.00) |
0.187 (1.00) |
0.964 (1.00) |
0.000257 (0.0829) |
1 (1.00) |
0.599 (1.00) |
|
| Del Peak 30(Xq22 1) | 6 (2%) | 297 |
1 (1.00) |
0.174 (1.00) |
0.0365 (1.00) |
0.172 (1.00) |
1 (1.00) |
0.222 (1.00) |
0.279 (1.00) |
0.42 (1.00) |
0.447 (1.00) |
0.23 (1.00) |
0.683 (1.00) |
0.000534 (0.171) |
0.684 (1.00) |
0.8 (1.00) |
|
| Del Peak 5(6q22 31) | 4 (1%) | 299 |
0.00468 (1.00) |
0.195 (1.00) |
1 (1.00) |
0.799 (1.00) |
0.173 (1.00) |
1 (1.00) |
0.17 (1.00) |
0.61 (1.00) |
0.773 (1.00) |
1 (1.00) |
0.00786 (1.00) |
0.0691 (1.00) |
0.366 (1.00) |
0.0277 (1.00) |
|
| Del Peak 6(6q27) | 4 (1%) | 299 |
0.00468 (1.00) |
0.195 (1.00) |
1 (1.00) |
0.799 (1.00) |
0.173 (1.00) |
1 (1.00) |
0.17 (1.00) |
0.61 (1.00) |
0.773 (1.00) |
1 (1.00) |
0.00786 (1.00) |
0.0691 (1.00) |
0.366 (1.00) |
0.0277 (1.00) |
|
| Del Peak 8(7q34) | 4 (1%) | 299 |
1 (1.00) |
0.75 (1.00) |
1 (1.00) |
0.248 (1.00) |
1 (1.00) |
1 (1.00) |
1 (1.00) |
0.61 (1.00) |
0.773 (1.00) |
1 (1.00) |
0.389 (1.00) |
0.691 (1.00) |
0.366 (1.00) |
0.255 (1.00) |
|
| Del Peak 13(10q21 2) | 7 (2%) | 296 |
1 (1.00) |
0.552 (1.00) |
1 (1.00) |
0.0731 (1.00) |
0.284 (1.00) |
1 (1.00) |
1 (1.00) |
1 (1.00) |
0.591 (1.00) |
0.681 (1.00) |
0.307 (1.00) |
0.594 (1.00) |
1 (1.00) |
0.0189 (1.00) |
|
| Del Peak 14(10q23 31) | 8 (3%) | 295 |
1 (1.00) |
0.0193 (1.00) |
0.419 (1.00) |
0.0244 (1.00) |
1 (1.00) |
1 (1.00) |
0.754 (1.00) |
0.734 (1.00) |
0.232 (1.00) |
1 (1.00) |
0.0639 (1.00) |
0.00906 (1.00) |
0.72 (1.00) |
0.03 (1.00) |
|
| Del Peak 17(13q14 3) | 13 (4%) | 290 |
0.00468 (1.00) |
0.171 (1.00) |
0.324 (1.00) |
0.184 (1.00) |
0.116 (1.00) |
0.000937 (0.298) |
0.356 (1.00) |
0.462 (1.00) |
0.145 (1.00) |
0.848 (1.00) |
0.0403 (1.00) |
0.504 (1.00) |
0.378 (1.00) |
0.275 (1.00) |
|
| Del Peak 20(16q23 3) | 3 (1%) | 300 |
1 (1.00) |
0.316 (1.00) |
0.575 (1.00) |
0.0145 (1.00) |
1 (1.00) |
0.14 (1.00) |
1 (1.00) |
0.2 (1.00) |
0.707 (1.00) |
0.222 (1.00) |
0.0615 (1.00) |
0.141 (1.00) |
1 (1.00) |
||
| Del Peak 21(17p13 1) | 5 (2%) | 298 |
1 (1.00) |
0.929 (1.00) |
0.336 (1.00) |
0.369 (1.00) |
0.0183 (1.00) |
1 (1.00) |
0.415 (1.00) |
0.112 (1.00) |
0.267 (1.00) |
1 (1.00) |
0.307 (1.00) |
0.195 (1.00) |
0.209 (1.00) |
0.278 (1.00) |
|
| Del Peak 22(18p11 21) | 3 (1%) | 300 |
1 (1.00) |
0.97 (1.00) |
0.575 (1.00) |
1 (1.00) |
1 (1.00) |
1 (1.00) |
1 (1.00) |
1 (1.00) |
0.862 (1.00) |
1 (1.00) |
0.0615 (1.00) |
0.0425 (1.00) |
0.619 (1.00) |
0.665 (1.00) |
|
| Del Peak 23(19p13 2) | 4 (1%) | 299 |
1 (1.00) |
0.0245 (1.00) |
1 (1.00) |
0.171 (1.00) |
1 (1.00) |
1 (1.00) |
0.62 (1.00) |
1 (1.00) |
0.0943 (1.00) |
0.222 (1.00) |
0.703 (1.00) |
0.366 (1.00) |
|||
| Del Peak 27(22q13 31) | 53 (17%) | 250 |
0.724 (1.00) |
0.726 (1.00) |
0.729 (1.00) |
0.0482 (1.00) |
0.477 (1.00) |
0.473 (1.00) |
0.738 (1.00) |
0.519 (1.00) |
0.422 (1.00) |
0.413 (1.00) |
0.607 (1.00) |
0.815 (1.00) |
0.125 (1.00) |
0.35 (1.00) |
|
| Del Peak 28(22q13 2) | 53 (17%) | 250 |
0.724 (1.00) |
0.726 (1.00) |
0.729 (1.00) |
0.0482 (1.00) |
0.477 (1.00) |
0.473 (1.00) |
0.738 (1.00) |
0.519 (1.00) |
0.422 (1.00) |
0.413 (1.00) |
0.607 (1.00) |
0.815 (1.00) |
0.125 (1.00) |
0.35 (1.00) |
|
| Del Peak 29(22q13 32) | 54 (18%) | 249 |
0.724 (1.00) |
0.774 (1.00) |
0.729 (1.00) |
0.0276 (1.00) |
0.477 (1.00) |
0.473 (1.00) |
0.827 (1.00) |
0.519 (1.00) |
0.376 (1.00) |
0.413 (1.00) |
0.537 (1.00) |
0.835 (1.00) |
0.0939 (1.00) |
0.35 (1.00) |
P value = 2.97e-15 (t-test), Q value = 9.9e-13
Table S1. Gene #1: 'Del Peak 2(2p22.3) mutation analysis' versus Clinical Feature #11: 'NUMBER.OF.LYMPH.NODES'
| nPatients | Mean (Std.Dev) | |
|---|---|---|
| ALL | 242 | 2.8 (5.1) |
| DEL PEAK 2(2P22.3) MUTATED | 7 | 0.0 (0.0) |
| DEL PEAK 2(2P22.3) WILD-TYPE | 235 | 2.9 (5.2) |
Figure S1. Get High-res Image Gene #1: 'Del Peak 2(2p22.3) mutation analysis' versus Clinical Feature #11: 'NUMBER.OF.LYMPH.NODES'

P value = 0.000702 (Chi-square test), Q value = 0.22
Table S2. Gene #1: 'Del Peak 2(2p22.3) mutation analysis' versus Clinical Feature #13: 'NEOPLASM.DISEASESTAGE'
| nPatients | STAGE I | STAGE II | STAGE III | STAGE IVA | STAGE IVC |
|---|---|---|---|---|---|
| ALL | 173 | 33 | 66 | 27 | 3 |
| DEL PEAK 2(2P22.3) MUTATED | 3 | 5 | 1 | 0 | 0 |
| DEL PEAK 2(2P22.3) WILD-TYPE | 170 | 28 | 65 | 27 | 3 |
Figure S2. Get High-res Image Gene #1: 'Del Peak 2(2p22.3) mutation analysis' versus Clinical Feature #13: 'NEOPLASM.DISEASESTAGE'
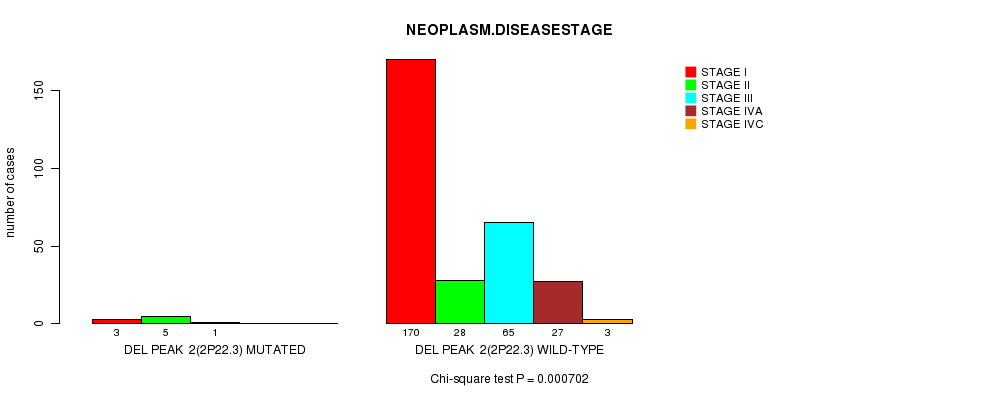
P value = 0.000425 (Fisher's exact test), Q value = 0.14
Table S3. Gene #2: 'Del Peak 3(2q35) mutation analysis' versus Clinical Feature #4: 'HISTOLOGICAL.TYPE'
| nPatients | OTHER | THYROID PAPILLARY CARCINOMA - CLASSICAL/USUAL | THYROID PAPILLARY CARCINOMA - FOLLICULAR (>= 99% FOLLICULAR PATTERNED) | THYROID PAPILLARY CARCINOMA - TALL CELL (>= 50% TALL CELL FEATURES) |
|---|---|---|---|---|
| ALL | 20 | 178 | 75 | 30 |
| DEL PEAK 3(2Q35) MUTATED | 4 | 1 | 3 | 0 |
| DEL PEAK 3(2Q35) WILD-TYPE | 16 | 177 | 72 | 30 |
Figure S3. Get High-res Image Gene #2: 'Del Peak 3(2q35) mutation analysis' versus Clinical Feature #4: 'HISTOLOGICAL.TYPE'

P value = 3.02e-15 (t-test), Q value = 1e-12
Table S4. Gene #2: 'Del Peak 3(2q35) mutation analysis' versus Clinical Feature #11: 'NUMBER.OF.LYMPH.NODES'
| nPatients | Mean (Std.Dev) | |
|---|---|---|
| ALL | 242 | 2.8 (5.1) |
| DEL PEAK 3(2Q35) MUTATED | 6 | 0.0 (0.0) |
| DEL PEAK 3(2Q35) WILD-TYPE | 236 | 2.8 (5.2) |
Figure S4. Get High-res Image Gene #2: 'Del Peak 3(2q35) mutation analysis' versus Clinical Feature #11: 'NUMBER.OF.LYMPH.NODES'

P value = 9.03e-05 (Chi-square test), Q value = 0.029
Table S5. Gene #2: 'Del Peak 3(2q35) mutation analysis' versus Clinical Feature #13: 'NEOPLASM.DISEASESTAGE'
| nPatients | STAGE I | STAGE II | STAGE III | STAGE IVA | STAGE IVC |
|---|---|---|---|---|---|
| ALL | 173 | 33 | 66 | 27 | 3 |
| DEL PEAK 3(2Q35) MUTATED | 1 | 5 | 2 | 0 | 0 |
| DEL PEAK 3(2Q35) WILD-TYPE | 172 | 28 | 64 | 27 | 3 |
Figure S5. Get High-res Image Gene #2: 'Del Peak 3(2q35) mutation analysis' versus Clinical Feature #13: 'NEOPLASM.DISEASESTAGE'
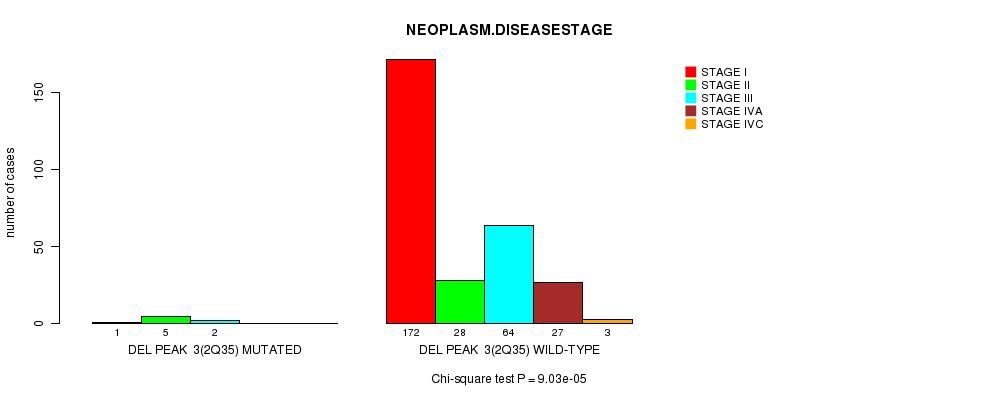
P value = 3.19e-15 (t-test), Q value = 1e-12
Table S6. Gene #6: 'Del Peak 10(8q24.22) mutation analysis' versus Clinical Feature #11: 'NUMBER.OF.LYMPH.NODES'
| nPatients | Mean (Std.Dev) | |
|---|---|---|
| ALL | 242 | 2.8 (5.1) |
| DEL PEAK 10(8Q24.22) MUTATED | 3 | 0.0 (0.0) |
| DEL PEAK 10(8Q24.22) WILD-TYPE | 239 | 2.8 (5.1) |
Figure S6. Get High-res Image Gene #6: 'Del Peak 10(8q24.22) mutation analysis' versus Clinical Feature #11: 'NUMBER.OF.LYMPH.NODES'
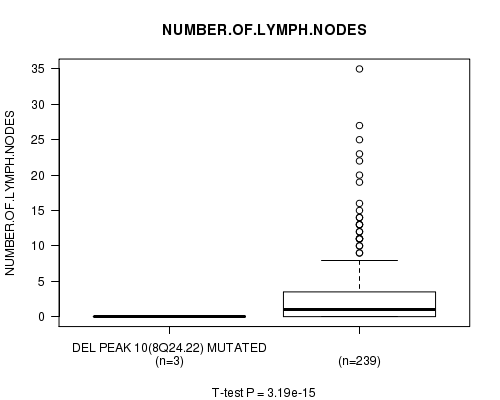
P value = 1.14e-05 (Chi-square test), Q value = 0.0037
Table S7. Gene #7: 'Del Peak 11(9p21.3) mutation analysis' versus Clinical Feature #13: 'NEOPLASM.DISEASESTAGE'
| nPatients | STAGE I | STAGE II | STAGE III | STAGE IVA | STAGE IVC |
|---|---|---|---|---|---|
| ALL | 173 | 33 | 66 | 27 | 3 |
| DEL PEAK 11(9P21.3) MUTATED | 1 | 5 | 0 | 1 | 0 |
| DEL PEAK 11(9P21.3) WILD-TYPE | 172 | 28 | 66 | 26 | 3 |
Figure S7. Get High-res Image Gene #7: 'Del Peak 11(9p21.3) mutation analysis' versus Clinical Feature #13: 'NEOPLASM.DISEASESTAGE'

P value = 6.48e-05 (Chi-square test), Q value = 0.021
Table S8. Gene #8: 'Del Peak 12(9q22.32) mutation analysis' versus Clinical Feature #13: 'NEOPLASM.DISEASESTAGE'
| nPatients | STAGE I | STAGE II | STAGE III | STAGE IVA | STAGE IVC |
|---|---|---|---|---|---|
| ALL | 173 | 33 | 66 | 27 | 3 |
| DEL PEAK 12(9Q22.32) MUTATED | 2 | 5 | 0 | 3 | 0 |
| DEL PEAK 12(9Q22.32) WILD-TYPE | 171 | 28 | 66 | 24 | 3 |
Figure S8. Get High-res Image Gene #8: 'Del Peak 12(9q22.32) mutation analysis' versus Clinical Feature #13: 'NEOPLASM.DISEASESTAGE'

P value = 3.14e-15 (t-test), Q value = 1e-12
Table S9. Gene #11: 'Del Peak 15(11p15.1) mutation analysis' versus Clinical Feature #11: 'NUMBER.OF.LYMPH.NODES'
| nPatients | Mean (Std.Dev) | |
|---|---|---|
| ALL | 242 | 2.8 (5.1) |
| DEL PEAK 15(11P15.1) MUTATED | 4 | 0.0 (0.0) |
| DEL PEAK 15(11P15.1) WILD-TYPE | 238 | 2.8 (5.2) |
Figure S9. Get High-res Image Gene #11: 'Del Peak 15(11p15.1) mutation analysis' versus Clinical Feature #11: 'NUMBER.OF.LYMPH.NODES'
P value = 0.000379 (Fisher's exact test), Q value = 0.12
Table S10. Gene #12: 'Del Peak 16(13q12.3) mutation analysis' versus Clinical Feature #6: 'RADIATIONEXPOSURE'
| nPatients | NO | YES |
|---|---|---|
| ALL | 254 | 13 |
| DEL PEAK 16(13Q12.3) MUTATED | 5 | 4 |
| DEL PEAK 16(13Q12.3) WILD-TYPE | 249 | 9 |
Figure S10. Get High-res Image Gene #12: 'Del Peak 16(13q12.3) mutation analysis' versus Clinical Feature #6: 'RADIATIONEXPOSURE'
P value = 3.14e-15 (t-test), Q value = 1e-12
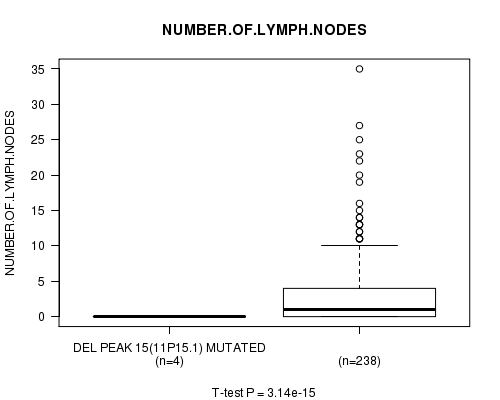
Table S11. Gene #14: 'Del Peak 18(15q25.3) mutation analysis' versus Clinical Feature #11: 'NUMBER.OF.LYMPH.NODES'
| nPatients | Mean (Std.Dev) | |
|---|---|---|
| ALL | 242 | 2.8 (5.1) |
| DEL PEAK 18(15Q25.3) MUTATED | 4 | 0.0 (0.0) |
| DEL PEAK 18(15Q25.3) WILD-TYPE | 238 | 2.8 (5.2) |
Figure S11. Get High-res Image Gene #14: 'Del Peak 18(15q25.3) mutation analysis' versus Clinical Feature #11: 'NUMBER.OF.LYMPH.NODES'
P value = 0.000257 (Chi-square test), Q value = 0.083
Table S12. Gene #19: 'Del Peak 26(21q21.1) mutation analysis' versus Clinical Feature #13: 'NEOPLASM.DISEASESTAGE'
| nPatients | STAGE I | STAGE II | STAGE III | STAGE IVA | STAGE IVC |
|---|---|---|---|---|---|
| ALL | 173 | 33 | 66 | 27 | 3 |
| DEL PEAK 26(21Q21.1) MUTATED | 0 | 4 | 1 | 2 | 0 |
| DEL PEAK 26(21Q21.1) WILD-TYPE | 173 | 29 | 65 | 25 | 3 |
Figure S12. Get High-res Image Gene #19: 'Del Peak 26(21q21.1) mutation analysis' versus Clinical Feature #13: 'NEOPLASM.DISEASESTAGE'
P value = 0.000534 (Chi-square test), Q value = 0.17
Table S13. Gene #23: 'Del Peak 30(Xq22.1) mutation analysis' versus Clinical Feature #13: 'NEOPLASM.DISEASESTAGE'
| nPatients | STAGE I | STAGE II | STAGE III | STAGE IVA | STAGE IVC |
|---|---|---|---|---|---|
| ALL | 173 | 33 | 66 | 27 | 3 |
| DEL PEAK 30(XQ22.1) MUTATED | 1 | 4 | 1 | 0 | 0 |
| DEL PEAK 30(XQ22.1) WILD-TYPE | 172 | 29 | 65 | 27 | 3 |
Figure S13. Get High-res Image Gene #23: 'Del Peak 30(Xq22.1) mutation analysis' versus Clinical Feature #13: 'NEOPLASM.DISEASESTAGE'

P value = 3.14e-15 (t-test), Q value = 1e-12
Table S14. Gene #24: 'Del Peak 31(Xq22.3) mutation analysis' versus Clinical Feature #11: 'NUMBER.OF.LYMPH.NODES'
| nPatients | Mean (Std.Dev) | |
|---|---|---|
| ALL | 242 | 2.8 (5.1) |
| DEL PEAK 31(XQ22.3) MUTATED | 4 | 0.0 (0.0) |
| DEL PEAK 31(XQ22.3) WILD-TYPE | 238 | 2.8 (5.2) |
Figure S14. Get High-res Image Gene #24: 'Del Peak 31(Xq22.3) mutation analysis' versus Clinical Feature #11: 'NUMBER.OF.LYMPH.NODES'

P value = 1.17e-06 (Chi-square test), Q value = 0.00038
Table S15. Gene #24: 'Del Peak 31(Xq22.3) mutation analysis' versus Clinical Feature #13: 'NEOPLASM.DISEASESTAGE'
| nPatients | STAGE I | STAGE II | STAGE III | STAGE IVA | STAGE IVC |
|---|---|---|---|---|---|
| ALL | 173 | 33 | 66 | 27 | 3 |
| DEL PEAK 31(XQ22.3) MUTATED | 0 | 4 | 0 | 0 | 0 |
| DEL PEAK 31(XQ22.3) WILD-TYPE | 173 | 29 | 66 | 27 | 3 |
Figure S15. Get High-res Image Gene #24: 'Del Peak 31(Xq22.3) mutation analysis' versus Clinical Feature #13: 'NEOPLASM.DISEASESTAGE'

-
Mutation data file = all_lesions.conf_99.cnv.cluster.txt
-
Clinical data file = THCA-TP.clin.merged.picked.txt
-
Number of patients = 303
-
Number of significantly arm-level cnvs = 24
-
Number of selected clinical features = 15
-
Exclude genes that fewer than K tumors have mutations, K = 3
For survival clinical features, the Kaplan-Meier survival curves of tumors with and without gene mutations were plotted and the statistical significance P values were estimated by logrank test (Bland and Altman 2004) using the 'survdiff' function in R
For continuous numerical clinical features, two-tailed Student's t test with unequal variance (Lehmann and Romano 2005) was applied to compare the clinical values between tumors with and without gene mutations using 't.test' function in R
For binary or multi-class clinical features (nominal or ordinal), two-tailed Fisher's exact tests (Fisher 1922) were used to estimate the P values using the 'fisher.test' function in R
For multi-class clinical features (nominal or ordinal), Chi-square tests (Greenwood and Nikulin 1996) were used to estimate the P values using the 'chisq.test' function in R
For multiple hypothesis correction, Q value is the False Discovery Rate (FDR) analogue of the P value (Benjamini and Hochberg 1995), defined as the minimum FDR at which the test may be called significant. We used the 'Benjamini and Hochberg' method of 'p.adjust' function in R to convert P values into Q values.
This is an experimental feature. The full results of the analysis summarized in this report can be downloaded from the TCGA Data Coordination Center.