(primary solid tumor cohort)
This pipeline computes the correlation between significant arm-level copy number variations (cnvs) and selected clinical features.
Testing the association between copy number variation 36 arm-level results and 15 clinical features across 303 patients, 27 significant findings detected with Q value < 0.25.
-
4p gain cnv correlated to 'NUMBER.OF.LYMPH.NODES'.
-
4q gain cnv correlated to 'NUMBER.OF.LYMPH.NODES'.
-
5p gain cnv correlated to 'NUMBER.OF.LYMPH.NODES'.
-
5q gain cnv correlated to 'NUMBER.OF.LYMPH.NODES'.
-
7p gain cnv correlated to 'NUMBER.OF.LYMPH.NODES'.
-
7q gain cnv correlated to 'NUMBER.OF.LYMPH.NODES'.
-
12p gain cnv correlated to 'NUMBER.OF.LYMPH.NODES'.
-
12q gain cnv correlated to 'NUMBER.OF.LYMPH.NODES'.
-
14q gain cnv correlated to 'NUMBER.OF.LYMPH.NODES'.
-
16p gain cnv correlated to 'NUMBER.OF.LYMPH.NODES'.
-
16q gain cnv correlated to 'NUMBER.OF.LYMPH.NODES'.
-
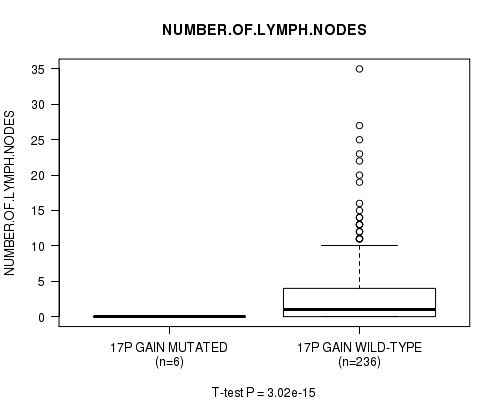
17p gain cnv correlated to 'NUMBER.OF.LYMPH.NODES'.
-
17q gain cnv correlated to 'NUMBER.OF.LYMPH.NODES'.
-
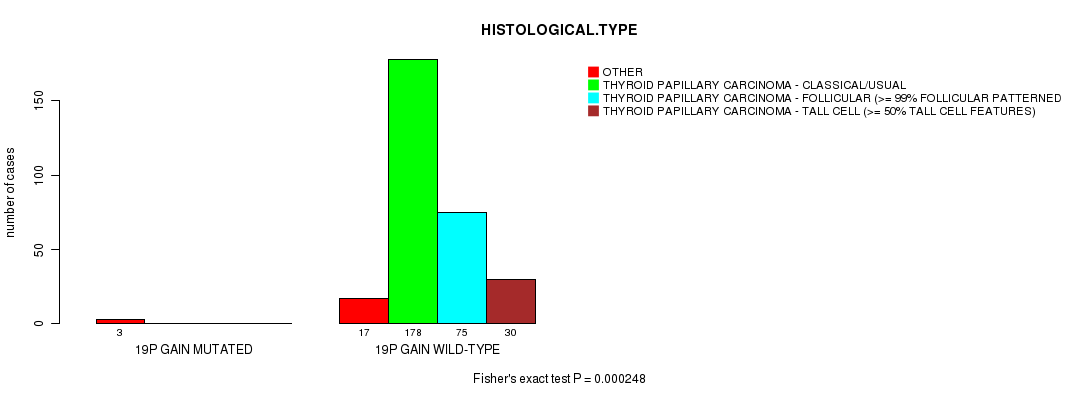
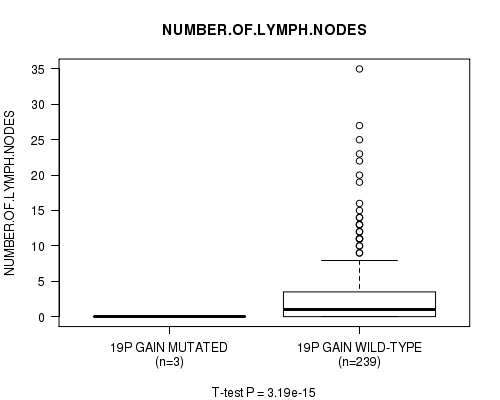
19p gain cnv correlated to 'HISTOLOGICAL.TYPE' and 'NUMBER.OF.LYMPH.NODES'.
-
19q gain cnv correlated to 'NUMBER.OF.LYMPH.NODES'.
-
20p gain cnv correlated to 'NUMBER.OF.LYMPH.NODES'.
-
20q gain cnv correlated to 'NUMBER.OF.LYMPH.NODES'.
-
2p loss cnv correlated to 'NUMBER.OF.LYMPH.NODES'.
-
2q loss cnv correlated to 'NUMBER.OF.LYMPH.NODES'.
-
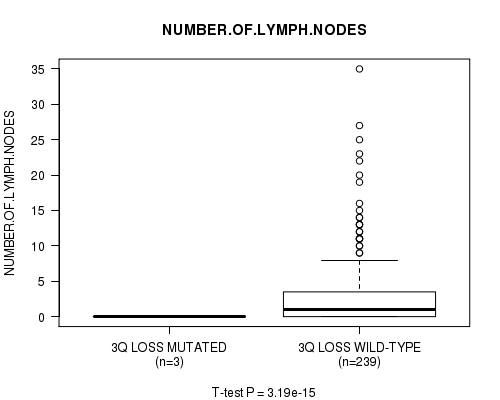
3q loss cnv correlated to 'NUMBER.OF.LYMPH.NODES'.
-
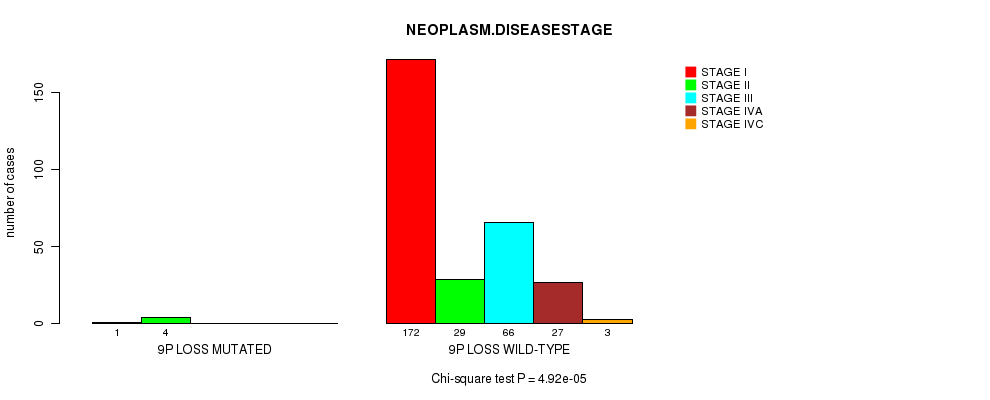
9p loss cnv correlated to 'NEOPLASM.DISEASESTAGE'.
-
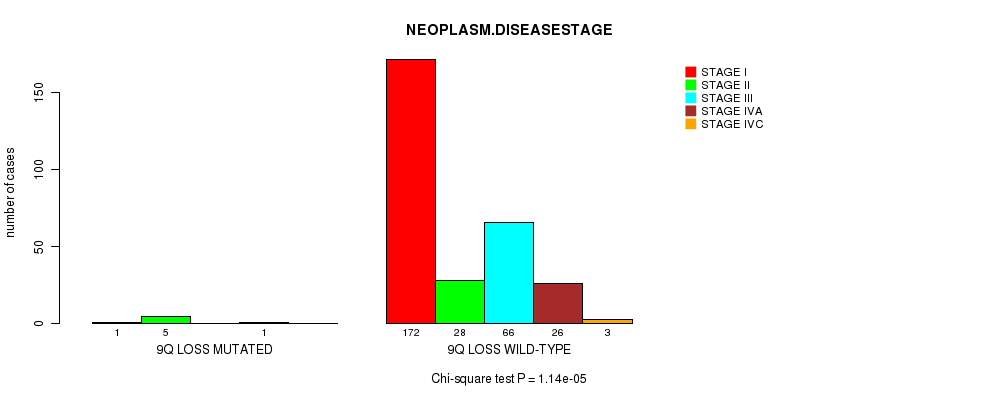
9q loss cnv correlated to 'NEOPLASM.DISEASESTAGE'.
-
11p loss cnv correlated to 'NUMBER.OF.LYMPH.NODES'.
-
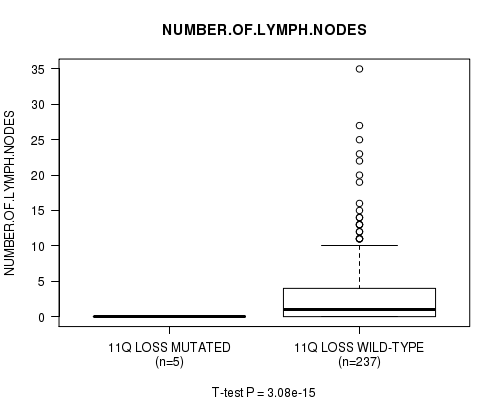
11q loss cnv correlated to 'NUMBER.OF.LYMPH.NODES'.
-
13q loss cnv correlated to 'NUMBER.OF.LYMPH.NODES'.
-
15q loss cnv correlated to 'NUMBER.OF.LYMPH.NODES'.
Table 1. Get Full Table Overview of the association between significant copy number variation of 36 arm-level results and 15 clinical features. Shown in the table are P values (Q values). Thresholded by Q value < 0.25, 27 significant findings detected.
|
Clinical Features |
Time to Death |
AGE | GENDER |
HISTOLOGICAL TYPE |
RADIATIONS RADIATION REGIMENINDICATION |
RADIATIONEXPOSURE |
DISTANT METASTASIS |
EXTRATHYROIDAL EXTENSION |
LYMPH NODE METASTASIS |
COMPLETENESS OF RESECTION |
NUMBER OF LYMPH NODES |
TUMOR STAGECODE |
NEOPLASM DISEASESTAGE |
MULTIFOCALITY |
TUMOR SIZE |
||
| nCNV (%) | nWild-Type | logrank test | t-test | Fisher's exact test | Fisher's exact test | Fisher's exact test | Fisher's exact test | Fisher's exact test | Fisher's exact test | Chi-square test | Fisher's exact test | t-test | t-test | Chi-square test | Fisher's exact test | t-test | |
| 19p gain | 3 (1%) | 300 |
1 (1.00) |
0.186 (1.00) |
0.575 (1.00) |
0.000248 (0.117) |
1 (1.00) |
1 (1.00) |
0.279 (1.00) |
1 (1.00) |
0.529 (1.00) |
0.222 (1.00) |
3.19e-15 (1.53e-12) |
0.703 (1.00) |
1 (1.00) |
0.558 (1.00) |
|
| 4p gain | 4 (1%) | 299 |
0.00468 (1.00) |
0.118 (1.00) |
1 (1.00) |
0.371 (1.00) |
0.173 (1.00) |
1 (1.00) |
0.17 (1.00) |
1 (1.00) |
0.374 (1.00) |
0.292 (1.00) |
3.14e-15 (1.52e-12) |
0.502 (1.00) |
0.623 (1.00) |
0.43 (1.00) |
|
| 4q gain | 4 (1%) | 299 |
0.00468 (1.00) |
0.118 (1.00) |
1 (1.00) |
0.371 (1.00) |
0.173 (1.00) |
1 (1.00) |
0.17 (1.00) |
1 (1.00) |
0.374 (1.00) |
0.292 (1.00) |
3.14e-15 (1.52e-12) |
0.502 (1.00) |
0.623 (1.00) |
0.43 (1.00) |
|
| 5p gain | 9 (3%) | 294 |
0.00468 (1.00) |
0.0351 (1.00) |
1 (1.00) |
0.0215 (1.00) |
0.351 (1.00) |
1 (1.00) |
0.0112 (1.00) |
0.746 (1.00) |
0.153 (1.00) |
0.585 (1.00) |
2.97e-15 (1.47e-12) |
0.0112 (1.00) |
0.501 (1.00) |
0.0739 (1.00) |
|
| 5q gain | 9 (3%) | 294 |
0.00468 (1.00) |
0.0351 (1.00) |
1 (1.00) |
0.0215 (1.00) |
0.351 (1.00) |
1 (1.00) |
0.0112 (1.00) |
0.746 (1.00) |
0.153 (1.00) |
0.585 (1.00) |
2.97e-15 (1.47e-12) |
0.0112 (1.00) |
0.501 (1.00) |
0.0739 (1.00) |
|
| 7p gain | 11 (4%) | 292 |
1 (1.00) |
0.0361 (1.00) |
0.737 (1.00) |
0.0296 (1.00) |
1 (1.00) |
1 (1.00) |
0.0236 (1.00) |
0.451 (1.00) |
0.0947 (1.00) |
0.301 (1.00) |
2.86e-15 (1.42e-12) |
0.00371 (1.00) |
0.541 (1.00) |
0.171 (1.00) |
|
| 7q gain | 13 (4%) | 290 |
1 (1.00) |
0.0201 (1.00) |
0.529 (1.00) |
0.00532 (1.00) |
1 (1.00) |
1 (1.00) |
0.0503 (1.00) |
0.804 (1.00) |
0.0152 (1.00) |
0.116 (1.00) |
2.86e-15 (1.42e-12) |
0.0116 (1.00) |
0.573 (1.00) |
0.162 (1.00) |
|
| 12p gain | 10 (3%) | 293 |
1 (1.00) |
0.141 (1.00) |
0.461 (1.00) |
0.0155 (1.00) |
1 (1.00) |
1 (1.00) |
0.00495 (1.00) |
0.563 (1.00) |
0.0579 (1.00) |
0.63 (1.00) |
2.97e-15 (1.47e-12) |
0.0481 (1.00) |
0.75 (1.00) |
0.369 (1.00) |
|
| 12q gain | 10 (3%) | 293 |
1 (1.00) |
0.141 (1.00) |
0.461 (1.00) |
0.0155 (1.00) |
1 (1.00) |
1 (1.00) |
0.00495 (1.00) |
0.563 (1.00) |
0.0579 (1.00) |
0.63 (1.00) |
2.97e-15 (1.47e-12) |
0.0481 (1.00) |
0.75 (1.00) |
0.369 (1.00) |
|
| 14q gain | 6 (2%) | 297 |
1 (1.00) |
0.257 (1.00) |
0.343 (1.00) |
0.0949 (1.00) |
1 (1.00) |
1 (1.00) |
0.0589 (1.00) |
1 (1.00) |
0.192 (1.00) |
0.422 (1.00) |
3.14e-15 (1.52e-12) |
0.043 (1.00) |
0.214 (1.00) |
0.47 (1.00) |
|
| 16p gain | 8 (3%) | 295 |
1 (1.00) |
0.252 (1.00) |
0.208 (1.00) |
0.212 (1.00) |
1 (1.00) |
1 (1.00) |
0.361 (1.00) |
1 (1.00) |
0.0468 (1.00) |
0.174 (1.00) |
3.08e-15 (1.5e-12) |
0.151 (1.00) |
1 (1.00) |
0.477 (1.00) |
|
| 16q gain | 6 (2%) | 297 |
1 (1.00) |
0.152 (1.00) |
0.343 (1.00) |
0.503 (1.00) |
1 (1.00) |
1 (1.00) |
0.279 (1.00) |
1 (1.00) |
0.192 (1.00) |
0.422 (1.00) |
3.14e-15 (1.52e-12) |
0.043 (1.00) |
0.684 (1.00) |
0.426 (1.00) |
|
| 17p gain | 8 (3%) | 295 |
1 (1.00) |
0.307 (1.00) |
0.208 (1.00) |
0.0224 (1.00) |
1 (1.00) |
1 (1.00) |
0.165 (1.00) |
0.33 (1.00) |
0.18 (1.00) |
0.535 (1.00) |
3.02e-15 (1.47e-12) |
0.0104 (1.00) |
0.723 (1.00) |
0.478 (1.00) |
|
| 17q gain | 9 (3%) | 294 |
1 (1.00) |
0.467 (1.00) |
0.118 (1.00) |
0.0467 (1.00) |
1 (1.00) |
1 (1.00) |
0.0705 (1.00) |
0.273 (1.00) |
0.153 (1.00) |
0.585 (1.00) |
2.97e-15 (1.47e-12) |
0.0242 (1.00) |
1 (1.00) |
0.752 (1.00) |
|
| 19q gain | 4 (1%) | 299 |
0.00468 (1.00) |
0.0697 (1.00) |
1 (1.00) |
0.00151 (0.705) |
0.173 (1.00) |
1 (1.00) |
0.17 (1.00) |
0.61 (1.00) |
0.374 (1.00) |
0.292 (1.00) |
3.14e-15 (1.52e-12) |
0.502 (1.00) |
1 (1.00) |
0.312 (1.00) |
|
| 20p gain | 5 (2%) | 298 |
1 (1.00) |
0.279 (1.00) |
0.336 (1.00) |
0.0333 (1.00) |
1 (1.00) |
1 (1.00) |
0.123 (1.00) |
0.406 (1.00) |
0.158 (1.00) |
1 (1.00) |
3.19e-15 (1.53e-12) |
0.0115 (1.00) |
1 (1.00) |
0.149 (1.00) |
|
| 20q gain | 5 (2%) | 298 |
1 (1.00) |
0.279 (1.00) |
0.336 (1.00) |
0.0333 (1.00) |
1 (1.00) |
1 (1.00) |
0.123 (1.00) |
0.406 (1.00) |
0.158 (1.00) |
1 (1.00) |
3.19e-15 (1.53e-12) |
0.0115 (1.00) |
1 (1.00) |
0.149 (1.00) |
|
| 2p loss | 7 (2%) | 296 |
1 (1.00) |
0.189 (1.00) |
0.684 (1.00) |
0.0496 (1.00) |
1 (1.00) |
1 (1.00) |
0.203 (1.00) |
0.311 (1.00) |
0.112 (1.00) |
0.48 (1.00) |
2.97e-15 (1.47e-12) |
0.0031 (1.00) |
1 (1.00) |
0.9 (1.00) |
|
| 2q loss | 6 (2%) | 297 |
1 (1.00) |
0.0373 (1.00) |
1 (1.00) |
0.0186 (1.00) |
1 (1.00) |
1 (1.00) |
0.279 (1.00) |
0.42 (1.00) |
0.171 (1.00) |
0.422 (1.00) |
3.02e-15 (1.47e-12) |
0.000534 (0.251) |
0.684 (1.00) |
0.325 (1.00) |
|
| 3q loss | 3 (1%) | 300 |
1 (1.00) |
0.2 (1.00) |
1 (1.00) |
0.0585 (1.00) |
1 (1.00) |
1 (1.00) |
0.279 (1.00) |
1 (1.00) |
0.529 (1.00) |
1 (1.00) |
3.19e-15 (1.53e-12) |
0.0285 (1.00) |
1 (1.00) |
0.147 (1.00) |
|
| 9p loss | 5 (2%) | 298 |
1 (1.00) |
0.922 (1.00) |
0.336 (1.00) |
0.559 (1.00) |
1 (1.00) |
1 (1.00) |
1 (1.00) |
0.406 (1.00) |
0.55 (1.00) |
1 (1.00) |
0.456 (1.00) |
4.92e-05 (0.0232) |
0.681 (1.00) |
0.477 (1.00) |
|
| 9q loss | 7 (2%) | 296 |
1 (1.00) |
0.34 (1.00) |
0.684 (1.00) |
0.163 (1.00) |
0.284 (1.00) |
0.298 (1.00) |
0.502 (1.00) |
0.311 (1.00) |
0.513 (1.00) |
1 (1.00) |
0.745 (1.00) |
1.14e-05 (0.00541) |
0.72 (1.00) |
0.5 (1.00) |
|
| 11p loss | 4 (1%) | 299 |
0.00468 (1.00) |
0.0307 (1.00) |
0.262 (1.00) |
0.171 (1.00) |
0.173 (1.00) |
1 (1.00) |
0.17 (1.00) |
0.61 (1.00) |
0.374 (1.00) |
0.292 (1.00) |
3.14e-15 (1.52e-12) |
0.502 (1.00) |
0.623 (1.00) |
0.204 (1.00) |
|
| 11q loss | 5 (2%) | 298 |
0.00468 (1.00) |
0.0185 (1.00) |
0.103 (1.00) |
0.0977 (1.00) |
0.212 (1.00) |
1 (1.00) |
0.123 (1.00) |
0.406 (1.00) |
0.256 (1.00) |
0.359 (1.00) |
3.08e-15 (1.5e-12) |
0.169 (1.00) |
1 (1.00) |
0.204 (1.00) |
|
| 13q loss | 9 (3%) | 294 |
0.00468 (1.00) |
0.0329 (1.00) |
0.236 (1.00) |
0.0753 (1.00) |
0.351 (1.00) |
0.00442 (1.00) |
0.273 (1.00) |
0.746 (1.00) |
0.144 (1.00) |
0.407 (1.00) |
2.91e-15 (1.44e-12) |
0.154 (1.00) |
0.501 (1.00) |
0.404 (1.00) |
|
| 15q loss | 3 (1%) | 300 |
1 (1.00) |
0.405 (1.00) |
0.575 (1.00) |
0.0437 (1.00) |
1 (1.00) |
1 (1.00) |
0.279 (1.00) |
1 (1.00) |
0.529 (1.00) |
1 (1.00) |
3.19e-15 (1.53e-12) |
0.0285 (1.00) |
1 (1.00) |
0.355 (1.00) |
|
| 1q gain | 8 (3%) | 295 |
1 (1.00) |
0.161 (1.00) |
0.419 (1.00) |
0.307 (1.00) |
0.318 (1.00) |
1 (1.00) |
0.754 (1.00) |
0.0035 (1.00) |
0.3 (1.00) |
0.289 (1.00) |
0.438 (1.00) |
0.0803 (1.00) |
0.169 (1.00) |
0.61 (1.00) |
|
| 11p gain | 3 (1%) | 300 |
1 (1.00) |
0.718 (1.00) |
1 (1.00) |
0.0218 (1.00) |
1 (1.00) |
1 (1.00) |
0.279 (1.00) |
1 (1.00) |
0.555 (1.00) |
1 (1.00) |
0.445 (1.00) |
0.619 (1.00) |
0.013 (1.00) |
||
| 1p loss | 3 (1%) | 300 |
1 (1.00) |
0.181 (1.00) |
0.575 (1.00) |
0.541 (1.00) |
1 (1.00) |
1 (1.00) |
1 (1.00) |
1 (1.00) |
0.529 (1.00) |
1 (1.00) |
0.0285 (1.00) |
0.619 (1.00) |
|||
| 10p loss | 3 (1%) | 300 |
1 (1.00) |
0.0335 (1.00) |
1 (1.00) |
0.541 (1.00) |
1 (1.00) |
1 (1.00) |
1 (1.00) |
1 (1.00) |
0.529 (1.00) |
1 (1.00) |
0.0285 (1.00) |
1 (1.00) |
|||
| 10q loss | 3 (1%) | 300 |
1 (1.00) |
0.0335 (1.00) |
1 (1.00) |
0.541 (1.00) |
1 (1.00) |
1 (1.00) |
1 (1.00) |
1 (1.00) |
0.529 (1.00) |
1 (1.00) |
0.0285 (1.00) |
1 (1.00) |
|||
| 17p loss | 4 (1%) | 299 |
1 (1.00) |
0.526 (1.00) |
0.575 (1.00) |
0.799 (1.00) |
0.0113 (1.00) |
1 (1.00) |
0.644 (1.00) |
0.05 (1.00) |
0.274 (1.00) |
1 (1.00) |
0.573 (1.00) |
0.075 (1.00) |
0.366 (1.00) |
0.227 (1.00) |
|
| 18p loss | 3 (1%) | 300 |
1 (1.00) |
0.97 (1.00) |
0.575 (1.00) |
1 (1.00) |
1 (1.00) |
1 (1.00) |
1 (1.00) |
1 (1.00) |
0.862 (1.00) |
1 (1.00) |
0.0615 (1.00) |
0.0425 (1.00) |
0.619 (1.00) |
0.665 (1.00) |
|
| 18q loss | 3 (1%) | 300 |
1 (1.00) |
0.97 (1.00) |
0.575 (1.00) |
1 (1.00) |
1 (1.00) |
1 (1.00) |
1 (1.00) |
1 (1.00) |
0.862 (1.00) |
1 (1.00) |
0.0615 (1.00) |
0.0425 (1.00) |
0.619 (1.00) |
0.665 (1.00) |
|
| 21q loss | 5 (2%) | 298 |
1 (1.00) |
0.0267 (1.00) |
0.602 (1.00) |
0.317 (1.00) |
1 (1.00) |
1 (1.00) |
0.415 (1.00) |
0.406 (1.00) |
0.55 (1.00) |
0.556 (1.00) |
0.993 (1.00) |
0.00498 (1.00) |
0.371 (1.00) |
0.686 (1.00) |
|
| 22q loss | 39 (13%) | 264 |
1 (1.00) |
0.327 (1.00) |
1 (1.00) |
0.000578 (0.271) |
0.229 (1.00) |
0.7 (1.00) |
0.552 (1.00) |
0.161 (1.00) |
0.119 (1.00) |
0.632 (1.00) |
0.448 (1.00) |
0.458 (1.00) |
0.304 (1.00) |
0.739 (1.00) |
P value = 3.14e-15 (t-test), Q value = 1.5e-12
Table S1. Gene #2: '4p gain mutation analysis' versus Clinical Feature #11: 'NUMBER.OF.LYMPH.NODES'
| nPatients | Mean (Std.Dev) | |
|---|---|---|
| ALL | 242 | 2.8 (5.1) |
| 4P GAIN MUTATED | 4 | 0.0 (0.0) |
| 4P GAIN WILD-TYPE | 238 | 2.8 (5.2) |
Figure S1. Get High-res Image Gene #2: '4p gain mutation analysis' versus Clinical Feature #11: 'NUMBER.OF.LYMPH.NODES'

P value = 3.14e-15 (t-test), Q value = 1.5e-12
Table S2. Gene #3: '4q gain mutation analysis' versus Clinical Feature #11: 'NUMBER.OF.LYMPH.NODES'
| nPatients | Mean (Std.Dev) | |
|---|---|---|
| ALL | 242 | 2.8 (5.1) |
| 4Q GAIN MUTATED | 4 | 0.0 (0.0) |
| 4Q GAIN WILD-TYPE | 238 | 2.8 (5.2) |
Figure S2. Get High-res Image Gene #3: '4q gain mutation analysis' versus Clinical Feature #11: 'NUMBER.OF.LYMPH.NODES'

P value = 2.97e-15 (t-test), Q value = 1.5e-12
Table S3. Gene #4: '5p gain mutation analysis' versus Clinical Feature #11: 'NUMBER.OF.LYMPH.NODES'
| nPatients | Mean (Std.Dev) | |
|---|---|---|
| ALL | 242 | 2.8 (5.1) |
| 5P GAIN MUTATED | 7 | 0.0 (0.0) |
| 5P GAIN WILD-TYPE | 235 | 2.9 (5.2) |
Figure S3. Get High-res Image Gene #4: '5p gain mutation analysis' versus Clinical Feature #11: 'NUMBER.OF.LYMPH.NODES'

P value = 2.97e-15 (t-test), Q value = 1.5e-12
Table S4. Gene #5: '5q gain mutation analysis' versus Clinical Feature #11: 'NUMBER.OF.LYMPH.NODES'
| nPatients | Mean (Std.Dev) | |
|---|---|---|
| ALL | 242 | 2.8 (5.1) |
| 5Q GAIN MUTATED | 7 | 0.0 (0.0) |
| 5Q GAIN WILD-TYPE | 235 | 2.9 (5.2) |
Figure S4. Get High-res Image Gene #5: '5q gain mutation analysis' versus Clinical Feature #11: 'NUMBER.OF.LYMPH.NODES'

P value = 2.86e-15 (t-test), Q value = 1.4e-12
Table S5. Gene #6: '7p gain mutation analysis' versus Clinical Feature #11: 'NUMBER.OF.LYMPH.NODES'
| nPatients | Mean (Std.Dev) | |
|---|---|---|
| ALL | 242 | 2.8 (5.1) |
| 7P GAIN MUTATED | 9 | 0.0 (0.0) |
| 7P GAIN WILD-TYPE | 233 | 2.9 (5.2) |
Figure S5. Get High-res Image Gene #6: '7p gain mutation analysis' versus Clinical Feature #11: 'NUMBER.OF.LYMPH.NODES'

P value = 2.86e-15 (t-test), Q value = 1.4e-12
Table S6. Gene #7: '7q gain mutation analysis' versus Clinical Feature #11: 'NUMBER.OF.LYMPH.NODES'
| nPatients | Mean (Std.Dev) | |
|---|---|---|
| ALL | 242 | 2.8 (5.1) |
| 7Q GAIN MUTATED | 9 | 0.0 (0.0) |
| 7Q GAIN WILD-TYPE | 233 | 2.9 (5.2) |
Figure S6. Get High-res Image Gene #7: '7q gain mutation analysis' versus Clinical Feature #11: 'NUMBER.OF.LYMPH.NODES'

P value = 2.97e-15 (t-test), Q value = 1.5e-12
Table S7. Gene #9: '12p gain mutation analysis' versus Clinical Feature #11: 'NUMBER.OF.LYMPH.NODES'
| nPatients | Mean (Std.Dev) | |
|---|---|---|
| ALL | 242 | 2.8 (5.1) |
| 12P GAIN MUTATED | 7 | 0.0 (0.0) |
| 12P GAIN WILD-TYPE | 235 | 2.9 (5.2) |
Figure S7. Get High-res Image Gene #9: '12p gain mutation analysis' versus Clinical Feature #11: 'NUMBER.OF.LYMPH.NODES'

P value = 2.97e-15 (t-test), Q value = 1.5e-12
Table S8. Gene #10: '12q gain mutation analysis' versus Clinical Feature #11: 'NUMBER.OF.LYMPH.NODES'
| nPatients | Mean (Std.Dev) | |
|---|---|---|
| ALL | 242 | 2.8 (5.1) |
| 12Q GAIN MUTATED | 7 | 0.0 (0.0) |
| 12Q GAIN WILD-TYPE | 235 | 2.9 (5.2) |
Figure S8. Get High-res Image Gene #10: '12q gain mutation analysis' versus Clinical Feature #11: 'NUMBER.OF.LYMPH.NODES'

P value = 3.14e-15 (t-test), Q value = 1.5e-12
Table S9. Gene #11: '14q gain mutation analysis' versus Clinical Feature #11: 'NUMBER.OF.LYMPH.NODES'
| nPatients | Mean (Std.Dev) | |
|---|---|---|
| ALL | 242 | 2.8 (5.1) |
| 14Q GAIN MUTATED | 4 | 0.0 (0.0) |
| 14Q GAIN WILD-TYPE | 238 | 2.8 (5.2) |
Figure S9. Get High-res Image Gene #11: '14q gain mutation analysis' versus Clinical Feature #11: 'NUMBER.OF.LYMPH.NODES'

P value = 3.08e-15 (t-test), Q value = 1.5e-12
Table S10. Gene #12: '16p gain mutation analysis' versus Clinical Feature #11: 'NUMBER.OF.LYMPH.NODES'
| nPatients | Mean (Std.Dev) | |
|---|---|---|
| ALL | 242 | 2.8 (5.1) |
| 16P GAIN MUTATED | 5 | 0.0 (0.0) |
| 16P GAIN WILD-TYPE | 237 | 2.8 (5.2) |
Figure S10. Get High-res Image Gene #12: '16p gain mutation analysis' versus Clinical Feature #11: 'NUMBER.OF.LYMPH.NODES'

P value = 3.14e-15 (t-test), Q value = 1.5e-12
Table S11. Gene #13: '16q gain mutation analysis' versus Clinical Feature #11: 'NUMBER.OF.LYMPH.NODES'
| nPatients | Mean (Std.Dev) | |
|---|---|---|
| ALL | 242 | 2.8 (5.1) |
| 16Q GAIN MUTATED | 4 | 0.0 (0.0) |
| 16Q GAIN WILD-TYPE | 238 | 2.8 (5.2) |
Figure S11. Get High-res Image Gene #13: '16q gain mutation analysis' versus Clinical Feature #11: 'NUMBER.OF.LYMPH.NODES'

P value = 3.02e-15 (t-test), Q value = 1.5e-12
Table S12. Gene #14: '17p gain mutation analysis' versus Clinical Feature #11: 'NUMBER.OF.LYMPH.NODES'
| nPatients | Mean (Std.Dev) | |
|---|---|---|
| ALL | 242 | 2.8 (5.1) |
| 17P GAIN MUTATED | 6 | 0.0 (0.0) |
| 17P GAIN WILD-TYPE | 236 | 2.8 (5.2) |
Figure S12. Get High-res Image Gene #14: '17p gain mutation analysis' versus Clinical Feature #11: 'NUMBER.OF.LYMPH.NODES'
P value = 2.97e-15 (t-test), Q value = 1.5e-12
Table S13. Gene #15: '17q gain mutation analysis' versus Clinical Feature #11: 'NUMBER.OF.LYMPH.NODES'
| nPatients | Mean (Std.Dev) | |
|---|---|---|
| ALL | 242 | 2.8 (5.1) |
| 17Q GAIN MUTATED | 7 | 0.0 (0.0) |
| 17Q GAIN WILD-TYPE | 235 | 2.9 (5.2) |
Figure S13. Get High-res Image Gene #15: '17q gain mutation analysis' versus Clinical Feature #11: 'NUMBER.OF.LYMPH.NODES'

P value = 0.000248 (Fisher's exact test), Q value = 0.12
Table S14. Gene #16: '19p gain mutation analysis' versus Clinical Feature #4: 'HISTOLOGICAL.TYPE'
| nPatients | OTHER | THYROID PAPILLARY CARCINOMA - CLASSICAL/USUAL | THYROID PAPILLARY CARCINOMA - FOLLICULAR (>= 99% FOLLICULAR PATTERNED) | THYROID PAPILLARY CARCINOMA - TALL CELL (>= 50% TALL CELL FEATURES) |
|---|---|---|---|---|
| ALL | 20 | 178 | 75 | 30 |
| 19P GAIN MUTATED | 3 | 0 | 0 | 0 |
| 19P GAIN WILD-TYPE | 17 | 178 | 75 | 30 |
Figure S14. Get High-res Image Gene #16: '19p gain mutation analysis' versus Clinical Feature #4: 'HISTOLOGICAL.TYPE'
P value = 3.19e-15 (t-test), Q value = 1.5e-12
Table S15. Gene #16: '19p gain mutation analysis' versus Clinical Feature #11: 'NUMBER.OF.LYMPH.NODES'
| nPatients | Mean (Std.Dev) | |
|---|---|---|
| ALL | 242 | 2.8 (5.1) |
| 19P GAIN MUTATED | 3 | 0.0 (0.0) |
| 19P GAIN WILD-TYPE | 239 | 2.8 (5.1) |
Figure S15. Get High-res Image Gene #16: '19p gain mutation analysis' versus Clinical Feature #11: 'NUMBER.OF.LYMPH.NODES'
P value = 3.14e-15 (t-test), Q value = 1.5e-12
Table S16. Gene #17: '19q gain mutation analysis' versus Clinical Feature #11: 'NUMBER.OF.LYMPH.NODES'
| nPatients | Mean (Std.Dev) | |
|---|---|---|
| ALL | 242 | 2.8 (5.1) |
| 19Q GAIN MUTATED | 4 | 0.0 (0.0) |
| 19Q GAIN WILD-TYPE | 238 | 2.8 (5.2) |
Figure S16. Get High-res Image Gene #17: '19q gain mutation analysis' versus Clinical Feature #11: 'NUMBER.OF.LYMPH.NODES'

P value = 3.19e-15 (t-test), Q value = 1.5e-12
Table S17. Gene #18: '20p gain mutation analysis' versus Clinical Feature #11: 'NUMBER.OF.LYMPH.NODES'
| nPatients | Mean (Std.Dev) | |
|---|---|---|
| ALL | 242 | 2.8 (5.1) |
| 20P GAIN MUTATED | 3 | 0.0 (0.0) |
| 20P GAIN WILD-TYPE | 239 | 2.8 (5.1) |
Figure S17. Get High-res Image Gene #18: '20p gain mutation analysis' versus Clinical Feature #11: 'NUMBER.OF.LYMPH.NODES'

P value = 3.19e-15 (t-test), Q value = 1.5e-12
Table S18. Gene #19: '20q gain mutation analysis' versus Clinical Feature #11: 'NUMBER.OF.LYMPH.NODES'
| nPatients | Mean (Std.Dev) | |
|---|---|---|
| ALL | 242 | 2.8 (5.1) |
| 20Q GAIN MUTATED | 3 | 0.0 (0.0) |
| 20Q GAIN WILD-TYPE | 239 | 2.8 (5.1) |
Figure S18. Get High-res Image Gene #19: '20q gain mutation analysis' versus Clinical Feature #11: 'NUMBER.OF.LYMPH.NODES'

P value = 2.97e-15 (t-test), Q value = 1.5e-12
Table S19. Gene #21: '2p loss mutation analysis' versus Clinical Feature #11: 'NUMBER.OF.LYMPH.NODES'
| nPatients | Mean (Std.Dev) | |
|---|---|---|
| ALL | 242 | 2.8 (5.1) |
| 2P LOSS MUTATED | 7 | 0.0 (0.0) |
| 2P LOSS WILD-TYPE | 235 | 2.9 (5.2) |
Figure S19. Get High-res Image Gene #21: '2p loss mutation analysis' versus Clinical Feature #11: 'NUMBER.OF.LYMPH.NODES'

P value = 3.02e-15 (t-test), Q value = 1.5e-12
Table S20. Gene #22: '2q loss mutation analysis' versus Clinical Feature #11: 'NUMBER.OF.LYMPH.NODES'
| nPatients | Mean (Std.Dev) | |
|---|---|---|
| ALL | 242 | 2.8 (5.1) |
| 2Q LOSS MUTATED | 6 | 0.0 (0.0) |
| 2Q LOSS WILD-TYPE | 236 | 2.8 (5.2) |
Figure S20. Get High-res Image Gene #22: '2q loss mutation analysis' versus Clinical Feature #11: 'NUMBER.OF.LYMPH.NODES'

P value = 3.19e-15 (t-test), Q value = 1.5e-12
Table S21. Gene #23: '3q loss mutation analysis' versus Clinical Feature #11: 'NUMBER.OF.LYMPH.NODES'
| nPatients | Mean (Std.Dev) | |
|---|---|---|
| ALL | 242 | 2.8 (5.1) |
| 3Q LOSS MUTATED | 3 | 0.0 (0.0) |
| 3Q LOSS WILD-TYPE | 239 | 2.8 (5.1) |
Figure S21. Get High-res Image Gene #23: '3q loss mutation analysis' versus Clinical Feature #11: 'NUMBER.OF.LYMPH.NODES'
P value = 4.92e-05 (Chi-square test), Q value = 0.023
Table S22. Gene #24: '9p loss mutation analysis' versus Clinical Feature #13: 'NEOPLASM.DISEASESTAGE'
| nPatients | STAGE I | STAGE II | STAGE III | STAGE IVA | STAGE IVC |
|---|---|---|---|---|---|
| ALL | 173 | 33 | 66 | 27 | 3 |
| 9P LOSS MUTATED | 1 | 4 | 0 | 0 | 0 |
| 9P LOSS WILD-TYPE | 172 | 29 | 66 | 27 | 3 |
Figure S22. Get High-res Image Gene #24: '9p loss mutation analysis' versus Clinical Feature #13: 'NEOPLASM.DISEASESTAGE'
P value = 1.14e-05 (Chi-square test), Q value = 0.0054
Table S23. Gene #25: '9q loss mutation analysis' versus Clinical Feature #13: 'NEOPLASM.DISEASESTAGE'
| nPatients | STAGE I | STAGE II | STAGE III | STAGE IVA | STAGE IVC |
|---|---|---|---|---|---|
| ALL | 173 | 33 | 66 | 27 | 3 |
| 9Q LOSS MUTATED | 1 | 5 | 0 | 1 | 0 |
| 9Q LOSS WILD-TYPE | 172 | 28 | 66 | 26 | 3 |
Figure S23. Get High-res Image Gene #25: '9q loss mutation analysis' versus Clinical Feature #13: 'NEOPLASM.DISEASESTAGE'
P value = 3.14e-15 (t-test), Q value = 1.5e-12
Table S24. Gene #28: '11p loss mutation analysis' versus Clinical Feature #11: 'NUMBER.OF.LYMPH.NODES'
| nPatients | Mean (Std.Dev) | |
|---|---|---|
| ALL | 242 | 2.8 (5.1) |
| 11P LOSS MUTATED | 4 | 0.0 (0.0) |
| 11P LOSS WILD-TYPE | 238 | 2.8 (5.2) |
Figure S24. Get High-res Image Gene #28: '11p loss mutation analysis' versus Clinical Feature #11: 'NUMBER.OF.LYMPH.NODES'

P value = 3.08e-15 (t-test), Q value = 1.5e-12
Table S25. Gene #29: '11q loss mutation analysis' versus Clinical Feature #11: 'NUMBER.OF.LYMPH.NODES'
| nPatients | Mean (Std.Dev) | |
|---|---|---|
| ALL | 242 | 2.8 (5.1) |
| 11Q LOSS MUTATED | 5 | 0.0 (0.0) |
| 11Q LOSS WILD-TYPE | 237 | 2.8 (5.2) |
Figure S25. Get High-res Image Gene #29: '11q loss mutation analysis' versus Clinical Feature #11: 'NUMBER.OF.LYMPH.NODES'
P value = 2.91e-15 (t-test), Q value = 1.4e-12
Table S26. Gene #30: '13q loss mutation analysis' versus Clinical Feature #11: 'NUMBER.OF.LYMPH.NODES'
| nPatients | Mean (Std.Dev) | |
|---|---|---|
| ALL | 242 | 2.8 (5.1) |
| 13Q LOSS MUTATED | 8 | 0.0 (0.0) |
| 13Q LOSS WILD-TYPE | 234 | 2.9 (5.2) |
Figure S26. Get High-res Image Gene #30: '13q loss mutation analysis' versus Clinical Feature #11: 'NUMBER.OF.LYMPH.NODES'

P value = 3.19e-15 (t-test), Q value = 1.5e-12
Table S27. Gene #31: '15q loss mutation analysis' versus Clinical Feature #11: 'NUMBER.OF.LYMPH.NODES'
| nPatients | Mean (Std.Dev) | |
|---|---|---|
| ALL | 242 | 2.8 (5.1) |
| 15Q LOSS MUTATED | 3 | 0.0 (0.0) |
| 15Q LOSS WILD-TYPE | 239 | 2.8 (5.1) |
Figure S27. Get High-res Image Gene #31: '15q loss mutation analysis' versus Clinical Feature #11: 'NUMBER.OF.LYMPH.NODES'

-
Mutation data file = broad_values_by_arm.mutsig.cluster.txt
-
Clinical data file = THCA-TP.clin.merged.picked.txt
-
Number of patients = 303
-
Number of significantly arm-level cnvs = 36
-
Number of selected clinical features = 15
-
Exclude genes that fewer than K tumors have mutations, K = 3
For survival clinical features, the Kaplan-Meier survival curves of tumors with and without gene mutations were plotted and the statistical significance P values were estimated by logrank test (Bland and Altman 2004) using the 'survdiff' function in R
For continuous numerical clinical features, two-tailed Student's t test with unequal variance (Lehmann and Romano 2005) was applied to compare the clinical values between tumors with and without gene mutations using 't.test' function in R
For binary or multi-class clinical features (nominal or ordinal), two-tailed Fisher's exact tests (Fisher 1922) were used to estimate the P values using the 'fisher.test' function in R
For multi-class clinical features (nominal or ordinal), Chi-square tests (Greenwood and Nikulin 1996) were used to estimate the P values using the 'chisq.test' function in R
For multiple hypothesis correction, Q value is the False Discovery Rate (FDR) analogue of the P value (Benjamini and Hochberg 1995), defined as the minimum FDR at which the test may be called significant. We used the 'Benjamini and Hochberg' method of 'p.adjust' function in R to convert P values into Q values.
This is an experimental feature. The full results of the analysis summarized in this report can be downloaded from the TCGA Data Coordination Center.