(primary solid tumor cohort)
This pipeline computes the correlation between significant arm-level copy number variations (cnvs) and subtypes.
Testing the association between copy number variation 42 arm-level results and 8 molecular subtypes across 432 patients, 95 significant findings detected with Q value < 0.25.
-
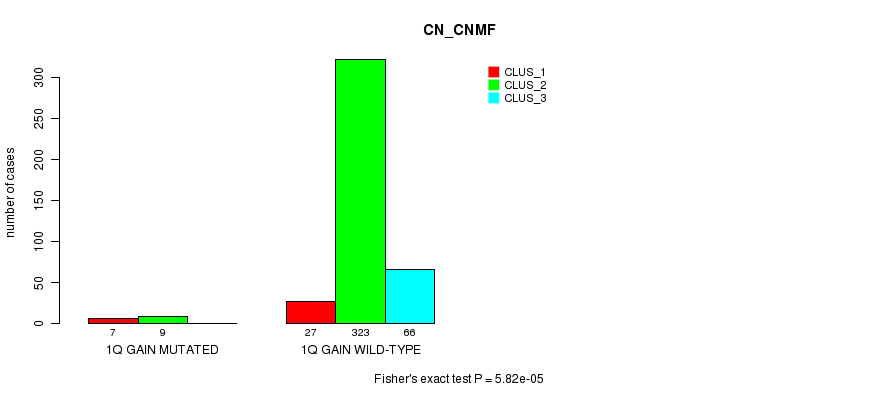
1q gain cnv correlated to 'CN_CNMF'.
-
4p gain cnv correlated to 'CN_CNMF'.
-
4q gain cnv correlated to 'CN_CNMF'.
-
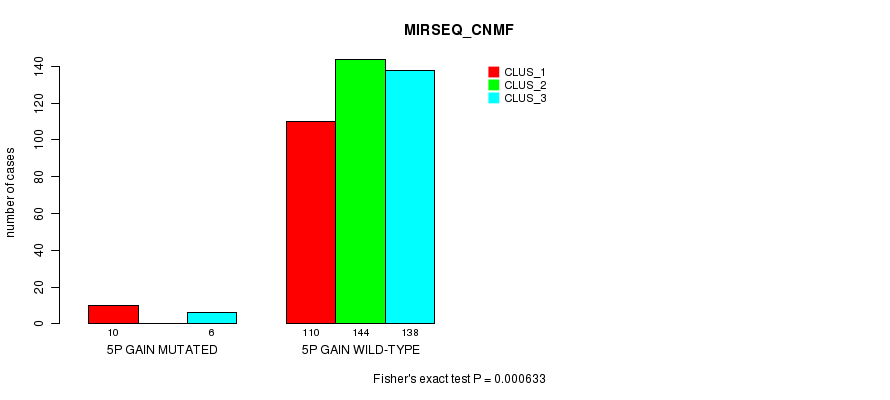
5p gain cnv correlated to 'CN_CNMF', 'MIRSEQ_CNMF', and 'MIRSEQ_CHIERARCHICAL'.
-
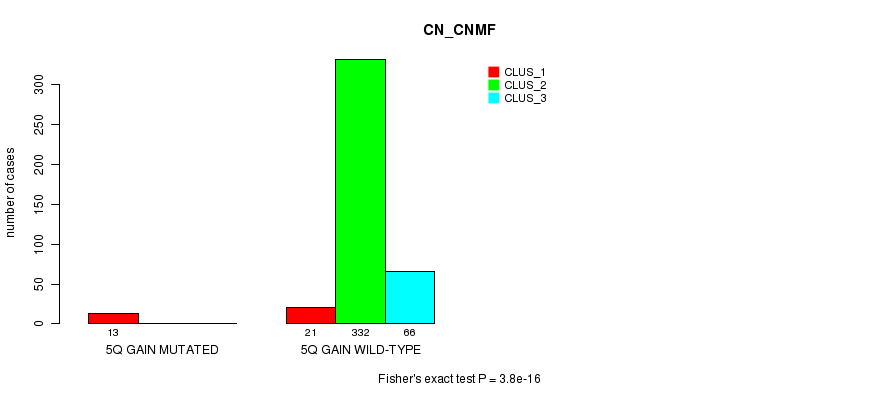
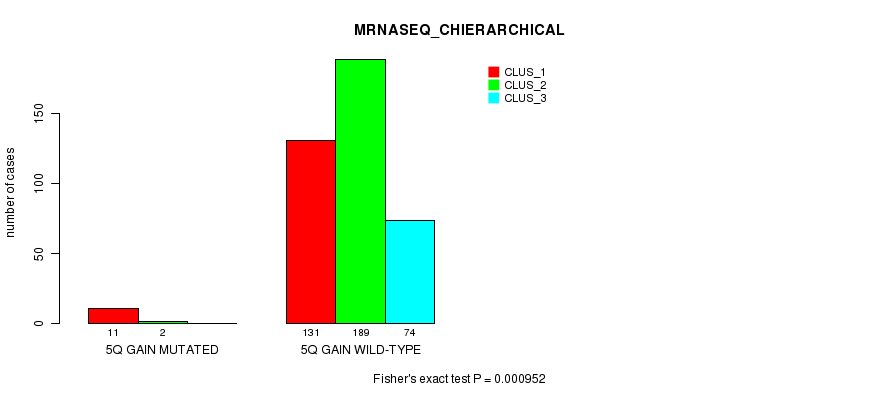
5q gain cnv correlated to 'CN_CNMF', 'METHLYATION_CNMF', 'MRNASEQ_CNMF', 'MRNASEQ_CHIERARCHICAL', 'MIRSEQ_CNMF', and 'MIRSEQ_CHIERARCHICAL'.
-
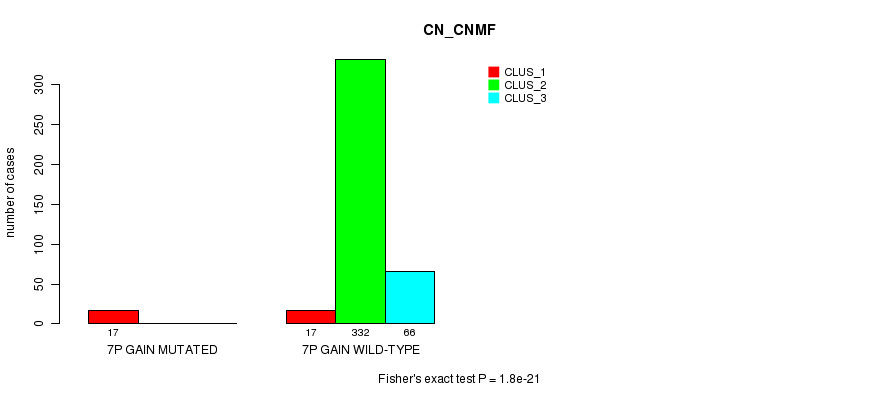
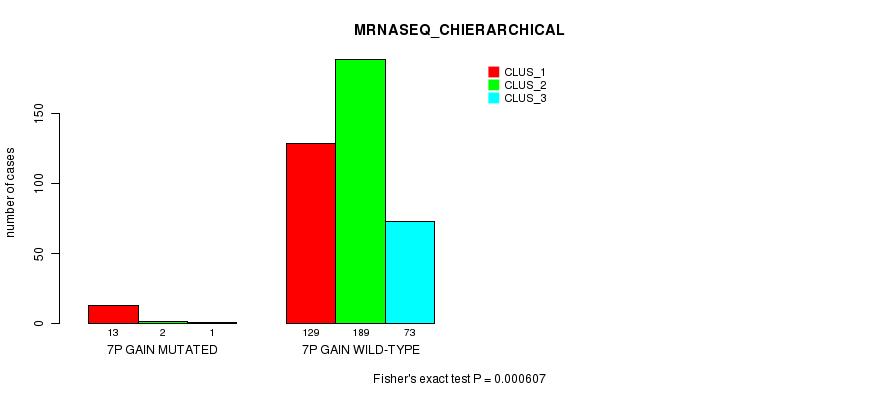
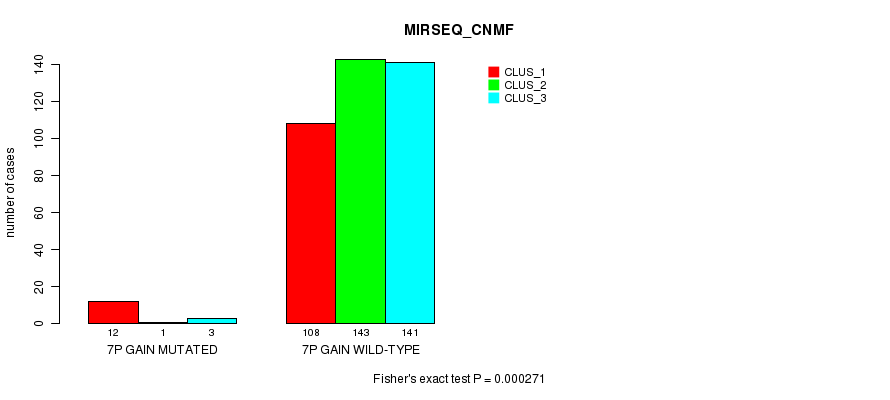
7p gain cnv correlated to 'CN_CNMF', 'METHLYATION_CNMF', 'MRNASEQ_CNMF', 'MRNASEQ_CHIERARCHICAL', 'MIRSEQ_CNMF', and 'MIRSEQ_CHIERARCHICAL'.
-
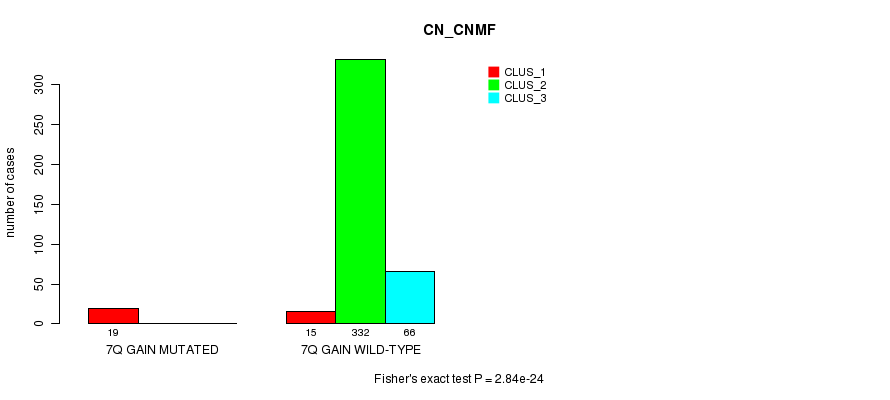
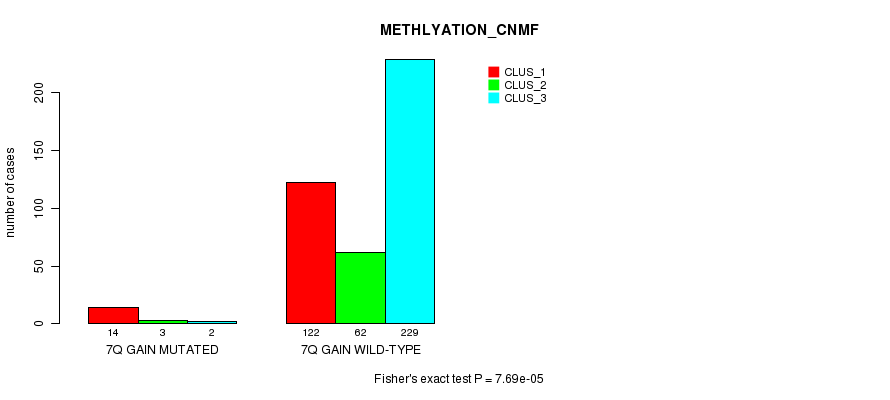
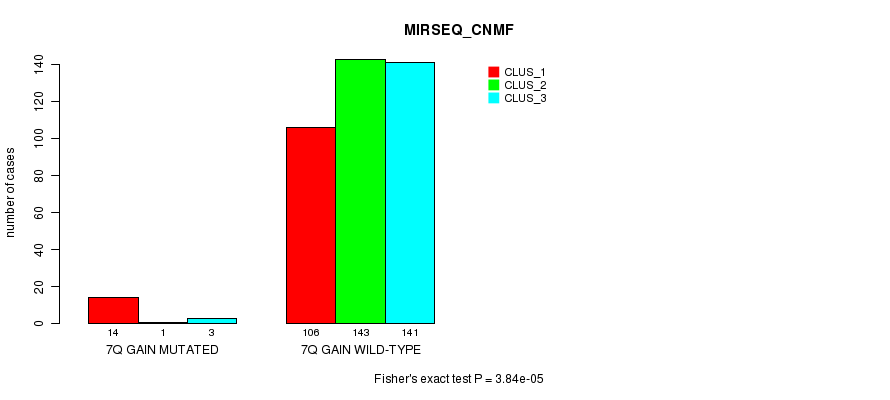
7q gain cnv correlated to 'CN_CNMF', 'METHLYATION_CNMF', 'MRNASEQ_CNMF', 'MRNASEQ_CHIERARCHICAL', 'MIRSEQ_CNMF', and 'MIRSEQ_CHIERARCHICAL'.
-
11q gain cnv correlated to 'CN_CNMF'.
-
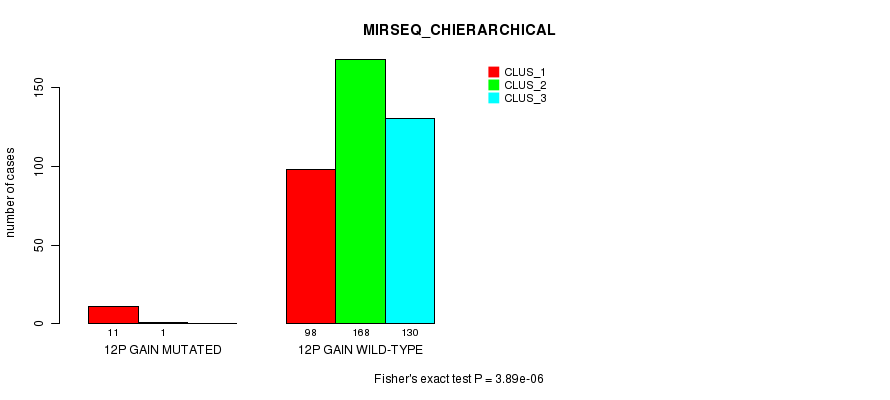
12p gain cnv correlated to 'CN_CNMF', 'METHLYATION_CNMF', 'MRNASEQ_CNMF', 'MRNASEQ_CHIERARCHICAL', 'MIRSEQ_CNMF', and 'MIRSEQ_CHIERARCHICAL'.
-
12q gain cnv correlated to 'CN_CNMF', 'METHLYATION_CNMF', 'MRNASEQ_CNMF', 'MRNASEQ_CHIERARCHICAL', 'MIRSEQ_CNMF', and 'MIRSEQ_CHIERARCHICAL'.
-
14q gain cnv correlated to 'CN_CNMF' and 'METHLYATION_CNMF'.
-
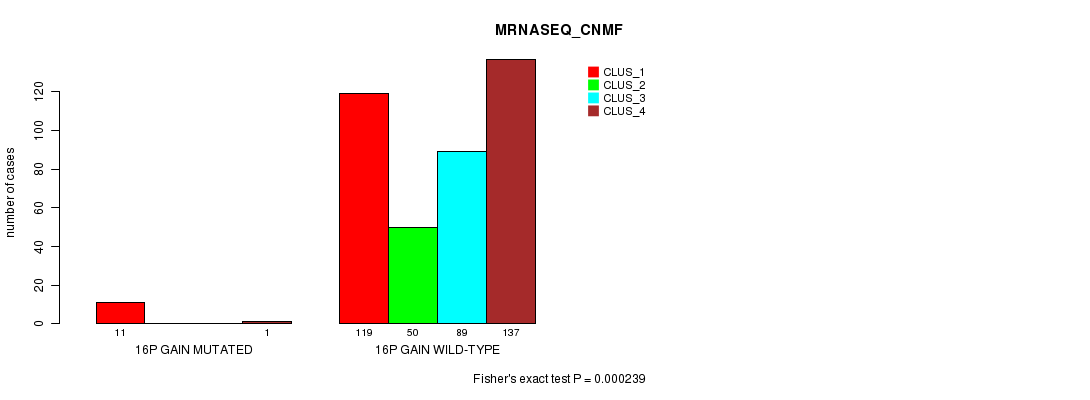
16p gain cnv correlated to 'CN_CNMF', 'METHLYATION_CNMF', 'MRNASEQ_CNMF', 'MRNASEQ_CHIERARCHICAL', 'MIRSEQ_CNMF', and 'MIRSEQ_CHIERARCHICAL'.
-
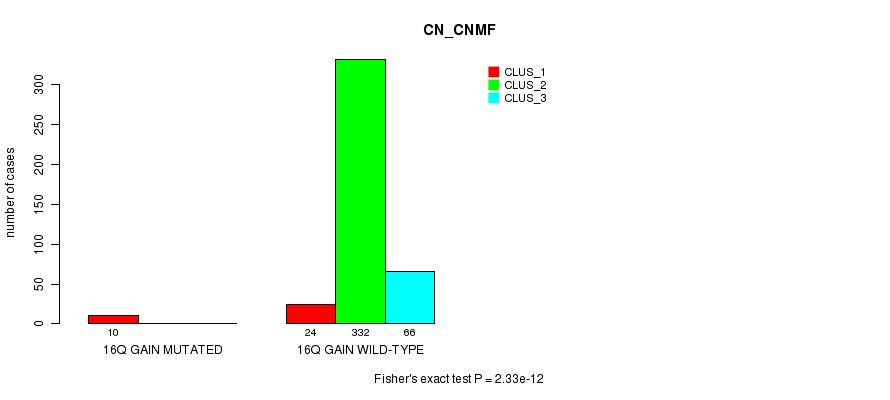
16q gain cnv correlated to 'CN_CNMF', 'METHLYATION_CNMF', and 'MIRSEQ_CHIERARCHICAL'.
-
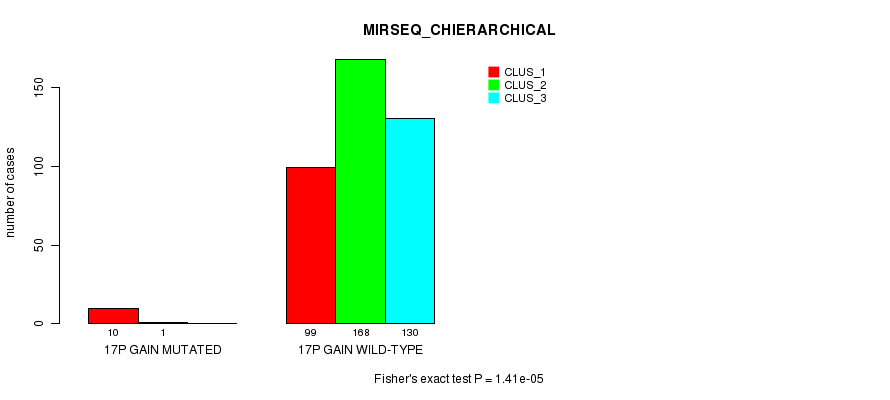
17p gain cnv correlated to 'CN_CNMF', 'METHLYATION_CNMF', 'MRNASEQ_CNMF', 'MRNASEQ_CHIERARCHICAL', 'MIRSEQ_CNMF', and 'MIRSEQ_CHIERARCHICAL'.
-
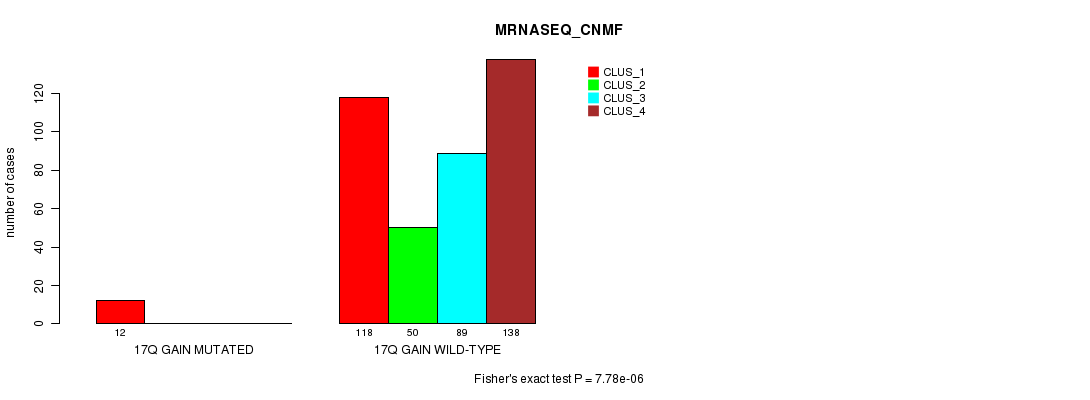
17q gain cnv correlated to 'CN_CNMF', 'METHLYATION_CNMF', 'MRNASEQ_CNMF', 'MRNASEQ_CHIERARCHICAL', 'MIRSEQ_CNMF', and 'MIRSEQ_CHIERARCHICAL'.
-
19p gain cnv correlated to 'CN_CNMF'.
-
19q gain cnv correlated to 'CN_CNMF'.
-
20p gain cnv correlated to 'CN_CNMF'.
-
20q gain cnv correlated to 'CN_CNMF'.
-
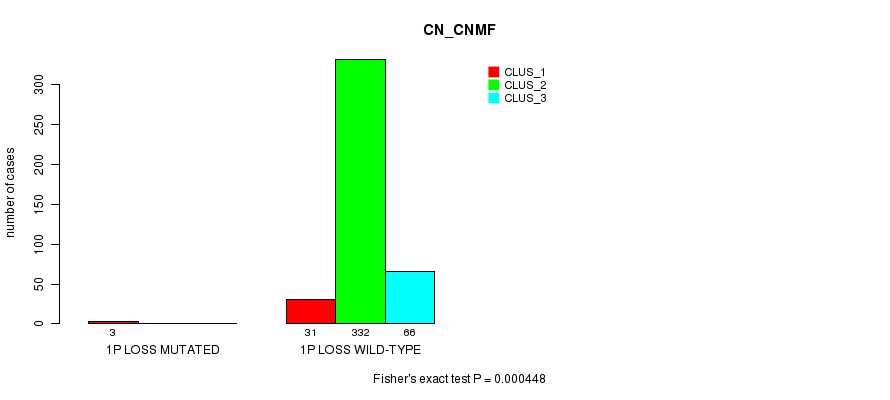
1p loss cnv correlated to 'CN_CNMF'.
-
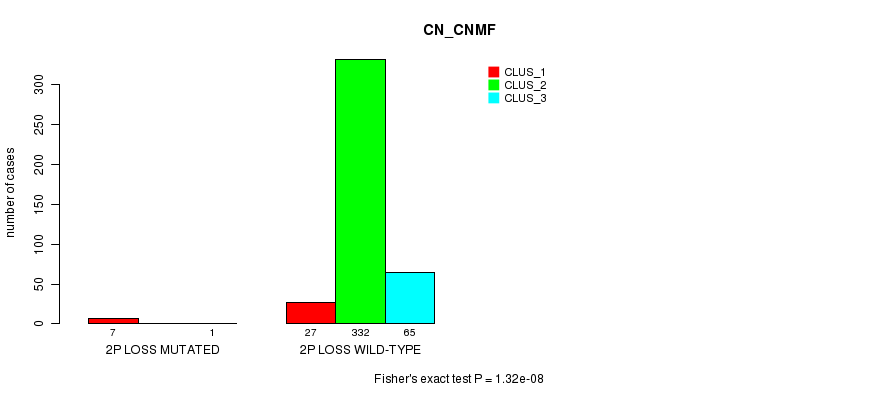
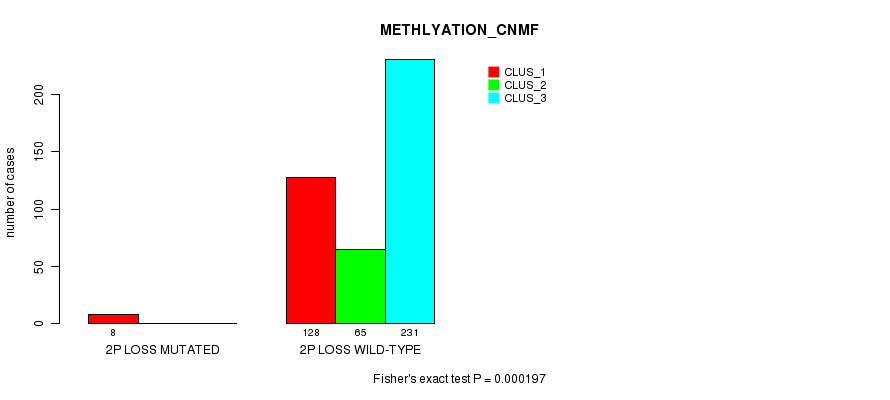
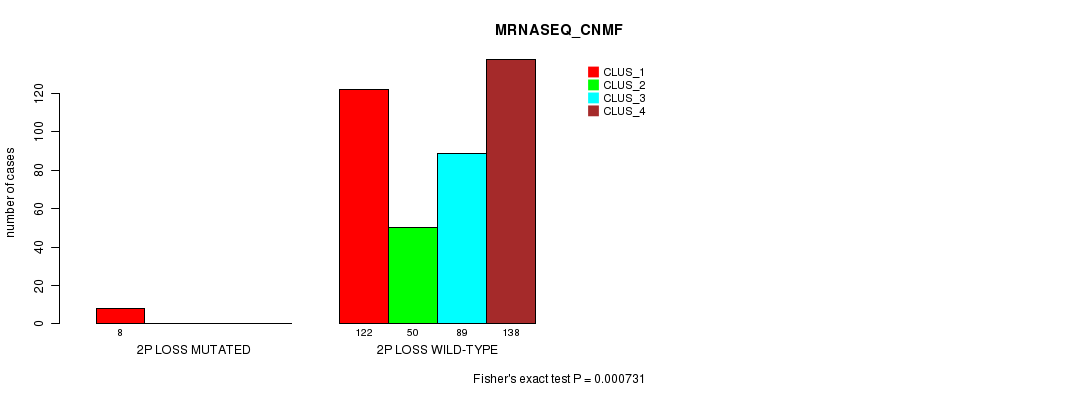
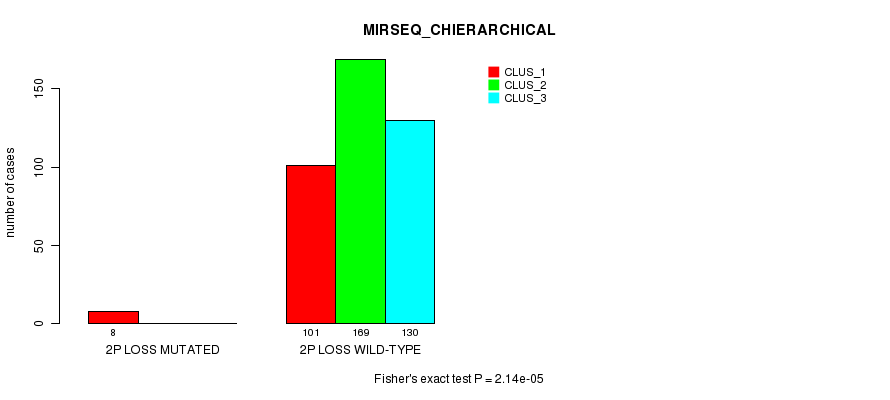
2p loss cnv correlated to 'CN_CNMF', 'METHLYATION_CNMF', 'MRNASEQ_CNMF', 'MRNASEQ_CHIERARCHICAL', 'MIRSEQ_CNMF', and 'MIRSEQ_CHIERARCHICAL'.
-
2q loss cnv correlated to 'CN_CNMF', 'METHLYATION_CNMF', 'MIRSEQ_CNMF', and 'MIRSEQ_CHIERARCHICAL'.
-
3q loss cnv correlated to 'CN_CNMF'.
-
8p loss cnv correlated to 'CN_CNMF'.
-
8q loss cnv correlated to 'CN_CNMF'.
-
9p loss cnv correlated to 'CN_CNMF'.
-
9q loss cnv correlated to 'CN_CNMF'.
-
10p loss cnv correlated to 'CN_CNMF'.
-
10q loss cnv correlated to 'CN_CNMF'.
-
11p loss cnv correlated to 'CN_CNMF'.
-
11q loss cnv correlated to 'CN_CNMF'.
-
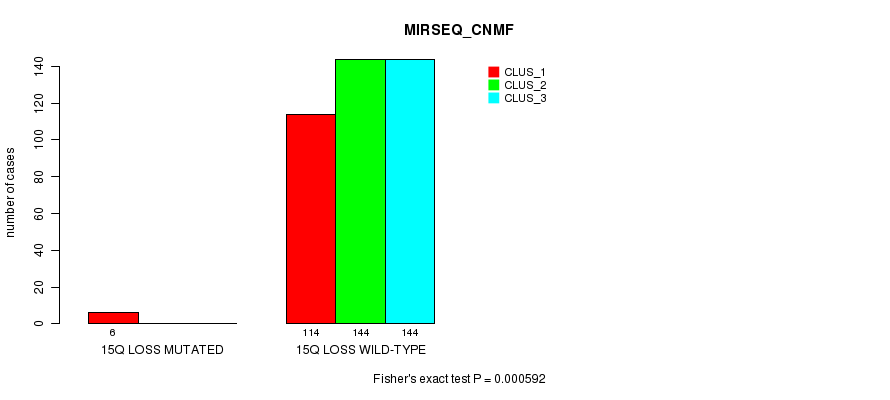
15q loss cnv correlated to 'CN_CNMF', 'MIRSEQ_CNMF', and 'MIRSEQ_CHIERARCHICAL'.
-
18p loss cnv correlated to 'CN_CNMF'.
-
18q loss cnv correlated to 'CN_CNMF'.
-
21q loss cnv correlated to 'CN_CNMF'.
-
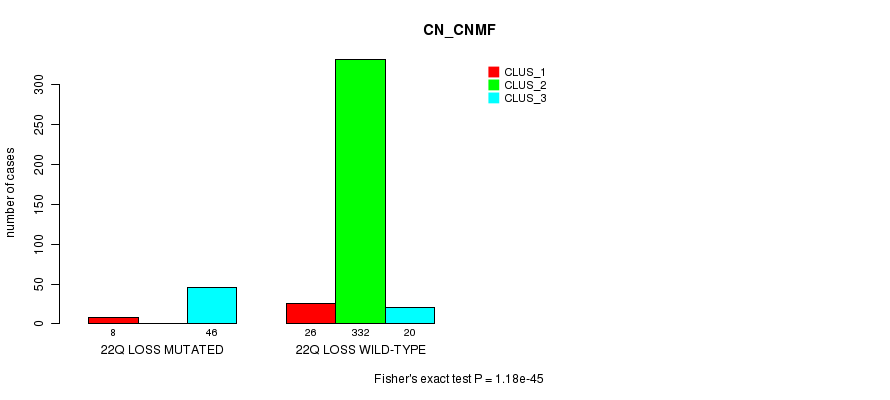
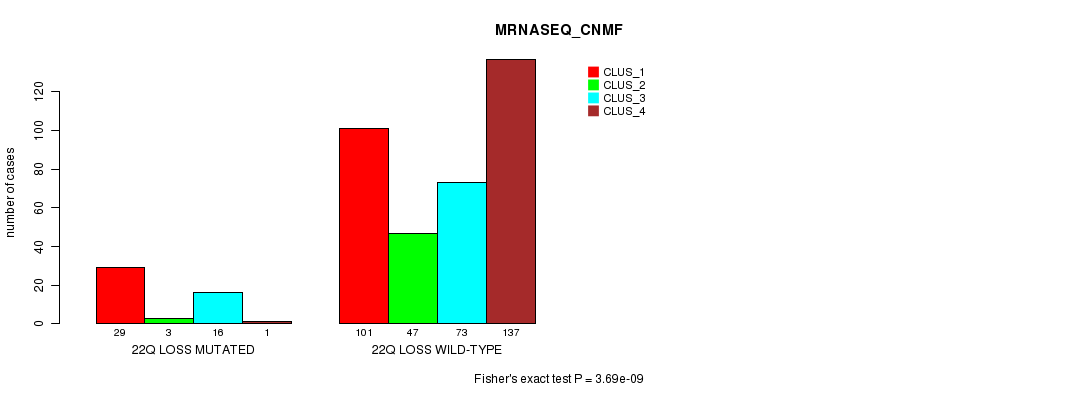
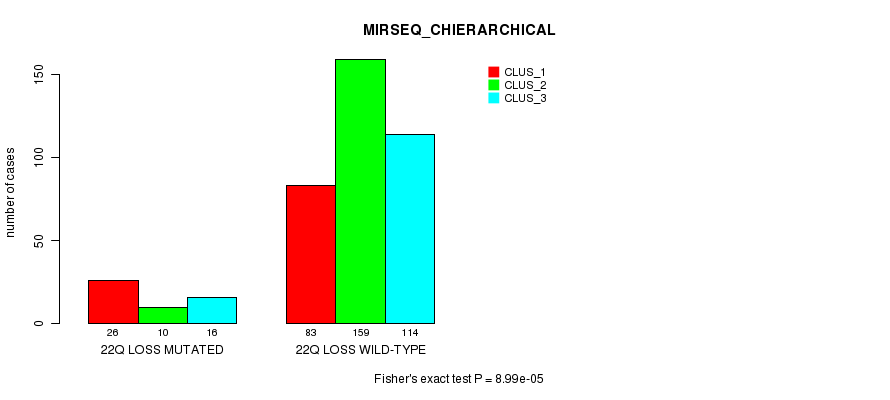
22q loss cnv correlated to 'CN_CNMF', 'MRNASEQ_CNMF', 'MRNASEQ_CHIERARCHICAL', 'MIRSEQ_CNMF', and 'MIRSEQ_CHIERARCHICAL'.
Table 1. Get Full Table Overview of the association between significant copy number variation of 42 arm-level results and 8 molecular subtypes. Shown in the table are P values (Q values). Thresholded by Q value < 0.25, 95 significant findings detected.
|
Molecular subtypes |
CN CNMF |
METHLYATION CNMF |
RPPA CNMF |
RPPA CHIERARCHICAL |
MRNASEQ CNMF |
MRNASEQ CHIERARCHICAL |
MIRSEQ CNMF |
MIRSEQ CHIERARCHICAL |
||
| nCNV (%) | nWild-Type | Fisher's exact test | Fisher's exact test | Fisher's exact test | Fisher's exact test | Fisher's exact test | Fisher's exact test | Fisher's exact test | Fisher's exact test | |
| 5q gain | 13 (3%) | 419 |
3.8e-16 (1.16e-13) |
0.000147 (0.0363) |
0.901 (1.00) |
0.0299 (1.00) |
0.000812 (0.176) |
0.000952 (0.206) |
0.000192 (0.0467) |
8.84e-05 (0.0222) |
| 7p gain | 17 (4%) | 415 |
1.8e-21 (5.53e-19) |
0.000397 (0.0917) |
1 (1.00) |
0.0129 (1.00) |
0.000704 (0.154) |
0.000607 (0.135) |
0.000271 (0.0652) |
0.000103 (0.0257) |
| 7q gain | 19 (4%) | 413 |
2.84e-24 (8.79e-22) |
7.69e-05 (0.0195) |
0.689 (1.00) |
0.00298 (0.594) |
0.000286 (0.0682) |
0.000176 (0.0429) |
3.84e-05 (0.00996) |
9.67e-06 (0.00267) |
| 12p gain | 12 (3%) | 420 |
5.23e-12 (1.59e-09) |
1.01e-06 (0.000292) |
0.901 (1.00) |
0.0299 (1.00) |
7.78e-06 (0.00217) |
4.91e-06 (0.00138) |
1.46e-05 (0.00401) |
3.89e-06 (0.00111) |
| 12q gain | 12 (3%) | 420 |
5.23e-12 (1.59e-09) |
1.01e-06 (0.000292) |
0.901 (1.00) |
0.0299 (1.00) |
7.78e-06 (0.00217) |
4.91e-06 (0.00138) |
1.46e-05 (0.00401) |
3.89e-06 (0.00111) |
| 16p gain | 12 (3%) | 420 |
2.57e-13 (7.84e-11) |
4.7e-05 (0.0121) |
1 (1.00) |
0.0445 (1.00) |
0.000239 (0.0577) |
0.000167 (0.0411) |
0.000137 (0.0341) |
5.08e-05 (0.013) |
| 17p gain | 11 (3%) | 421 |
1.04e-07 (3.05e-05) |
4.25e-06 (0.0012) |
0.772 (1.00) |
0.0179 (1.00) |
1.83e-05 (0.00495) |
1.93e-05 (0.0052) |
4.67e-05 (0.0121) |
1.41e-05 (0.00387) |
| 17q gain | 12 (3%) | 420 |
7.49e-08 (2.2e-05) |
1.01e-06 (0.000292) |
0.795 (1.00) |
0.0206 (1.00) |
7.78e-06 (0.00217) |
4.91e-06 (0.00138) |
1.46e-05 (0.00401) |
3.89e-06 (0.00111) |
| 2p loss | 8 (2%) | 424 |
1.32e-08 (3.91e-06) |
0.000197 (0.0478) |
1 (1.00) |
0.0817 (1.00) |
0.000731 (0.159) |
0.000334 (0.0775) |
4.73e-05 (0.0121) |
2.14e-05 (0.00575) |
| 22q loss | 54 (12%) | 378 |
1.18e-45 (3.64e-43) |
0.00135 (0.286) |
0.114 (1.00) |
0.0835 (1.00) |
3.69e-09 (1.1e-06) |
2.07e-07 (6.01e-05) |
0.000284 (0.0679) |
8.99e-05 (0.0225) |
| 2q loss | 7 (2%) | 425 |
1.01e-08 (3e-06) |
0.000476 (0.108) |
0.837 (1.00) |
0.0549 (1.00) |
0.00213 (0.433) |
0.00122 (0.261) |
0.000168 (0.0411) |
8.4e-05 (0.0212) |
| 5p gain | 16 (4%) | 416 |
1.4e-17 (4.28e-15) |
0.00411 (0.806) |
1 (1.00) |
0.125 (1.00) |
0.00945 (1.00) |
0.01 (1.00) |
0.000633 (0.14) |
0.000544 (0.122) |
| 16q gain | 10 (2%) | 422 |
2.33e-12 (7.1e-10) |
0.000314 (0.0735) |
0.856 (1.00) |
0.129 (1.00) |
0.00204 (0.421) |
0.00146 (0.309) |
0.00165 (0.346) |
0.000643 (0.142) |
| 15q loss | 6 (1%) | 426 |
0.000556 (0.125) |
0.0112 (1.00) |
0.458 (1.00) |
0.256 (1.00) |
0.0173 (1.00) |
0.00933 (1.00) |
0.000592 (0.132) |
0.000328 (0.0764) |
| 14q gain | 7 (2%) | 425 |
1.77e-07 (5.18e-05) |
0.000476 (0.108) |
1 (1.00) |
0.256 (1.00) |
0.00213 (0.433) |
0.00122 (0.261) |
0.00437 (0.853) |
0.00209 (0.426) |
| 1q gain | 16 (4%) | 416 |
5.82e-05 (0.0148) |
0.255 (1.00) |
0.0153 (1.00) |
0.0826 (1.00) |
0.0325 (1.00) |
0.0233 (1.00) |
0.136 (1.00) |
0.0514 (1.00) |
| 4p gain | 4 (1%) | 428 |
3.24e-05 (0.00862) |
0.0212 (1.00) |
0.0371 (1.00) |
0.0346 (1.00) |
0.109 (1.00) |
0.0989 (1.00) |
||
| 4q gain | 4 (1%) | 428 |
3.24e-05 (0.00862) |
0.0212 (1.00) |
0.0371 (1.00) |
0.0346 (1.00) |
0.109 (1.00) |
0.0989 (1.00) |
||
| 11q gain | 4 (1%) | 428 |
0.000308 (0.0731) |
0.0212 (1.00) |
0.0371 (1.00) |
0.0346 (1.00) |
0.00722 (1.00) |
0.00489 (0.944) |
||
| 19p gain | 3 (1%) | 429 |
0.000448 (0.103) |
0.0552 (1.00) |
0.101 (1.00) |
0.0821 (1.00) |
0.025 (1.00) |
0.0187 (1.00) |
||
| 19q gain | 4 (1%) | 428 |
3.24e-05 (0.00862) |
0.0212 (1.00) |
0.636 (1.00) |
0.0551 (1.00) |
0.0371 (1.00) |
0.0346 (1.00) |
0.00722 (1.00) |
0.00489 (0.944) |
| 20p gain | 8 (2%) | 424 |
6.44e-10 (1.93e-07) |
0.00221 (0.445) |
1 (1.00) |
0.0817 (1.00) |
0.0134 (1.00) |
0.0136 (1.00) |
0.0122 (1.00) |
0.00562 (1.00) |
| 20q gain | 8 (2%) | 424 |
6.44e-10 (1.93e-07) |
0.00221 (0.445) |
1 (1.00) |
0.0817 (1.00) |
0.0134 (1.00) |
0.0136 (1.00) |
0.0122 (1.00) |
0.00562 (1.00) |
| 1p loss | 3 (1%) | 429 |
0.000448 (0.103) |
0.729 (1.00) |
0.487 (1.00) |
0.195 (1.00) |
0.295 (1.00) |
0.359 (1.00) |
||
| 3q loss | 3 (1%) | 429 |
0.000448 (0.103) |
0.0552 (1.00) |
0.101 (1.00) |
0.0821 (1.00) |
0.025 (1.00) |
0.0187 (1.00) |
||
| 8p loss | 4 (1%) | 428 |
3.24e-05 (0.00862) |
0.0532 (1.00) |
0.0371 (1.00) |
0.0346 (1.00) |
0.00722 (1.00) |
0.00489 (0.944) |
||
| 8q loss | 4 (1%) | 428 |
3.24e-05 (0.00862) |
0.0532 (1.00) |
0.0371 (1.00) |
0.0346 (1.00) |
0.00722 (1.00) |
0.00489 (0.944) |
||
| 9p loss | 10 (2%) | 422 |
3.74e-10 (1.12e-07) |
0.609 (1.00) |
0.559 (1.00) |
0.206 (1.00) |
0.249 (1.00) |
0.527 (1.00) |
0.182 (1.00) |
0.143 (1.00) |
| 9q loss | 14 (3%) | 418 |
8.23e-11 (2.48e-08) |
0.212 (1.00) |
0.21 (1.00) |
0.00441 (0.855) |
0.441 (1.00) |
0.823 (1.00) |
0.193 (1.00) |
0.256 (1.00) |
| 10p loss | 4 (1%) | 428 |
3.24e-05 (0.00862) |
0.473 (1.00) |
0.242 (1.00) |
0.0893 (1.00) |
0.109 (1.00) |
0.0989 (1.00) |
||
| 10q loss | 4 (1%) | 428 |
3.24e-05 (0.00862) |
0.473 (1.00) |
0.242 (1.00) |
0.0893 (1.00) |
0.109 (1.00) |
0.0989 (1.00) |
||
| 11p loss | 5 (1%) | 427 |
2.27e-06 (0.000652) |
0.0689 (1.00) |
0.499 (1.00) |
1 (1.00) |
0.0495 (1.00) |
0.166 (1.00) |
0.0383 (1.00) |
0.0225 (1.00) |
| 11q loss | 6 (1%) | 426 |
2.33e-05 (0.00624) |
0.024 (1.00) |
0.388 (1.00) |
0.798 (1.00) |
0.0186 (1.00) |
0.0672 (1.00) |
0.0131 (1.00) |
0.00695 (1.00) |
| 18p loss | 4 (1%) | 428 |
0.000308 (0.0731) |
0.204 (1.00) |
1 (1.00) |
0.369 (1.00) |
0.242 (1.00) |
0.0893 (1.00) |
0.109 (1.00) |
0.0389 (1.00) |
| 18q loss | 4 (1%) | 428 |
0.000308 (0.0731) |
0.204 (1.00) |
1 (1.00) |
0.369 (1.00) |
0.242 (1.00) |
0.0893 (1.00) |
0.109 (1.00) |
0.0389 (1.00) |
| 21q loss | 5 (1%) | 427 |
2.73e-05 (0.00728) |
0.0225 (1.00) |
0.384 (1.00) |
0.0551 (1.00) |
0.0495 (1.00) |
0.166 (1.00) |
0.0383 (1.00) |
0.0225 (1.00) |
| 11p gain | 5 (1%) | 427 |
0.00181 (0.377) |
0.00503 (0.946) |
0.0173 (1.00) |
0.00933 (1.00) |
0.00207 (0.425) |
0.00127 (0.271) |
||
| 21q gain | 3 (1%) | 429 |
0.00322 (0.635) |
0.0552 (1.00) |
0.101 (1.00) |
0.0821 (1.00) |
0.025 (1.00) |
0.0187 (1.00) |
||
| 6q loss | 3 (1%) | 429 |
0.0261 (1.00) |
0.0552 (1.00) |
0.101 (1.00) |
0.0821 (1.00) |
0.025 (1.00) |
0.0187 (1.00) |
||
| 13q loss | 11 (3%) | 421 |
0.00193 (0.399) |
0.0337 (1.00) |
0.0779 (1.00) |
1 (1.00) |
0.0941 (1.00) |
0.116 (1.00) |
0.0161 (1.00) |
0.00298 (0.594) |
| 17p loss | 7 (2%) | 425 |
0.00165 (0.346) |
1 (1.00) |
1 (1.00) |
1 (1.00) |
0.826 (1.00) |
0.886 (1.00) |
0.112 (1.00) |
0.493 (1.00) |
| 19p loss | 4 (1%) | 428 |
0.23 (1.00) |
0.0212 (1.00) |
0.281 (1.00) |
0.369 (1.00) |
0.0371 (1.00) |
0.0346 (1.00) |
0.00722 (1.00) |
0.00489 (0.944) |
P value = 5.82e-05 (Fisher's exact test), Q value = 0.015
Table S1. Gene #1: '1q gain mutation analysis' versus Clinical Feature #1: 'CN_CNMF'
| nPatients | CLUS_1 | CLUS_2 | CLUS_3 |
|---|---|---|---|
| ALL | 34 | 332 | 66 |
| 1Q GAIN MUTATED | 7 | 9 | 0 |
| 1Q GAIN WILD-TYPE | 27 | 323 | 66 |
Figure S1. Get High-res Image Gene #1: '1q gain mutation analysis' versus Clinical Feature #1: 'CN_CNMF'
P value = 3.24e-05 (Fisher's exact test), Q value = 0.0086
Table S2. Gene #2: '4p gain mutation analysis' versus Clinical Feature #1: 'CN_CNMF'
| nPatients | CLUS_1 | CLUS_2 | CLUS_3 |
|---|---|---|---|
| ALL | 34 | 332 | 66 |
| 4P GAIN MUTATED | 4 | 0 | 0 |
| 4P GAIN WILD-TYPE | 30 | 332 | 66 |
Figure S2. Get High-res Image Gene #2: '4p gain mutation analysis' versus Clinical Feature #1: 'CN_CNMF'

P value = 3.24e-05 (Fisher's exact test), Q value = 0.0086
Table S3. Gene #3: '4q gain mutation analysis' versus Clinical Feature #1: 'CN_CNMF'
| nPatients | CLUS_1 | CLUS_2 | CLUS_3 |
|---|---|---|---|
| ALL | 34 | 332 | 66 |
| 4Q GAIN MUTATED | 4 | 0 | 0 |
| 4Q GAIN WILD-TYPE | 30 | 332 | 66 |
Figure S3. Get High-res Image Gene #3: '4q gain mutation analysis' versus Clinical Feature #1: 'CN_CNMF'

P value = 1.4e-17 (Fisher's exact test), Q value = 4.3e-15
Table S4. Gene #4: '5p gain mutation analysis' versus Clinical Feature #1: 'CN_CNMF'
| nPatients | CLUS_1 | CLUS_2 | CLUS_3 |
|---|---|---|---|
| ALL | 34 | 332 | 66 |
| 5P GAIN MUTATED | 15 | 1 | 0 |
| 5P GAIN WILD-TYPE | 19 | 331 | 66 |
Figure S4. Get High-res Image Gene #4: '5p gain mutation analysis' versus Clinical Feature #1: 'CN_CNMF'

P value = 0.000633 (Fisher's exact test), Q value = 0.14
Table S5. Gene #4: '5p gain mutation analysis' versus Clinical Feature #7: 'MIRSEQ_CNMF'
| nPatients | CLUS_1 | CLUS_2 | CLUS_3 |
|---|---|---|---|
| ALL | 120 | 144 | 144 |
| 5P GAIN MUTATED | 10 | 0 | 6 |
| 5P GAIN WILD-TYPE | 110 | 144 | 138 |
Figure S5. Get High-res Image Gene #4: '5p gain mutation analysis' versus Clinical Feature #7: 'MIRSEQ_CNMF'
P value = 0.000544 (Fisher's exact test), Q value = 0.12
Table S6. Gene #4: '5p gain mutation analysis' versus Clinical Feature #8: 'MIRSEQ_CHIERARCHICAL'
| nPatients | CLUS_1 | CLUS_2 | CLUS_3 |
|---|---|---|---|
| ALL | 109 | 169 | 130 |
| 5P GAIN MUTATED | 10 | 6 | 0 |
| 5P GAIN WILD-TYPE | 99 | 163 | 130 |
Figure S6. Get High-res Image Gene #4: '5p gain mutation analysis' versus Clinical Feature #8: 'MIRSEQ_CHIERARCHICAL'

P value = 3.8e-16 (Fisher's exact test), Q value = 1.2e-13
Table S7. Gene #5: '5q gain mutation analysis' versus Clinical Feature #1: 'CN_CNMF'
| nPatients | CLUS_1 | CLUS_2 | CLUS_3 |
|---|---|---|---|
| ALL | 34 | 332 | 66 |
| 5Q GAIN MUTATED | 13 | 0 | 0 |
| 5Q GAIN WILD-TYPE | 21 | 332 | 66 |
Figure S7. Get High-res Image Gene #5: '5q gain mutation analysis' versus Clinical Feature #1: 'CN_CNMF'
P value = 0.000147 (Fisher's exact test), Q value = 0.036
Table S8. Gene #5: '5q gain mutation analysis' versus Clinical Feature #2: 'METHLYATION_CNMF'
| nPatients | CLUS_1 | CLUS_2 | CLUS_3 |
|---|---|---|---|
| ALL | 136 | 65 | 231 |
| 5Q GAIN MUTATED | 11 | 1 | 1 |
| 5Q GAIN WILD-TYPE | 125 | 64 | 230 |
Figure S8. Get High-res Image Gene #5: '5q gain mutation analysis' versus Clinical Feature #2: 'METHLYATION_CNMF'

P value = 0.000812 (Fisher's exact test), Q value = 0.18
Table S9. Gene #5: '5q gain mutation analysis' versus Clinical Feature #5: 'MRNASEQ_CNMF'
| nPatients | CLUS_1 | CLUS_2 | CLUS_3 | CLUS_4 |
|---|---|---|---|---|
| ALL | 130 | 50 | 89 | 138 |
| 5Q GAIN MUTATED | 11 | 0 | 0 | 2 |
| 5Q GAIN WILD-TYPE | 119 | 50 | 89 | 136 |
Figure S9. Get High-res Image Gene #5: '5q gain mutation analysis' versus Clinical Feature #5: 'MRNASEQ_CNMF'

P value = 0.000952 (Fisher's exact test), Q value = 0.21
Table S10. Gene #5: '5q gain mutation analysis' versus Clinical Feature #6: 'MRNASEQ_CHIERARCHICAL'
| nPatients | CLUS_1 | CLUS_2 | CLUS_3 |
|---|---|---|---|
| ALL | 142 | 191 | 74 |
| 5Q GAIN MUTATED | 11 | 2 | 0 |
| 5Q GAIN WILD-TYPE | 131 | 189 | 74 |
Figure S10. Get High-res Image Gene #5: '5q gain mutation analysis' versus Clinical Feature #6: 'MRNASEQ_CHIERARCHICAL'
P value = 0.000192 (Fisher's exact test), Q value = 0.047
Table S11. Gene #5: '5q gain mutation analysis' versus Clinical Feature #7: 'MIRSEQ_CNMF'
| nPatients | CLUS_1 | CLUS_2 | CLUS_3 |
|---|---|---|---|
| ALL | 120 | 144 | 144 |
| 5Q GAIN MUTATED | 10 | 0 | 3 |
| 5Q GAIN WILD-TYPE | 110 | 144 | 141 |
Figure S11. Get High-res Image Gene #5: '5q gain mutation analysis' versus Clinical Feature #7: 'MIRSEQ_CNMF'

P value = 8.84e-05 (Fisher's exact test), Q value = 0.022
Table S12. Gene #5: '5q gain mutation analysis' versus Clinical Feature #8: 'MIRSEQ_CHIERARCHICAL'
| nPatients | CLUS_1 | CLUS_2 | CLUS_3 |
|---|---|---|---|
| ALL | 109 | 169 | 130 |
| 5Q GAIN MUTATED | 10 | 3 | 0 |
| 5Q GAIN WILD-TYPE | 99 | 166 | 130 |
Figure S12. Get High-res Image Gene #5: '5q gain mutation analysis' versus Clinical Feature #8: 'MIRSEQ_CHIERARCHICAL'

P value = 1.8e-21 (Fisher's exact test), Q value = 5.5e-19
Table S13. Gene #6: '7p gain mutation analysis' versus Clinical Feature #1: 'CN_CNMF'
| nPatients | CLUS_1 | CLUS_2 | CLUS_3 |
|---|---|---|---|
| ALL | 34 | 332 | 66 |
| 7P GAIN MUTATED | 17 | 0 | 0 |
| 7P GAIN WILD-TYPE | 17 | 332 | 66 |
Figure S13. Get High-res Image Gene #6: '7p gain mutation analysis' versus Clinical Feature #1: 'CN_CNMF'
P value = 0.000397 (Fisher's exact test), Q value = 0.092
Table S14. Gene #6: '7p gain mutation analysis' versus Clinical Feature #2: 'METHLYATION_CNMF'
| nPatients | CLUS_1 | CLUS_2 | CLUS_3 |
|---|---|---|---|
| ALL | 136 | 65 | 231 |
| 7P GAIN MUTATED | 12 | 3 | 2 |
| 7P GAIN WILD-TYPE | 124 | 62 | 229 |
Figure S14. Get High-res Image Gene #6: '7p gain mutation analysis' versus Clinical Feature #2: 'METHLYATION_CNMF'

P value = 0.000704 (Fisher's exact test), Q value = 0.15
Table S15. Gene #6: '7p gain mutation analysis' versus Clinical Feature #5: 'MRNASEQ_CNMF'
| nPatients | CLUS_1 | CLUS_2 | CLUS_3 | CLUS_4 |
|---|---|---|---|---|
| ALL | 130 | 50 | 89 | 138 |
| 7P GAIN MUTATED | 13 | 0 | 1 | 2 |
| 7P GAIN WILD-TYPE | 117 | 50 | 88 | 136 |
Figure S15. Get High-res Image Gene #6: '7p gain mutation analysis' versus Clinical Feature #5: 'MRNASEQ_CNMF'

P value = 0.000607 (Fisher's exact test), Q value = 0.13
Table S16. Gene #6: '7p gain mutation analysis' versus Clinical Feature #6: 'MRNASEQ_CHIERARCHICAL'
| nPatients | CLUS_1 | CLUS_2 | CLUS_3 |
|---|---|---|---|
| ALL | 142 | 191 | 74 |
| 7P GAIN MUTATED | 13 | 2 | 1 |
| 7P GAIN WILD-TYPE | 129 | 189 | 73 |
Figure S16. Get High-res Image Gene #6: '7p gain mutation analysis' versus Clinical Feature #6: 'MRNASEQ_CHIERARCHICAL'
P value = 0.000271 (Fisher's exact test), Q value = 0.065
Table S17. Gene #6: '7p gain mutation analysis' versus Clinical Feature #7: 'MIRSEQ_CNMF'
| nPatients | CLUS_1 | CLUS_2 | CLUS_3 |
|---|---|---|---|
| ALL | 120 | 144 | 144 |
| 7P GAIN MUTATED | 12 | 1 | 3 |
| 7P GAIN WILD-TYPE | 108 | 143 | 141 |
Figure S17. Get High-res Image Gene #6: '7p gain mutation analysis' versus Clinical Feature #7: 'MIRSEQ_CNMF'
P value = 0.000103 (Fisher's exact test), Q value = 0.026
Table S18. Gene #6: '7p gain mutation analysis' versus Clinical Feature #8: 'MIRSEQ_CHIERARCHICAL'
| nPatients | CLUS_1 | CLUS_2 | CLUS_3 |
|---|---|---|---|
| ALL | 109 | 169 | 130 |
| 7P GAIN MUTATED | 12 | 3 | 1 |
| 7P GAIN WILD-TYPE | 97 | 166 | 129 |
Figure S18. Get High-res Image Gene #6: '7p gain mutation analysis' versus Clinical Feature #8: 'MIRSEQ_CHIERARCHICAL'

P value = 2.84e-24 (Fisher's exact test), Q value = 8.8e-22
Table S19. Gene #7: '7q gain mutation analysis' versus Clinical Feature #1: 'CN_CNMF'
| nPatients | CLUS_1 | CLUS_2 | CLUS_3 |
|---|---|---|---|
| ALL | 34 | 332 | 66 |
| 7Q GAIN MUTATED | 19 | 0 | 0 |
| 7Q GAIN WILD-TYPE | 15 | 332 | 66 |
Figure S19. Get High-res Image Gene #7: '7q gain mutation analysis' versus Clinical Feature #1: 'CN_CNMF'
P value = 7.69e-05 (Fisher's exact test), Q value = 0.019
Table S20. Gene #7: '7q gain mutation analysis' versus Clinical Feature #2: 'METHLYATION_CNMF'
| nPatients | CLUS_1 | CLUS_2 | CLUS_3 |
|---|---|---|---|
| ALL | 136 | 65 | 231 |
| 7Q GAIN MUTATED | 14 | 3 | 2 |
| 7Q GAIN WILD-TYPE | 122 | 62 | 229 |
Figure S20. Get High-res Image Gene #7: '7q gain mutation analysis' versus Clinical Feature #2: 'METHLYATION_CNMF'
P value = 0.000286 (Fisher's exact test), Q value = 0.068
Table S21. Gene #7: '7q gain mutation analysis' versus Clinical Feature #5: 'MRNASEQ_CNMF'
| nPatients | CLUS_1 | CLUS_2 | CLUS_3 | CLUS_4 |
|---|---|---|---|---|
| ALL | 130 | 50 | 89 | 138 |
| 7Q GAIN MUTATED | 14 | 0 | 1 | 2 |
| 7Q GAIN WILD-TYPE | 116 | 50 | 88 | 136 |
Figure S21. Get High-res Image Gene #7: '7q gain mutation analysis' versus Clinical Feature #5: 'MRNASEQ_CNMF'

P value = 0.000176 (Fisher's exact test), Q value = 0.043
Table S22. Gene #7: '7q gain mutation analysis' versus Clinical Feature #6: 'MRNASEQ_CHIERARCHICAL'
| nPatients | CLUS_1 | CLUS_2 | CLUS_3 |
|---|---|---|---|
| ALL | 142 | 191 | 74 |
| 7Q GAIN MUTATED | 14 | 2 | 1 |
| 7Q GAIN WILD-TYPE | 128 | 189 | 73 |
Figure S22. Get High-res Image Gene #7: '7q gain mutation analysis' versus Clinical Feature #6: 'MRNASEQ_CHIERARCHICAL'

P value = 3.84e-05 (Fisher's exact test), Q value = 0.01
Table S23. Gene #7: '7q gain mutation analysis' versus Clinical Feature #7: 'MIRSEQ_CNMF'
| nPatients | CLUS_1 | CLUS_2 | CLUS_3 |
|---|---|---|---|
| ALL | 120 | 144 | 144 |
| 7Q GAIN MUTATED | 14 | 1 | 3 |
| 7Q GAIN WILD-TYPE | 106 | 143 | 141 |
Figure S23. Get High-res Image Gene #7: '7q gain mutation analysis' versus Clinical Feature #7: 'MIRSEQ_CNMF'
P value = 9.67e-06 (Fisher's exact test), Q value = 0.0027
Table S24. Gene #7: '7q gain mutation analysis' versus Clinical Feature #8: 'MIRSEQ_CHIERARCHICAL'
| nPatients | CLUS_1 | CLUS_2 | CLUS_3 |
|---|---|---|---|
| ALL | 109 | 169 | 130 |
| 7Q GAIN MUTATED | 14 | 3 | 1 |
| 7Q GAIN WILD-TYPE | 95 | 166 | 129 |
Figure S24. Get High-res Image Gene #7: '7q gain mutation analysis' versus Clinical Feature #8: 'MIRSEQ_CHIERARCHICAL'

P value = 0.000308 (Fisher's exact test), Q value = 0.073
Table S25. Gene #9: '11q gain mutation analysis' versus Clinical Feature #1: 'CN_CNMF'
| nPatients | CLUS_1 | CLUS_2 | CLUS_3 |
|---|---|---|---|
| ALL | 34 | 332 | 66 |
| 11Q GAIN MUTATED | 3 | 0 | 1 |
| 11Q GAIN WILD-TYPE | 31 | 332 | 65 |
Figure S25. Get High-res Image Gene #9: '11q gain mutation analysis' versus Clinical Feature #1: 'CN_CNMF'

P value = 5.23e-12 (Fisher's exact test), Q value = 1.6e-09
Table S26. Gene #10: '12p gain mutation analysis' versus Clinical Feature #1: 'CN_CNMF'
| nPatients | CLUS_1 | CLUS_2 | CLUS_3 |
|---|---|---|---|
| ALL | 34 | 332 | 66 |
| 12P GAIN MUTATED | 10 | 0 | 2 |
| 12P GAIN WILD-TYPE | 24 | 332 | 64 |
Figure S26. Get High-res Image Gene #10: '12p gain mutation analysis' versus Clinical Feature #1: 'CN_CNMF'

P value = 1.01e-06 (Fisher's exact test), Q value = 0.00029
Table S27. Gene #10: '12p gain mutation analysis' versus Clinical Feature #2: 'METHLYATION_CNMF'
| nPatients | CLUS_1 | CLUS_2 | CLUS_3 |
|---|---|---|---|
| ALL | 136 | 65 | 231 |
| 12P GAIN MUTATED | 12 | 0 | 0 |
| 12P GAIN WILD-TYPE | 124 | 65 | 231 |
Figure S27. Get High-res Image Gene #10: '12p gain mutation analysis' versus Clinical Feature #2: 'METHLYATION_CNMF'

P value = 7.78e-06 (Fisher's exact test), Q value = 0.0022
Table S28. Gene #10: '12p gain mutation analysis' versus Clinical Feature #5: 'MRNASEQ_CNMF'
| nPatients | CLUS_1 | CLUS_2 | CLUS_3 | CLUS_4 |
|---|---|---|---|---|
| ALL | 130 | 50 | 89 | 138 |
| 12P GAIN MUTATED | 12 | 0 | 0 | 0 |
| 12P GAIN WILD-TYPE | 118 | 50 | 89 | 138 |
Figure S28. Get High-res Image Gene #10: '12p gain mutation analysis' versus Clinical Feature #5: 'MRNASEQ_CNMF'

P value = 4.91e-06 (Fisher's exact test), Q value = 0.0014
Table S29. Gene #10: '12p gain mutation analysis' versus Clinical Feature #6: 'MRNASEQ_CHIERARCHICAL'
| nPatients | CLUS_1 | CLUS_2 | CLUS_3 |
|---|---|---|---|
| ALL | 142 | 191 | 74 |
| 12P GAIN MUTATED | 12 | 0 | 0 |
| 12P GAIN WILD-TYPE | 130 | 191 | 74 |
Figure S29. Get High-res Image Gene #10: '12p gain mutation analysis' versus Clinical Feature #6: 'MRNASEQ_CHIERARCHICAL'

P value = 1.46e-05 (Fisher's exact test), Q value = 0.004
Table S30. Gene #10: '12p gain mutation analysis' versus Clinical Feature #7: 'MIRSEQ_CNMF'
| nPatients | CLUS_1 | CLUS_2 | CLUS_3 |
|---|---|---|---|
| ALL | 120 | 144 | 144 |
| 12P GAIN MUTATED | 11 | 0 | 1 |
| 12P GAIN WILD-TYPE | 109 | 144 | 143 |
Figure S30. Get High-res Image Gene #10: '12p gain mutation analysis' versus Clinical Feature #7: 'MIRSEQ_CNMF'

P value = 3.89e-06 (Fisher's exact test), Q value = 0.0011
Table S31. Gene #10: '12p gain mutation analysis' versus Clinical Feature #8: 'MIRSEQ_CHIERARCHICAL'
| nPatients | CLUS_1 | CLUS_2 | CLUS_3 |
|---|---|---|---|
| ALL | 109 | 169 | 130 |
| 12P GAIN MUTATED | 11 | 1 | 0 |
| 12P GAIN WILD-TYPE | 98 | 168 | 130 |
Figure S31. Get High-res Image Gene #10: '12p gain mutation analysis' versus Clinical Feature #8: 'MIRSEQ_CHIERARCHICAL'
P value = 5.23e-12 (Fisher's exact test), Q value = 1.6e-09
Table S32. Gene #11: '12q gain mutation analysis' versus Clinical Feature #1: 'CN_CNMF'
| nPatients | CLUS_1 | CLUS_2 | CLUS_3 |
|---|---|---|---|
| ALL | 34 | 332 | 66 |
| 12Q GAIN MUTATED | 10 | 0 | 2 |
| 12Q GAIN WILD-TYPE | 24 | 332 | 64 |
Figure S32. Get High-res Image Gene #11: '12q gain mutation analysis' versus Clinical Feature #1: 'CN_CNMF'

P value = 1.01e-06 (Fisher's exact test), Q value = 0.00029
Table S33. Gene #11: '12q gain mutation analysis' versus Clinical Feature #2: 'METHLYATION_CNMF'
| nPatients | CLUS_1 | CLUS_2 | CLUS_3 |
|---|---|---|---|
| ALL | 136 | 65 | 231 |
| 12Q GAIN MUTATED | 12 | 0 | 0 |
| 12Q GAIN WILD-TYPE | 124 | 65 | 231 |
Figure S33. Get High-res Image Gene #11: '12q gain mutation analysis' versus Clinical Feature #2: 'METHLYATION_CNMF'

P value = 7.78e-06 (Fisher's exact test), Q value = 0.0022
Table S34. Gene #11: '12q gain mutation analysis' versus Clinical Feature #5: 'MRNASEQ_CNMF'
| nPatients | CLUS_1 | CLUS_2 | CLUS_3 | CLUS_4 |
|---|---|---|---|---|
| ALL | 130 | 50 | 89 | 138 |
| 12Q GAIN MUTATED | 12 | 0 | 0 | 0 |
| 12Q GAIN WILD-TYPE | 118 | 50 | 89 | 138 |
Figure S34. Get High-res Image Gene #11: '12q gain mutation analysis' versus Clinical Feature #5: 'MRNASEQ_CNMF'

P value = 4.91e-06 (Fisher's exact test), Q value = 0.0014
Table S35. Gene #11: '12q gain mutation analysis' versus Clinical Feature #6: 'MRNASEQ_CHIERARCHICAL'
| nPatients | CLUS_1 | CLUS_2 | CLUS_3 |
|---|---|---|---|
| ALL | 142 | 191 | 74 |
| 12Q GAIN MUTATED | 12 | 0 | 0 |
| 12Q GAIN WILD-TYPE | 130 | 191 | 74 |
Figure S35. Get High-res Image Gene #11: '12q gain mutation analysis' versus Clinical Feature #6: 'MRNASEQ_CHIERARCHICAL'

P value = 1.46e-05 (Fisher's exact test), Q value = 0.004
Table S36. Gene #11: '12q gain mutation analysis' versus Clinical Feature #7: 'MIRSEQ_CNMF'
| nPatients | CLUS_1 | CLUS_2 | CLUS_3 |
|---|---|---|---|
| ALL | 120 | 144 | 144 |
| 12Q GAIN MUTATED | 11 | 0 | 1 |
| 12Q GAIN WILD-TYPE | 109 | 144 | 143 |
Figure S36. Get High-res Image Gene #11: '12q gain mutation analysis' versus Clinical Feature #7: 'MIRSEQ_CNMF'

P value = 3.89e-06 (Fisher's exact test), Q value = 0.0011
Table S37. Gene #11: '12q gain mutation analysis' versus Clinical Feature #8: 'MIRSEQ_CHIERARCHICAL'
| nPatients | CLUS_1 | CLUS_2 | CLUS_3 |
|---|---|---|---|
| ALL | 109 | 169 | 130 |
| 12Q GAIN MUTATED | 11 | 1 | 0 |
| 12Q GAIN WILD-TYPE | 98 | 168 | 130 |
Figure S37. Get High-res Image Gene #11: '12q gain mutation analysis' versus Clinical Feature #8: 'MIRSEQ_CHIERARCHICAL'

P value = 1.77e-07 (Fisher's exact test), Q value = 5.2e-05
Table S38. Gene #12: '14q gain mutation analysis' versus Clinical Feature #1: 'CN_CNMF'
| nPatients | CLUS_1 | CLUS_2 | CLUS_3 |
|---|---|---|---|
| ALL | 34 | 332 | 66 |
| 14Q GAIN MUTATED | 6 | 0 | 1 |
| 14Q GAIN WILD-TYPE | 28 | 332 | 65 |
Figure S38. Get High-res Image Gene #12: '14q gain mutation analysis' versus Clinical Feature #1: 'CN_CNMF'

P value = 0.000476 (Fisher's exact test), Q value = 0.11
Table S39. Gene #12: '14q gain mutation analysis' versus Clinical Feature #2: 'METHLYATION_CNMF'
| nPatients | CLUS_1 | CLUS_2 | CLUS_3 |
|---|---|---|---|
| ALL | 136 | 65 | 231 |
| 14Q GAIN MUTATED | 7 | 0 | 0 |
| 14Q GAIN WILD-TYPE | 129 | 65 | 231 |
Figure S39. Get High-res Image Gene #12: '14q gain mutation analysis' versus Clinical Feature #2: 'METHLYATION_CNMF'

P value = 2.57e-13 (Fisher's exact test), Q value = 7.8e-11
Table S40. Gene #13: '16p gain mutation analysis' versus Clinical Feature #1: 'CN_CNMF'
| nPatients | CLUS_1 | CLUS_2 | CLUS_3 |
|---|---|---|---|
| ALL | 34 | 332 | 66 |
| 16P GAIN MUTATED | 11 | 0 | 1 |
| 16P GAIN WILD-TYPE | 23 | 332 | 65 |
Figure S40. Get High-res Image Gene #13: '16p gain mutation analysis' versus Clinical Feature #1: 'CN_CNMF'

P value = 4.7e-05 (Fisher's exact test), Q value = 0.012
Table S41. Gene #13: '16p gain mutation analysis' versus Clinical Feature #2: 'METHLYATION_CNMF'
| nPatients | CLUS_1 | CLUS_2 | CLUS_3 |
|---|---|---|---|
| ALL | 136 | 65 | 231 |
| 16P GAIN MUTATED | 10 | 2 | 0 |
| 16P GAIN WILD-TYPE | 126 | 63 | 231 |
Figure S41. Get High-res Image Gene #13: '16p gain mutation analysis' versus Clinical Feature #2: 'METHLYATION_CNMF'

P value = 0.000239 (Fisher's exact test), Q value = 0.058
Table S42. Gene #13: '16p gain mutation analysis' versus Clinical Feature #5: 'MRNASEQ_CNMF'
| nPatients | CLUS_1 | CLUS_2 | CLUS_3 | CLUS_4 |
|---|---|---|---|---|
| ALL | 130 | 50 | 89 | 138 |
| 16P GAIN MUTATED | 11 | 0 | 0 | 1 |
| 16P GAIN WILD-TYPE | 119 | 50 | 89 | 137 |
Figure S42. Get High-res Image Gene #13: '16p gain mutation analysis' versus Clinical Feature #5: 'MRNASEQ_CNMF'
P value = 0.000167 (Fisher's exact test), Q value = 0.041
Table S43. Gene #13: '16p gain mutation analysis' versus Clinical Feature #6: 'MRNASEQ_CHIERARCHICAL'
| nPatients | CLUS_1 | CLUS_2 | CLUS_3 |
|---|---|---|---|
| ALL | 142 | 191 | 74 |
| 16P GAIN MUTATED | 11 | 1 | 0 |
| 16P GAIN WILD-TYPE | 131 | 190 | 74 |
Figure S43. Get High-res Image Gene #13: '16p gain mutation analysis' versus Clinical Feature #6: 'MRNASEQ_CHIERARCHICAL'

P value = 0.000137 (Fisher's exact test), Q value = 0.034
Table S44. Gene #13: '16p gain mutation analysis' versus Clinical Feature #7: 'MIRSEQ_CNMF'
| nPatients | CLUS_1 | CLUS_2 | CLUS_3 |
|---|---|---|---|
| ALL | 120 | 144 | 144 |
| 16P GAIN MUTATED | 10 | 0 | 2 |
| 16P GAIN WILD-TYPE | 110 | 144 | 142 |
Figure S44. Get High-res Image Gene #13: '16p gain mutation analysis' versus Clinical Feature #7: 'MIRSEQ_CNMF'

P value = 5.08e-05 (Fisher's exact test), Q value = 0.013
Table S45. Gene #13: '16p gain mutation analysis' versus Clinical Feature #8: 'MIRSEQ_CHIERARCHICAL'
| nPatients | CLUS_1 | CLUS_2 | CLUS_3 |
|---|---|---|---|
| ALL | 109 | 169 | 130 |
| 16P GAIN MUTATED | 10 | 2 | 0 |
| 16P GAIN WILD-TYPE | 99 | 167 | 130 |
Figure S45. Get High-res Image Gene #13: '16p gain mutation analysis' versus Clinical Feature #8: 'MIRSEQ_CHIERARCHICAL'

P value = 2.33e-12 (Fisher's exact test), Q value = 7.1e-10
Table S46. Gene #14: '16q gain mutation analysis' versus Clinical Feature #1: 'CN_CNMF'
| nPatients | CLUS_1 | CLUS_2 | CLUS_3 |
|---|---|---|---|
| ALL | 34 | 332 | 66 |
| 16Q GAIN MUTATED | 10 | 0 | 0 |
| 16Q GAIN WILD-TYPE | 24 | 332 | 66 |
Figure S46. Get High-res Image Gene #14: '16q gain mutation analysis' versus Clinical Feature #1: 'CN_CNMF'
P value = 0.000314 (Fisher's exact test), Q value = 0.073
Table S47. Gene #14: '16q gain mutation analysis' versus Clinical Feature #2: 'METHLYATION_CNMF'
| nPatients | CLUS_1 | CLUS_2 | CLUS_3 |
|---|---|---|---|
| ALL | 136 | 65 | 231 |
| 16Q GAIN MUTATED | 8 | 2 | 0 |
| 16Q GAIN WILD-TYPE | 128 | 63 | 231 |
Figure S47. Get High-res Image Gene #14: '16q gain mutation analysis' versus Clinical Feature #2: 'METHLYATION_CNMF'

P value = 0.000643 (Fisher's exact test), Q value = 0.14
Table S48. Gene #14: '16q gain mutation analysis' versus Clinical Feature #8: 'MIRSEQ_CHIERARCHICAL'
| nPatients | CLUS_1 | CLUS_2 | CLUS_3 |
|---|---|---|---|
| ALL | 109 | 169 | 130 |
| 16Q GAIN MUTATED | 8 | 2 | 0 |
| 16Q GAIN WILD-TYPE | 101 | 167 | 130 |
Figure S48. Get High-res Image Gene #14: '16q gain mutation analysis' versus Clinical Feature #8: 'MIRSEQ_CHIERARCHICAL'

P value = 1.04e-07 (Fisher's exact test), Q value = 3.1e-05
Table S49. Gene #15: '17p gain mutation analysis' versus Clinical Feature #1: 'CN_CNMF'
| nPatients | CLUS_1 | CLUS_2 | CLUS_3 |
|---|---|---|---|
| ALL | 34 | 332 | 66 |
| 17P GAIN MUTATED | 8 | 2 | 1 |
| 17P GAIN WILD-TYPE | 26 | 330 | 65 |
Figure S49. Get High-res Image Gene #15: '17p gain mutation analysis' versus Clinical Feature #1: 'CN_CNMF'

P value = 4.25e-06 (Fisher's exact test), Q value = 0.0012
Table S50. Gene #15: '17p gain mutation analysis' versus Clinical Feature #2: 'METHLYATION_CNMF'
| nPatients | CLUS_1 | CLUS_2 | CLUS_3 |
|---|---|---|---|
| ALL | 136 | 65 | 231 |
| 17P GAIN MUTATED | 11 | 0 | 0 |
| 17P GAIN WILD-TYPE | 125 | 65 | 231 |
Figure S50. Get High-res Image Gene #15: '17p gain mutation analysis' versus Clinical Feature #2: 'METHLYATION_CNMF'

P value = 1.83e-05 (Fisher's exact test), Q value = 0.0049
Table S51. Gene #15: '17p gain mutation analysis' versus Clinical Feature #5: 'MRNASEQ_CNMF'
| nPatients | CLUS_1 | CLUS_2 | CLUS_3 | CLUS_4 |
|---|---|---|---|---|
| ALL | 130 | 50 | 89 | 138 |
| 17P GAIN MUTATED | 11 | 0 | 0 | 0 |
| 17P GAIN WILD-TYPE | 119 | 50 | 89 | 138 |
Figure S51. Get High-res Image Gene #15: '17p gain mutation analysis' versus Clinical Feature #5: 'MRNASEQ_CNMF'

P value = 1.93e-05 (Fisher's exact test), Q value = 0.0052
Table S52. Gene #15: '17p gain mutation analysis' versus Clinical Feature #6: 'MRNASEQ_CHIERARCHICAL'
| nPatients | CLUS_1 | CLUS_2 | CLUS_3 |
|---|---|---|---|
| ALL | 142 | 191 | 74 |
| 17P GAIN MUTATED | 11 | 0 | 0 |
| 17P GAIN WILD-TYPE | 131 | 191 | 74 |
Figure S52. Get High-res Image Gene #15: '17p gain mutation analysis' versus Clinical Feature #6: 'MRNASEQ_CHIERARCHICAL'

P value = 4.67e-05 (Fisher's exact test), Q value = 0.012
Table S53. Gene #15: '17p gain mutation analysis' versus Clinical Feature #7: 'MIRSEQ_CNMF'
| nPatients | CLUS_1 | CLUS_2 | CLUS_3 |
|---|---|---|---|
| ALL | 120 | 144 | 144 |
| 17P GAIN MUTATED | 10 | 0 | 1 |
| 17P GAIN WILD-TYPE | 110 | 144 | 143 |
Figure S53. Get High-res Image Gene #15: '17p gain mutation analysis' versus Clinical Feature #7: 'MIRSEQ_CNMF'

P value = 1.41e-05 (Fisher's exact test), Q value = 0.0039
Table S54. Gene #15: '17p gain mutation analysis' versus Clinical Feature #8: 'MIRSEQ_CHIERARCHICAL'
| nPatients | CLUS_1 | CLUS_2 | CLUS_3 |
|---|---|---|---|
| ALL | 109 | 169 | 130 |
| 17P GAIN MUTATED | 10 | 1 | 0 |
| 17P GAIN WILD-TYPE | 99 | 168 | 130 |
Figure S54. Get High-res Image Gene #15: '17p gain mutation analysis' versus Clinical Feature #8: 'MIRSEQ_CHIERARCHICAL'
P value = 7.49e-08 (Fisher's exact test), Q value = 2.2e-05
Table S55. Gene #16: '17q gain mutation analysis' versus Clinical Feature #1: 'CN_CNMF'
| nPatients | CLUS_1 | CLUS_2 | CLUS_3 |
|---|---|---|---|
| ALL | 34 | 332 | 66 |
| 17Q GAIN MUTATED | 8 | 2 | 2 |
| 17Q GAIN WILD-TYPE | 26 | 330 | 64 |
Figure S55. Get High-res Image Gene #16: '17q gain mutation analysis' versus Clinical Feature #1: 'CN_CNMF'

P value = 1.01e-06 (Fisher's exact test), Q value = 0.00029
Table S56. Gene #16: '17q gain mutation analysis' versus Clinical Feature #2: 'METHLYATION_CNMF'
| nPatients | CLUS_1 | CLUS_2 | CLUS_3 |
|---|---|---|---|
| ALL | 136 | 65 | 231 |
| 17Q GAIN MUTATED | 12 | 0 | 0 |
| 17Q GAIN WILD-TYPE | 124 | 65 | 231 |
Figure S56. Get High-res Image Gene #16: '17q gain mutation analysis' versus Clinical Feature #2: 'METHLYATION_CNMF'

P value = 7.78e-06 (Fisher's exact test), Q value = 0.0022
Table S57. Gene #16: '17q gain mutation analysis' versus Clinical Feature #5: 'MRNASEQ_CNMF'
| nPatients | CLUS_1 | CLUS_2 | CLUS_3 | CLUS_4 |
|---|---|---|---|---|
| ALL | 130 | 50 | 89 | 138 |
| 17Q GAIN MUTATED | 12 | 0 | 0 | 0 |
| 17Q GAIN WILD-TYPE | 118 | 50 | 89 | 138 |
Figure S57. Get High-res Image Gene #16: '17q gain mutation analysis' versus Clinical Feature #5: 'MRNASEQ_CNMF'
P value = 4.91e-06 (Fisher's exact test), Q value = 0.0014
Table S58. Gene #16: '17q gain mutation analysis' versus Clinical Feature #6: 'MRNASEQ_CHIERARCHICAL'
| nPatients | CLUS_1 | CLUS_2 | CLUS_3 |
|---|---|---|---|
| ALL | 142 | 191 | 74 |
| 17Q GAIN MUTATED | 12 | 0 | 0 |
| 17Q GAIN WILD-TYPE | 130 | 191 | 74 |
Figure S58. Get High-res Image Gene #16: '17q gain mutation analysis' versus Clinical Feature #6: 'MRNASEQ_CHIERARCHICAL'

P value = 1.46e-05 (Fisher's exact test), Q value = 0.004
Table S59. Gene #16: '17q gain mutation analysis' versus Clinical Feature #7: 'MIRSEQ_CNMF'
| nPatients | CLUS_1 | CLUS_2 | CLUS_3 |
|---|---|---|---|
| ALL | 120 | 144 | 144 |
| 17Q GAIN MUTATED | 11 | 0 | 1 |
| 17Q GAIN WILD-TYPE | 109 | 144 | 143 |
Figure S59. Get High-res Image Gene #16: '17q gain mutation analysis' versus Clinical Feature #7: 'MIRSEQ_CNMF'

P value = 3.89e-06 (Fisher's exact test), Q value = 0.0011
Table S60. Gene #16: '17q gain mutation analysis' versus Clinical Feature #8: 'MIRSEQ_CHIERARCHICAL'
| nPatients | CLUS_1 | CLUS_2 | CLUS_3 |
|---|---|---|---|
| ALL | 109 | 169 | 130 |
| 17Q GAIN MUTATED | 11 | 1 | 0 |
| 17Q GAIN WILD-TYPE | 98 | 168 | 130 |
Figure S60. Get High-res Image Gene #16: '17q gain mutation analysis' versus Clinical Feature #8: 'MIRSEQ_CHIERARCHICAL'

P value = 0.000448 (Fisher's exact test), Q value = 0.1
Table S61. Gene #17: '19p gain mutation analysis' versus Clinical Feature #1: 'CN_CNMF'
| nPatients | CLUS_1 | CLUS_2 | CLUS_3 |
|---|---|---|---|
| ALL | 34 | 332 | 66 |
| 19P GAIN MUTATED | 3 | 0 | 0 |
| 19P GAIN WILD-TYPE | 31 | 332 | 66 |
Figure S61. Get High-res Image Gene #17: '19p gain mutation analysis' versus Clinical Feature #1: 'CN_CNMF'

P value = 3.24e-05 (Fisher's exact test), Q value = 0.0086
Table S62. Gene #18: '19q gain mutation analysis' versus Clinical Feature #1: 'CN_CNMF'
| nPatients | CLUS_1 | CLUS_2 | CLUS_3 |
|---|---|---|---|
| ALL | 34 | 332 | 66 |
| 19Q GAIN MUTATED | 4 | 0 | 0 |
| 19Q GAIN WILD-TYPE | 30 | 332 | 66 |
Figure S62. Get High-res Image Gene #18: '19q gain mutation analysis' versus Clinical Feature #1: 'CN_CNMF'

P value = 6.44e-10 (Fisher's exact test), Q value = 1.9e-07
Table S63. Gene #19: '20p gain mutation analysis' versus Clinical Feature #1: 'CN_CNMF'
| nPatients | CLUS_1 | CLUS_2 | CLUS_3 |
|---|---|---|---|
| ALL | 34 | 332 | 66 |
| 20P GAIN MUTATED | 8 | 0 | 0 |
| 20P GAIN WILD-TYPE | 26 | 332 | 66 |
Figure S63. Get High-res Image Gene #19: '20p gain mutation analysis' versus Clinical Feature #1: 'CN_CNMF'

P value = 6.44e-10 (Fisher's exact test), Q value = 1.9e-07
Table S64. Gene #20: '20q gain mutation analysis' versus Clinical Feature #1: 'CN_CNMF'
| nPatients | CLUS_1 | CLUS_2 | CLUS_3 |
|---|---|---|---|
| ALL | 34 | 332 | 66 |
| 20Q GAIN MUTATED | 8 | 0 | 0 |
| 20Q GAIN WILD-TYPE | 26 | 332 | 66 |
Figure S64. Get High-res Image Gene #20: '20q gain mutation analysis' versus Clinical Feature #1: 'CN_CNMF'

P value = 0.000448 (Fisher's exact test), Q value = 0.1
Table S65. Gene #22: '1p loss mutation analysis' versus Clinical Feature #1: 'CN_CNMF'
| nPatients | CLUS_1 | CLUS_2 | CLUS_3 |
|---|---|---|---|
| ALL | 34 | 332 | 66 |
| 1P LOSS MUTATED | 3 | 0 | 0 |
| 1P LOSS WILD-TYPE | 31 | 332 | 66 |
Figure S65. Get High-res Image Gene #22: '1p loss mutation analysis' versus Clinical Feature #1: 'CN_CNMF'
P value = 1.32e-08 (Fisher's exact test), Q value = 3.9e-06
Table S66. Gene #23: '2p loss mutation analysis' versus Clinical Feature #1: 'CN_CNMF'
| nPatients | CLUS_1 | CLUS_2 | CLUS_3 |
|---|---|---|---|
| ALL | 34 | 332 | 66 |
| 2P LOSS MUTATED | 7 | 0 | 1 |
| 2P LOSS WILD-TYPE | 27 | 332 | 65 |
Figure S66. Get High-res Image Gene #23: '2p loss mutation analysis' versus Clinical Feature #1: 'CN_CNMF'
P value = 0.000197 (Fisher's exact test), Q value = 0.048
Table S67. Gene #23: '2p loss mutation analysis' versus Clinical Feature #2: 'METHLYATION_CNMF'
| nPatients | CLUS_1 | CLUS_2 | CLUS_3 |
|---|---|---|---|
| ALL | 136 | 65 | 231 |
| 2P LOSS MUTATED | 8 | 0 | 0 |
| 2P LOSS WILD-TYPE | 128 | 65 | 231 |
Figure S67. Get High-res Image Gene #23: '2p loss mutation analysis' versus Clinical Feature #2: 'METHLYATION_CNMF'
P value = 0.000731 (Fisher's exact test), Q value = 0.16
Table S68. Gene #23: '2p loss mutation analysis' versus Clinical Feature #5: 'MRNASEQ_CNMF'
| nPatients | CLUS_1 | CLUS_2 | CLUS_3 | CLUS_4 |
|---|---|---|---|---|
| ALL | 130 | 50 | 89 | 138 |
| 2P LOSS MUTATED | 8 | 0 | 0 | 0 |
| 2P LOSS WILD-TYPE | 122 | 50 | 89 | 138 |
Figure S68. Get High-res Image Gene #23: '2p loss mutation analysis' versus Clinical Feature #5: 'MRNASEQ_CNMF'
P value = 0.000334 (Fisher's exact test), Q value = 0.078
Table S69. Gene #23: '2p loss mutation analysis' versus Clinical Feature #6: 'MRNASEQ_CHIERARCHICAL'
| nPatients | CLUS_1 | CLUS_2 | CLUS_3 |
|---|---|---|---|
| ALL | 142 | 191 | 74 |
| 2P LOSS MUTATED | 8 | 0 | 0 |
| 2P LOSS WILD-TYPE | 134 | 191 | 74 |
Figure S69. Get High-res Image Gene #23: '2p loss mutation analysis' versus Clinical Feature #6: 'MRNASEQ_CHIERARCHICAL'

P value = 4.73e-05 (Fisher's exact test), Q value = 0.012
Table S70. Gene #23: '2p loss mutation analysis' versus Clinical Feature #7: 'MIRSEQ_CNMF'
| nPatients | CLUS_1 | CLUS_2 | CLUS_3 |
|---|---|---|---|
| ALL | 120 | 144 | 144 |
| 2P LOSS MUTATED | 8 | 0 | 0 |
| 2P LOSS WILD-TYPE | 112 | 144 | 144 |
Figure S70. Get High-res Image Gene #23: '2p loss mutation analysis' versus Clinical Feature #7: 'MIRSEQ_CNMF'

P value = 2.14e-05 (Fisher's exact test), Q value = 0.0057
Table S71. Gene #23: '2p loss mutation analysis' versus Clinical Feature #8: 'MIRSEQ_CHIERARCHICAL'
| nPatients | CLUS_1 | CLUS_2 | CLUS_3 |
|---|---|---|---|
| ALL | 109 | 169 | 130 |
| 2P LOSS MUTATED | 8 | 0 | 0 |
| 2P LOSS WILD-TYPE | 101 | 169 | 130 |
Figure S71. Get High-res Image Gene #23: '2p loss mutation analysis' versus Clinical Feature #8: 'MIRSEQ_CHIERARCHICAL'
P value = 1.01e-08 (Fisher's exact test), Q value = 3e-06
Table S72. Gene #24: '2q loss mutation analysis' versus Clinical Feature #1: 'CN_CNMF'
| nPatients | CLUS_1 | CLUS_2 | CLUS_3 |
|---|---|---|---|
| ALL | 34 | 332 | 66 |
| 2Q LOSS MUTATED | 7 | 0 | 0 |
| 2Q LOSS WILD-TYPE | 27 | 332 | 66 |
Figure S72. Get High-res Image Gene #24: '2q loss mutation analysis' versus Clinical Feature #1: 'CN_CNMF'

P value = 0.000476 (Fisher's exact test), Q value = 0.11
Table S73. Gene #24: '2q loss mutation analysis' versus Clinical Feature #2: 'METHLYATION_CNMF'
| nPatients | CLUS_1 | CLUS_2 | CLUS_3 |
|---|---|---|---|
| ALL | 136 | 65 | 231 |
| 2Q LOSS MUTATED | 7 | 0 | 0 |
| 2Q LOSS WILD-TYPE | 129 | 65 | 231 |
Figure S73. Get High-res Image Gene #24: '2q loss mutation analysis' versus Clinical Feature #2: 'METHLYATION_CNMF'

P value = 0.000168 (Fisher's exact test), Q value = 0.041
Table S74. Gene #24: '2q loss mutation analysis' versus Clinical Feature #7: 'MIRSEQ_CNMF'
| nPatients | CLUS_1 | CLUS_2 | CLUS_3 |
|---|---|---|---|
| ALL | 120 | 144 | 144 |
| 2Q LOSS MUTATED | 7 | 0 | 0 |
| 2Q LOSS WILD-TYPE | 113 | 144 | 144 |
Figure S74. Get High-res Image Gene #24: '2q loss mutation analysis' versus Clinical Feature #7: 'MIRSEQ_CNMF'

P value = 8.4e-05 (Fisher's exact test), Q value = 0.021
Table S75. Gene #24: '2q loss mutation analysis' versus Clinical Feature #8: 'MIRSEQ_CHIERARCHICAL'
| nPatients | CLUS_1 | CLUS_2 | CLUS_3 |
|---|---|---|---|
| ALL | 109 | 169 | 130 |
| 2Q LOSS MUTATED | 7 | 0 | 0 |
| 2Q LOSS WILD-TYPE | 102 | 169 | 130 |
Figure S75. Get High-res Image Gene #24: '2q loss mutation analysis' versus Clinical Feature #8: 'MIRSEQ_CHIERARCHICAL'

P value = 0.000448 (Fisher's exact test), Q value = 0.1
Table S76. Gene #25: '3q loss mutation analysis' versus Clinical Feature #1: 'CN_CNMF'
| nPatients | CLUS_1 | CLUS_2 | CLUS_3 |
|---|---|---|---|
| ALL | 34 | 332 | 66 |
| 3Q LOSS MUTATED | 3 | 0 | 0 |
| 3Q LOSS WILD-TYPE | 31 | 332 | 66 |
Figure S76. Get High-res Image Gene #25: '3q loss mutation analysis' versus Clinical Feature #1: 'CN_CNMF'

P value = 3.24e-05 (Fisher's exact test), Q value = 0.0086
Table S77. Gene #27: '8p loss mutation analysis' versus Clinical Feature #1: 'CN_CNMF'
| nPatients | CLUS_1 | CLUS_2 | CLUS_3 |
|---|---|---|---|
| ALL | 34 | 332 | 66 |
| 8P LOSS MUTATED | 4 | 0 | 0 |
| 8P LOSS WILD-TYPE | 30 | 332 | 66 |
Figure S77. Get High-res Image Gene #27: '8p loss mutation analysis' versus Clinical Feature #1: 'CN_CNMF'

P value = 3.24e-05 (Fisher's exact test), Q value = 0.0086
Table S78. Gene #28: '8q loss mutation analysis' versus Clinical Feature #1: 'CN_CNMF'
| nPatients | CLUS_1 | CLUS_2 | CLUS_3 |
|---|---|---|---|
| ALL | 34 | 332 | 66 |
| 8Q LOSS MUTATED | 4 | 0 | 0 |
| 8Q LOSS WILD-TYPE | 30 | 332 | 66 |
Figure S78. Get High-res Image Gene #28: '8q loss mutation analysis' versus Clinical Feature #1: 'CN_CNMF'

P value = 3.74e-10 (Fisher's exact test), Q value = 1.1e-07
Table S79. Gene #29: '9p loss mutation analysis' versus Clinical Feature #1: 'CN_CNMF'
| nPatients | CLUS_1 | CLUS_2 | CLUS_3 |
|---|---|---|---|
| ALL | 34 | 332 | 66 |
| 9P LOSS MUTATED | 9 | 1 | 0 |
| 9P LOSS WILD-TYPE | 25 | 331 | 66 |
Figure S79. Get High-res Image Gene #29: '9p loss mutation analysis' versus Clinical Feature #1: 'CN_CNMF'

P value = 8.23e-11 (Fisher's exact test), Q value = 2.5e-08
Table S80. Gene #30: '9q loss mutation analysis' versus Clinical Feature #1: 'CN_CNMF'
| nPatients | CLUS_1 | CLUS_2 | CLUS_3 |
|---|---|---|---|
| ALL | 34 | 332 | 66 |
| 9Q LOSS MUTATED | 11 | 3 | 0 |
| 9Q LOSS WILD-TYPE | 23 | 329 | 66 |
Figure S80. Get High-res Image Gene #30: '9q loss mutation analysis' versus Clinical Feature #1: 'CN_CNMF'

P value = 3.24e-05 (Fisher's exact test), Q value = 0.0086
Table S81. Gene #31: '10p loss mutation analysis' versus Clinical Feature #1: 'CN_CNMF'
| nPatients | CLUS_1 | CLUS_2 | CLUS_3 |
|---|---|---|---|
| ALL | 34 | 332 | 66 |
| 10P LOSS MUTATED | 4 | 0 | 0 |
| 10P LOSS WILD-TYPE | 30 | 332 | 66 |
Figure S81. Get High-res Image Gene #31: '10p loss mutation analysis' versus Clinical Feature #1: 'CN_CNMF'

P value = 3.24e-05 (Fisher's exact test), Q value = 0.0086
Table S82. Gene #32: '10q loss mutation analysis' versus Clinical Feature #1: 'CN_CNMF'
| nPatients | CLUS_1 | CLUS_2 | CLUS_3 |
|---|---|---|---|
| ALL | 34 | 332 | 66 |
| 10Q LOSS MUTATED | 4 | 0 | 0 |
| 10Q LOSS WILD-TYPE | 30 | 332 | 66 |
Figure S82. Get High-res Image Gene #32: '10q loss mutation analysis' versus Clinical Feature #1: 'CN_CNMF'

P value = 2.27e-06 (Fisher's exact test), Q value = 0.00065
Table S83. Gene #33: '11p loss mutation analysis' versus Clinical Feature #1: 'CN_CNMF'
| nPatients | CLUS_1 | CLUS_2 | CLUS_3 |
|---|---|---|---|
| ALL | 34 | 332 | 66 |
| 11P LOSS MUTATED | 5 | 0 | 0 |
| 11P LOSS WILD-TYPE | 29 | 332 | 66 |
Figure S83. Get High-res Image Gene #33: '11p loss mutation analysis' versus Clinical Feature #1: 'CN_CNMF'

P value = 2.33e-05 (Fisher's exact test), Q value = 0.0062
Table S84. Gene #34: '11q loss mutation analysis' versus Clinical Feature #1: 'CN_CNMF'
| nPatients | CLUS_1 | CLUS_2 | CLUS_3 |
|---|---|---|---|
| ALL | 34 | 332 | 66 |
| 11Q LOSS MUTATED | 5 | 1 | 0 |
| 11Q LOSS WILD-TYPE | 29 | 331 | 66 |
Figure S84. Get High-res Image Gene #34: '11q loss mutation analysis' versus Clinical Feature #1: 'CN_CNMF'

P value = 0.000556 (Fisher's exact test), Q value = 0.12
Table S85. Gene #36: '15q loss mutation analysis' versus Clinical Feature #1: 'CN_CNMF'
| nPatients | CLUS_1 | CLUS_2 | CLUS_3 |
|---|---|---|---|
| ALL | 34 | 332 | 66 |
| 15Q LOSS MUTATED | 4 | 2 | 0 |
| 15Q LOSS WILD-TYPE | 30 | 330 | 66 |
Figure S85. Get High-res Image Gene #36: '15q loss mutation analysis' versus Clinical Feature #1: 'CN_CNMF'

P value = 0.000592 (Fisher's exact test), Q value = 0.13
Table S86. Gene #36: '15q loss mutation analysis' versus Clinical Feature #7: 'MIRSEQ_CNMF'
| nPatients | CLUS_1 | CLUS_2 | CLUS_3 |
|---|---|---|---|
| ALL | 120 | 144 | 144 |
| 15Q LOSS MUTATED | 6 | 0 | 0 |
| 15Q LOSS WILD-TYPE | 114 | 144 | 144 |
Figure S86. Get High-res Image Gene #36: '15q loss mutation analysis' versus Clinical Feature #7: 'MIRSEQ_CNMF'
P value = 0.000328 (Fisher's exact test), Q value = 0.076
Table S87. Gene #36: '15q loss mutation analysis' versus Clinical Feature #8: 'MIRSEQ_CHIERARCHICAL'
| nPatients | CLUS_1 | CLUS_2 | CLUS_3 |
|---|---|---|---|
| ALL | 109 | 169 | 130 |
| 15Q LOSS MUTATED | 6 | 0 | 0 |
| 15Q LOSS WILD-TYPE | 103 | 169 | 130 |
Figure S87. Get High-res Image Gene #36: '15q loss mutation analysis' versus Clinical Feature #8: 'MIRSEQ_CHIERARCHICAL'

P value = 0.000308 (Fisher's exact test), Q value = 0.073
Table S88. Gene #38: '18p loss mutation analysis' versus Clinical Feature #1: 'CN_CNMF'
| nPatients | CLUS_1 | CLUS_2 | CLUS_3 |
|---|---|---|---|
| ALL | 34 | 332 | 66 |
| 18P LOSS MUTATED | 3 | 0 | 1 |
| 18P LOSS WILD-TYPE | 31 | 332 | 65 |
Figure S88. Get High-res Image Gene #38: '18p loss mutation analysis' versus Clinical Feature #1: 'CN_CNMF'

P value = 0.000308 (Fisher's exact test), Q value = 0.073
Table S89. Gene #39: '18q loss mutation analysis' versus Clinical Feature #1: 'CN_CNMF'
| nPatients | CLUS_1 | CLUS_2 | CLUS_3 |
|---|---|---|---|
| ALL | 34 | 332 | 66 |
| 18Q LOSS MUTATED | 3 | 0 | 1 |
| 18Q LOSS WILD-TYPE | 31 | 332 | 65 |
Figure S89. Get High-res Image Gene #39: '18q loss mutation analysis' versus Clinical Feature #1: 'CN_CNMF'

P value = 2.73e-05 (Fisher's exact test), Q value = 0.0073
Table S90. Gene #41: '21q loss mutation analysis' versus Clinical Feature #1: 'CN_CNMF'
| nPatients | CLUS_1 | CLUS_2 | CLUS_3 |
|---|---|---|---|
| ALL | 34 | 332 | 66 |
| 21Q LOSS MUTATED | 4 | 0 | 1 |
| 21Q LOSS WILD-TYPE | 30 | 332 | 65 |
Figure S90. Get High-res Image Gene #41: '21q loss mutation analysis' versus Clinical Feature #1: 'CN_CNMF'

P value = 1.18e-45 (Fisher's exact test), Q value = 3.6e-43
Table S91. Gene #42: '22q loss mutation analysis' versus Clinical Feature #1: 'CN_CNMF'
| nPatients | CLUS_1 | CLUS_2 | CLUS_3 |
|---|---|---|---|
| ALL | 34 | 332 | 66 |
| 22Q LOSS MUTATED | 8 | 0 | 46 |
| 22Q LOSS WILD-TYPE | 26 | 332 | 20 |
Figure S91. Get High-res Image Gene #42: '22q loss mutation analysis' versus Clinical Feature #1: 'CN_CNMF'
P value = 3.69e-09 (Fisher's exact test), Q value = 1.1e-06
Table S92. Gene #42: '22q loss mutation analysis' versus Clinical Feature #5: 'MRNASEQ_CNMF'
| nPatients | CLUS_1 | CLUS_2 | CLUS_3 | CLUS_4 |
|---|---|---|---|---|
| ALL | 130 | 50 | 89 | 138 |
| 22Q LOSS MUTATED | 29 | 3 | 16 | 1 |
| 22Q LOSS WILD-TYPE | 101 | 47 | 73 | 137 |
Figure S92. Get High-res Image Gene #42: '22q loss mutation analysis' versus Clinical Feature #5: 'MRNASEQ_CNMF'
P value = 2.07e-07 (Fisher's exact test), Q value = 6e-05
Table S93. Gene #42: '22q loss mutation analysis' versus Clinical Feature #6: 'MRNASEQ_CHIERARCHICAL'
| nPatients | CLUS_1 | CLUS_2 | CLUS_3 |
|---|---|---|---|
| ALL | 142 | 191 | 74 |
| 22Q LOSS MUTATED | 29 | 6 | 14 |
| 22Q LOSS WILD-TYPE | 113 | 185 | 60 |
Figure S93. Get High-res Image Gene #42: '22q loss mutation analysis' versus Clinical Feature #6: 'MRNASEQ_CHIERARCHICAL'

P value = 0.000284 (Fisher's exact test), Q value = 0.068
Table S94. Gene #42: '22q loss mutation analysis' versus Clinical Feature #7: 'MIRSEQ_CNMF'
| nPatients | CLUS_1 | CLUS_2 | CLUS_3 |
|---|---|---|---|
| ALL | 120 | 144 | 144 |
| 22Q LOSS MUTATED | 28 | 14 | 10 |
| 22Q LOSS WILD-TYPE | 92 | 130 | 134 |
Figure S94. Get High-res Image Gene #42: '22q loss mutation analysis' versus Clinical Feature #7: 'MIRSEQ_CNMF'

P value = 8.99e-05 (Fisher's exact test), Q value = 0.022
Table S95. Gene #42: '22q loss mutation analysis' versus Clinical Feature #8: 'MIRSEQ_CHIERARCHICAL'
| nPatients | CLUS_1 | CLUS_2 | CLUS_3 |
|---|---|---|---|
| ALL | 109 | 169 | 130 |
| 22Q LOSS MUTATED | 26 | 10 | 16 |
| 22Q LOSS WILD-TYPE | 83 | 159 | 114 |
Figure S95. Get High-res Image Gene #42: '22q loss mutation analysis' versus Clinical Feature #8: 'MIRSEQ_CHIERARCHICAL'
-
Mutation data file = broad_values_by_arm.mutsig.cluster.txt
-
Molecular subtypes file = THCA-TP.transferedmergedcluster.txt
-
Number of patients = 432
-
Number of significantly arm-level cnvs = 42
-
Number of molecular subtypes = 8
-
Exclude genes that fewer than K tumors have mutations, K = 3
For binary or multi-class clinical features (nominal or ordinal), two-tailed Fisher's exact tests (Fisher 1922) were used to estimate the P values using the 'fisher.test' function in R
For multiple hypothesis correction, Q value is the False Discovery Rate (FDR) analogue of the P value (Benjamini and Hochberg 1995), defined as the minimum FDR at which the test may be called significant. We used the 'Benjamini and Hochberg' method of 'p.adjust' function in R to convert P values into Q values.
This is an experimental feature. The full results of the analysis summarized in this report can be downloaded from the TCGA Data Coordination Center.