This pipeline calculates the significant amplified or deleted genomic regions within the given tumor data, using GISTIC version 2.
With data describing chromosomal aberrations in large tumor sets, the aberrations that drive tumorigenesis and the oncogenes and TSGs they most likely target can be identified if the following 4 issues are addressed: (i) The aberrations in each of the tumors must be accurately mapped; (ii) Driver aberrations that rise above the background rate of random passenger aberrations must be identified; (iii) For each driver aberration, the loci most likely to contain the targeted oncogenes or TSGs must be identified; (iv) Tumors must be classified as to whether they are aberrant at the predicted driver loci, so that the effects of those aberrations can be studied. The GISTIC algorithm tackles each issue in individual stages as discussed in [1] and [3].
Figure 1. Genomic positions of amplified regions: the X axis represents the normalized amplification signals (top) and significance by q-value (bottom). The green line represents the significance cutoff at q-value=0.25
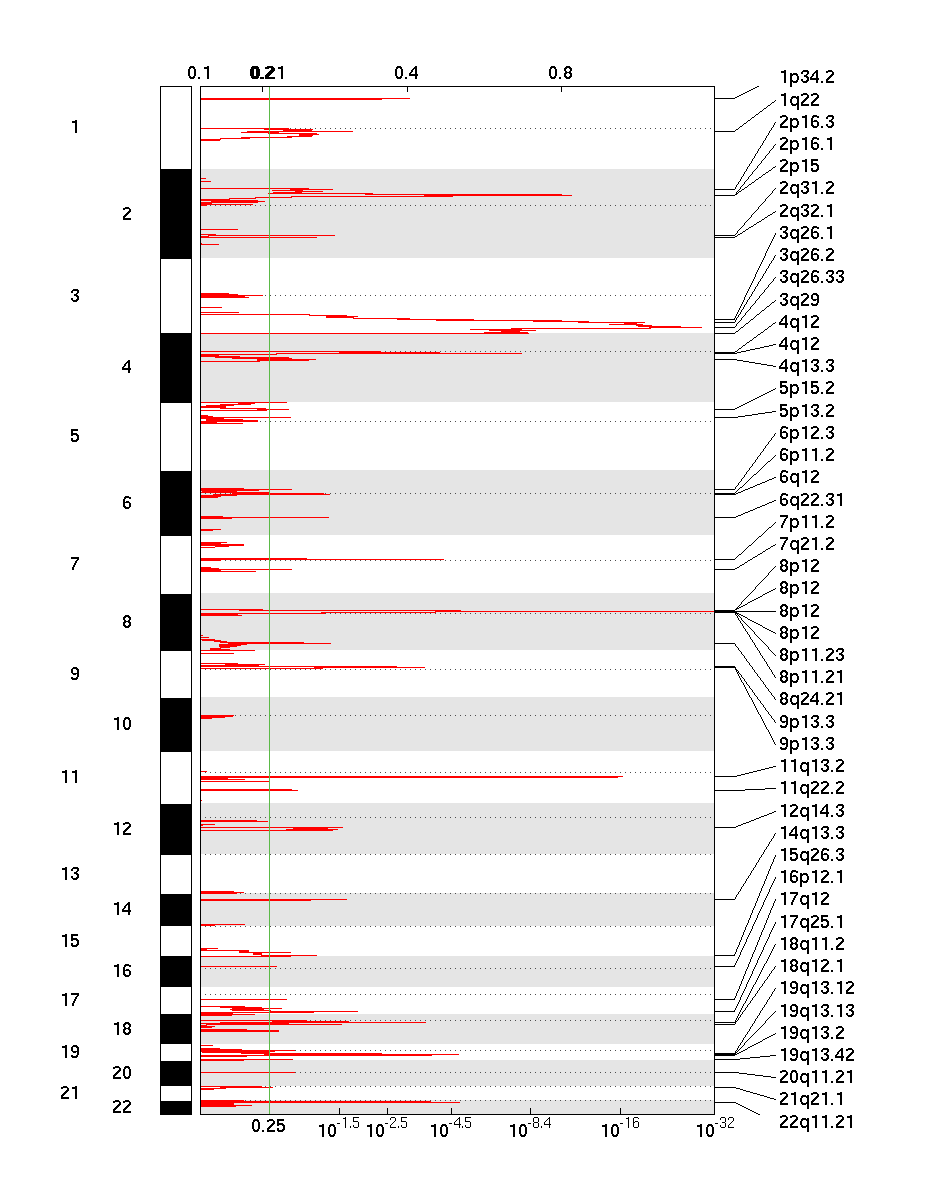
Figure 2. Genomic positions of deleted regions: the X axis represents the normalized deletion signals (top) and significance by q-value (bottom). The green line represents the significance cutoff at q-value=0.25
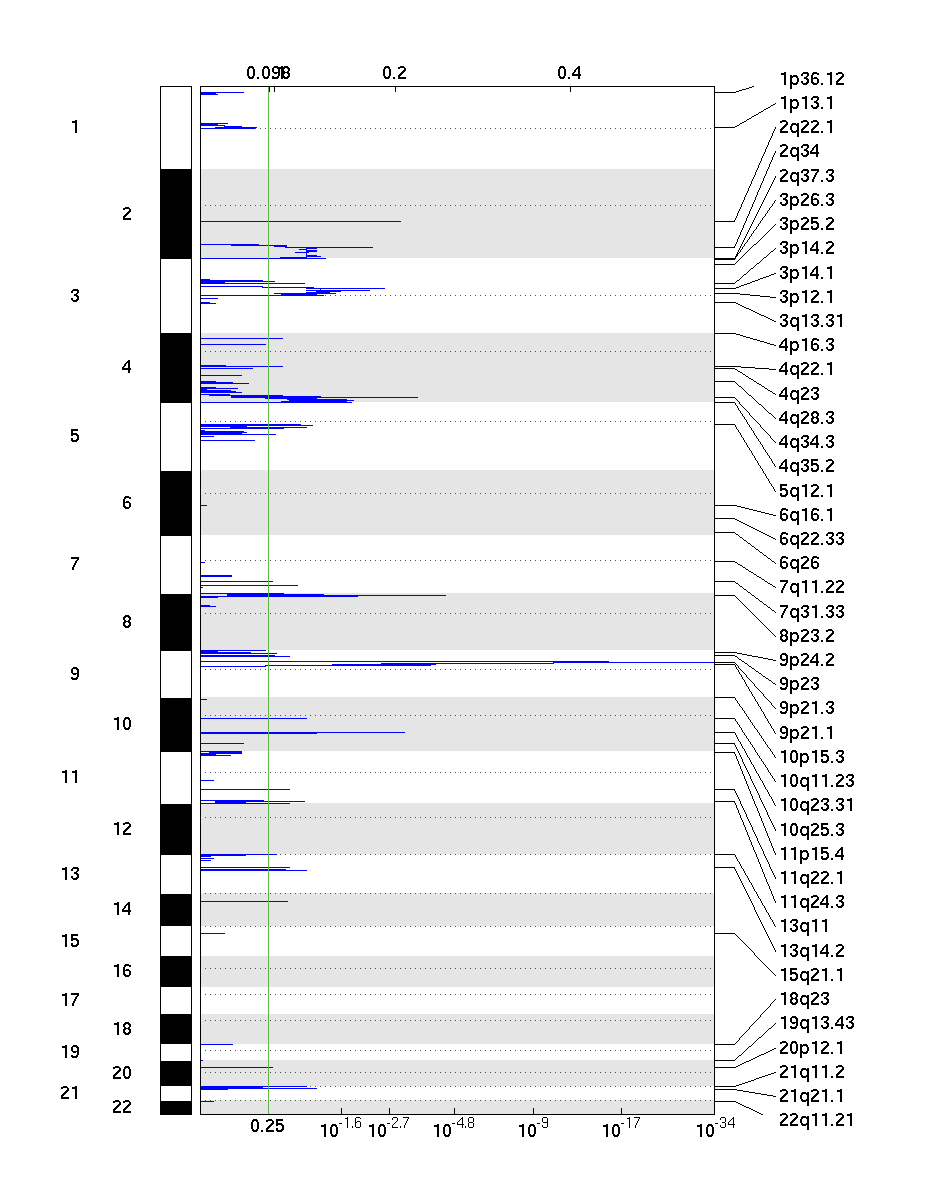
Table 1. Get Full Table The top 10 amplified and deleted regions.
| Type | Chromosome | Start | End | X.log10.q.value. | G.score | average.amplitude | frequency |
| Amp | 8 | 38290643 | 38329070 | 31.728107 | 1.77741 | 2.161259 | 0.408451 |
| Amp | 8 | 38343904 | 38366263 | 31.728107 | 1.771282 | 2.155292 | 0.408451 |
| Amp | 8 | 38369607 | 38389970 | 30.458883 | 1.718822 | 2.104214 | 0.408451 |
| Amp | 8 | 38284229 | 38289678 | 30.016184 | 1.700781 | 2.084005 | 0.408451 |
| Amp | 8 | 38397918 | 38398857 | 29.137204 | 1.660195 | 2.047561 | 0.408451 |
| Amp | 8 | 38393432 | 38397898 | 29.137204 | 1.648417 | 2.035663 | 0.408451 |
| Amp | 3 | 184087177 | 184312238 | 29.137204 | 1.642966 | 1.802809 | 0.852113 |
| Amp | 3 | 183853170 | 183931470 | 28.972385 | 1.628232 | 1.79645 | 0.852113 |
| Amp | 3 | 183945255 | 183962603 | 28.972385 | 1.626656 | 1.803682 | 0.84507 |
| Amp | 3 | 184313822 | 184507464 | 28.972385 | 1.622031 | 1.793181 | 0.852113 |
| Del | 9 | 21947144 | 21949051 | 33.922976 | 0.753291 | 0.77765 | 0.584507 |
| Del | 9 | 21953430 | 21968443 | 32.335187 | 0.730673 | 0.768841 | 0.577465 |
| Del | 9 | 21946078 | 21946914 | 32.262045 | 0.727666 | 0.767258 | 0.584507 |
| Del | 9 | 21993981 | 21995394 | 31.623516 | 0.71538 | 0.763761 | 0.584507 |
| Del | 9 | 21968615 | 21993713 | 31.390753 | 0.709073 | 0.764535 | 0.577465 |
| Del | 9 | 21941384 | 21944953 | 31.17171 | 0.706067 | 0.762191 | 0.584507 |
| Del | 9 | 21999960 | 22025479 | 31.170112 | 0.704185 | 0.764122 | 0.577465 |
| Del | 9 | 21923125 | 21939761 | 30.487667 | 0.694872 | 0.762533 | 0.577465 |
| Del | 9 | 21908580 | 21922525 | 29.336198 | 0.679811 | 0.758316 | 0.577465 |
| Del | 9 | 22027369 | 22062730 | 29.258482 | 0.677099 | 0.755057 | 0.577465 |
GISTIC takes segmented copy number signals as input and calculates the aggregated significance across samples, probe-by-probe. Statistical significance (q-value) is based on permutation-based test by randomizing probe labels across the genome. As shown above, the method outputs genomic views of significantly amplified and deleted regions, as well as a table of genes with gain or loss scores.