The Broad GDAC mirrors data from the DCC on a daily basis. Although all data is mirrored, not every sample is ingested into Firehose. There are three main mechanisms that filter samples to ensure that only the most scientifically relevant samples make it into our standard data and analyses runs. These three mechanisms are redactions, replicate filtering, and blacklisting. This report summarizes the data that is ingested into Firehose, describes the three filtering mechanisms, and lists those samples that are removed.
There were 115 redacted samples, 2463 replicate aliquots, and 23 blacklisted aliquots. The table below represents the sample counts for those samples that were ingested into firehose after filtering out redactions, replicates, and blacklisted data.
Table 1. Get Full Table Summary of TCGA Tumor Data. Click on a tumor type to display a tumor type specific Samples Summary Report.
| Tumor | BCR | Clinical | CN | LowP | Methylation | mRNA | mRNASeq | miR | miRSeq | RPPA | MAF |
|---|---|---|---|---|---|---|---|---|---|---|---|
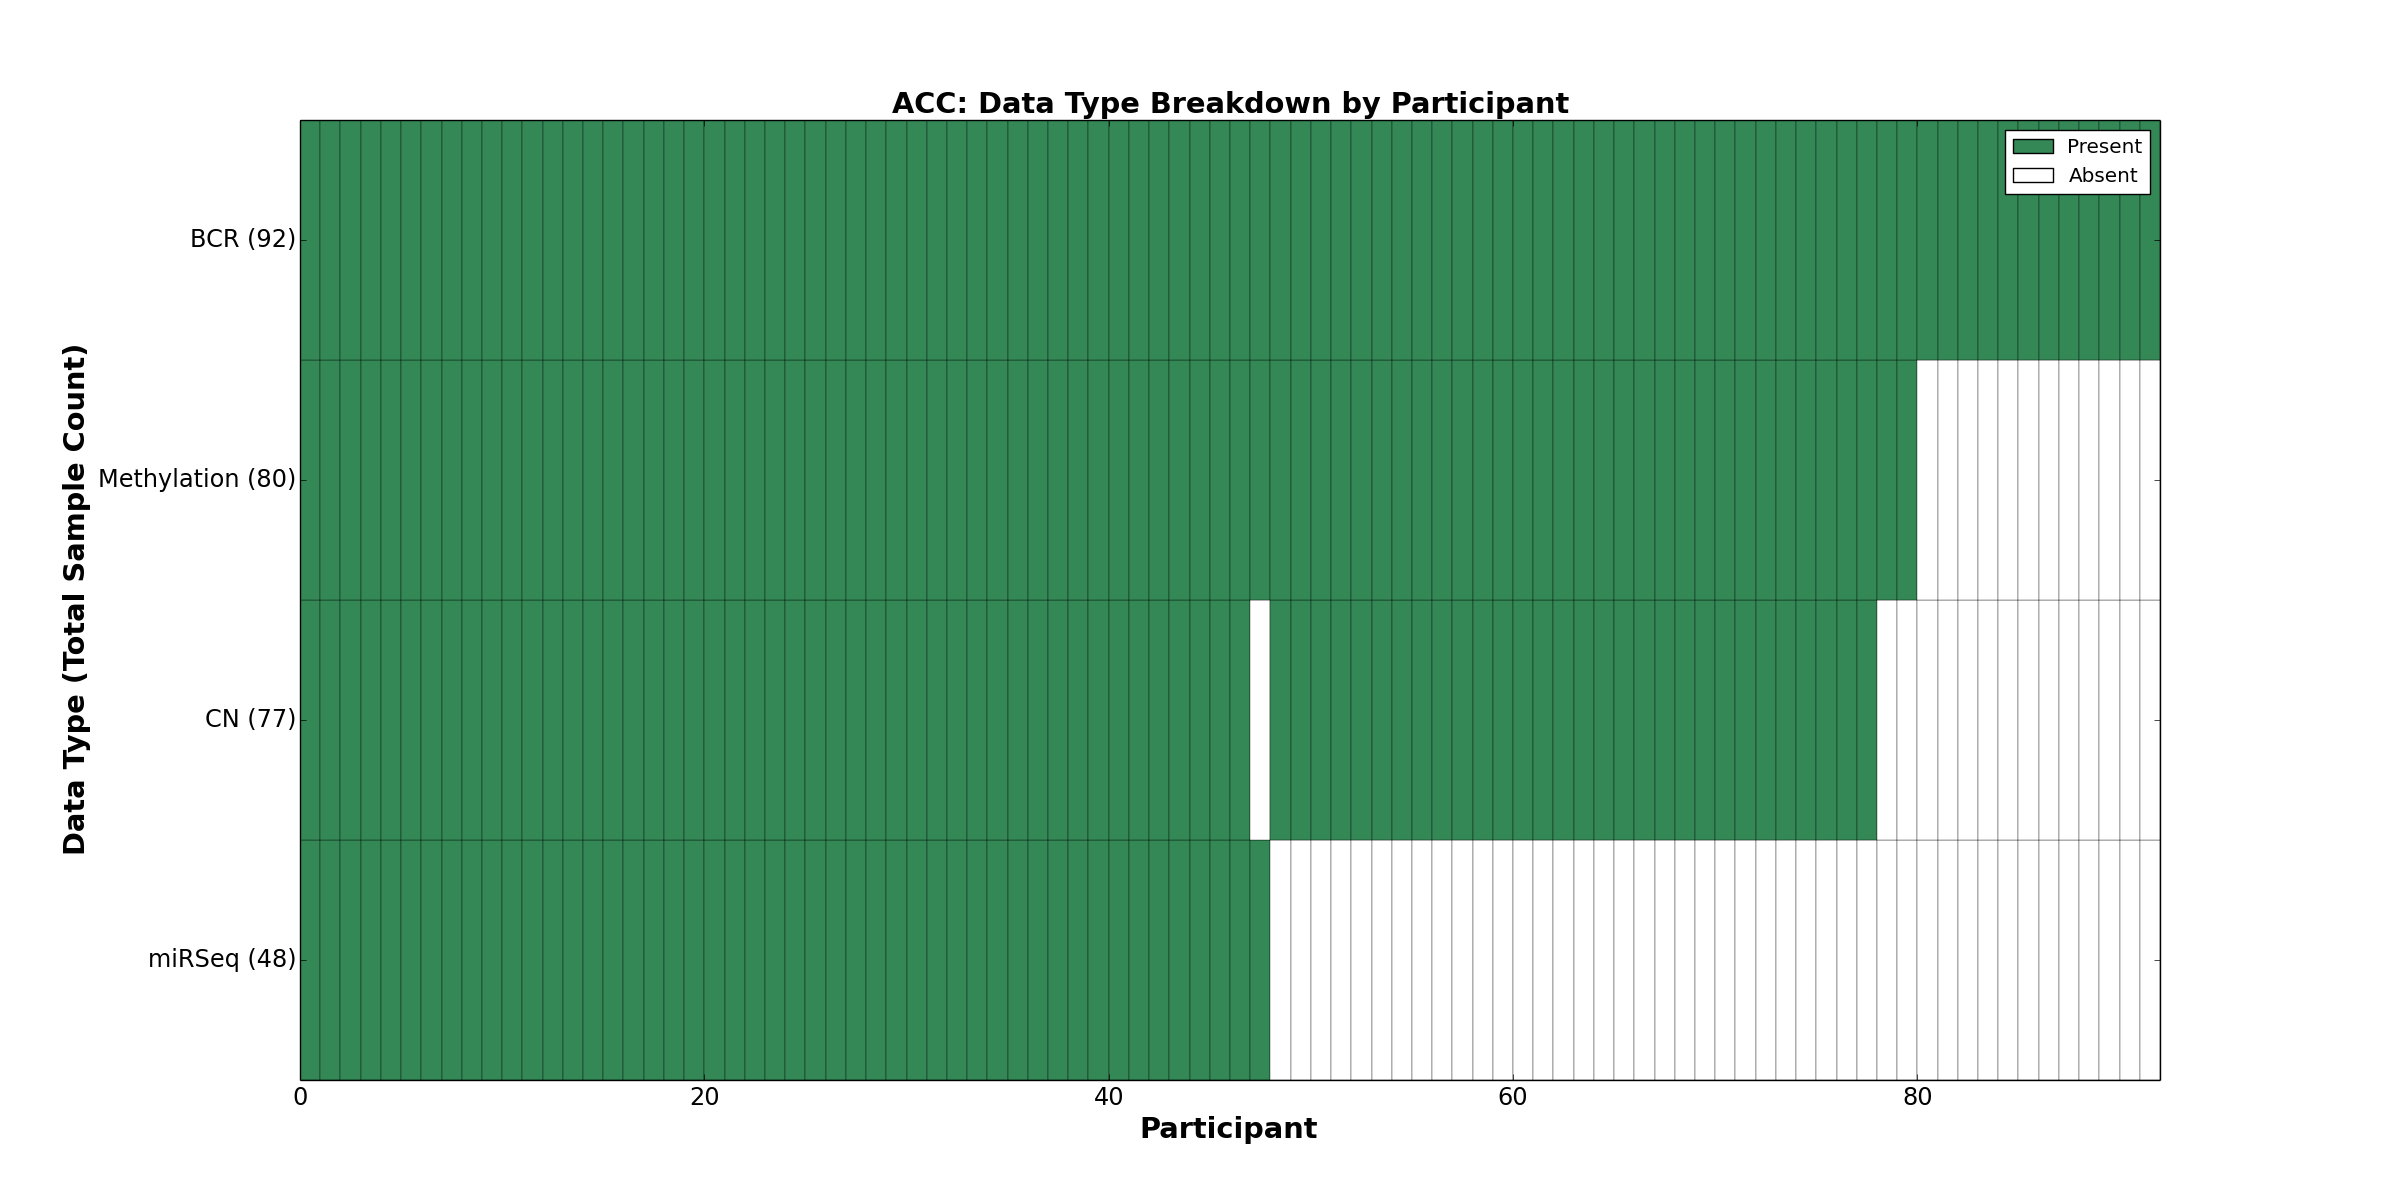
| ACC | 92 | 0 | 77 | 0 | 80 | 0 | 0 | 0 | 48 | 0 | 0 |
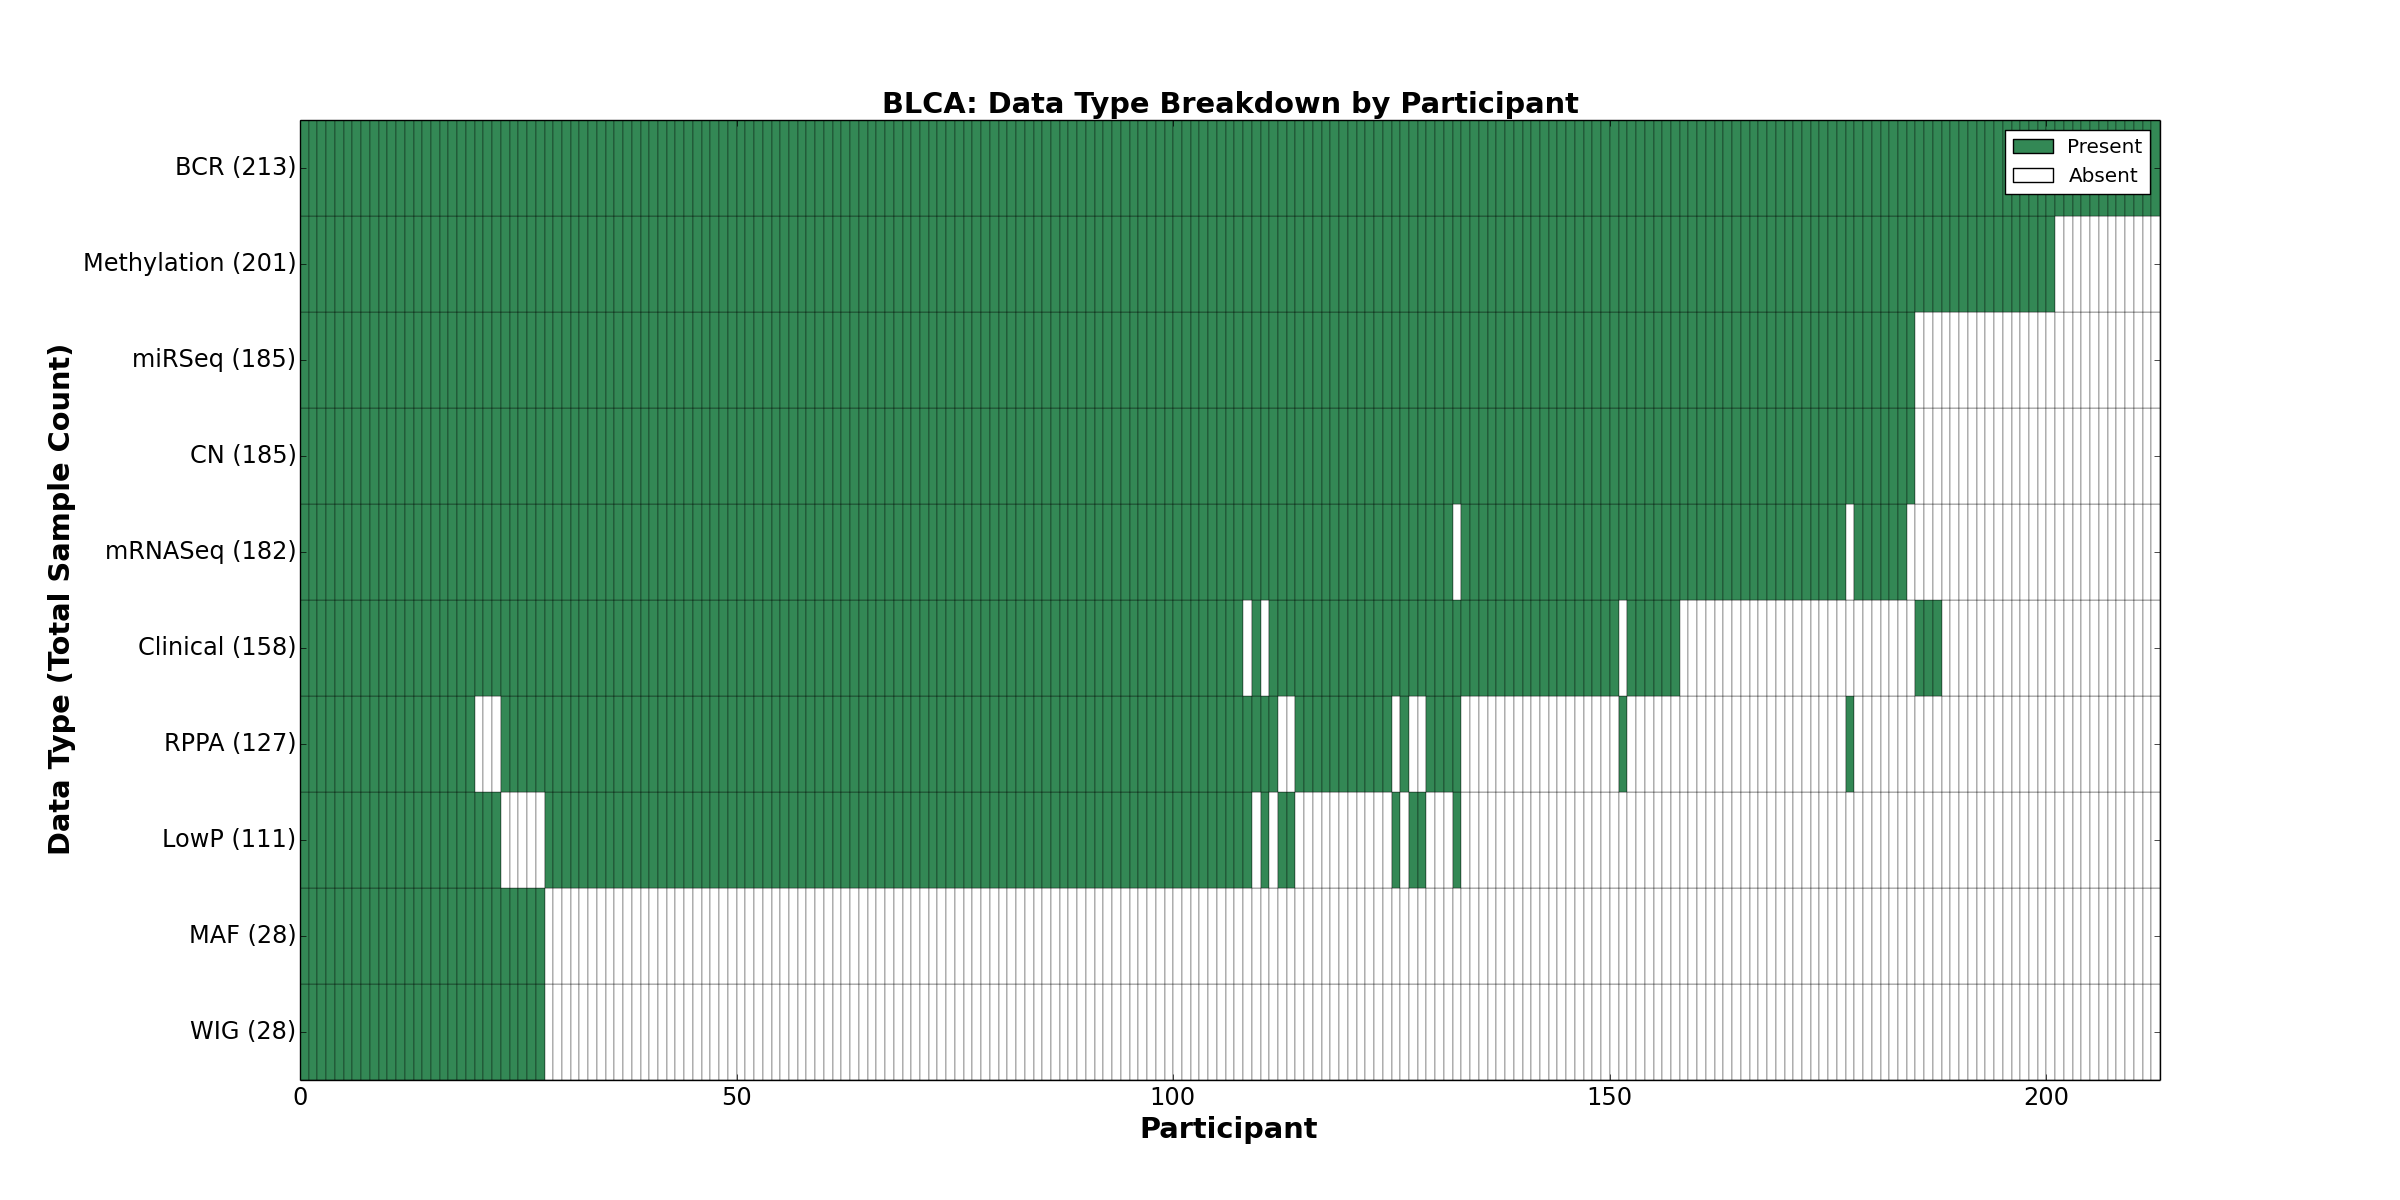
| BLCA | 213 | 158 | 185 | 111 | 201 | 0 | 182 | 0 | 185 | 127 | 28 |
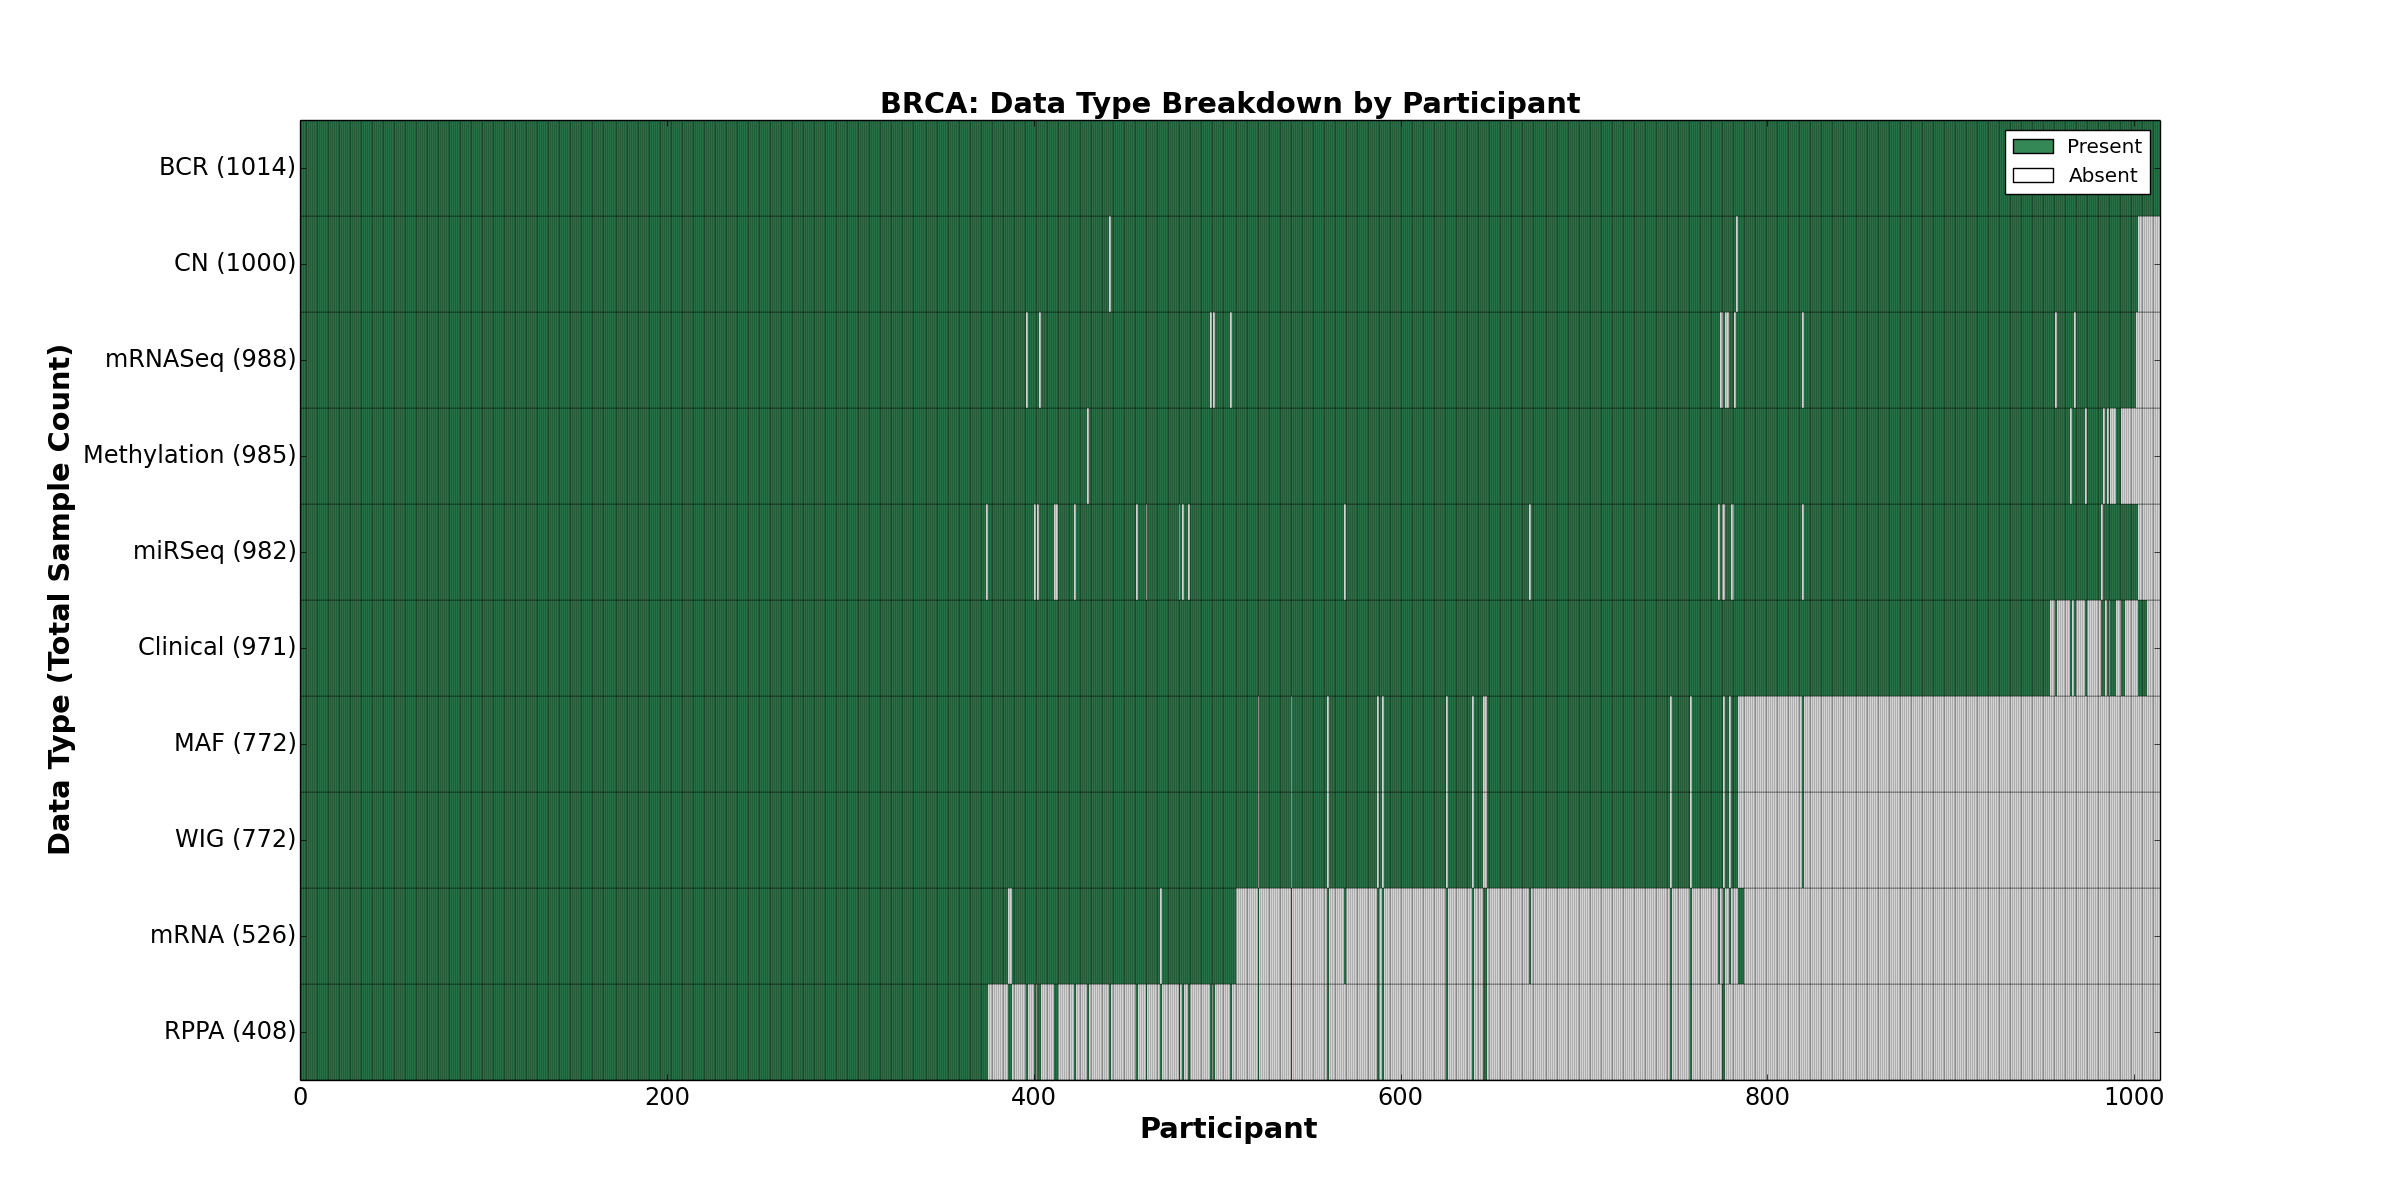
| BRCA | 1014 | 971 | 1000 | 0 | 985 | 526 | 988 | 0 | 982 | 408 | 772 |
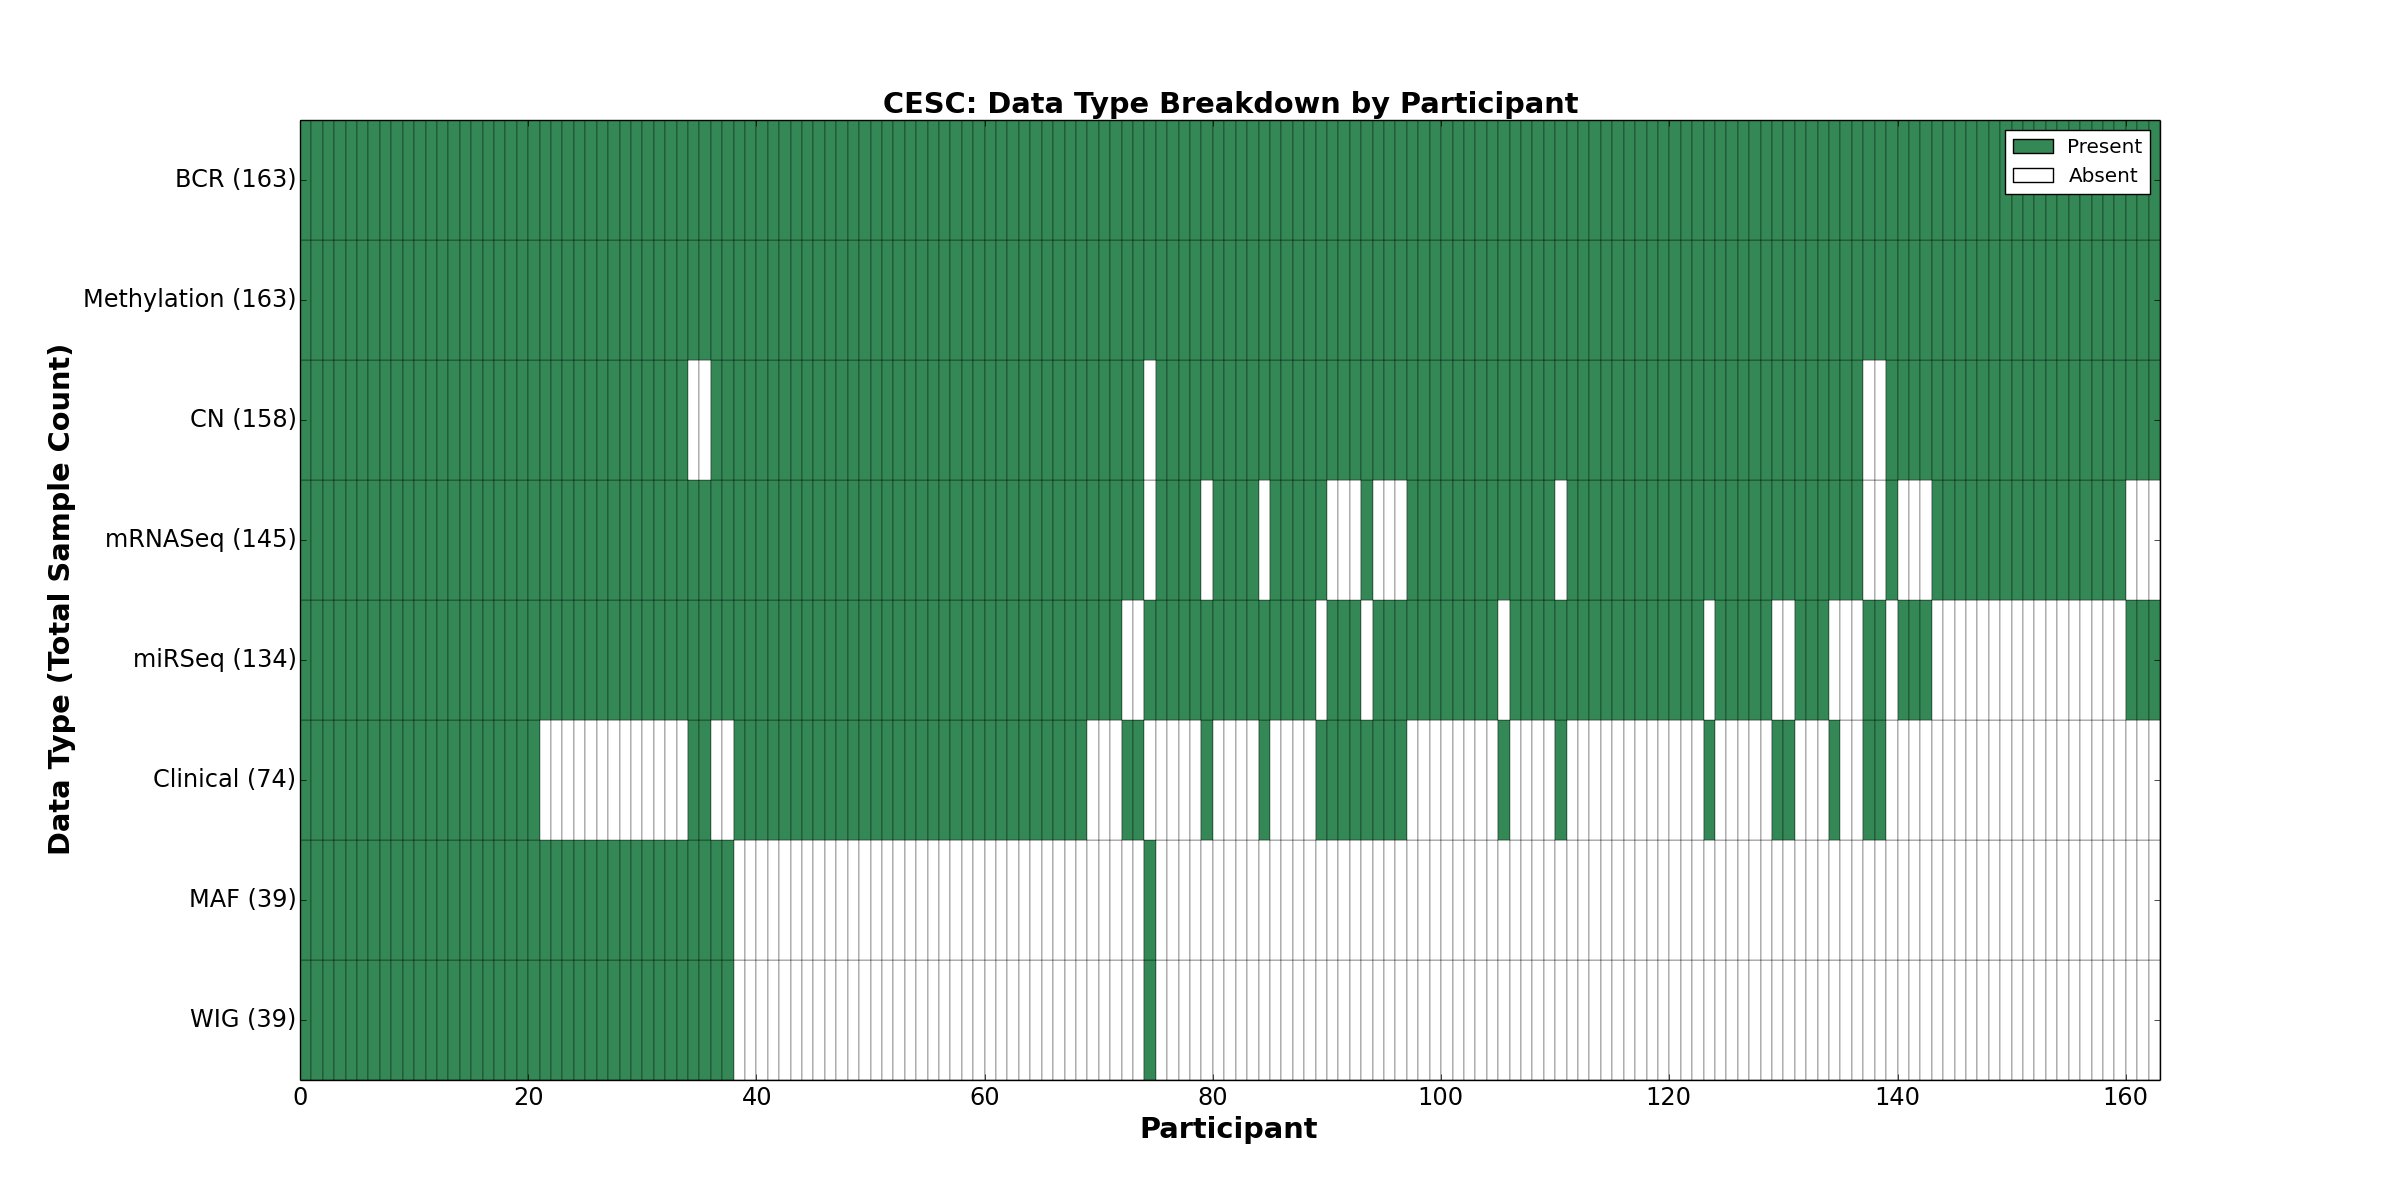
| CESC | 163 | 74 | 158 | 0 | 163 | 0 | 145 | 0 | 134 | 0 | 39 |
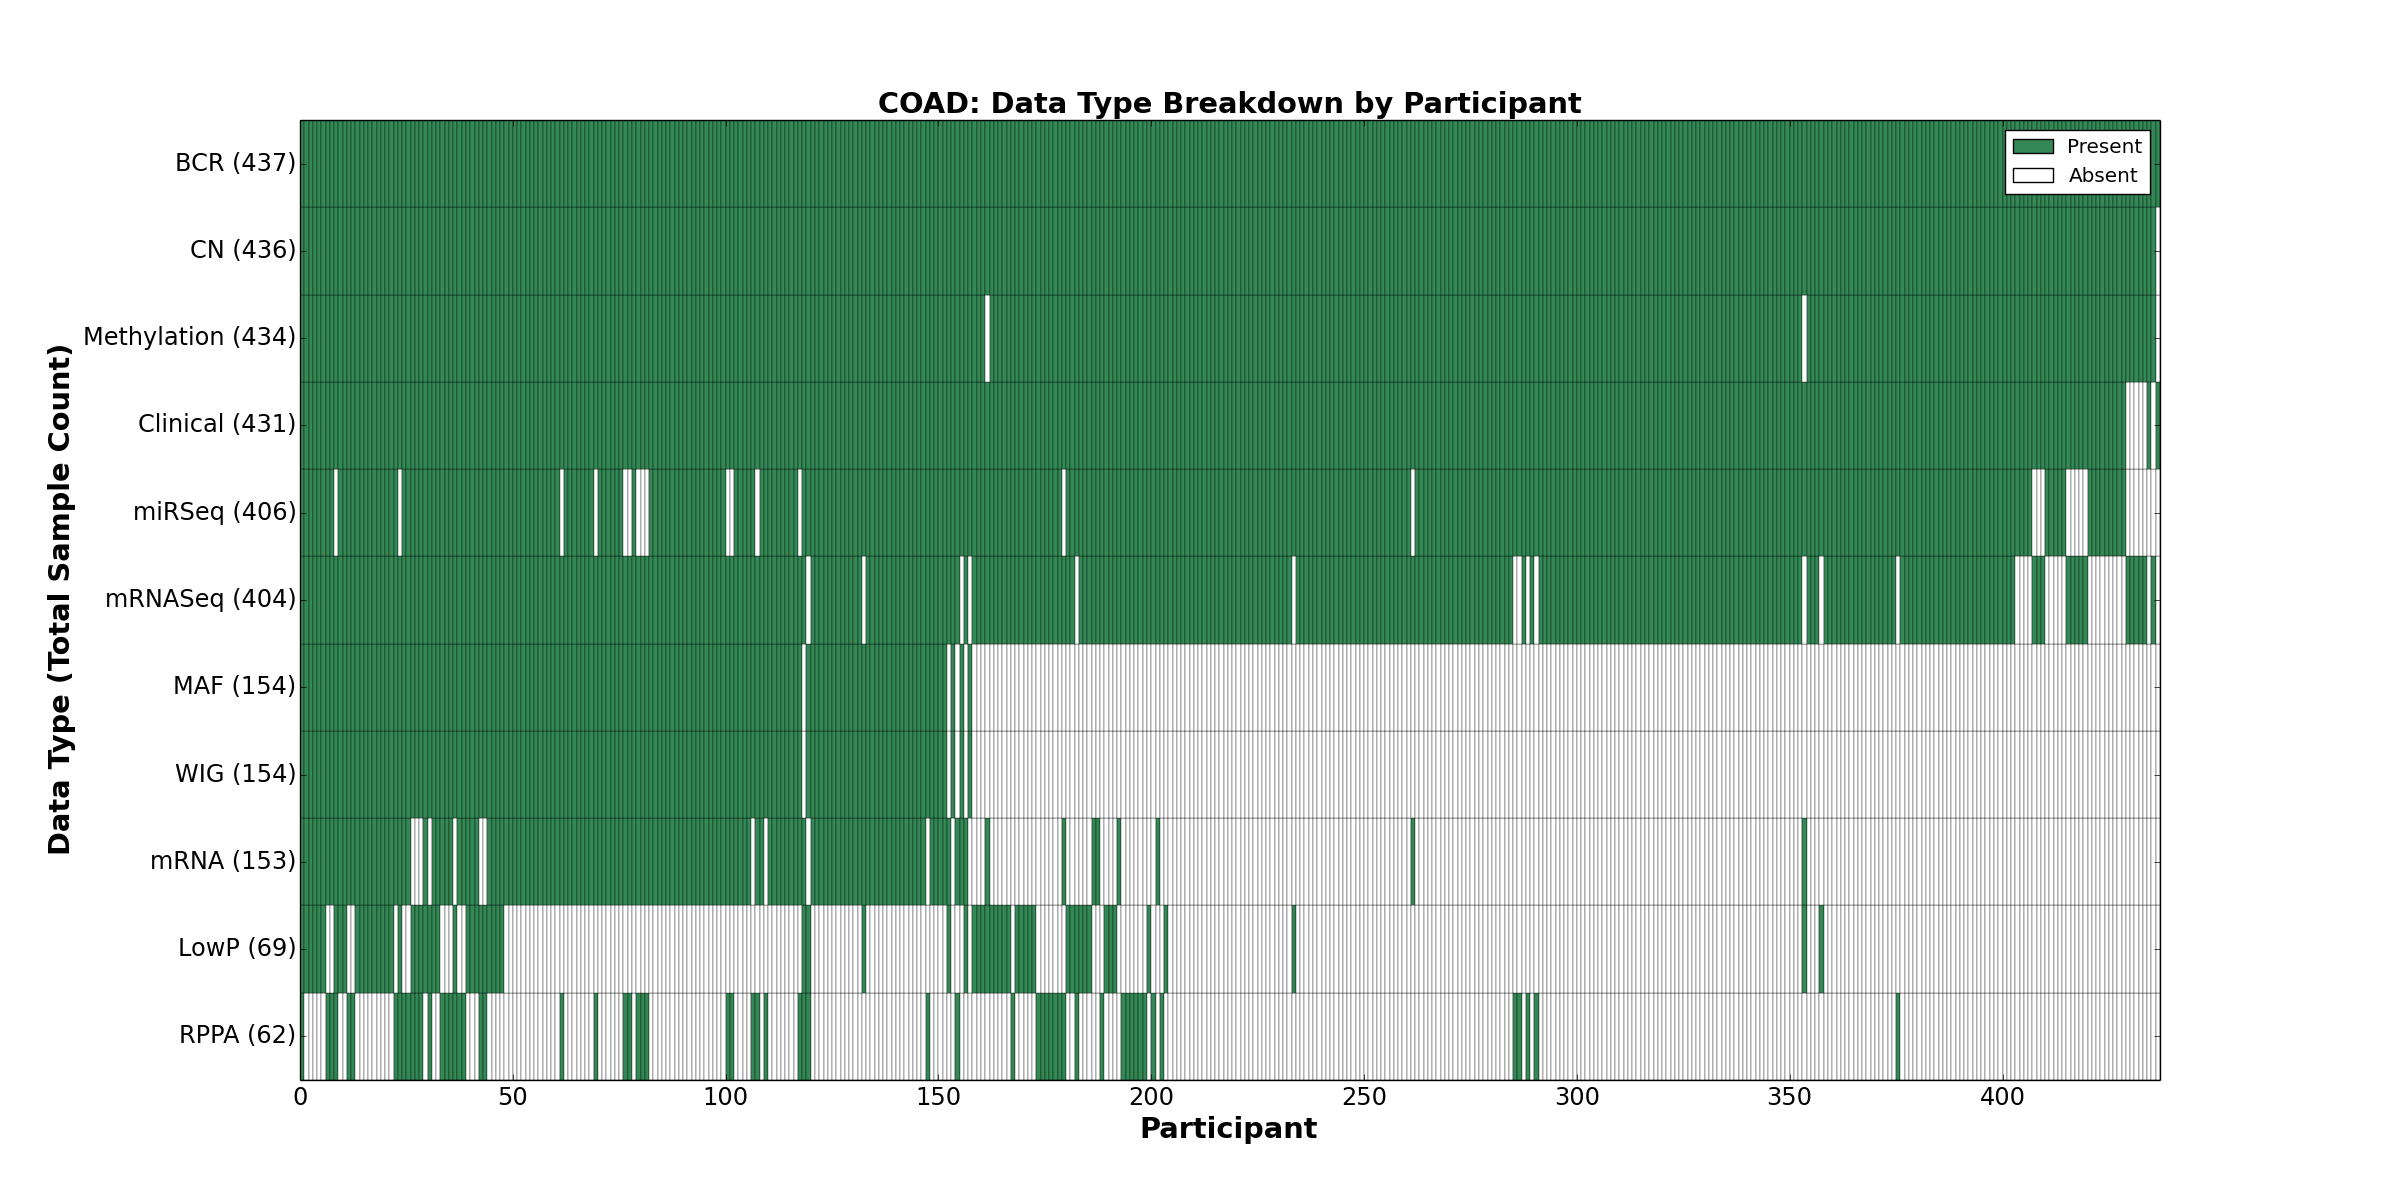
| COAD | 437 | 431 | 436 | 69 | 434 | 153 | 404 | 0 | 406 | 62 | 154 |
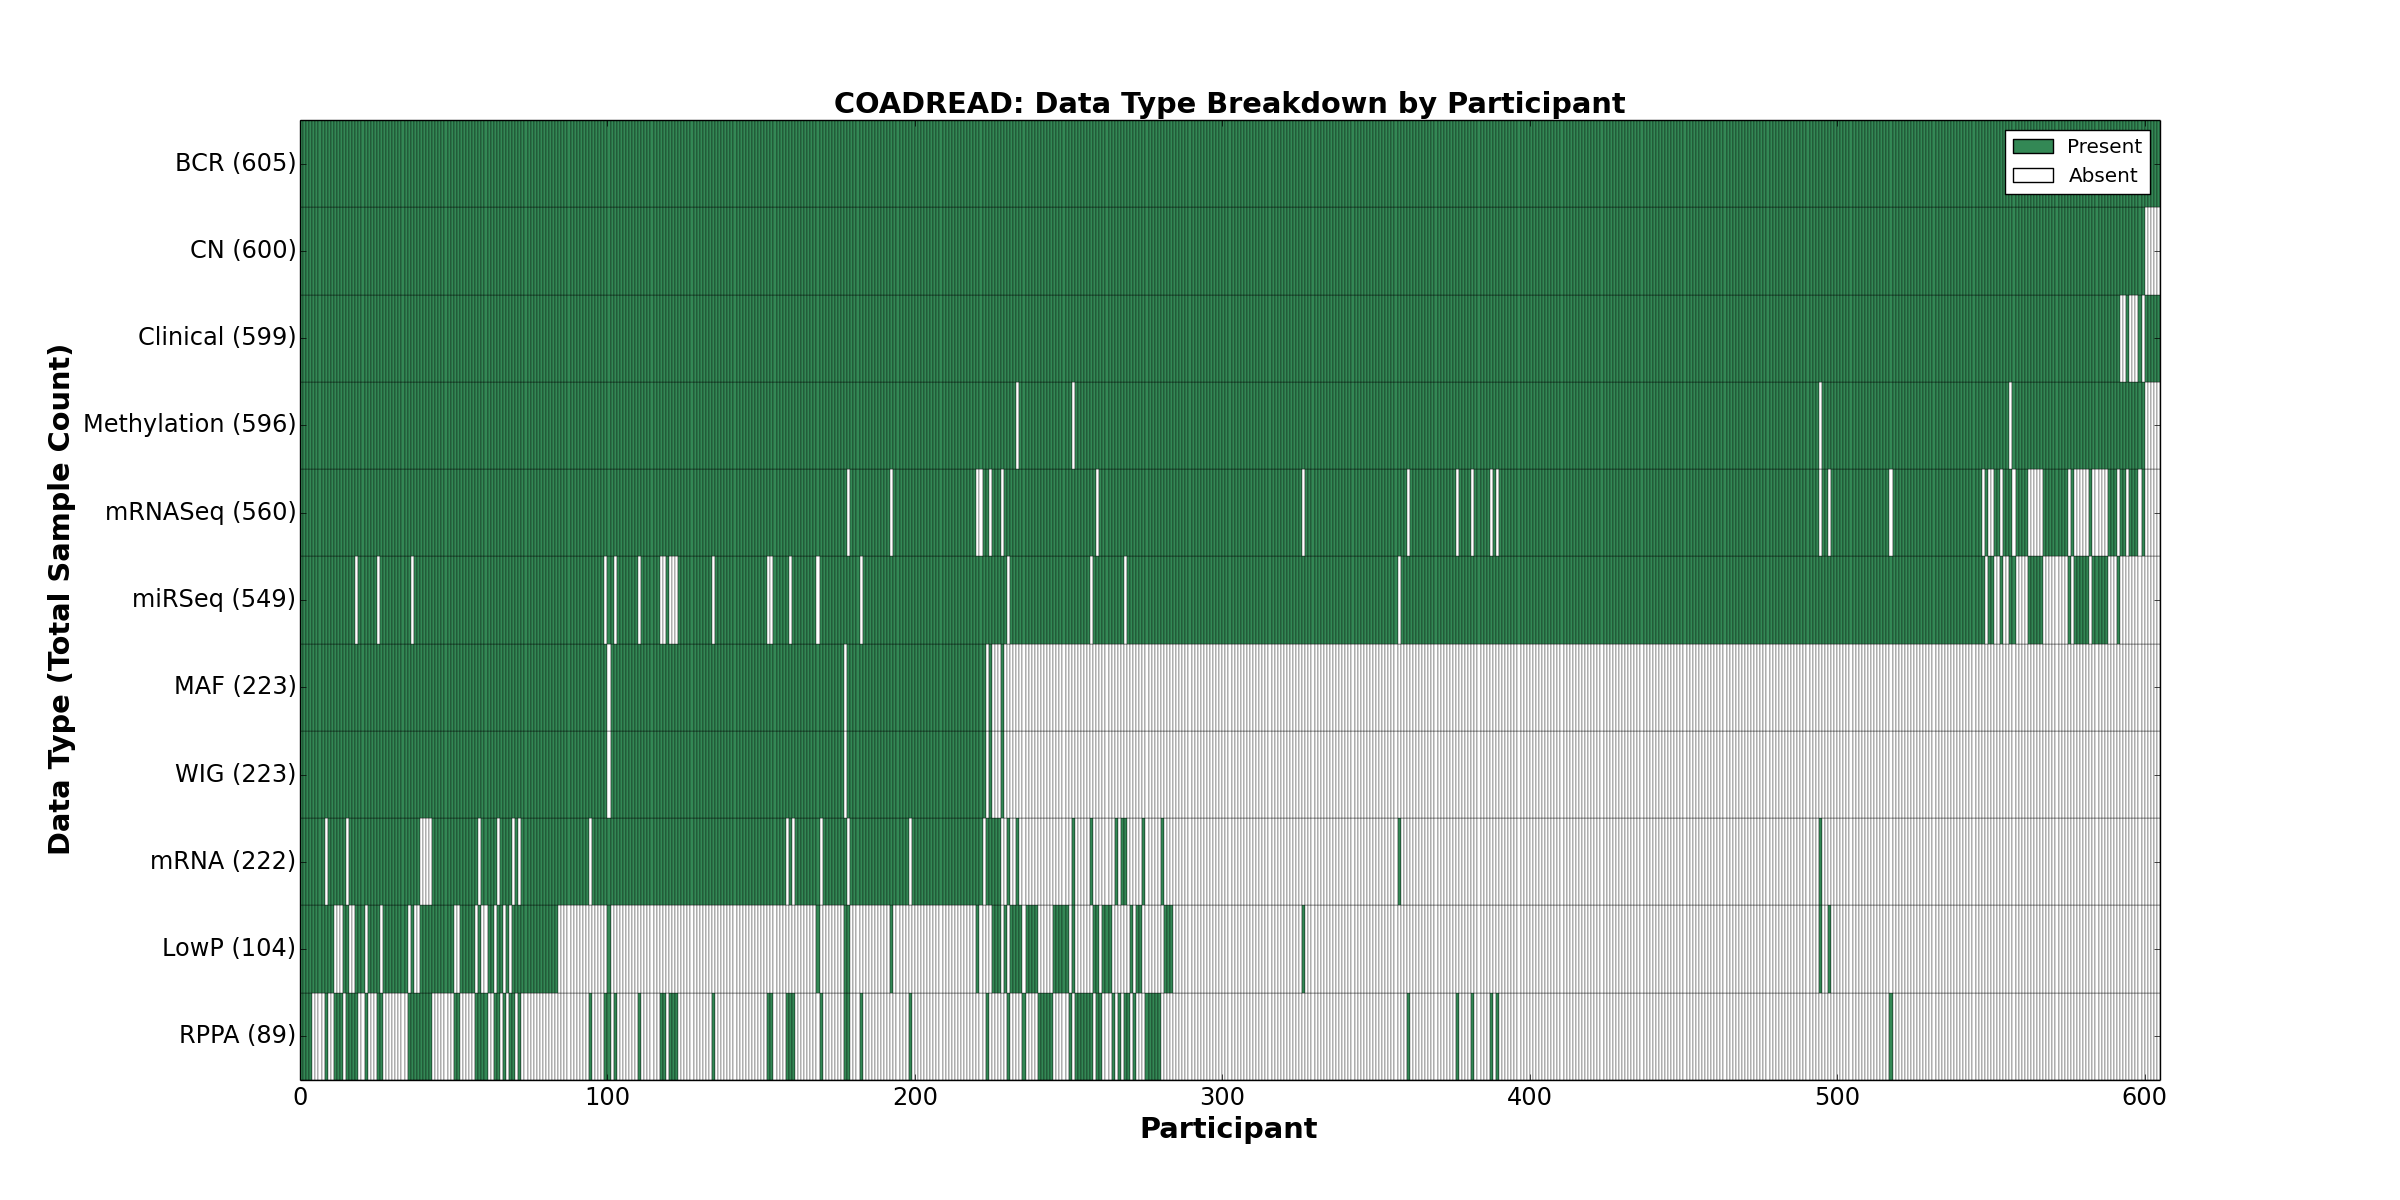
| COADREAD | 605 | 599 | 600 | 104 | 596 | 222 | 560 | 0 | 549 | 89 | 223 |
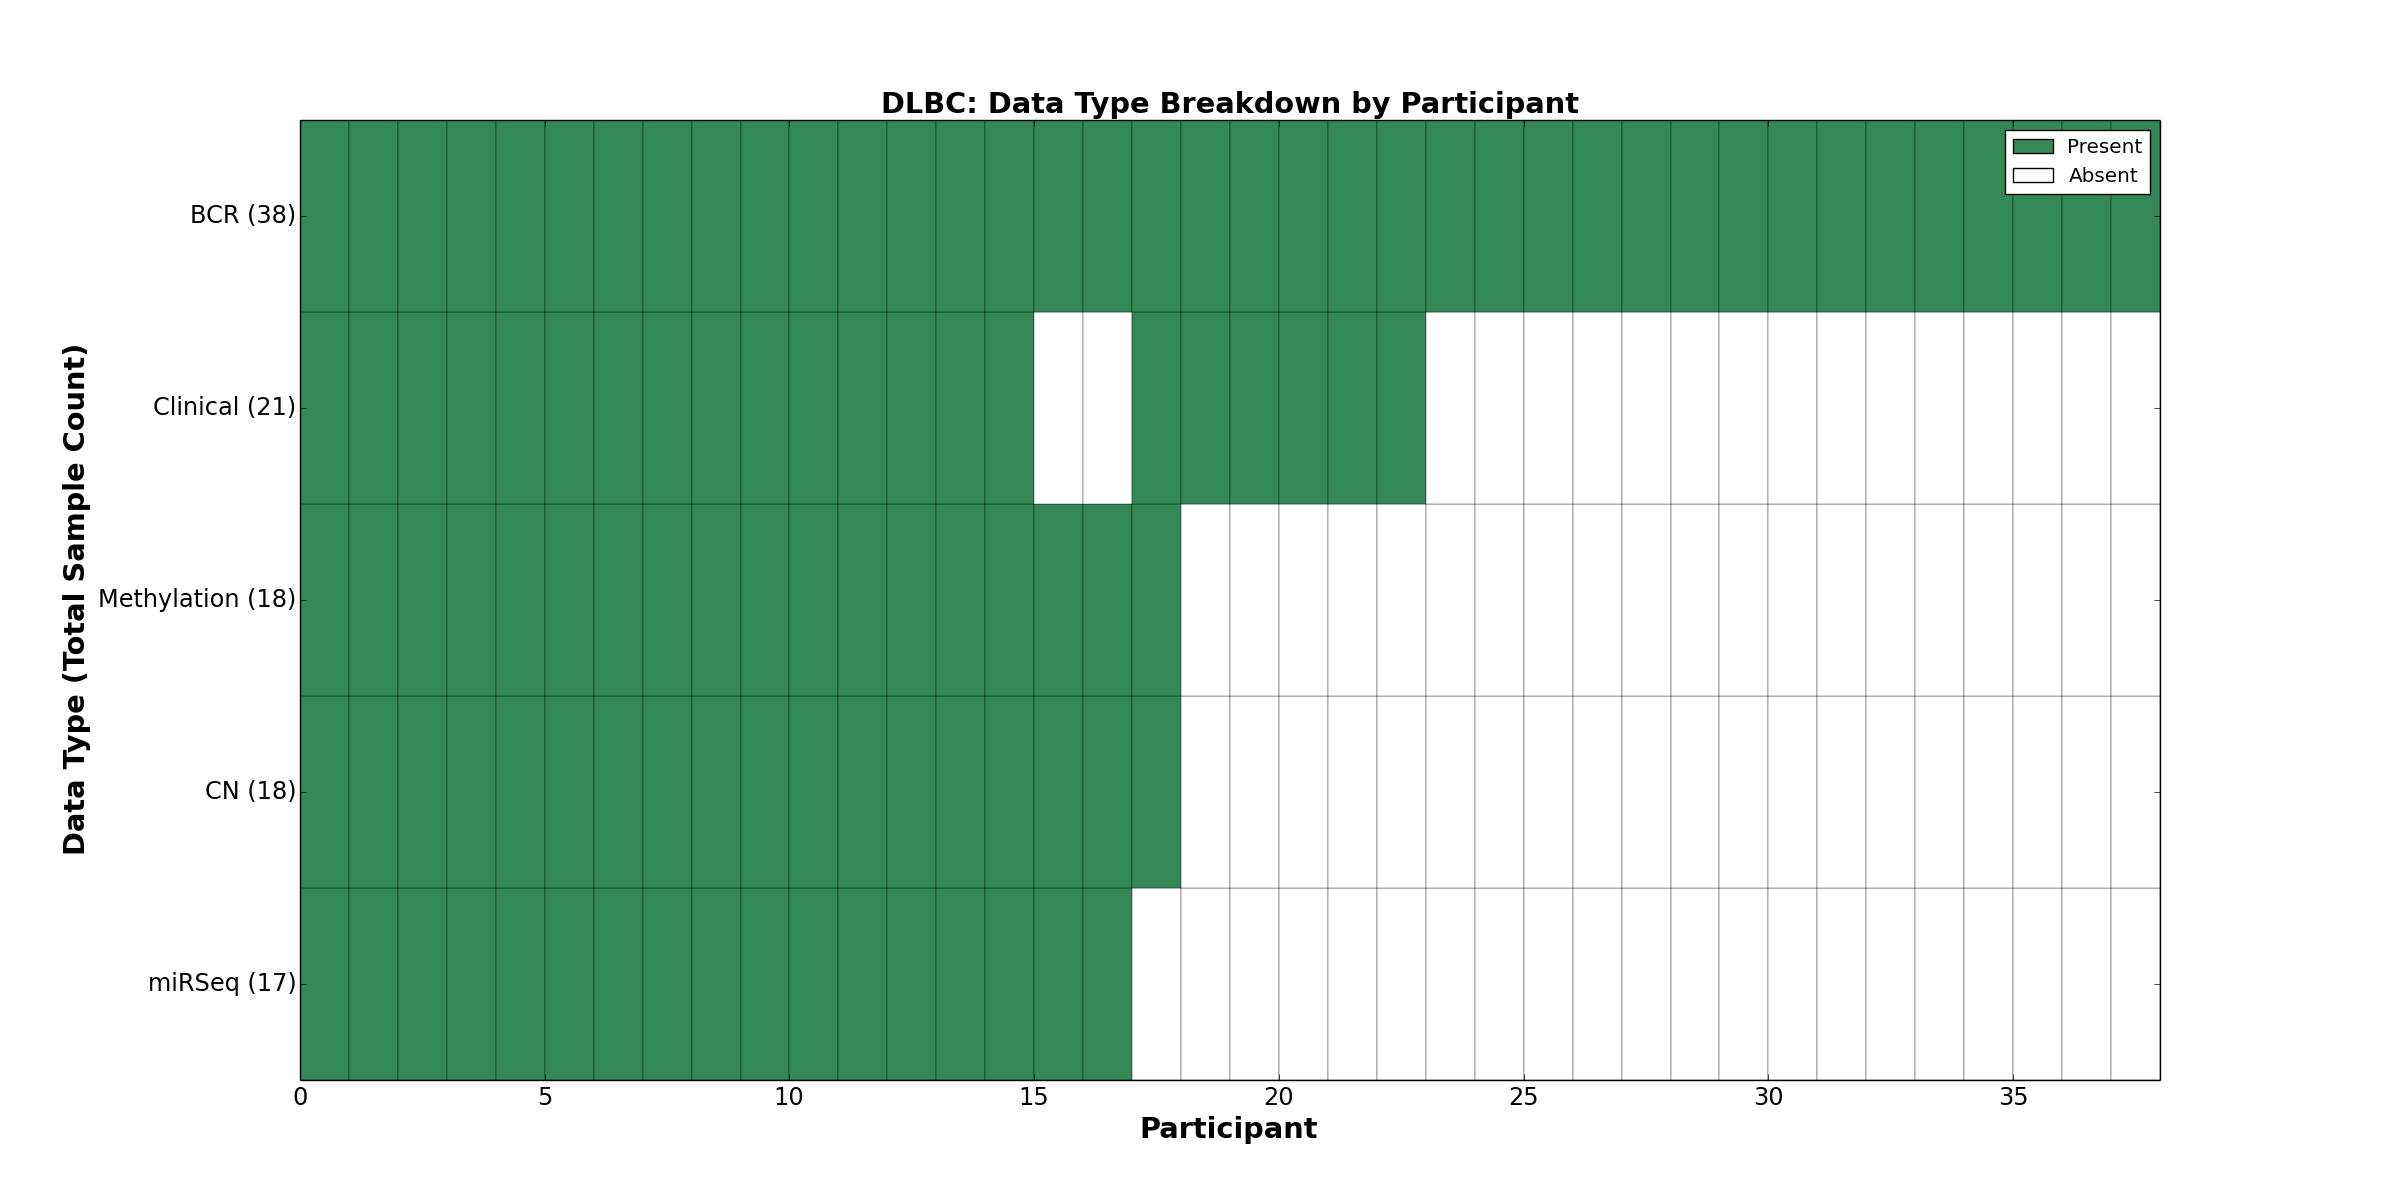
| DLBC | 38 | 21 | 18 | 0 | 18 | 0 | 0 | 0 | 17 | 0 | 0 |
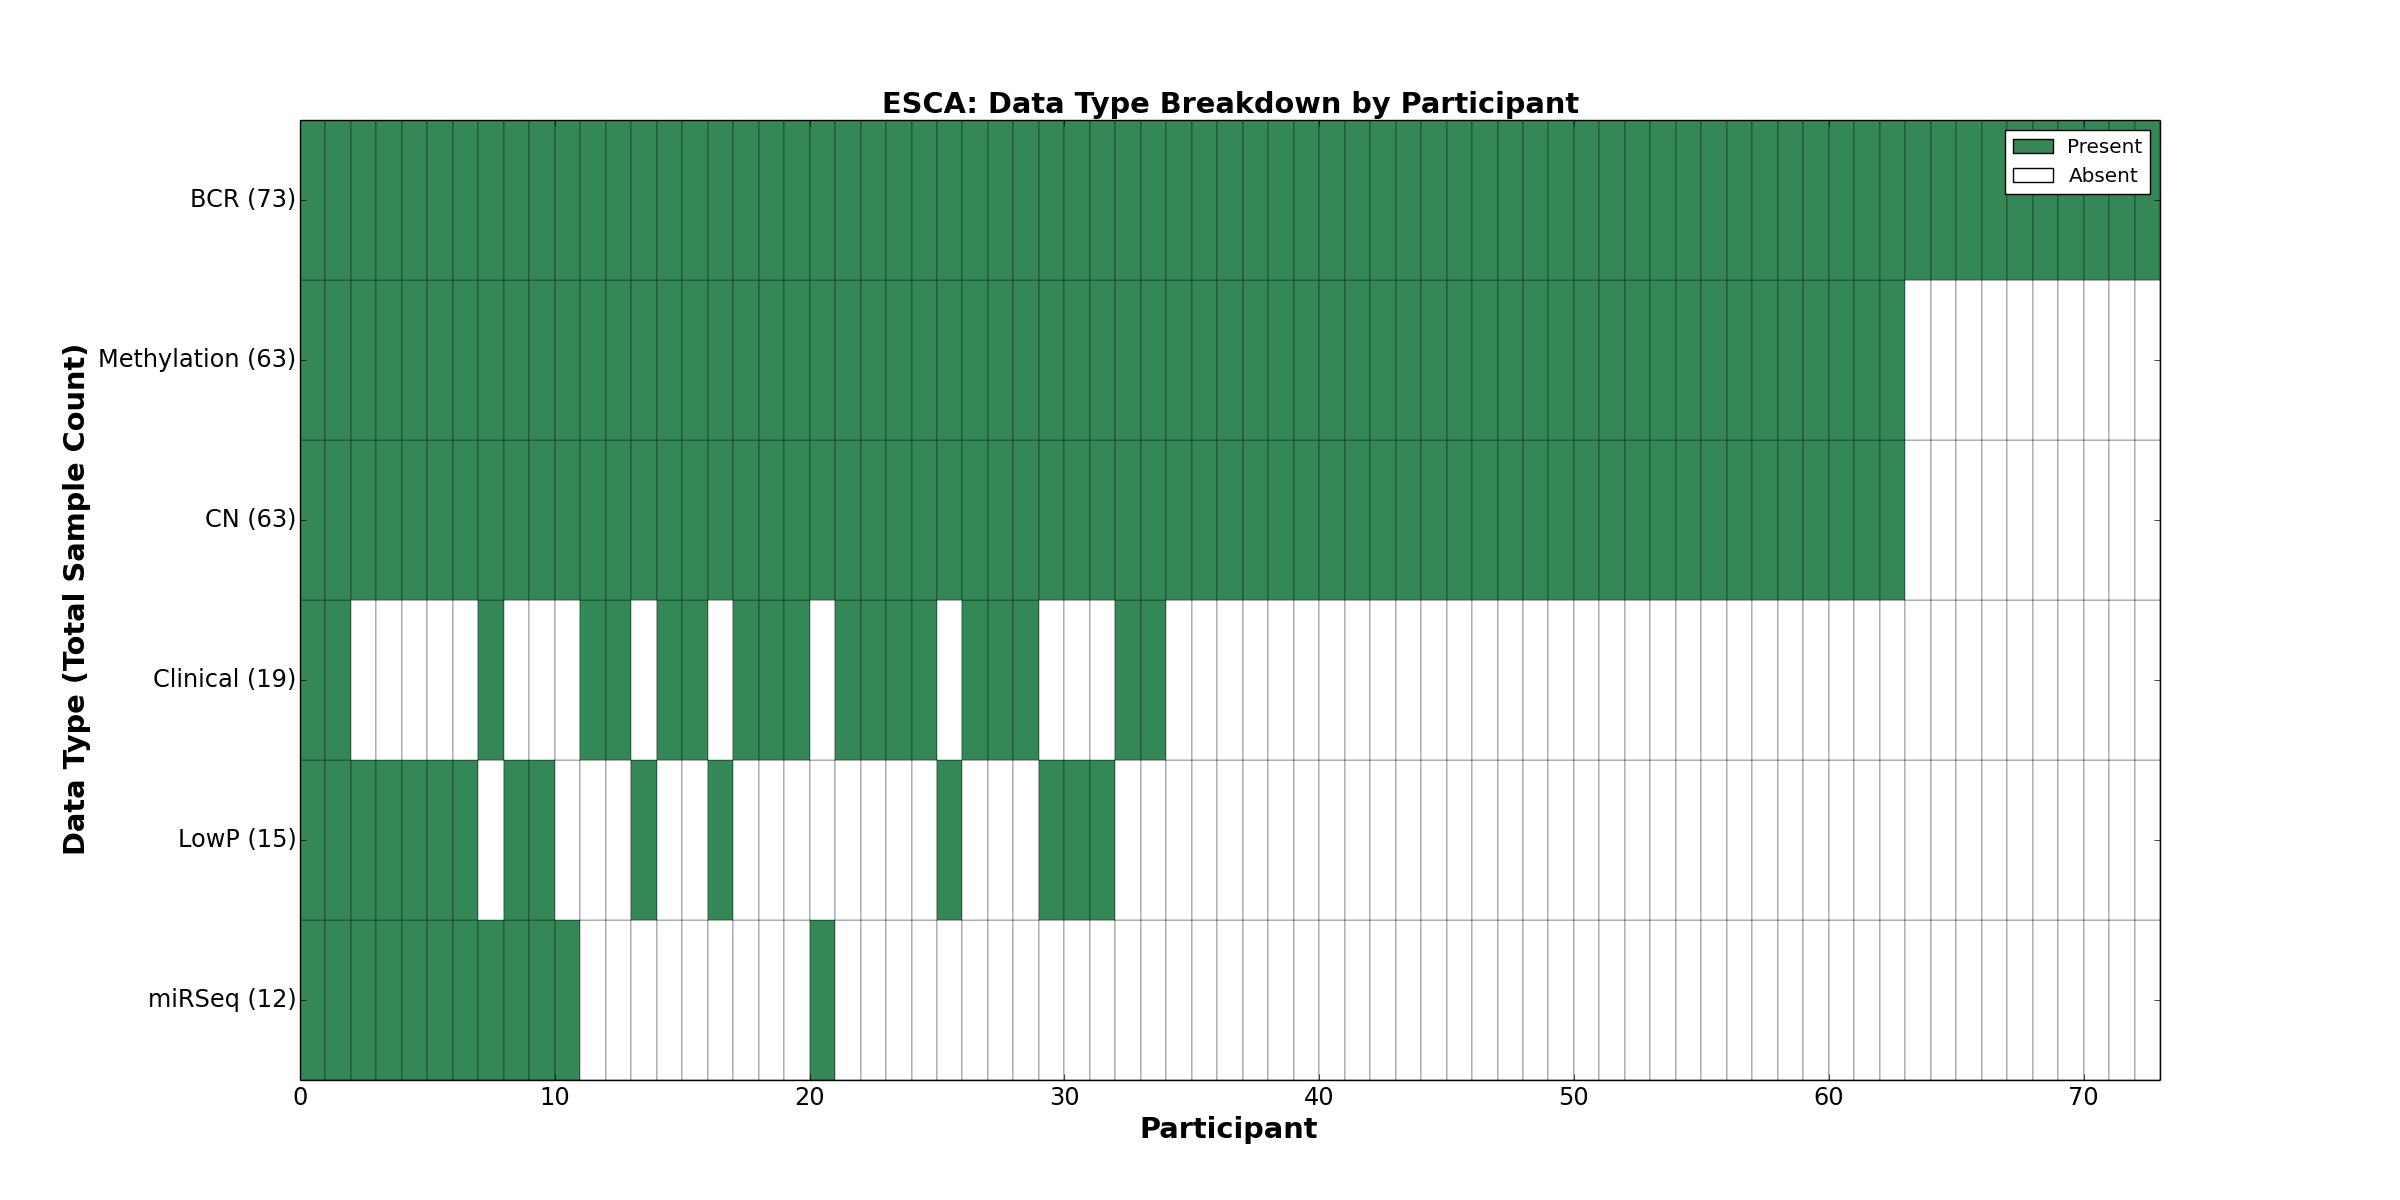
| ESCA | 73 | 19 | 63 | 15 | 63 | 0 | 0 | 0 | 12 | 0 | 0 |
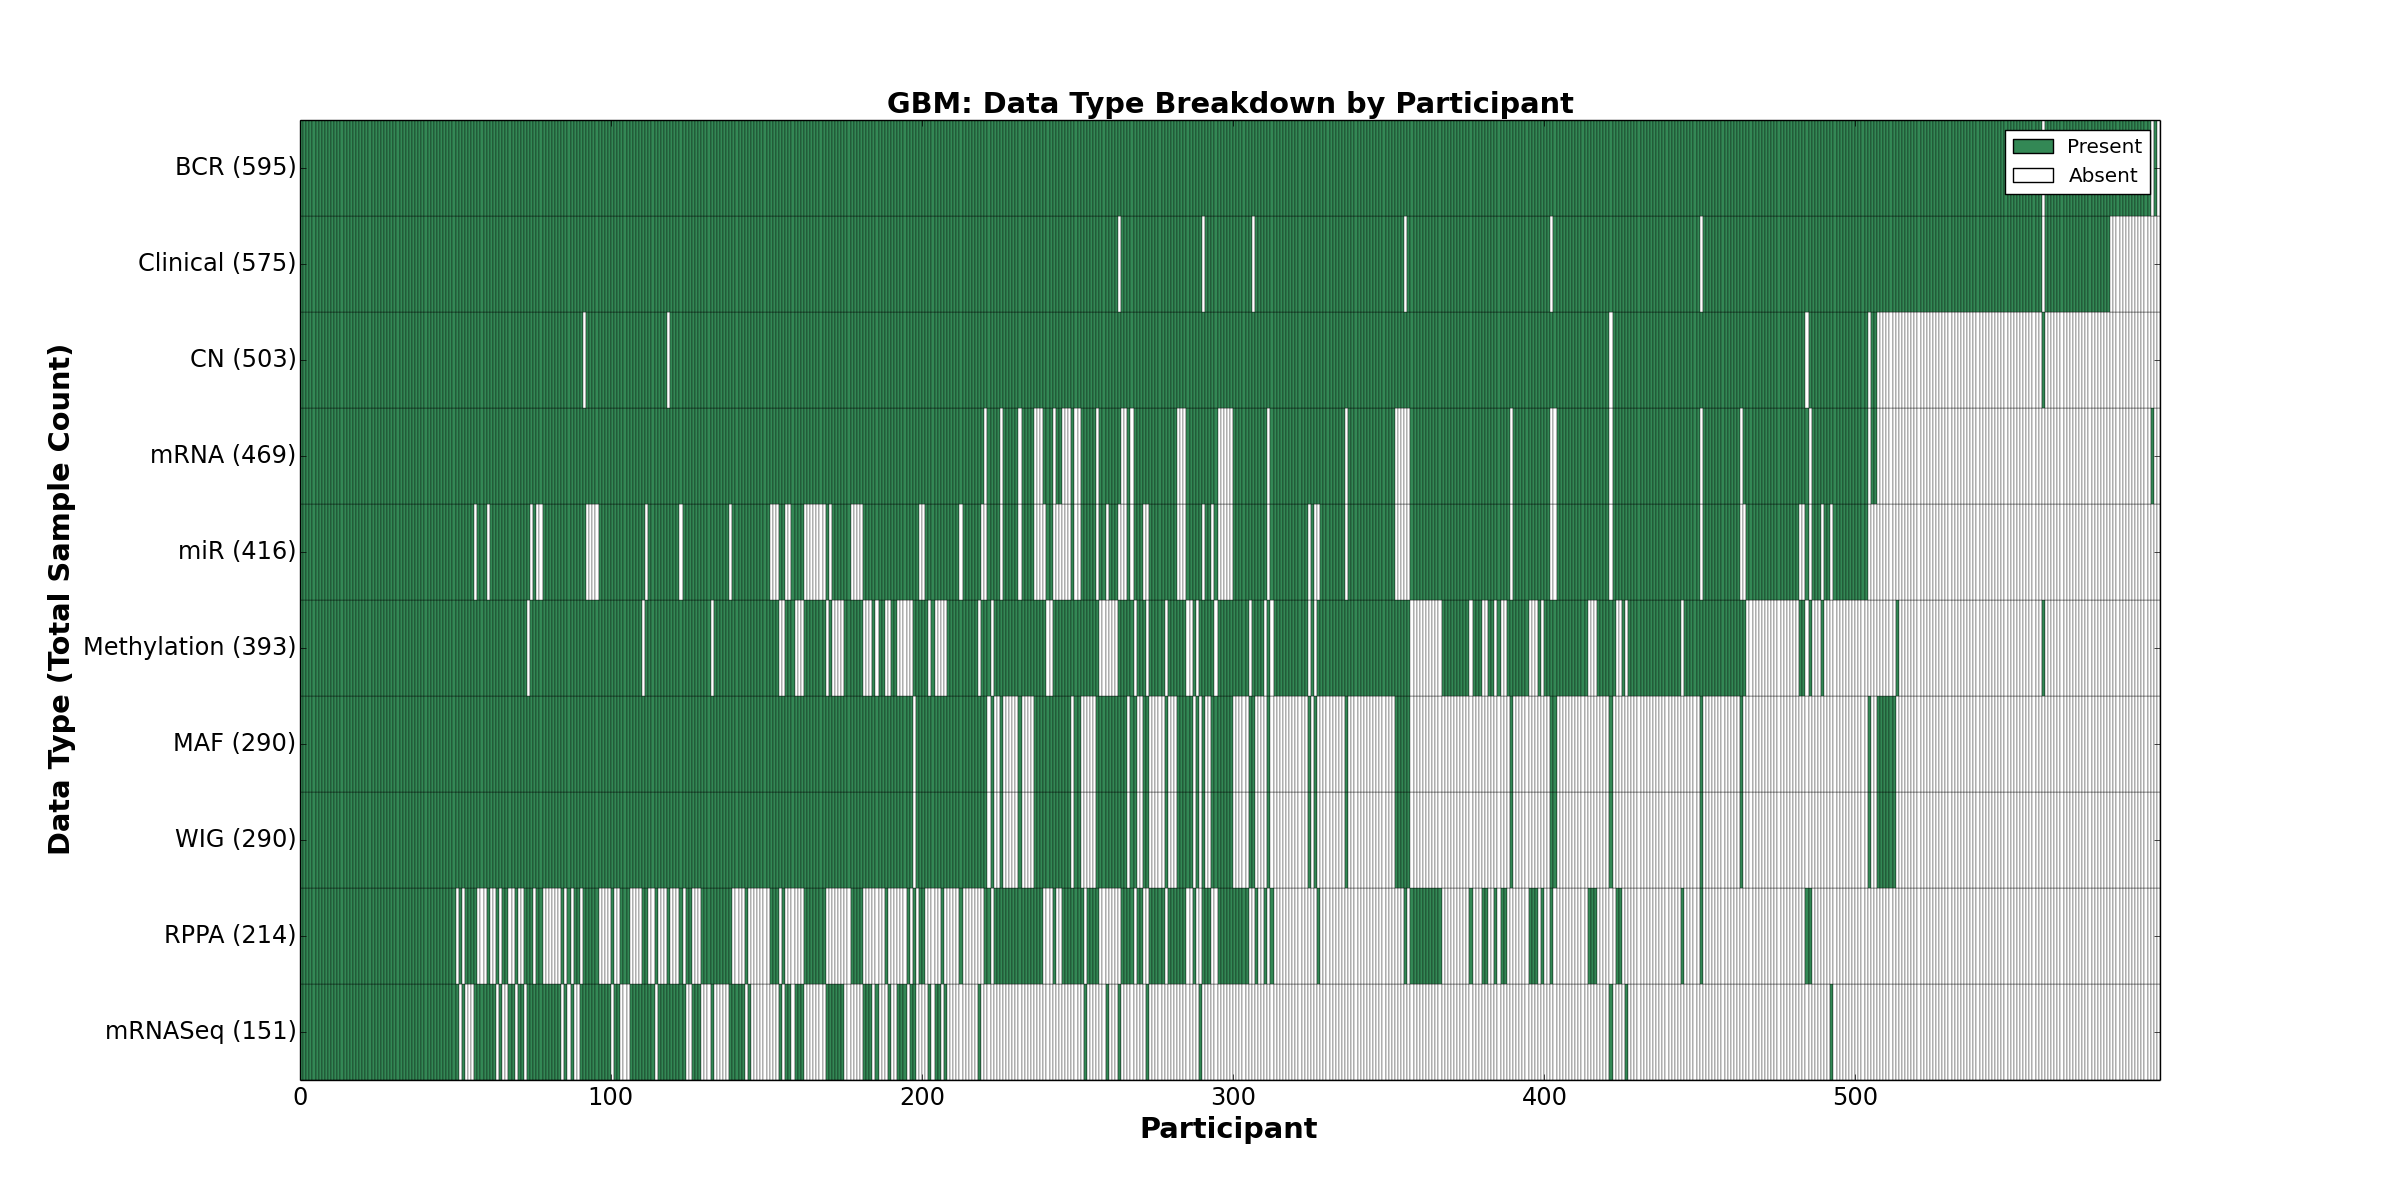
| GBM | 595 | 575 | 503 | 0 | 393 | 469 | 151 | 416 | 0 | 214 | 290 |
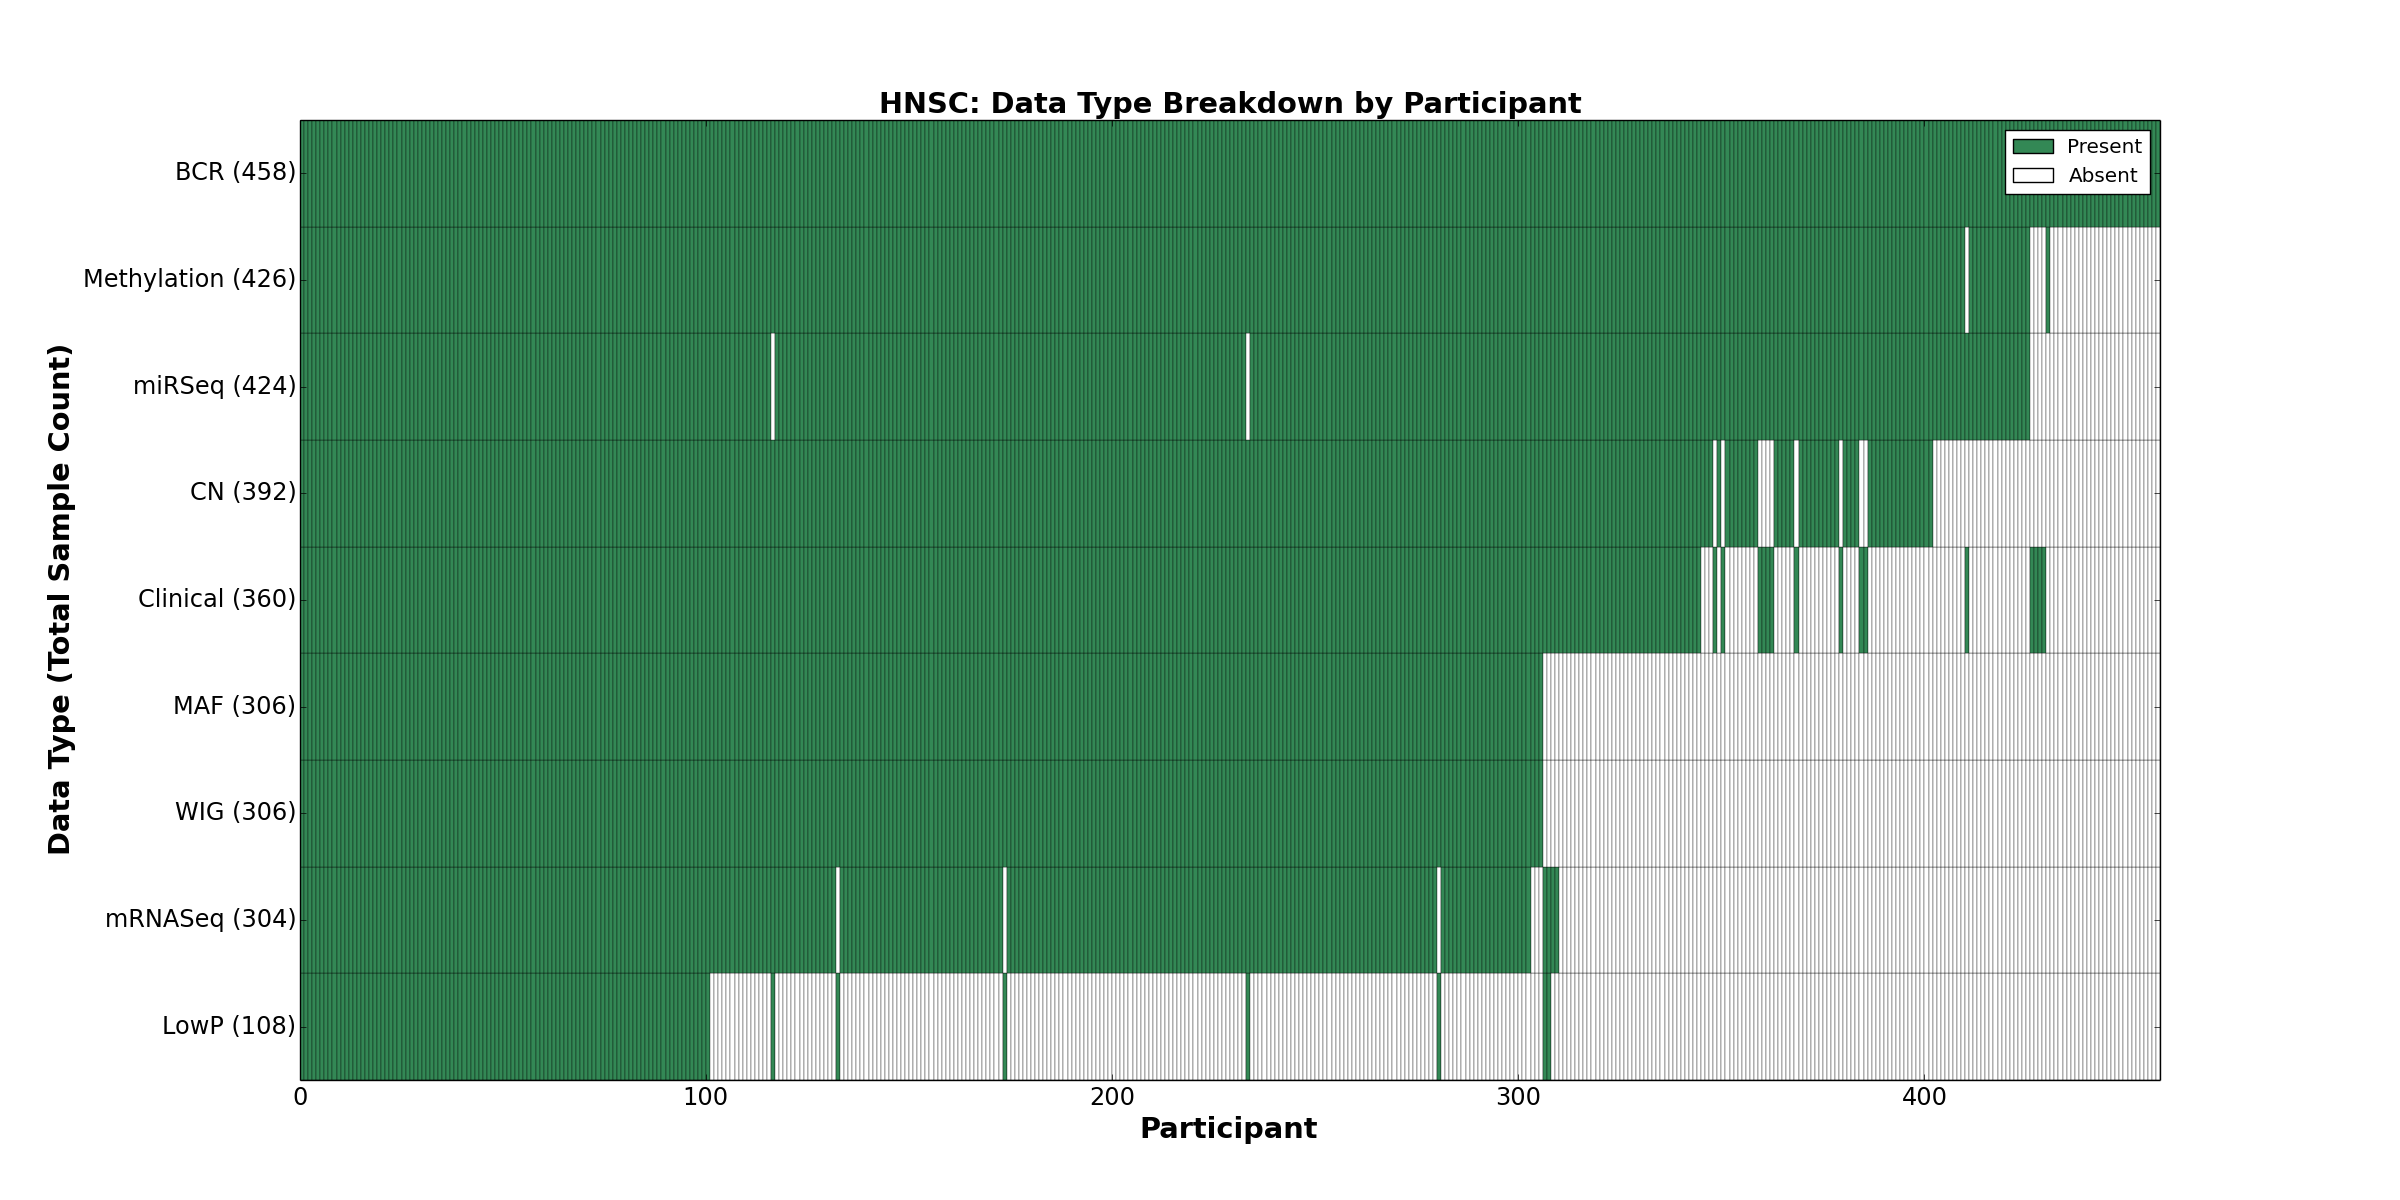
| HNSC | 458 | 360 | 392 | 108 | 426 | 0 | 304 | 0 | 424 | 0 | 306 |
| KICH | 66 | 64 | 66 | 0 | 66 | 0 | 66 | 0 | 66 | 0 | 66 |
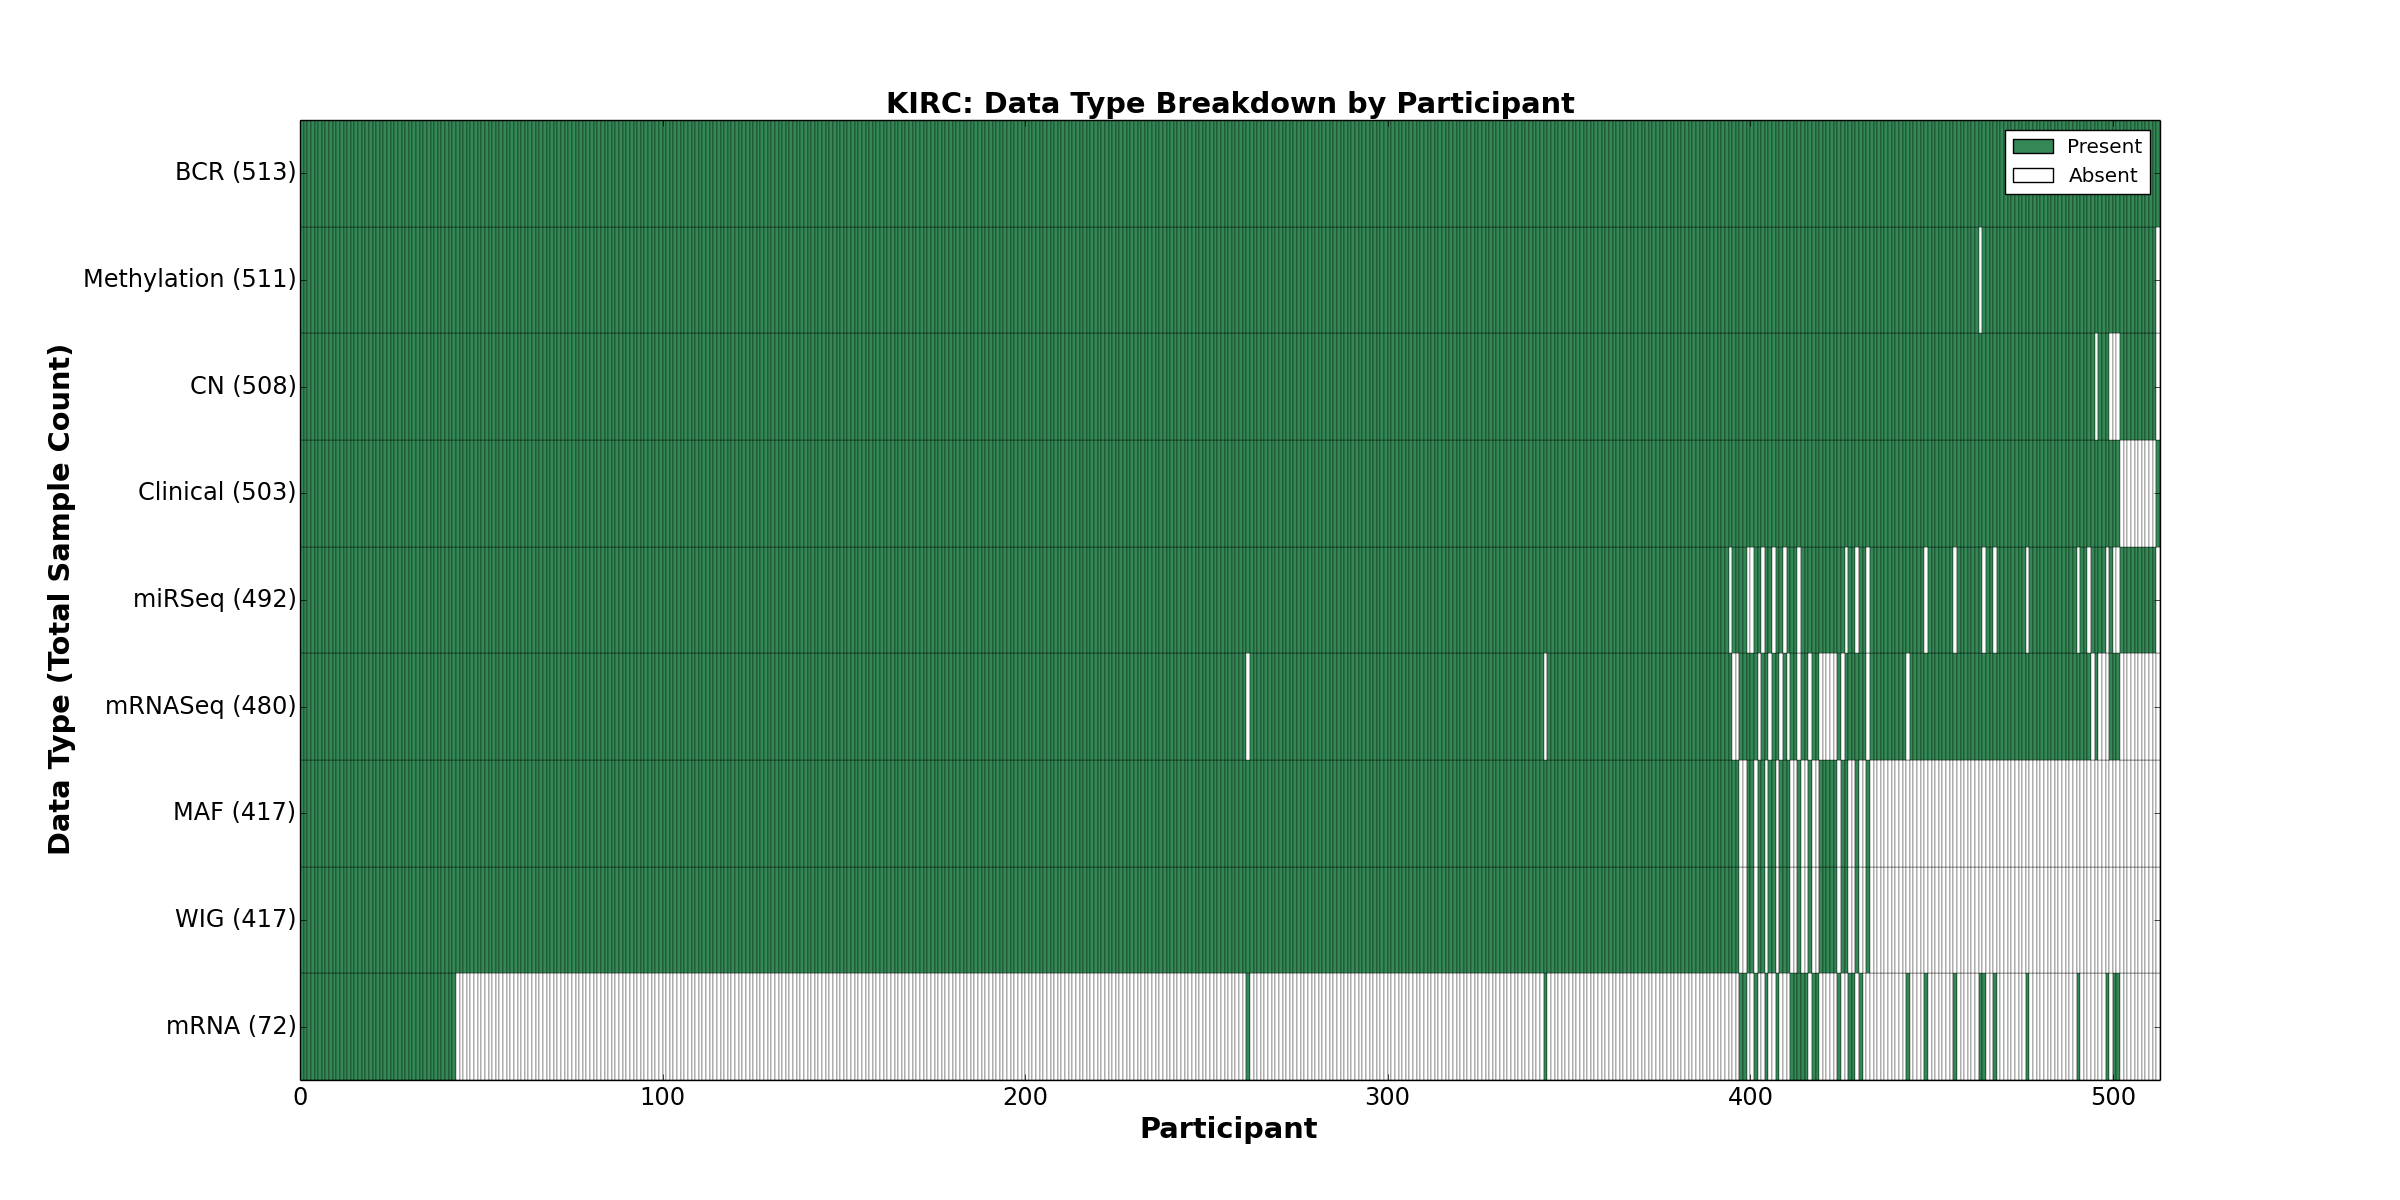
| KIRC | 513 | 503 | 508 | 0 | 511 | 72 | 480 | 0 | 492 | 0 | 417 |
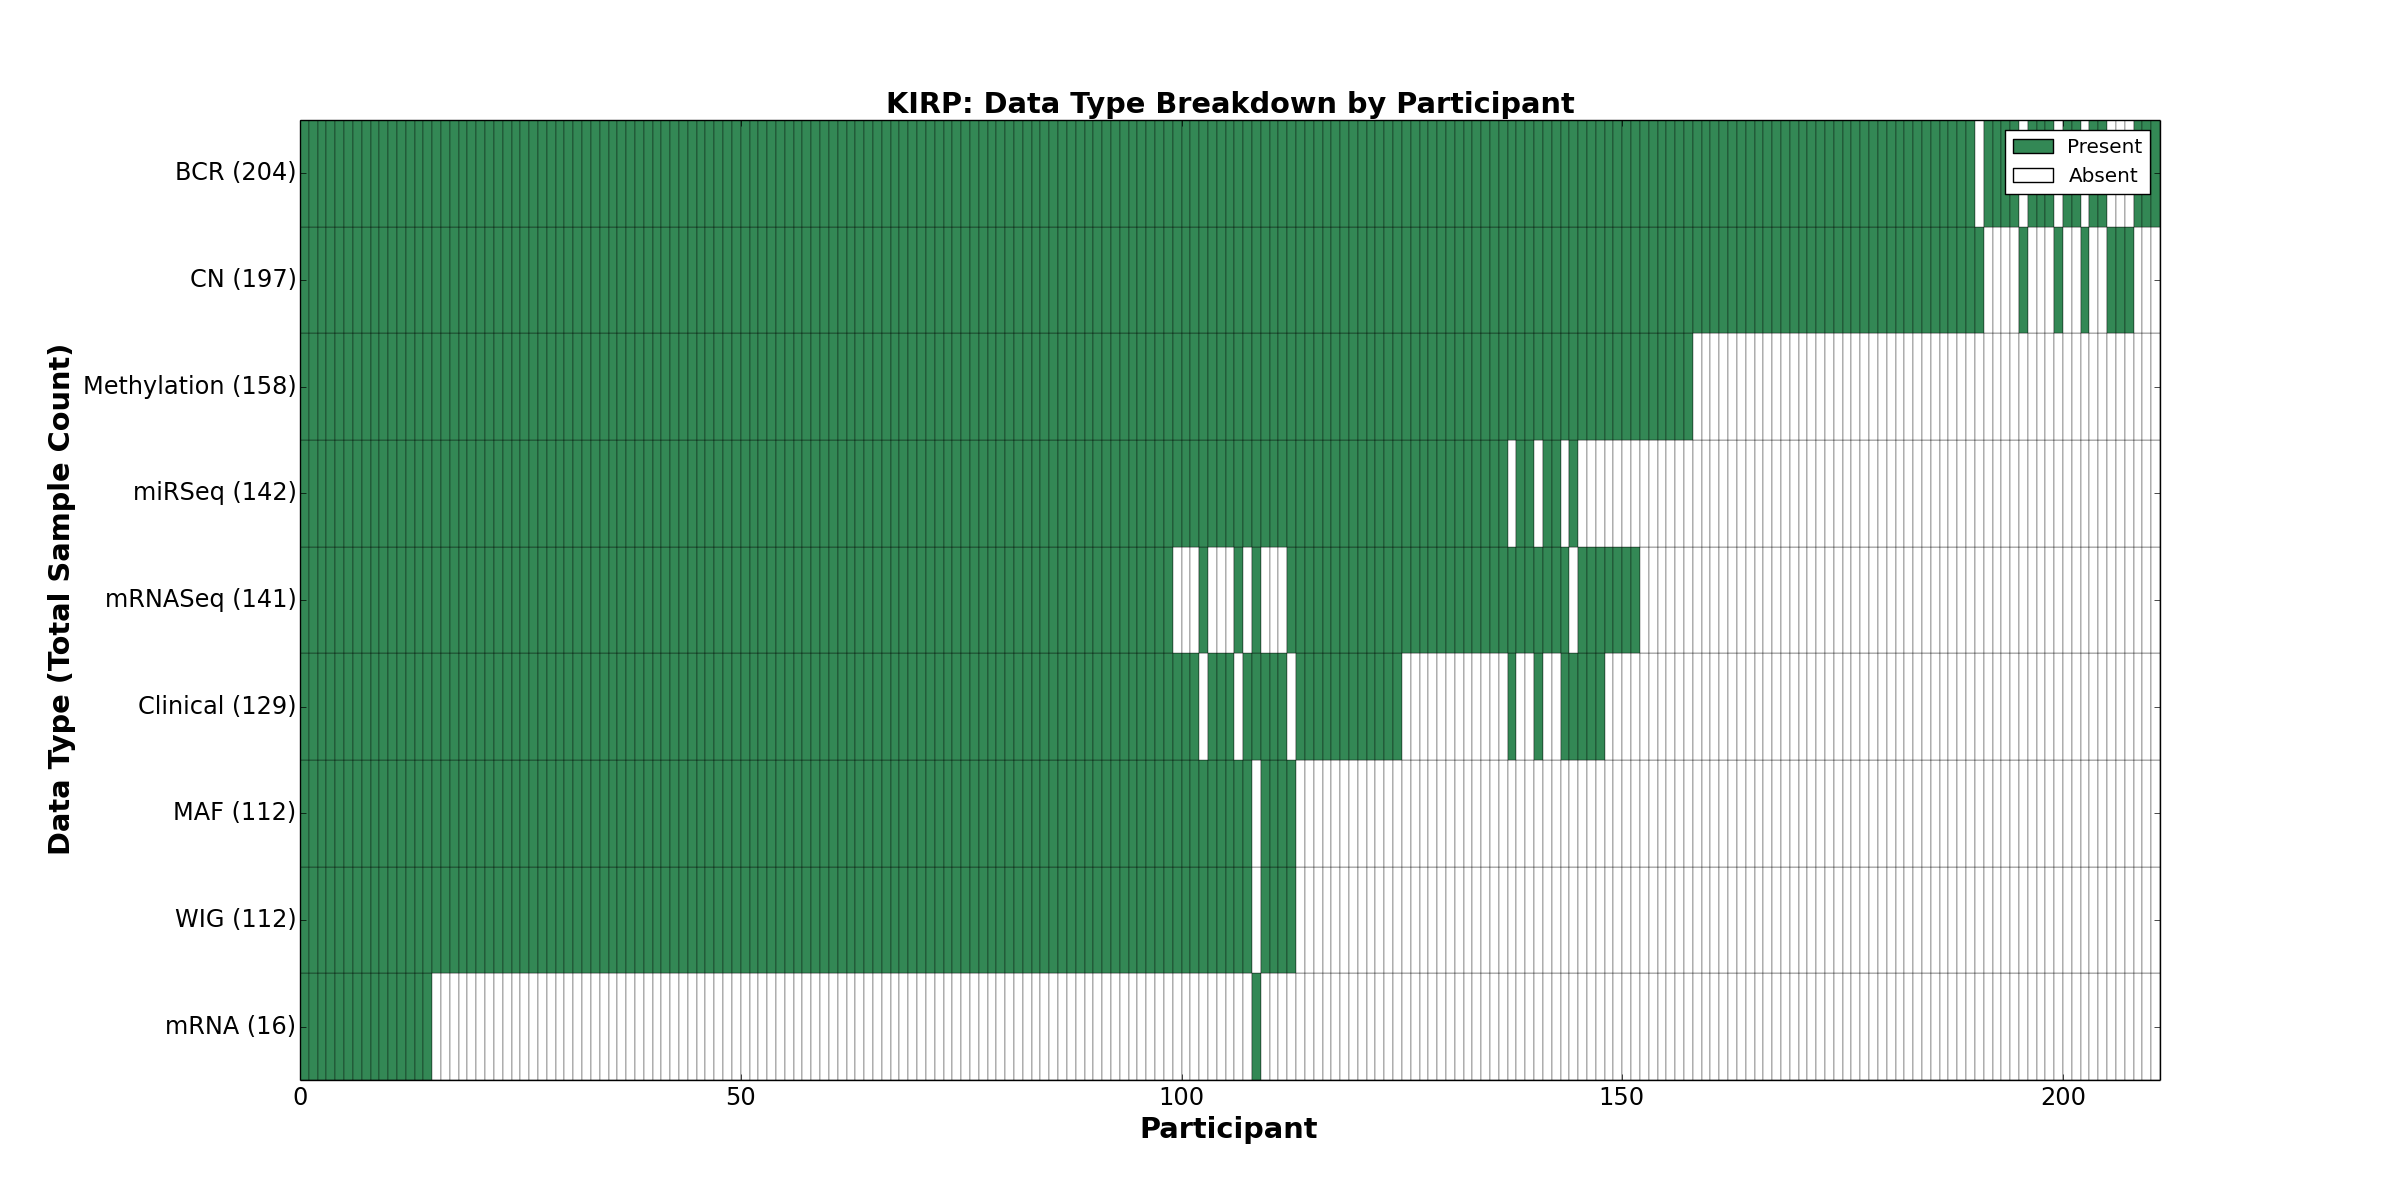
| KIRP | 204 | 129 | 197 | 0 | 158 | 16 | 141 | 0 | 142 | 0 | 112 |
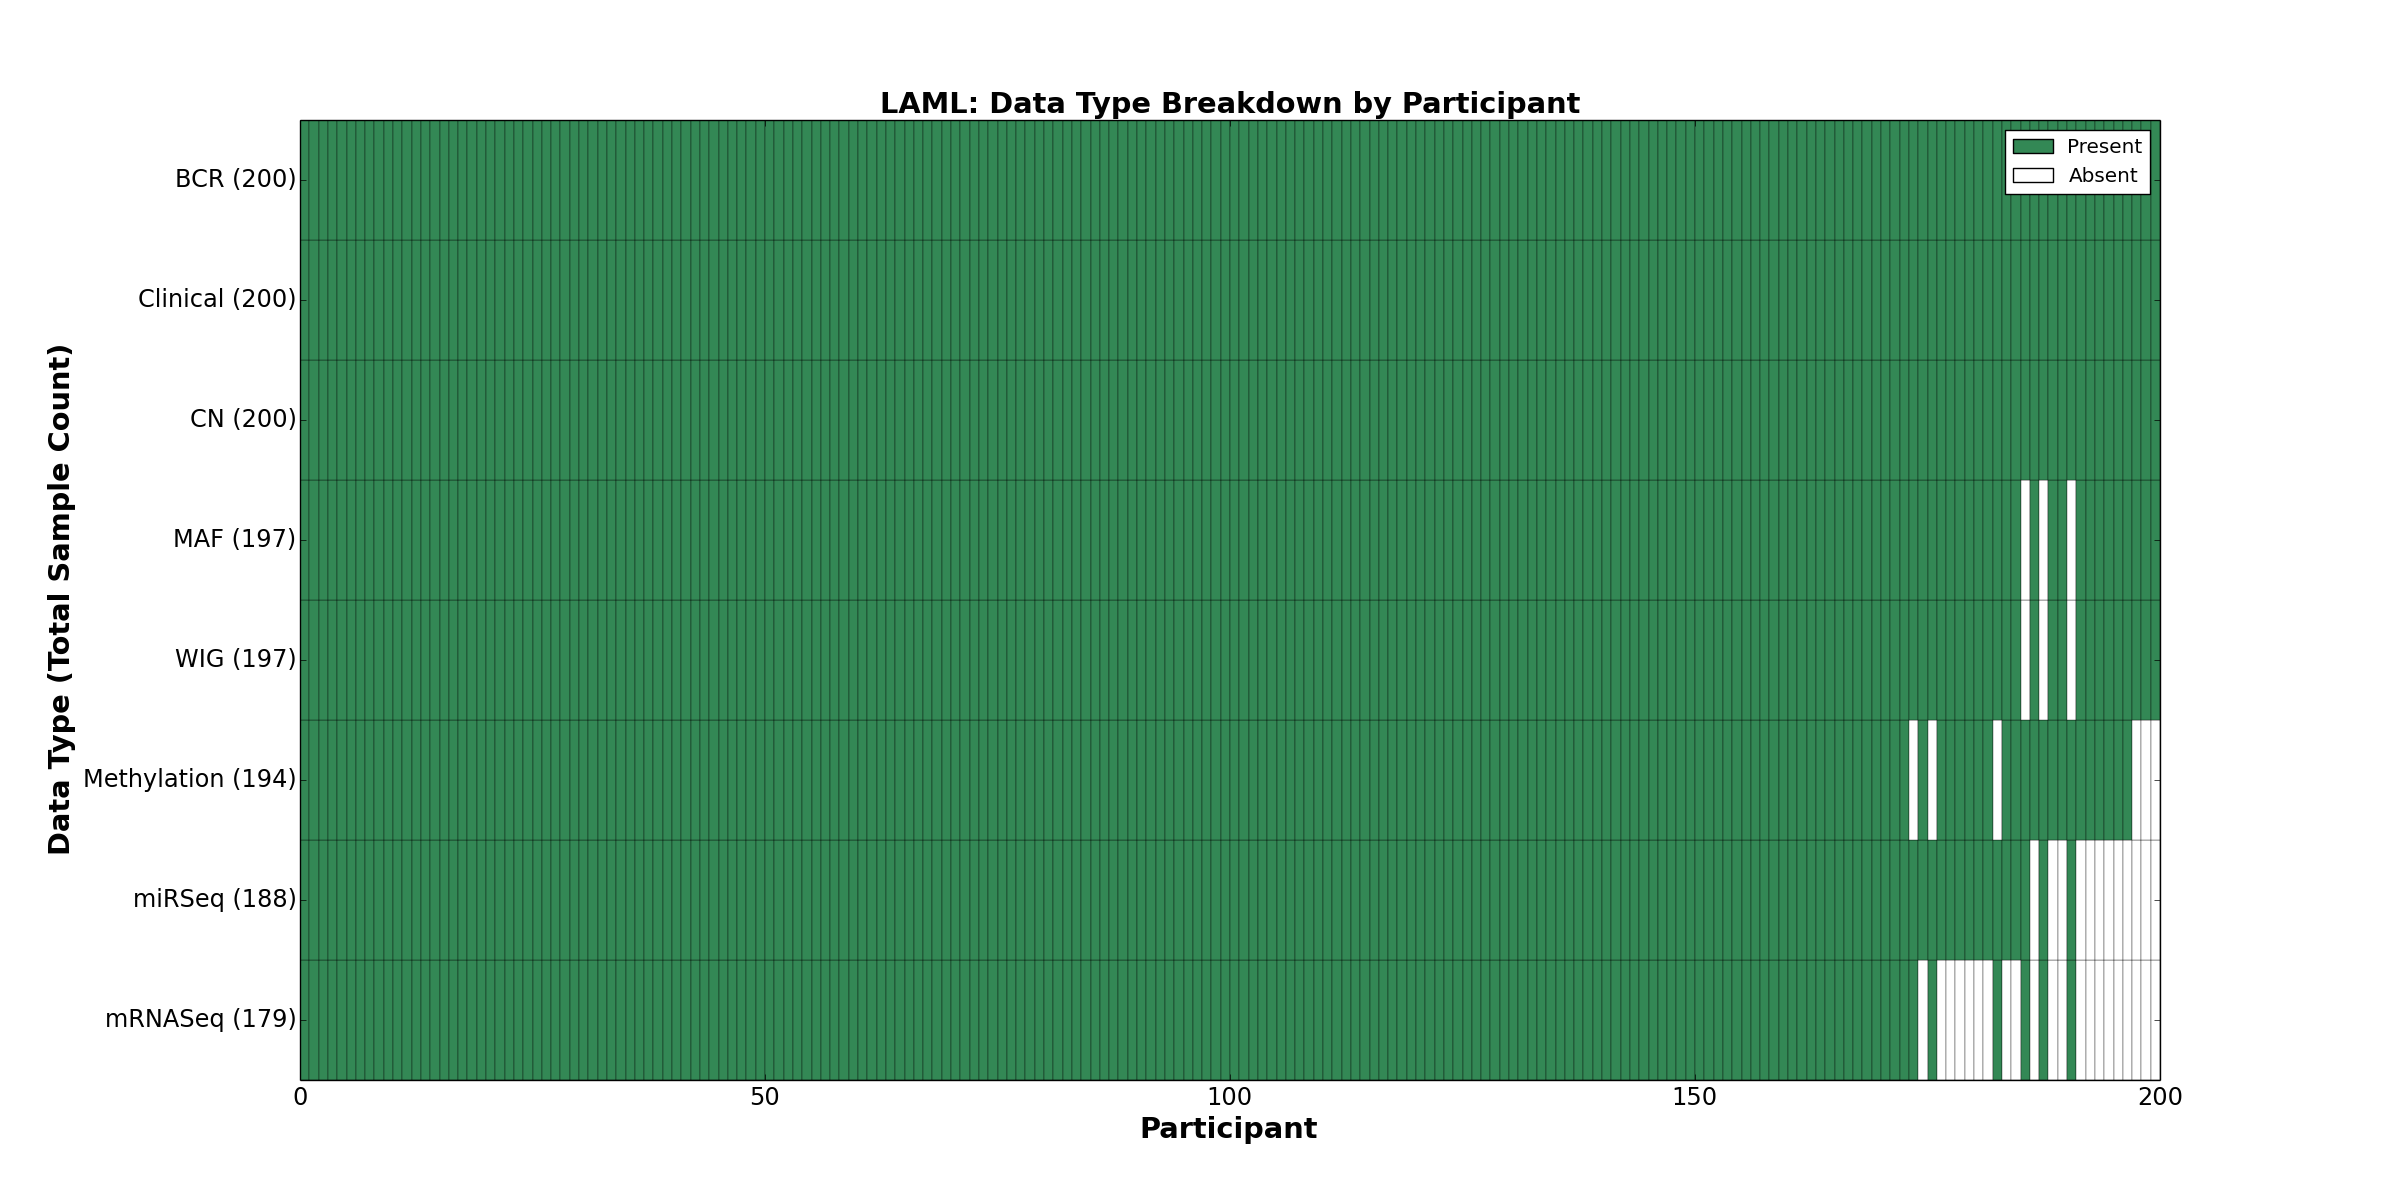
| LAML | 200 | 200 | 200 | 0 | 194 | 0 | 179 | 0 | 188 | 0 | 197 |
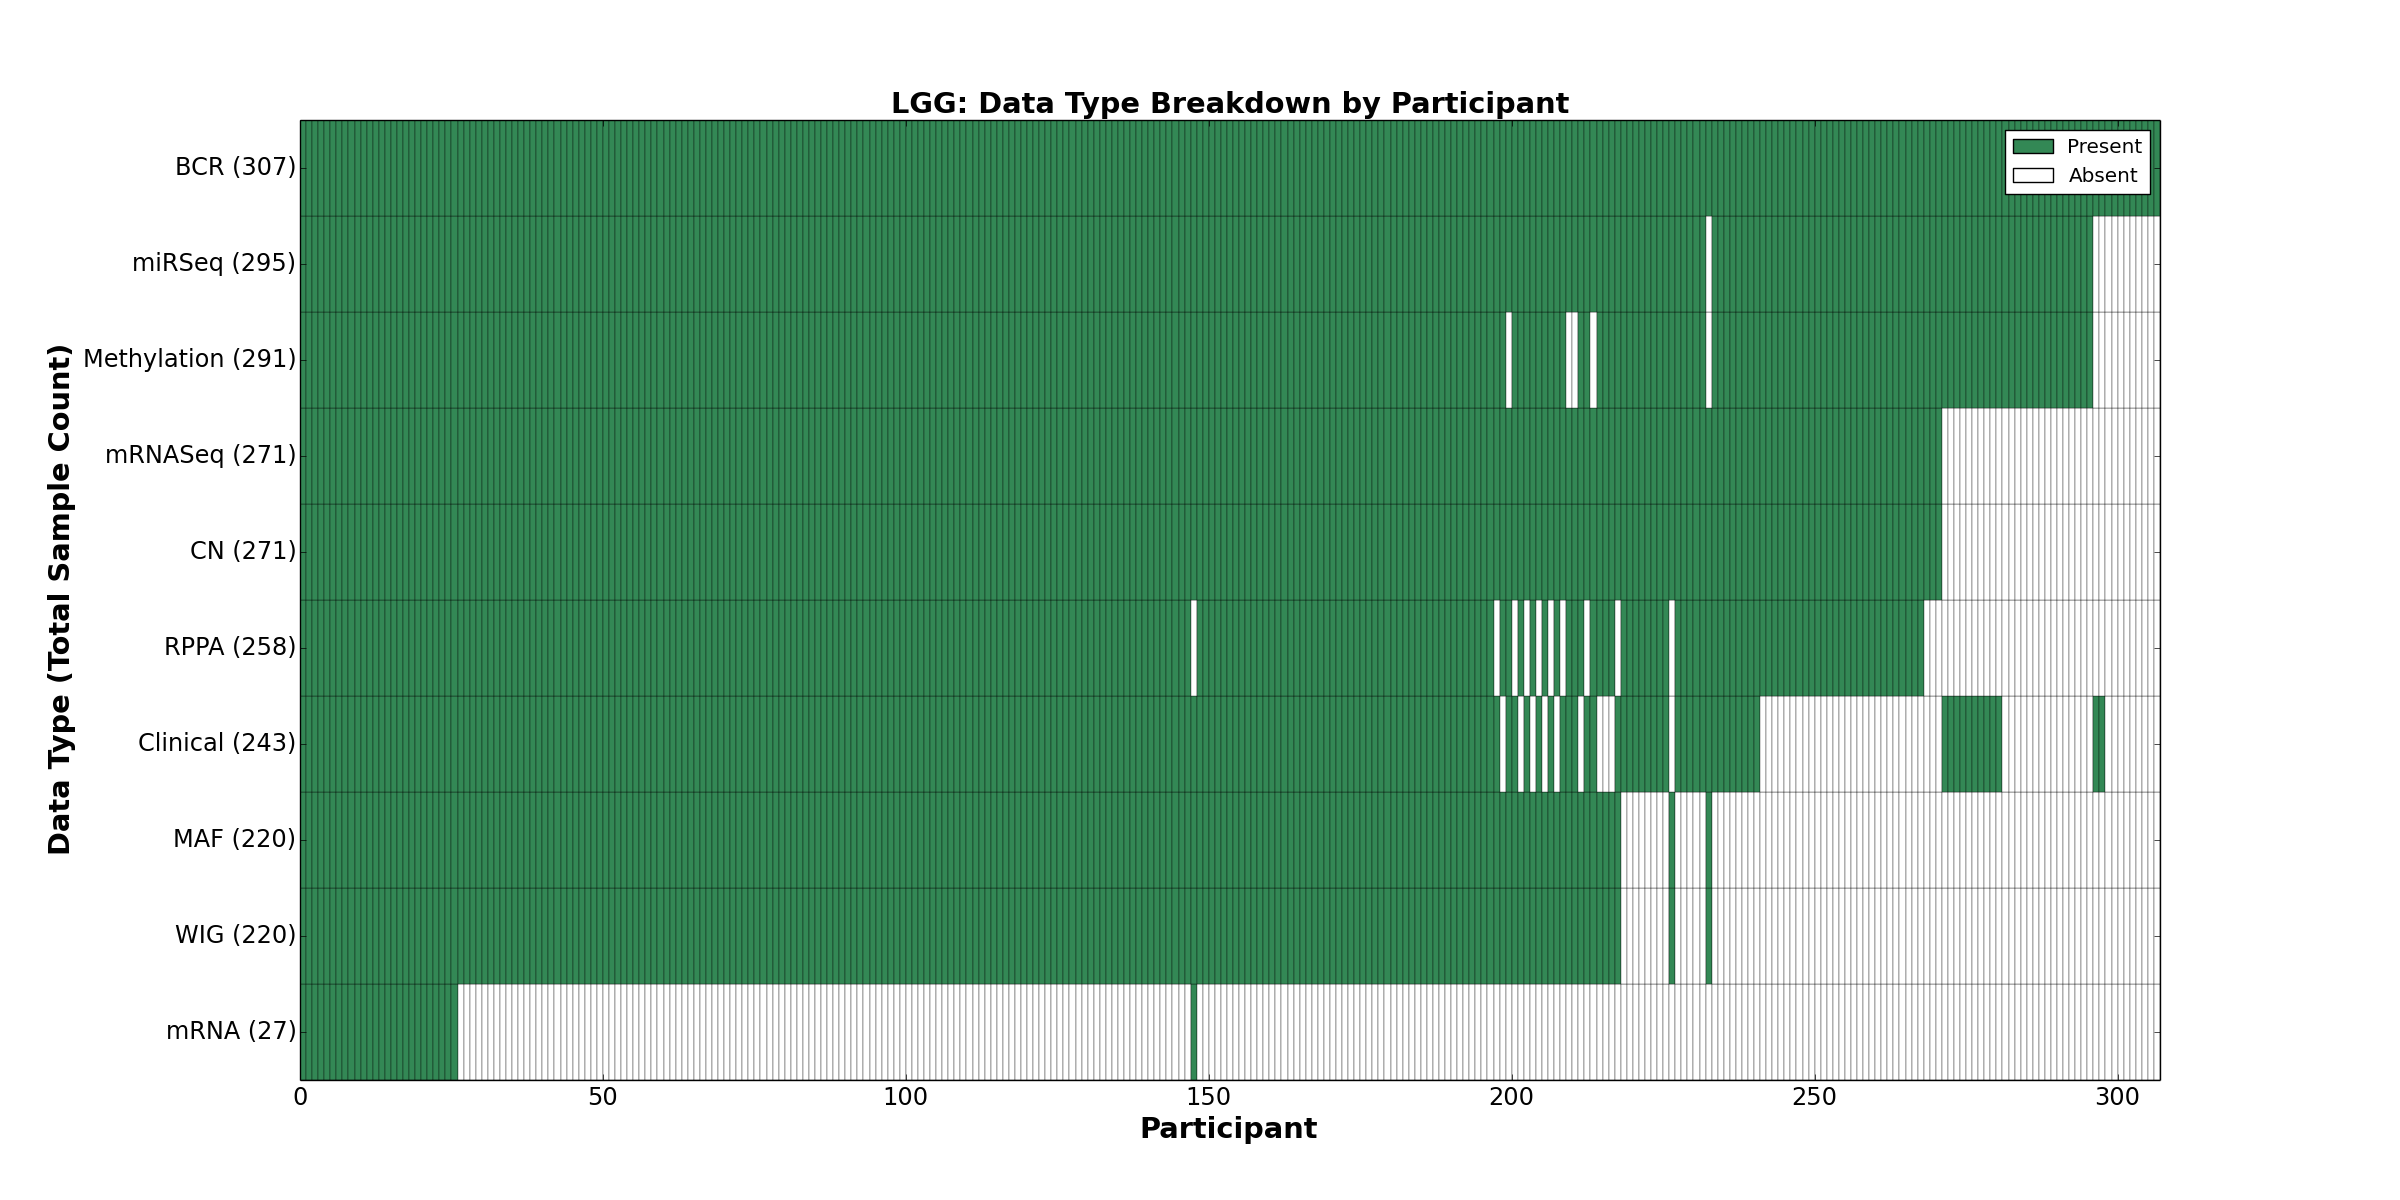
| LGG | 307 | 243 | 271 | 0 | 291 | 27 | 271 | 0 | 295 | 258 | 220 |
| LIHC | 152 | 127 | 141 | 0 | 125 | 0 | 134 | 0 | 136 | 0 | 0 |
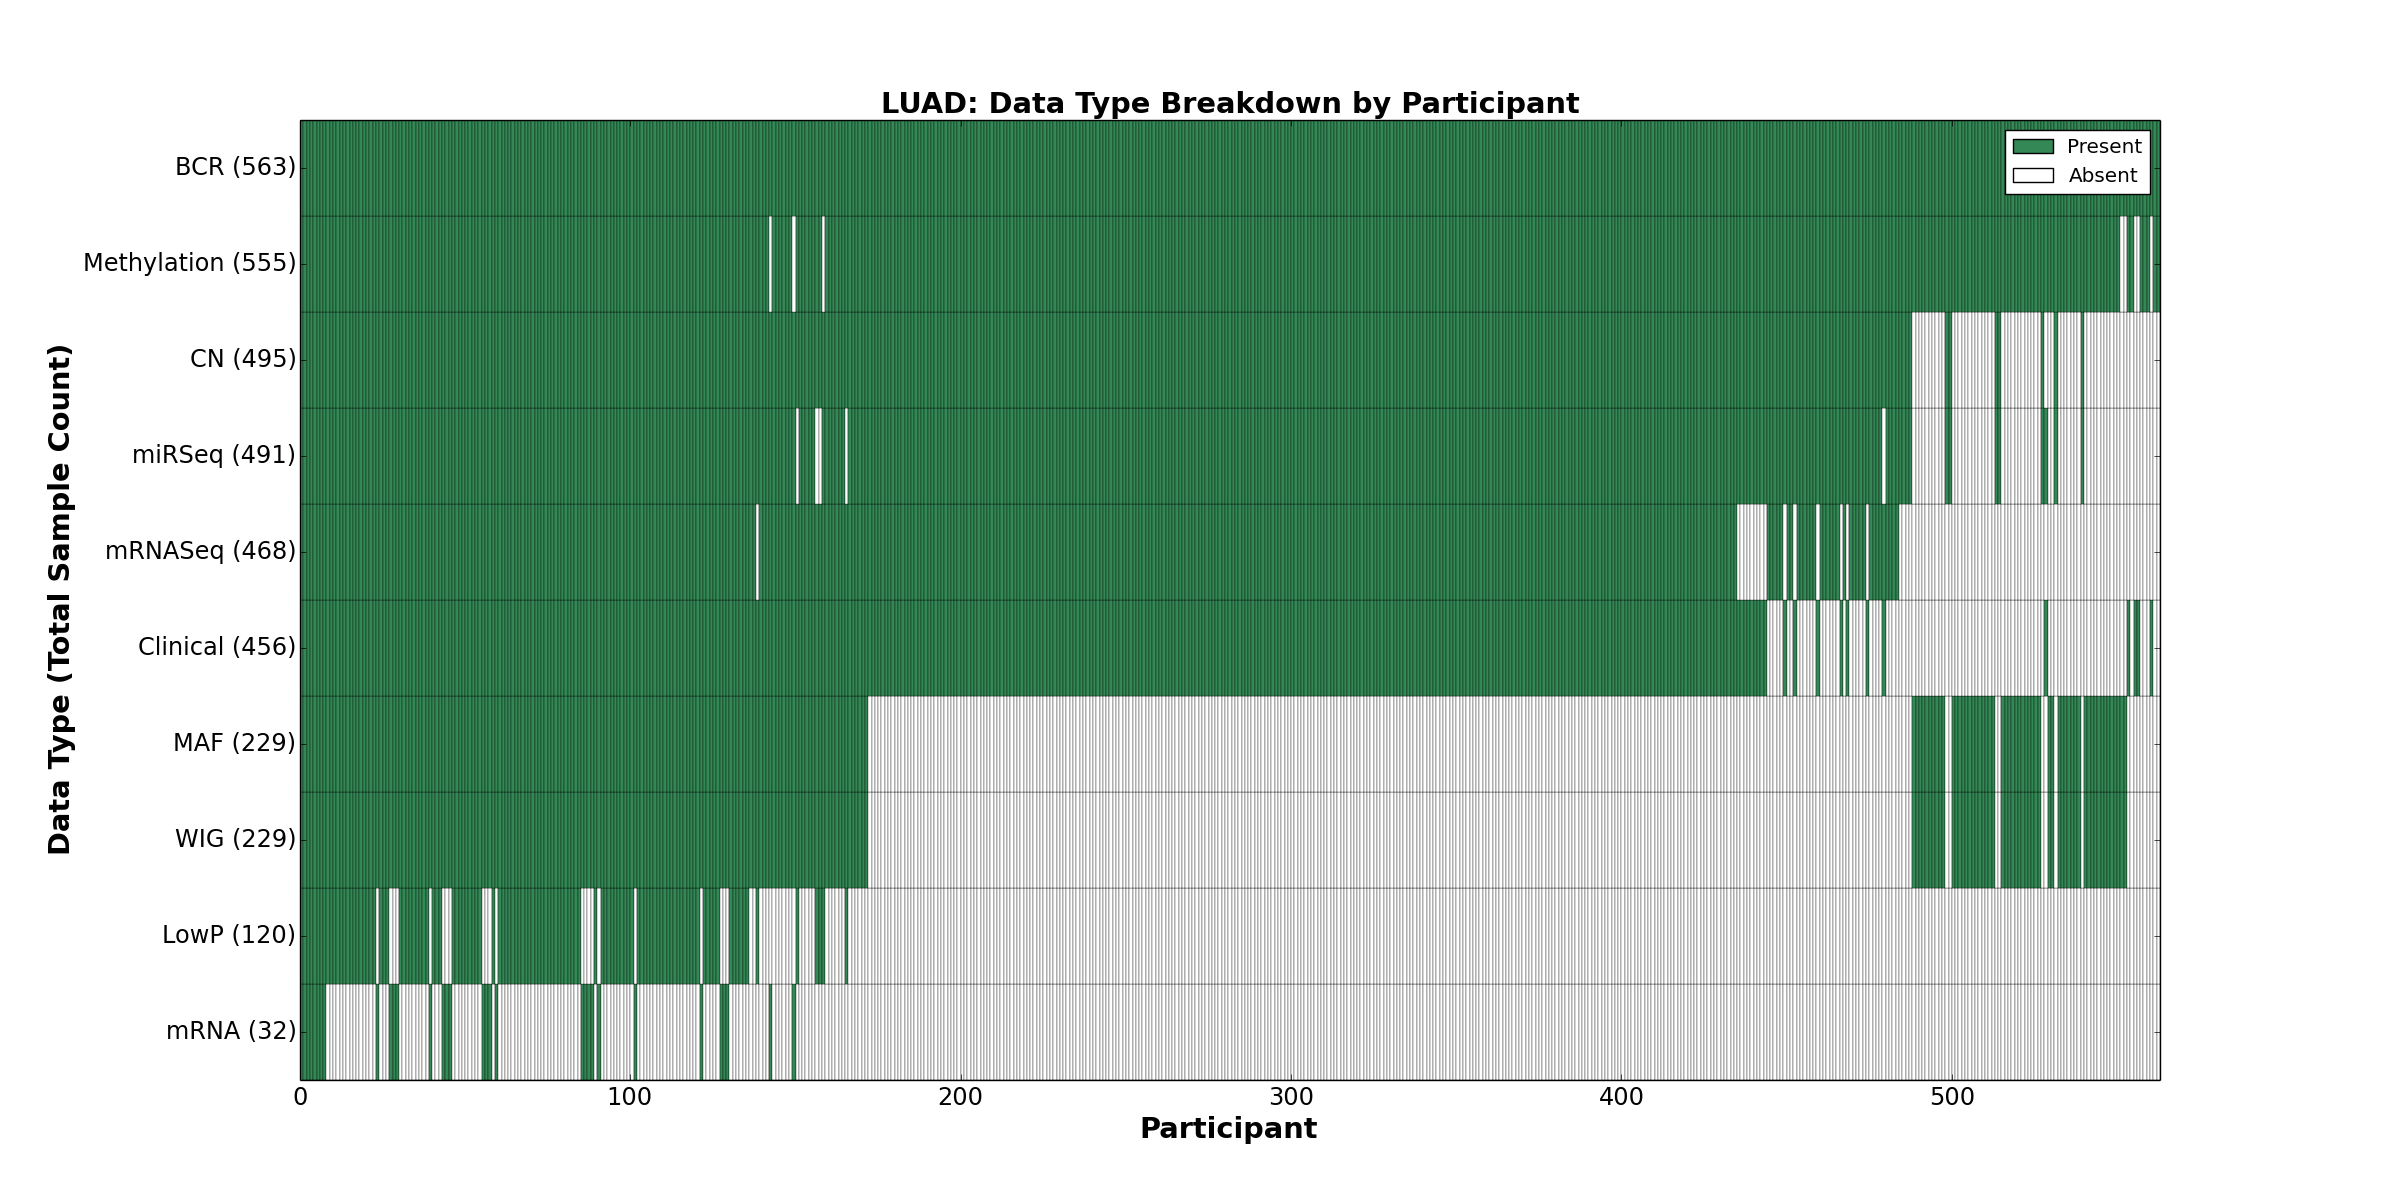
| LUAD | 563 | 456 | 495 | 120 | 555 | 32 | 468 | 0 | 491 | 0 | 229 |
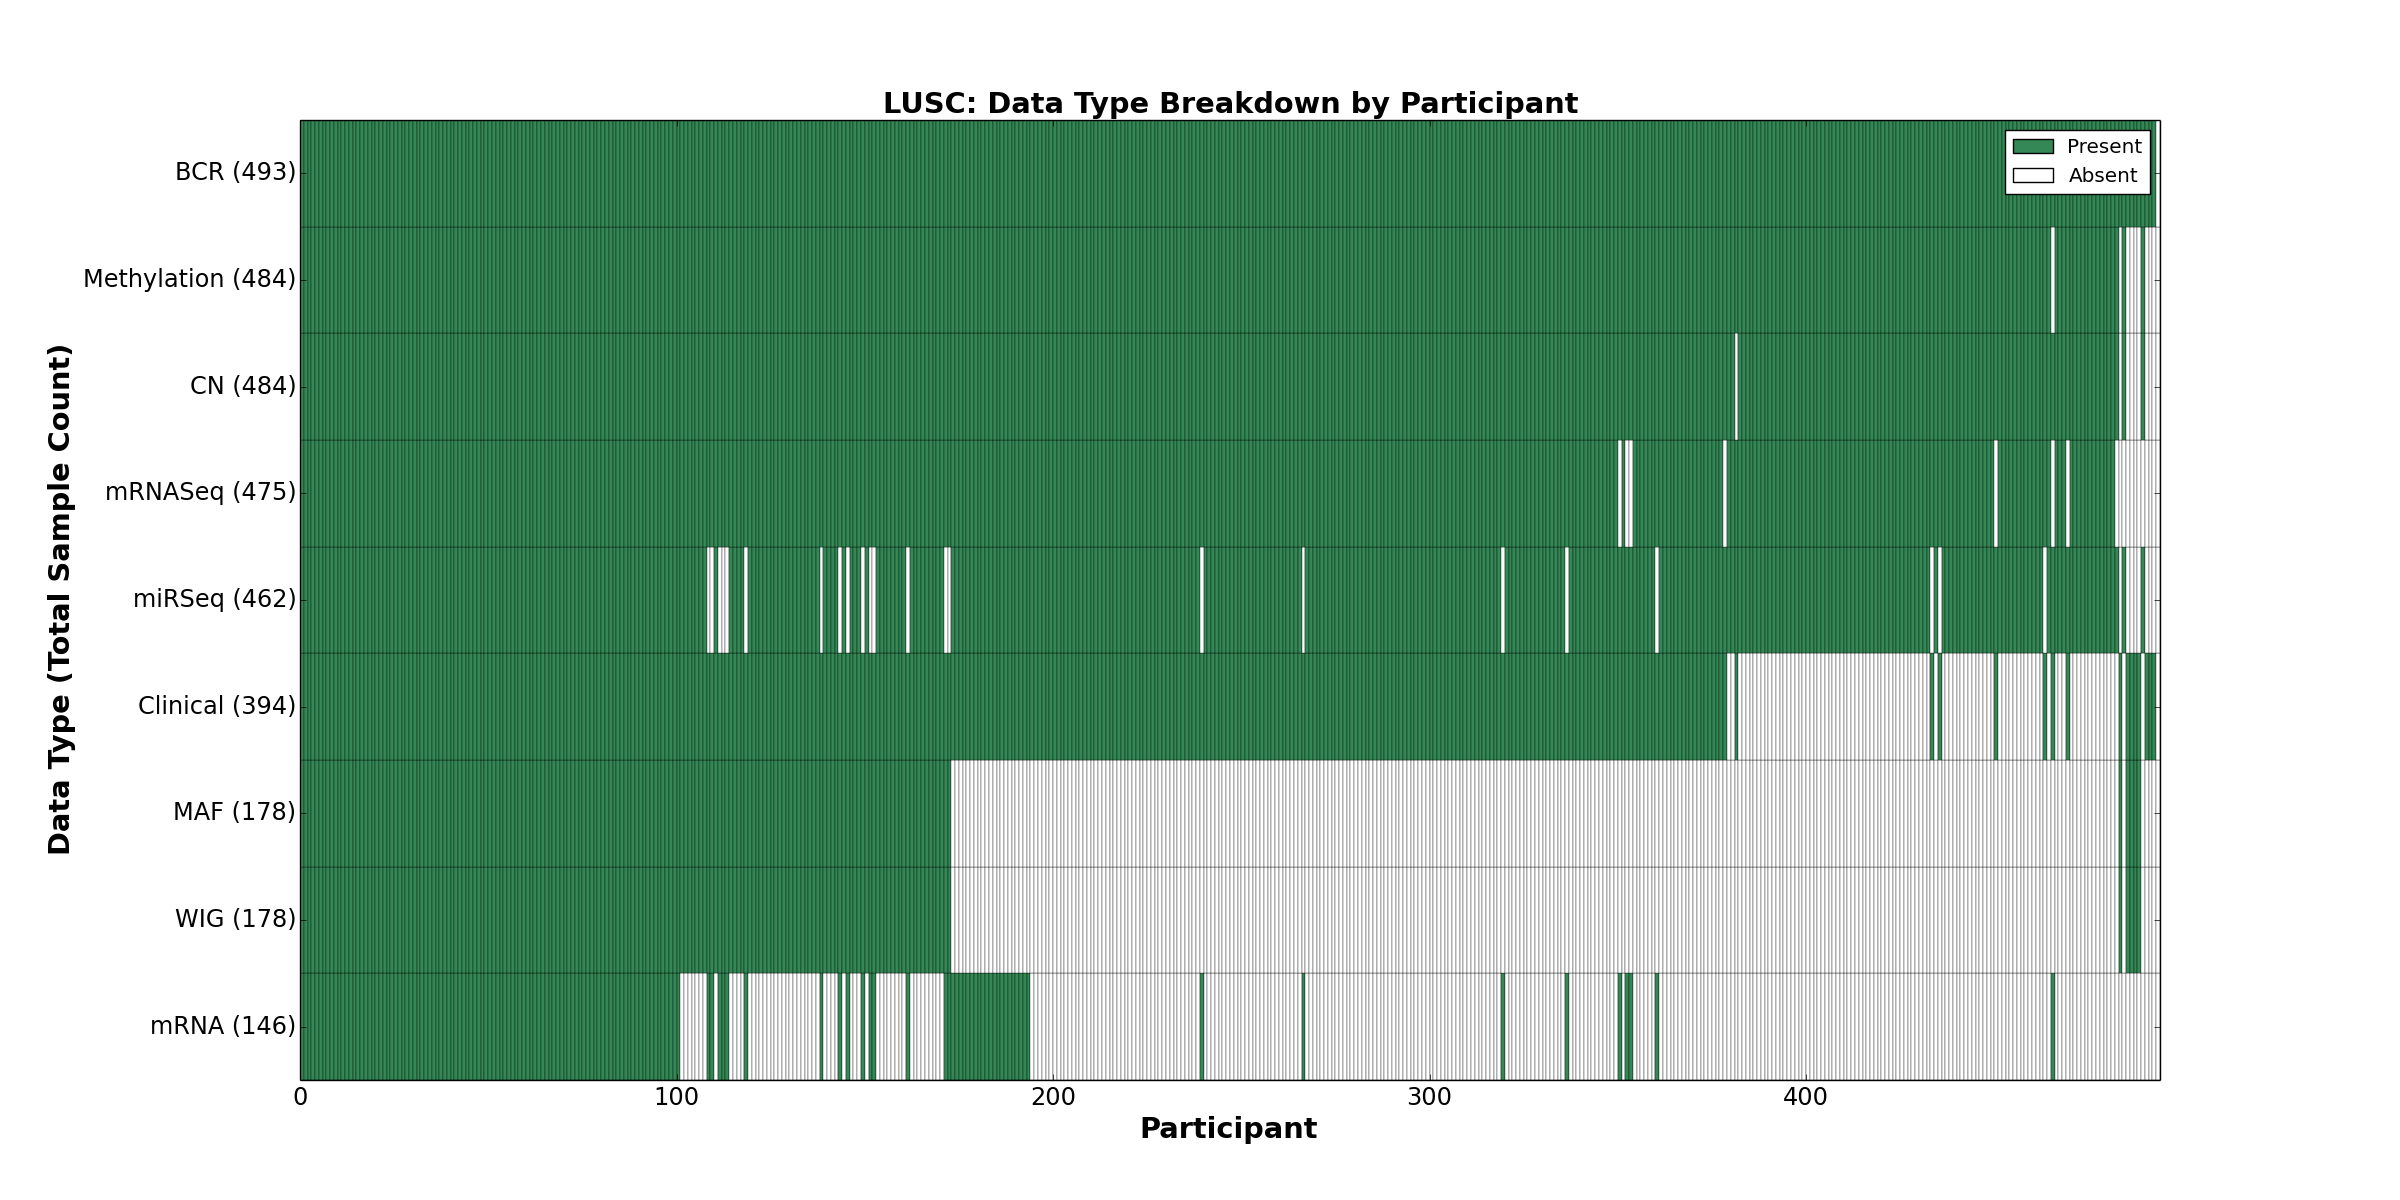
| LUSC | 493 | 394 | 484 | 0 | 484 | 146 | 475 | 0 | 462 | 0 | 178 |
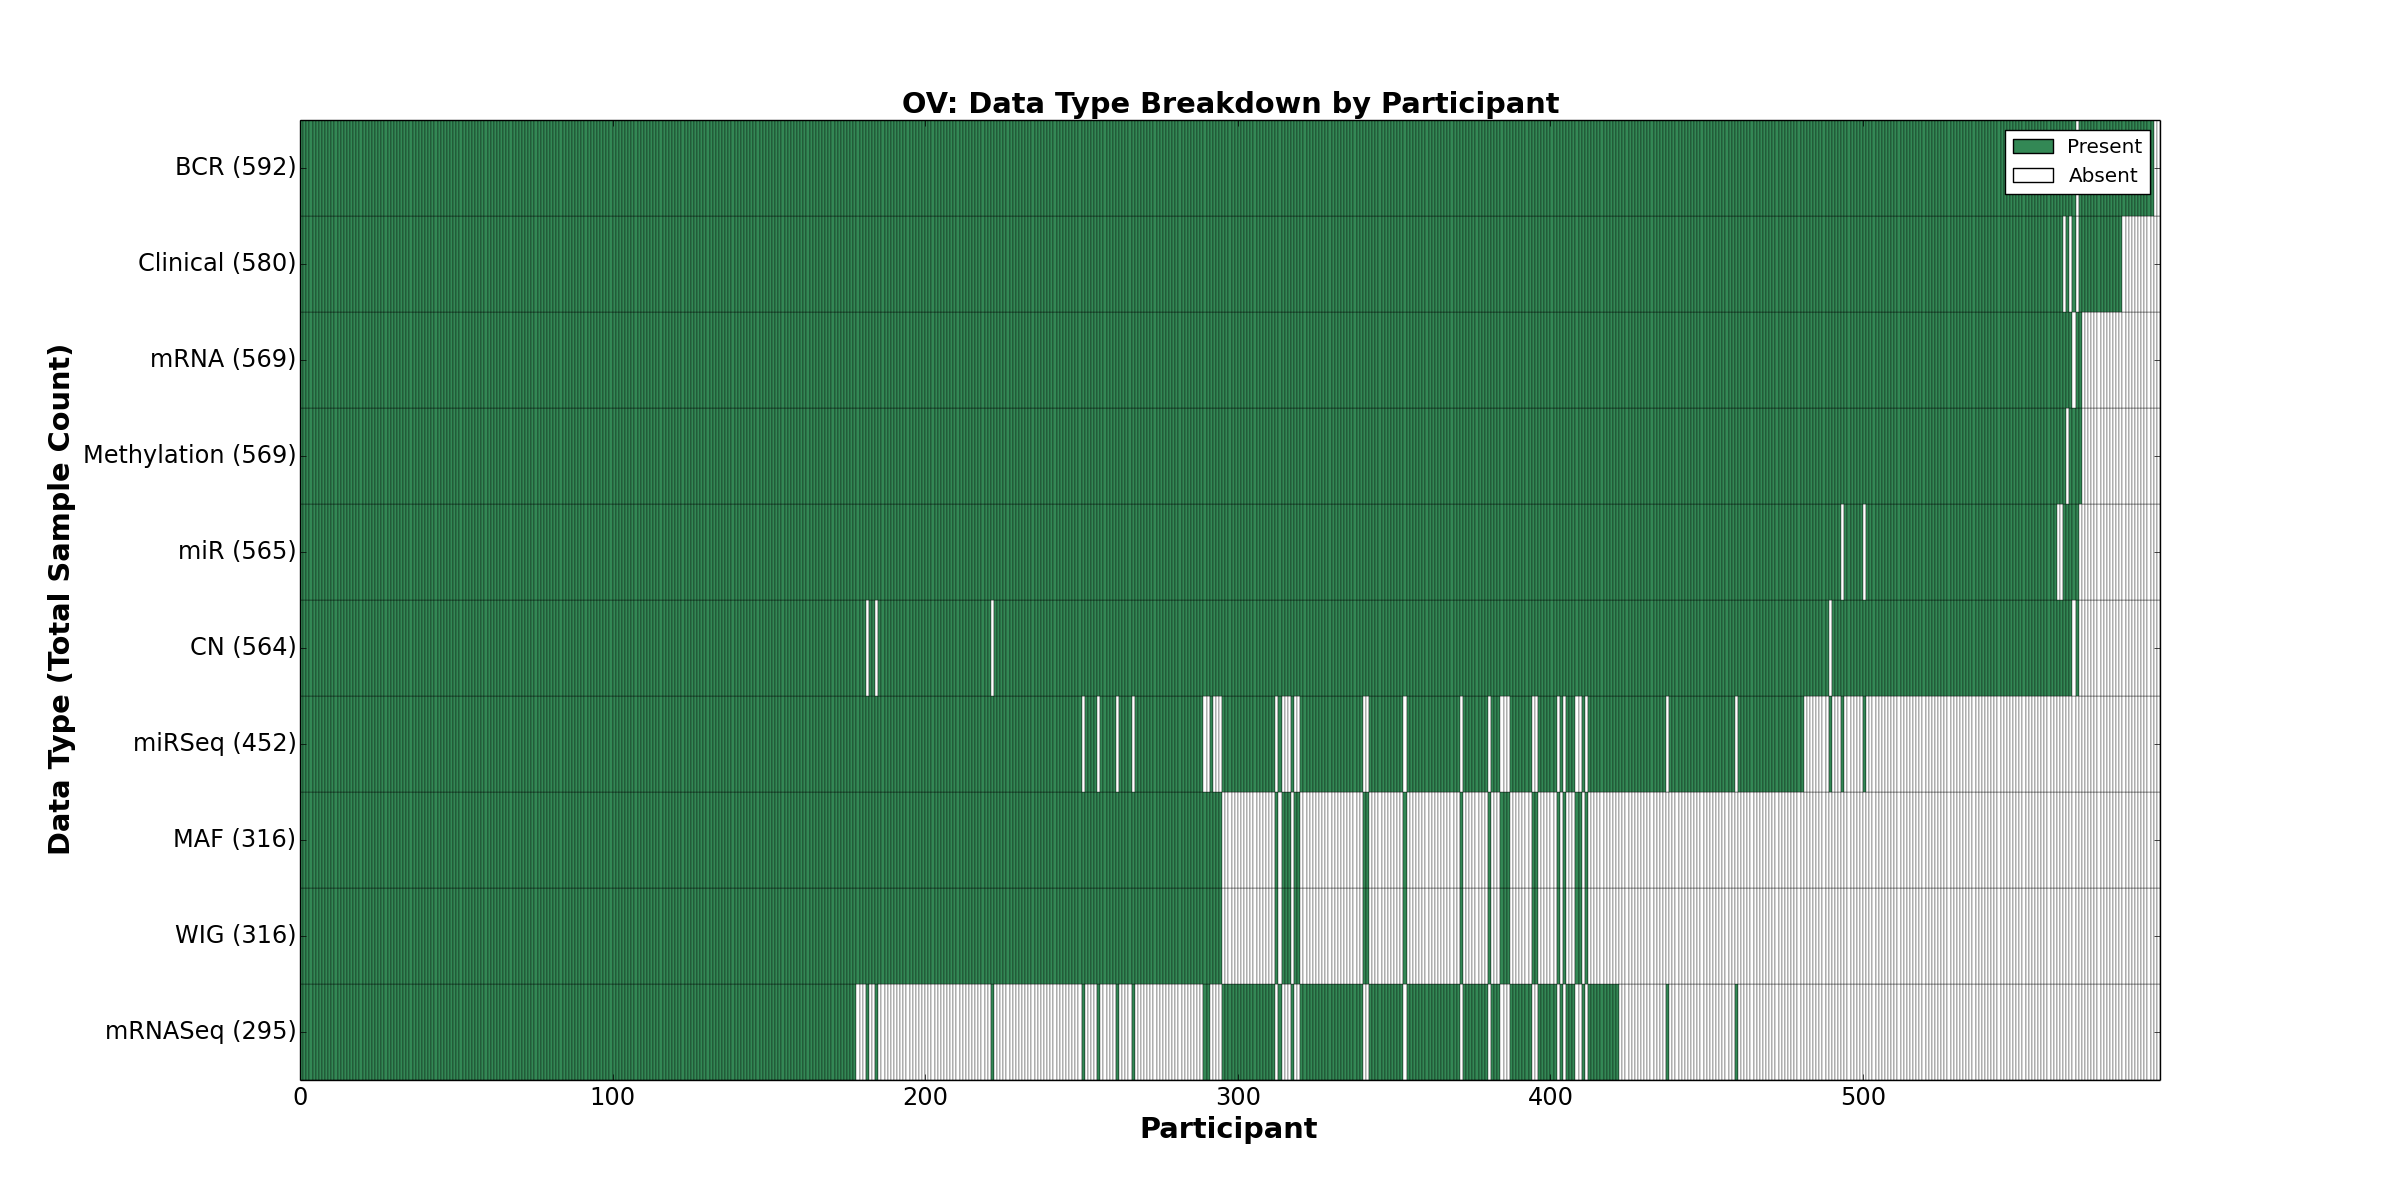
| OV | 592 | 580 | 564 | 0 | 569 | 569 | 295 | 565 | 452 | 0 | 316 |
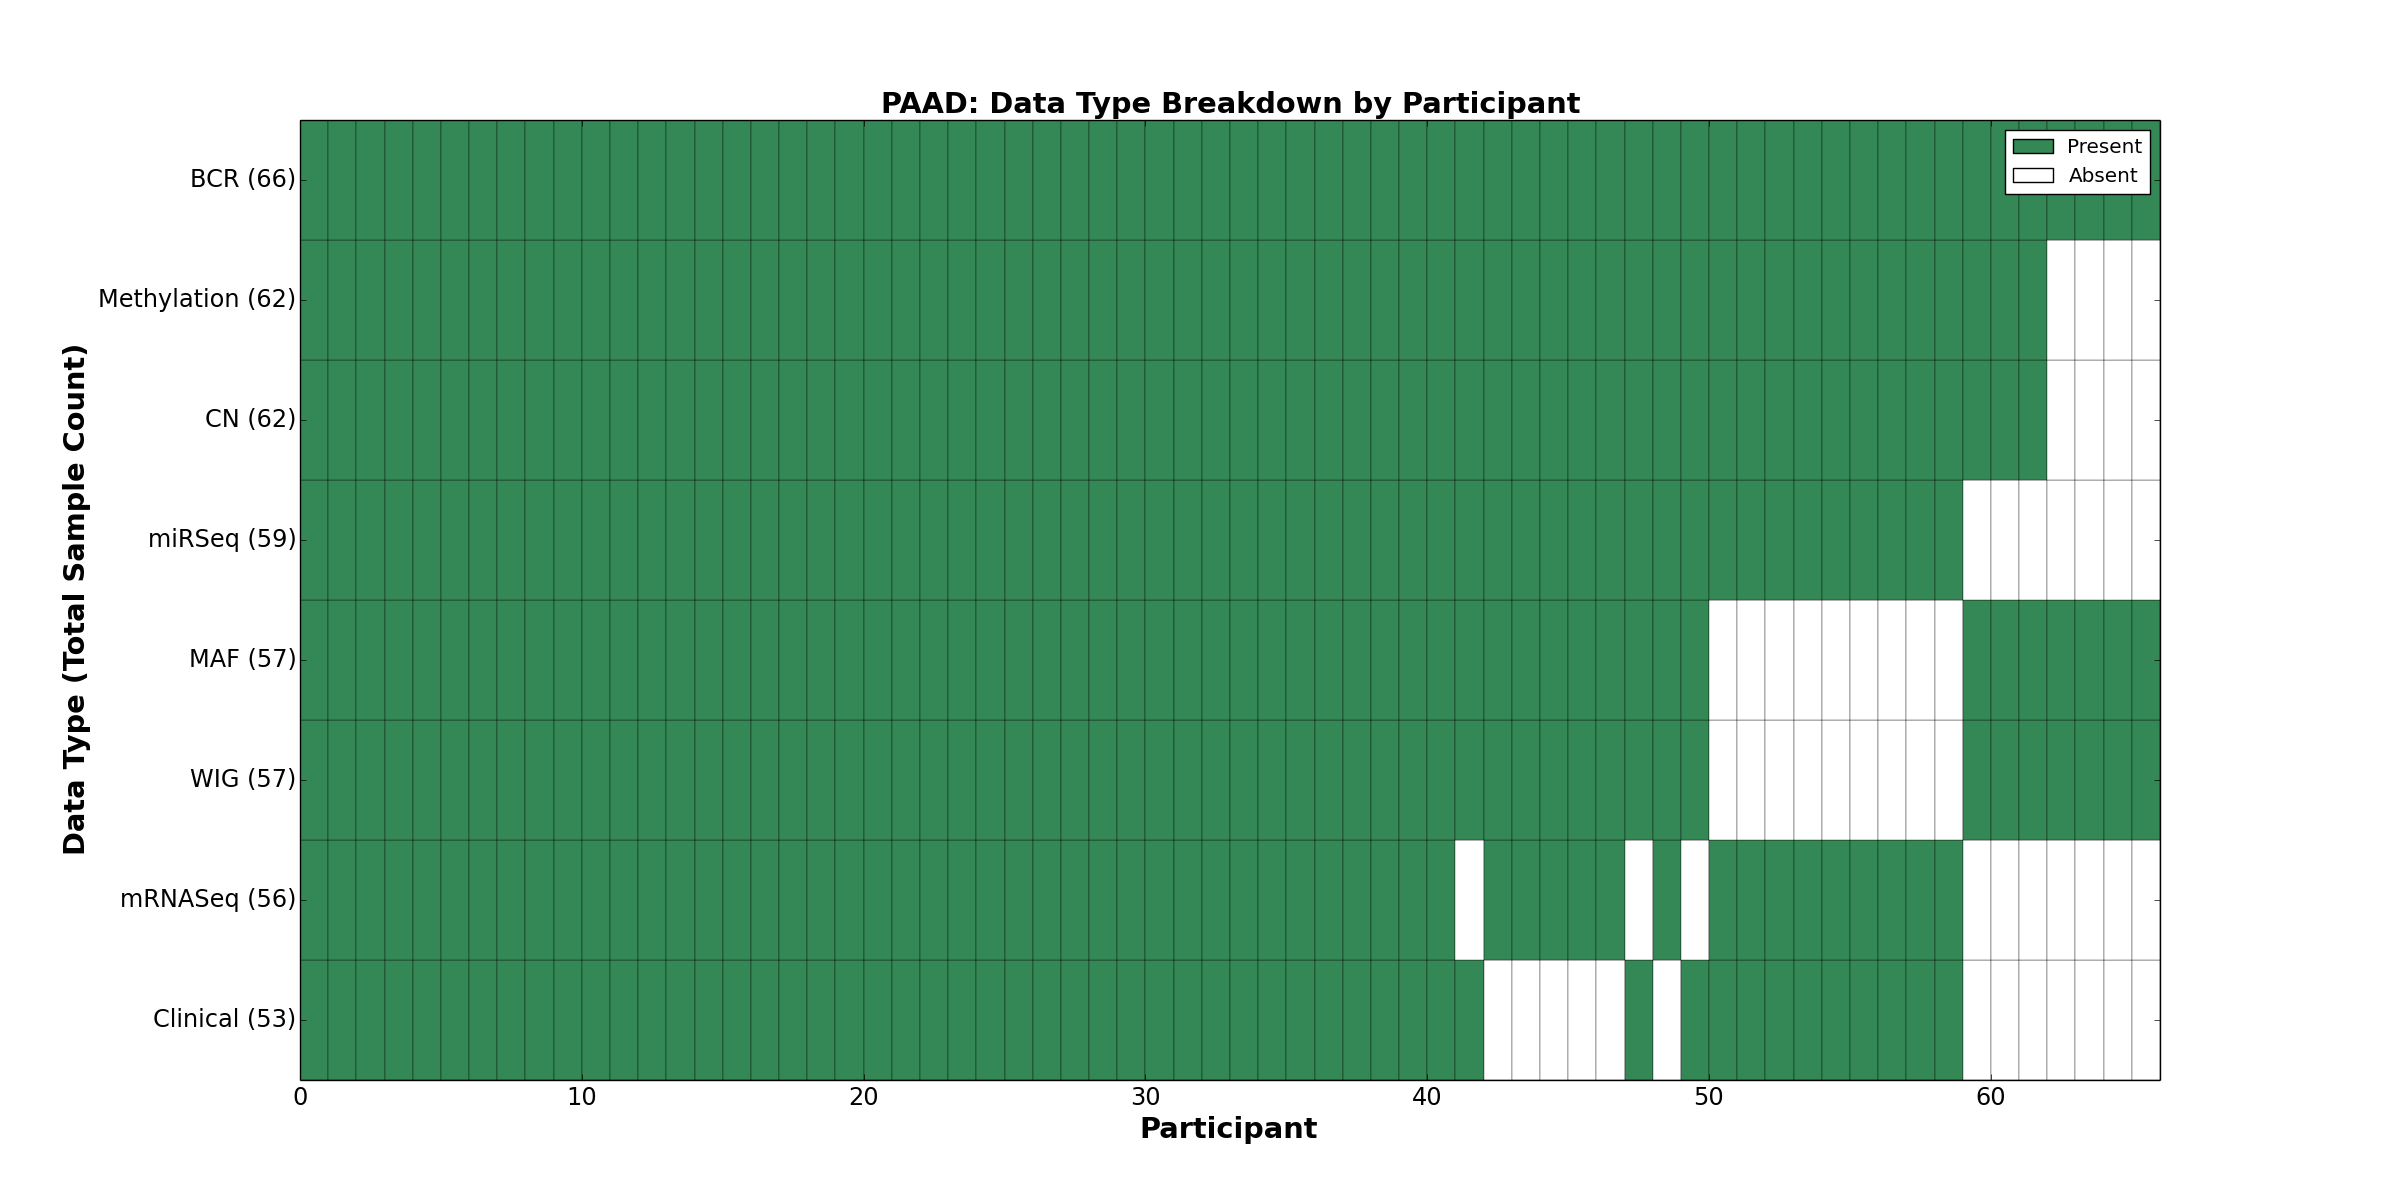
| PAAD | 66 | 53 | 62 | 0 | 62 | 0 | 56 | 0 | 59 | 0 | 57 |
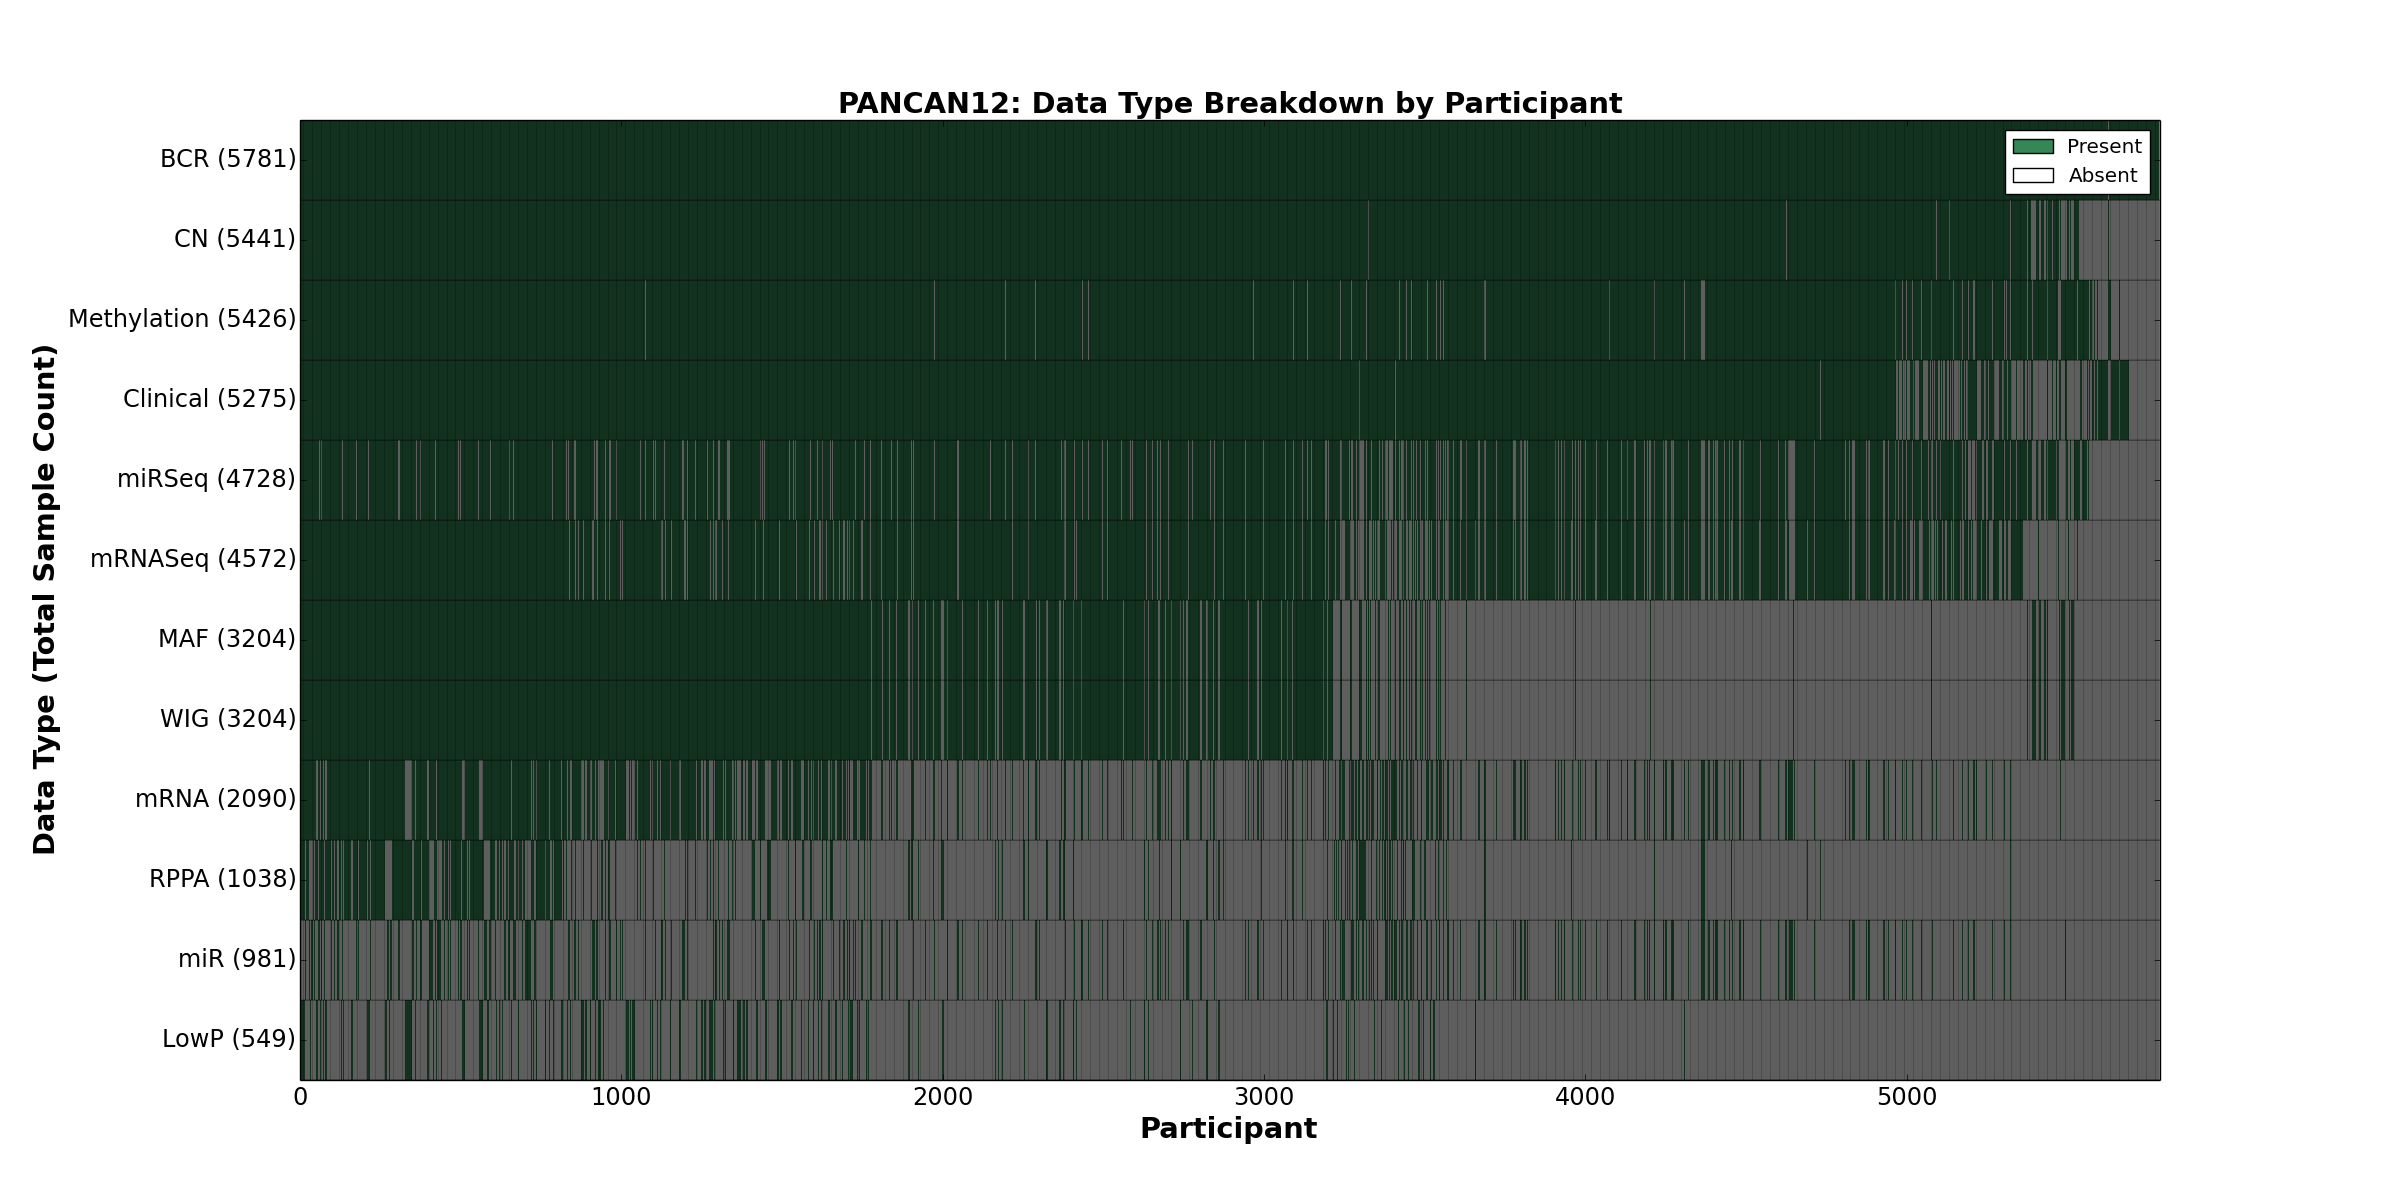
| PANCAN12 | 5781 | 5275 | 5441 | 549 | 5426 | 2090 | 4572 | 981 | 4728 | 1038 | 3204 |
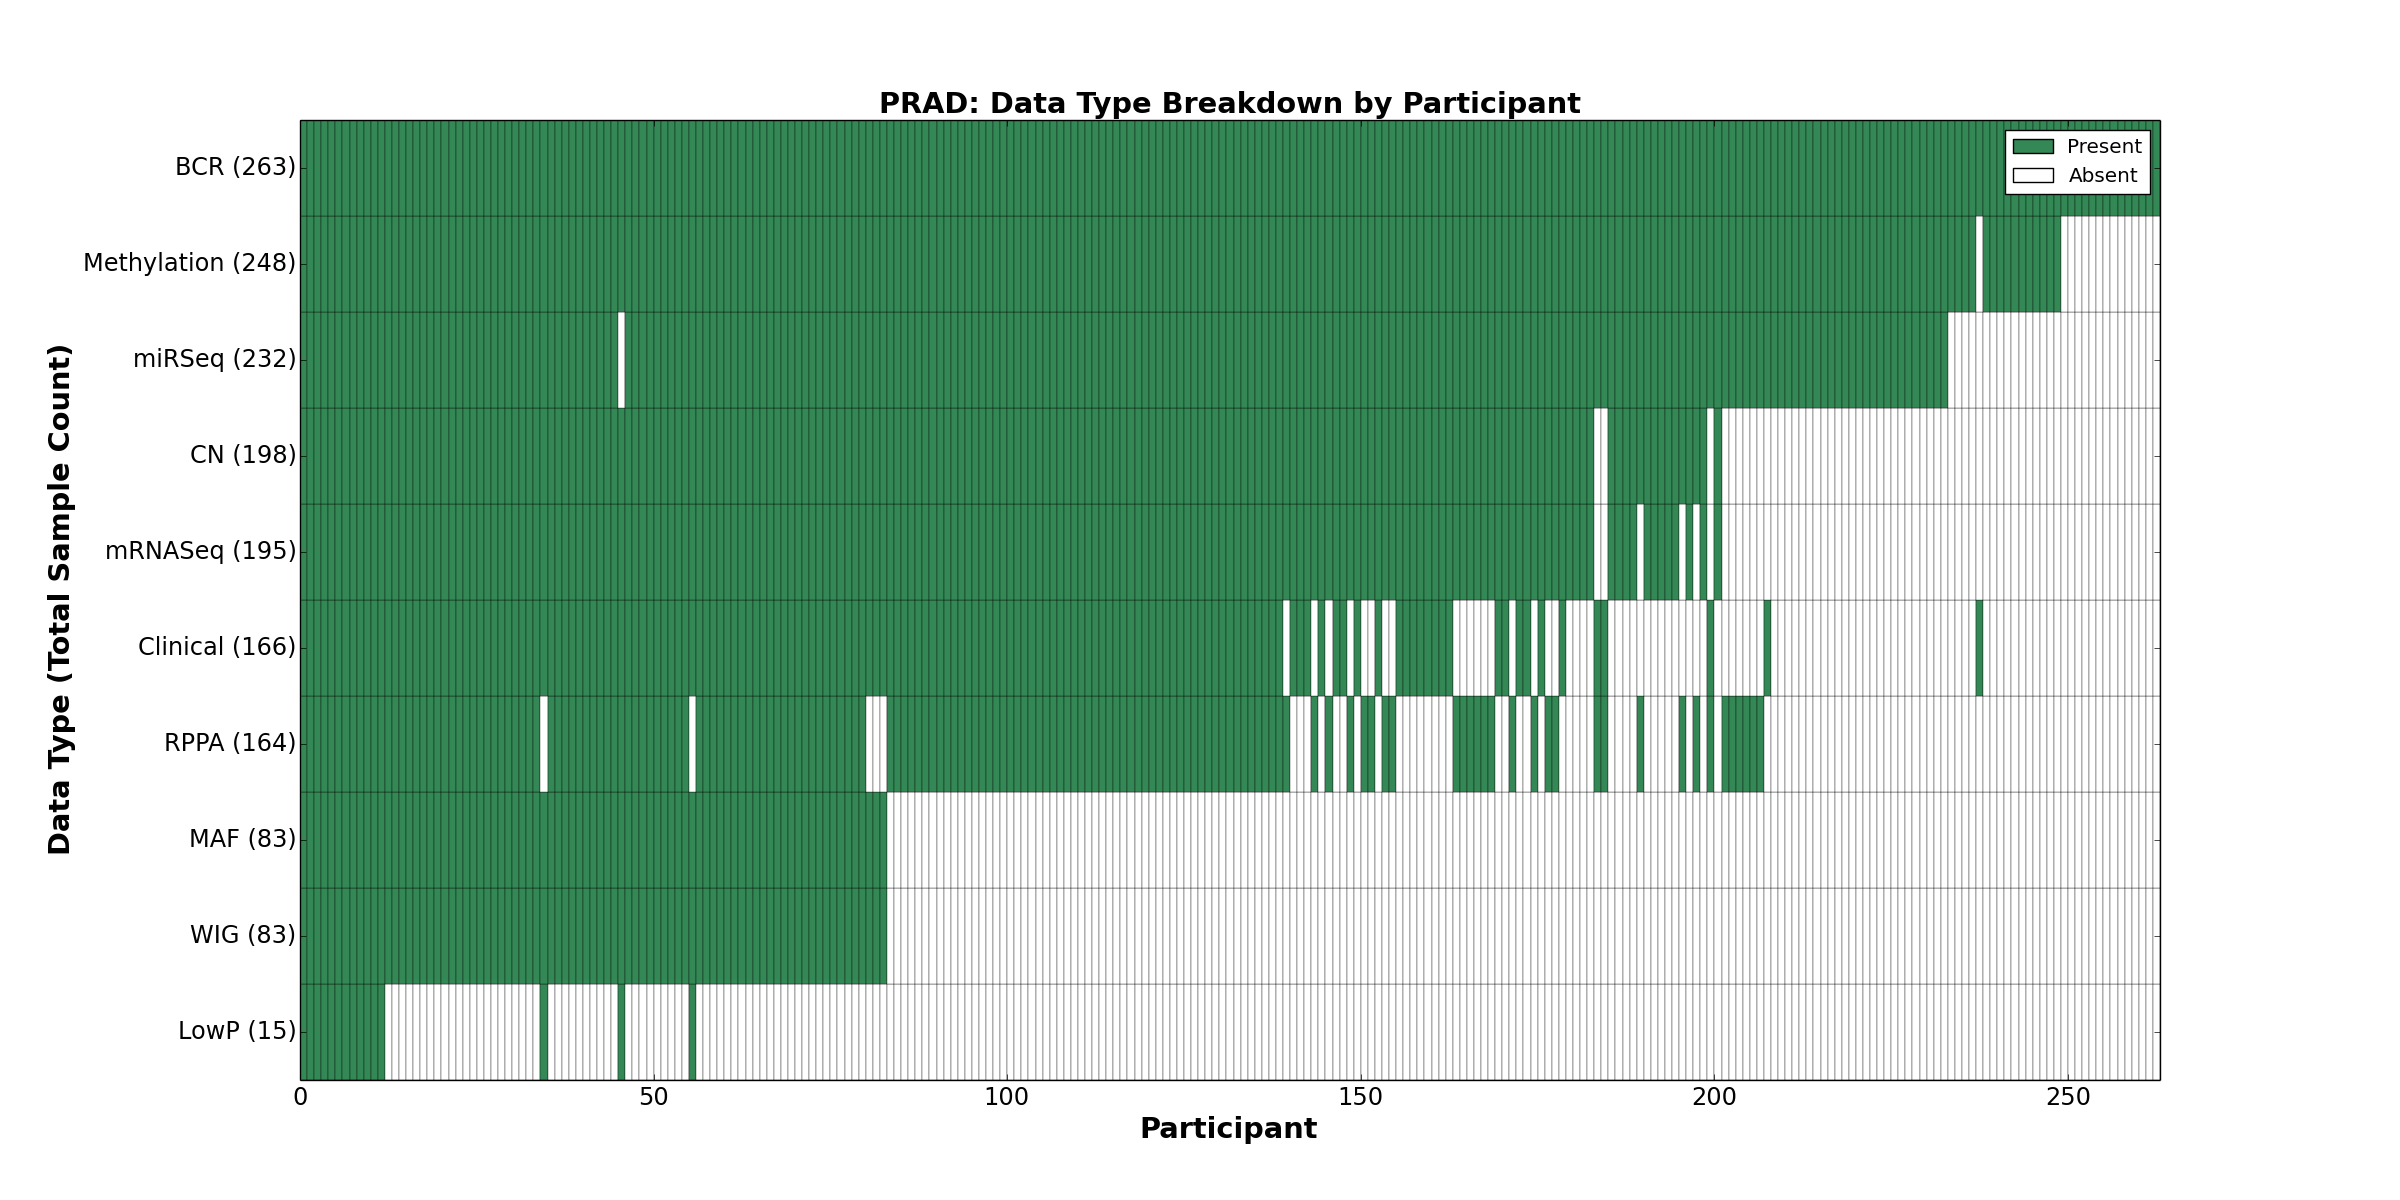
| PRAD | 263 | 166 | 198 | 15 | 248 | 0 | 195 | 0 | 232 | 164 | 83 |
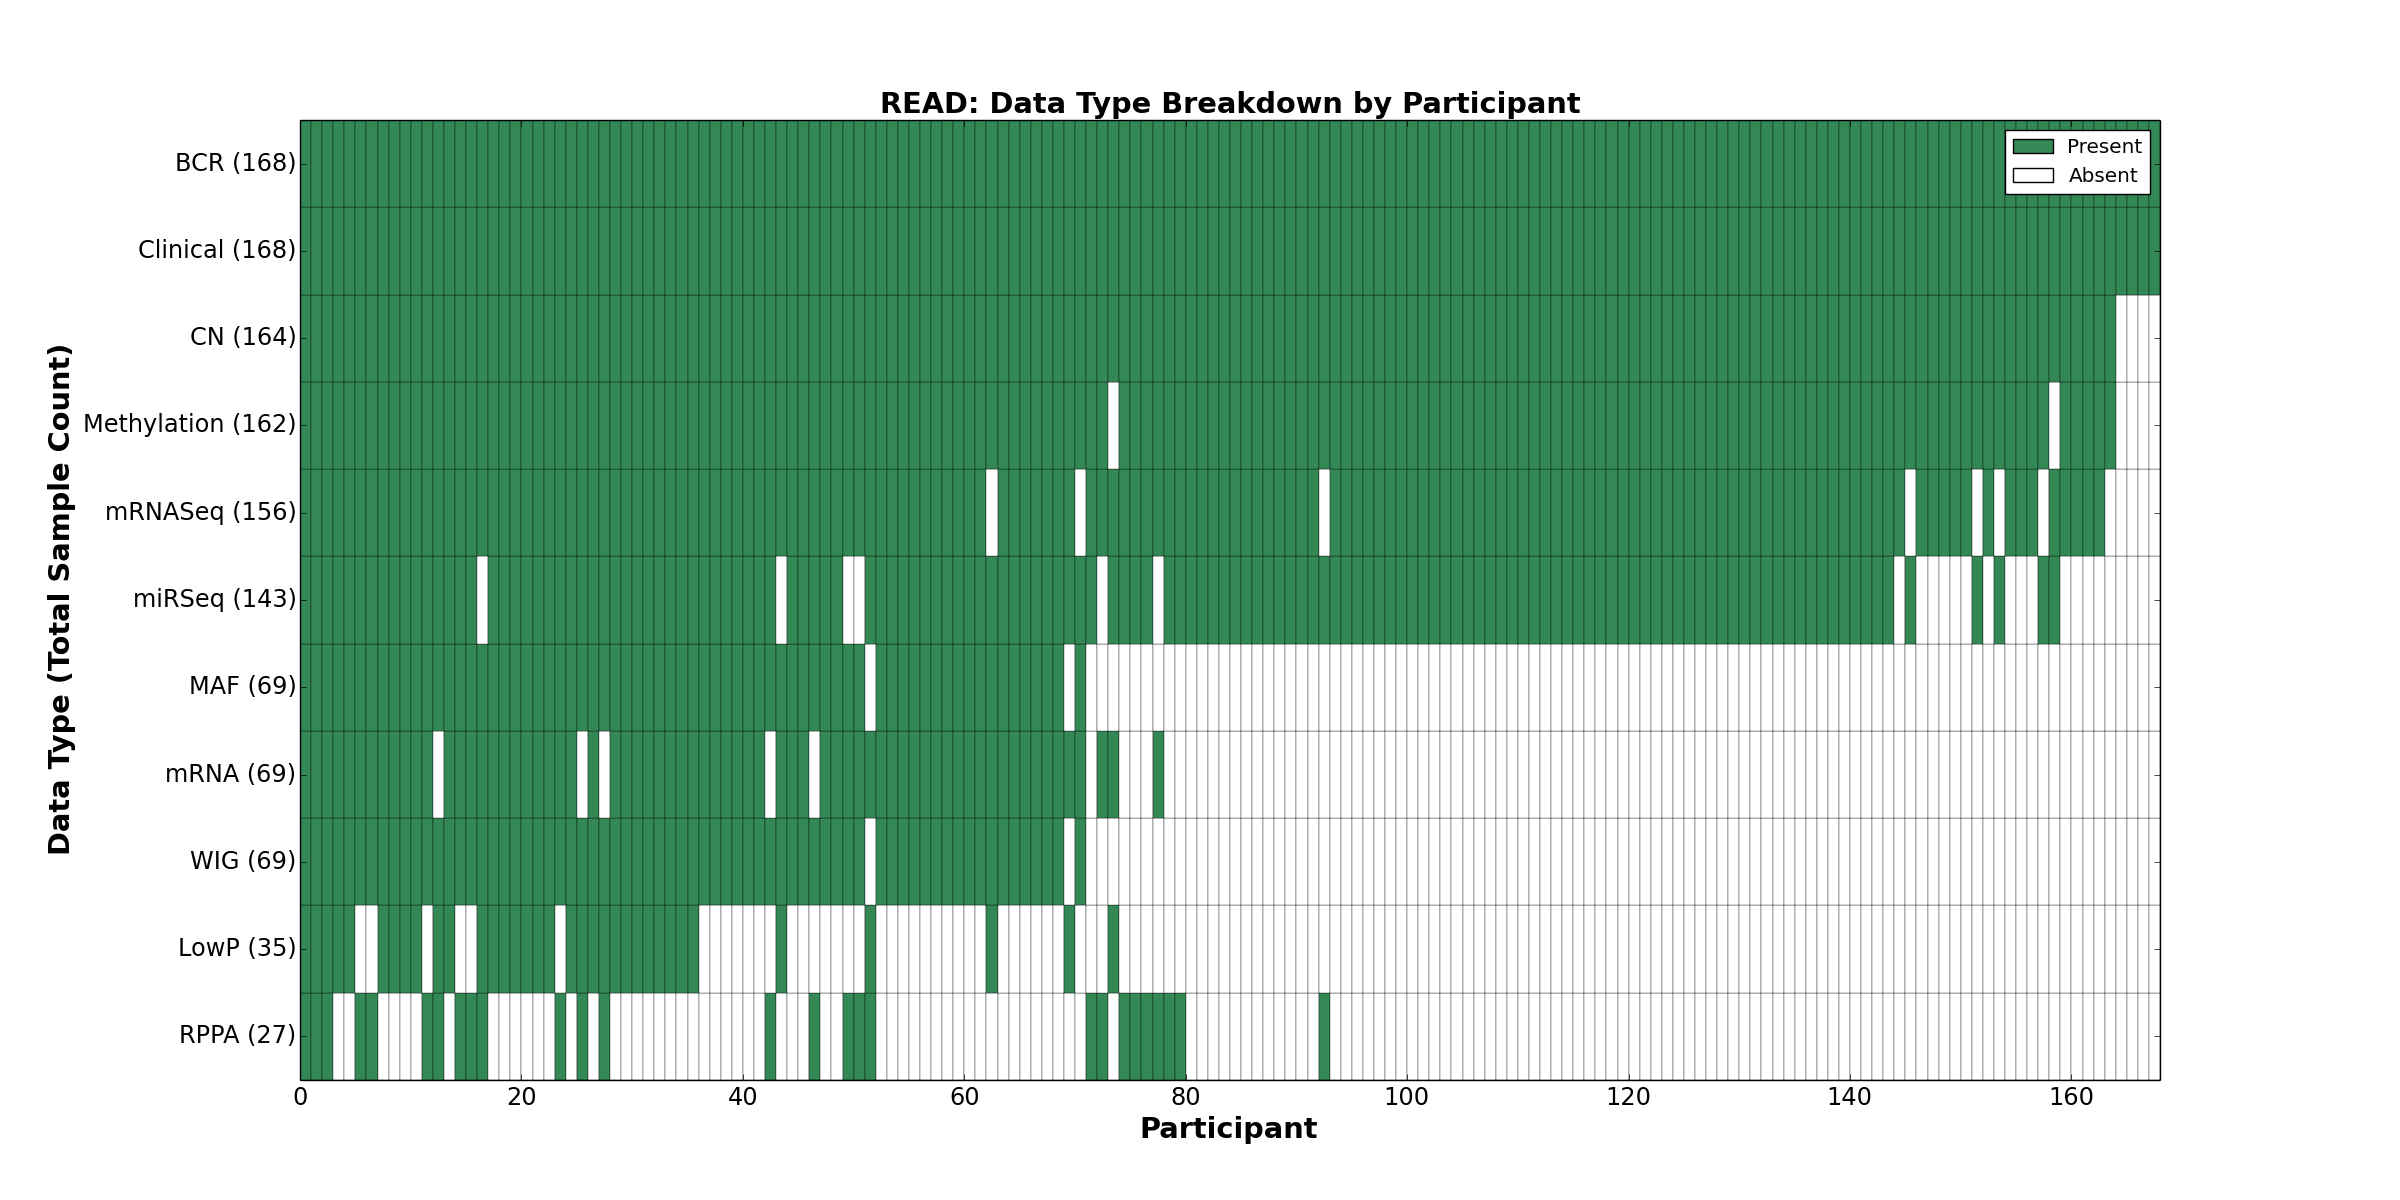
| READ | 168 | 168 | 164 | 35 | 162 | 69 | 156 | 0 | 143 | 27 | 69 |
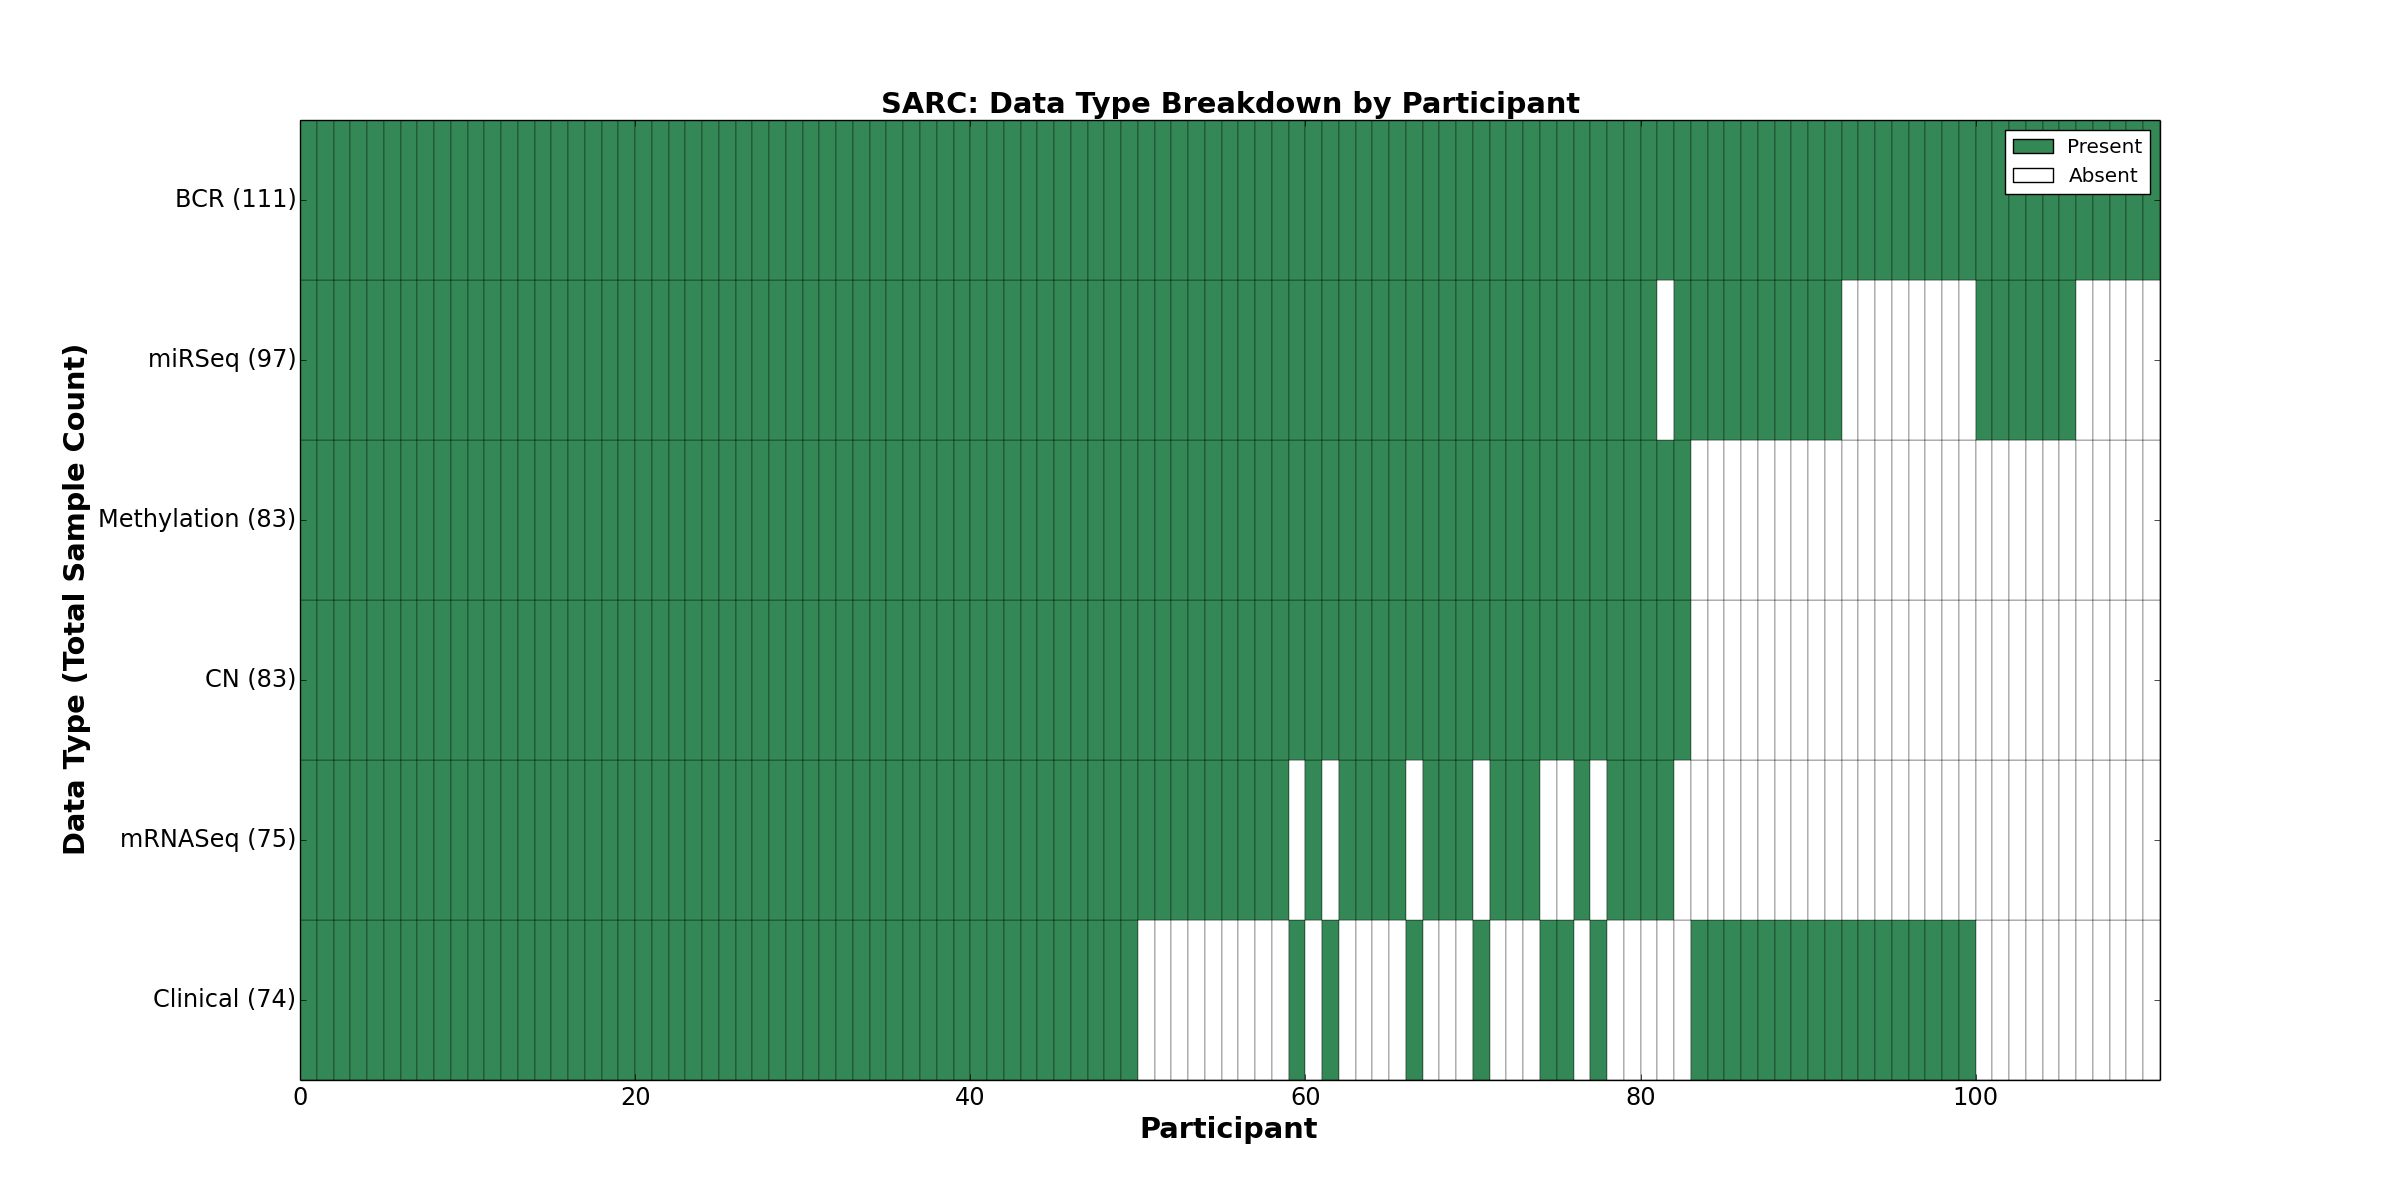
| SARC | 111 | 74 | 83 | 0 | 83 | 0 | 75 | 0 | 97 | 0 | 0 |
| SKCM | 357 | 280 | 336 | 119 | 336 | 0 | 332 | 0 | 327 | 205 | 264 |
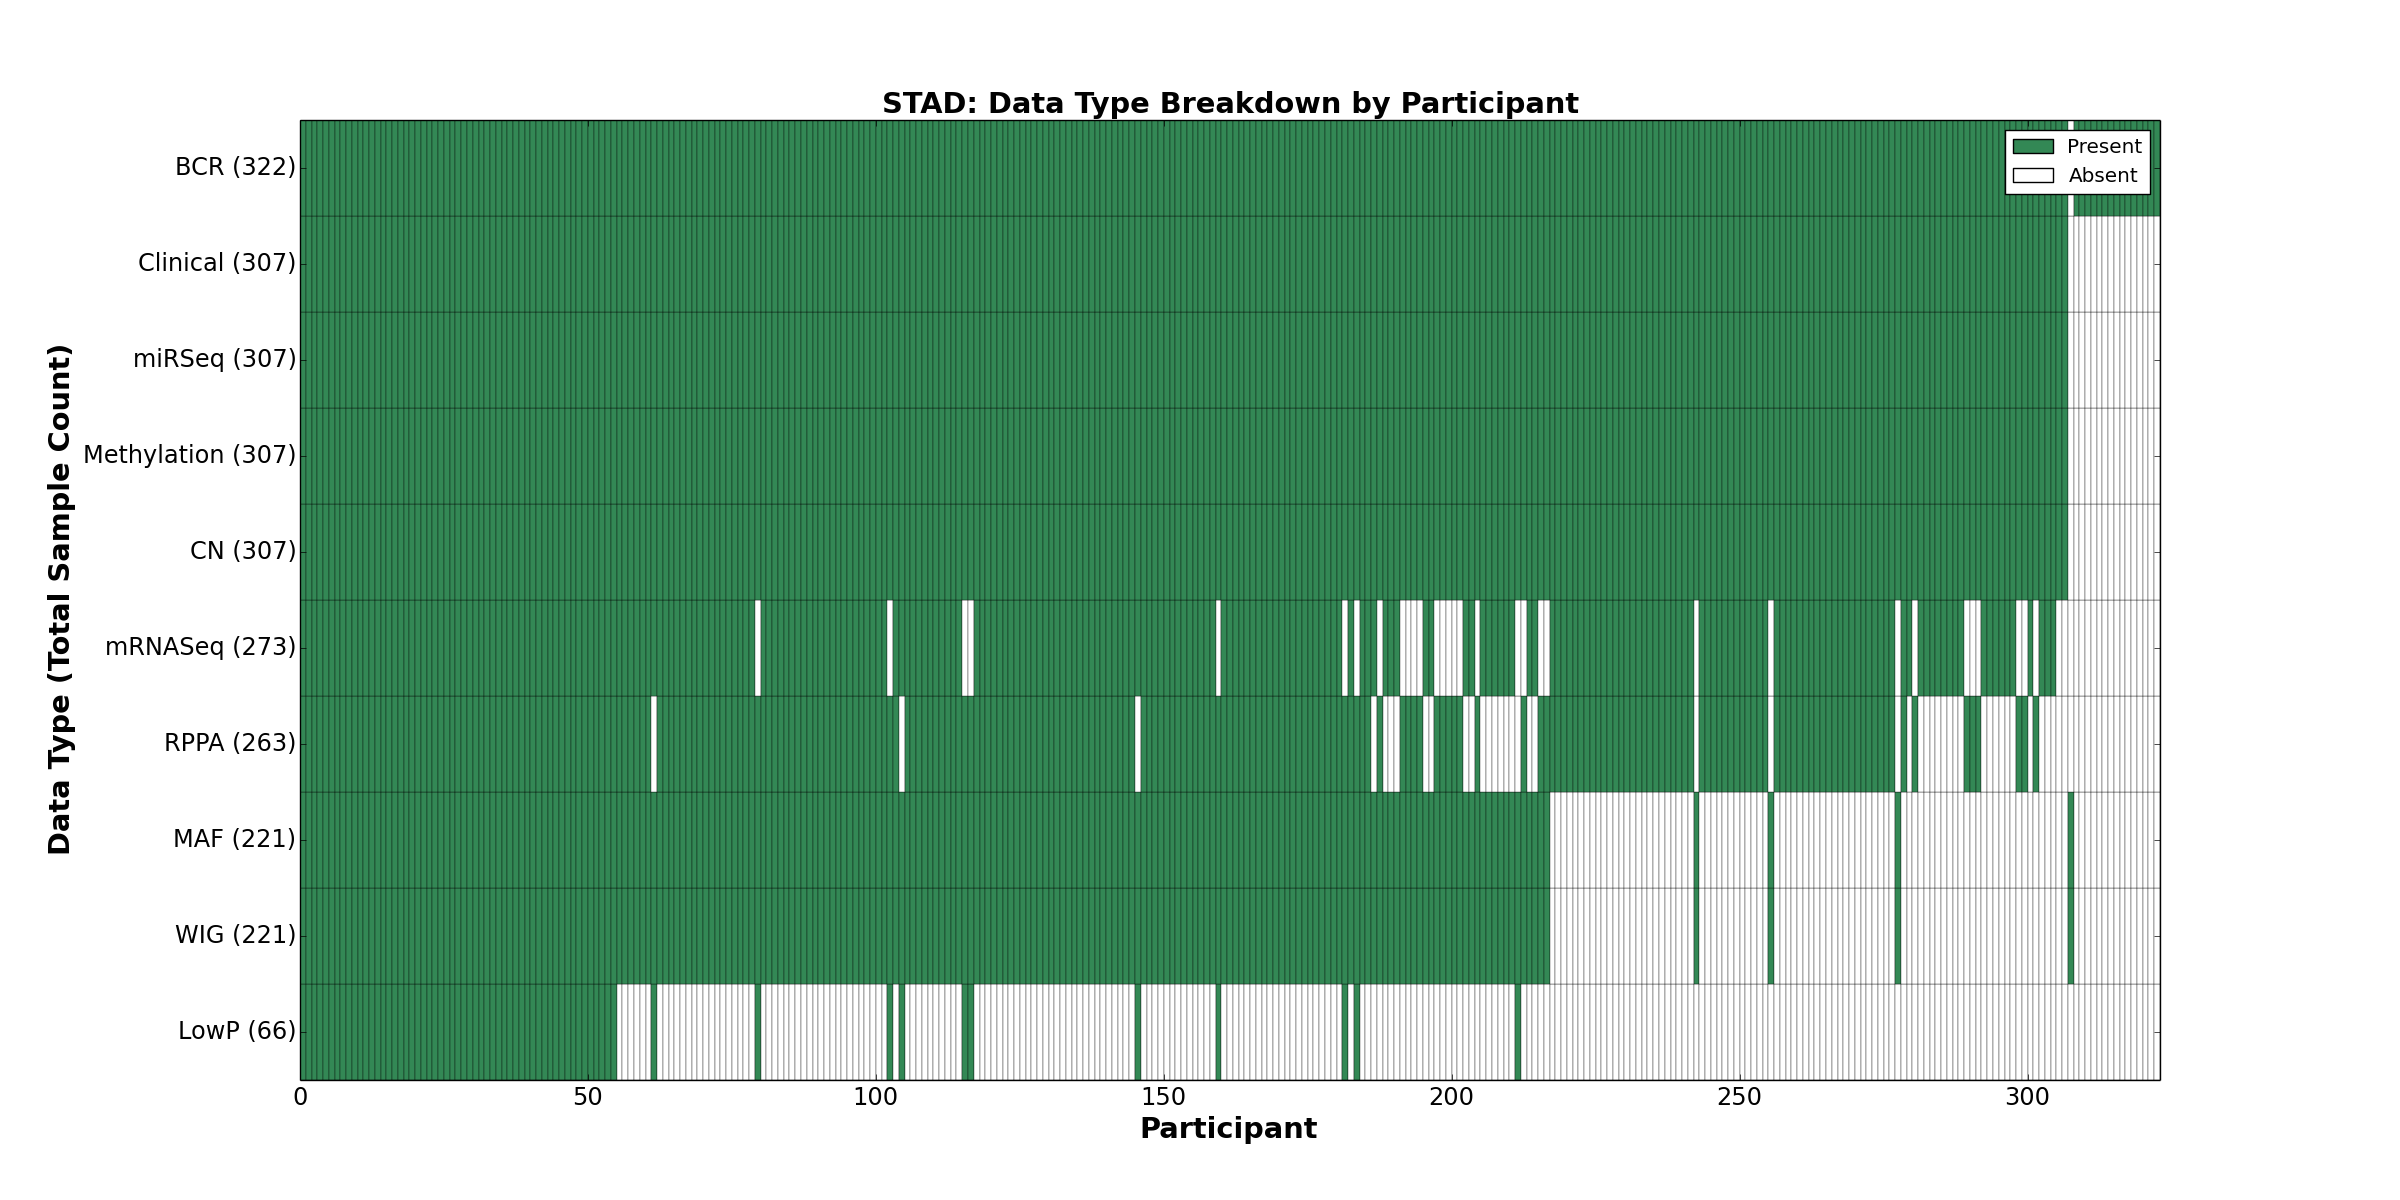
| STAD | 322 | 307 | 307 | 66 | 307 | 0 | 273 | 0 | 307 | 263 | 221 |
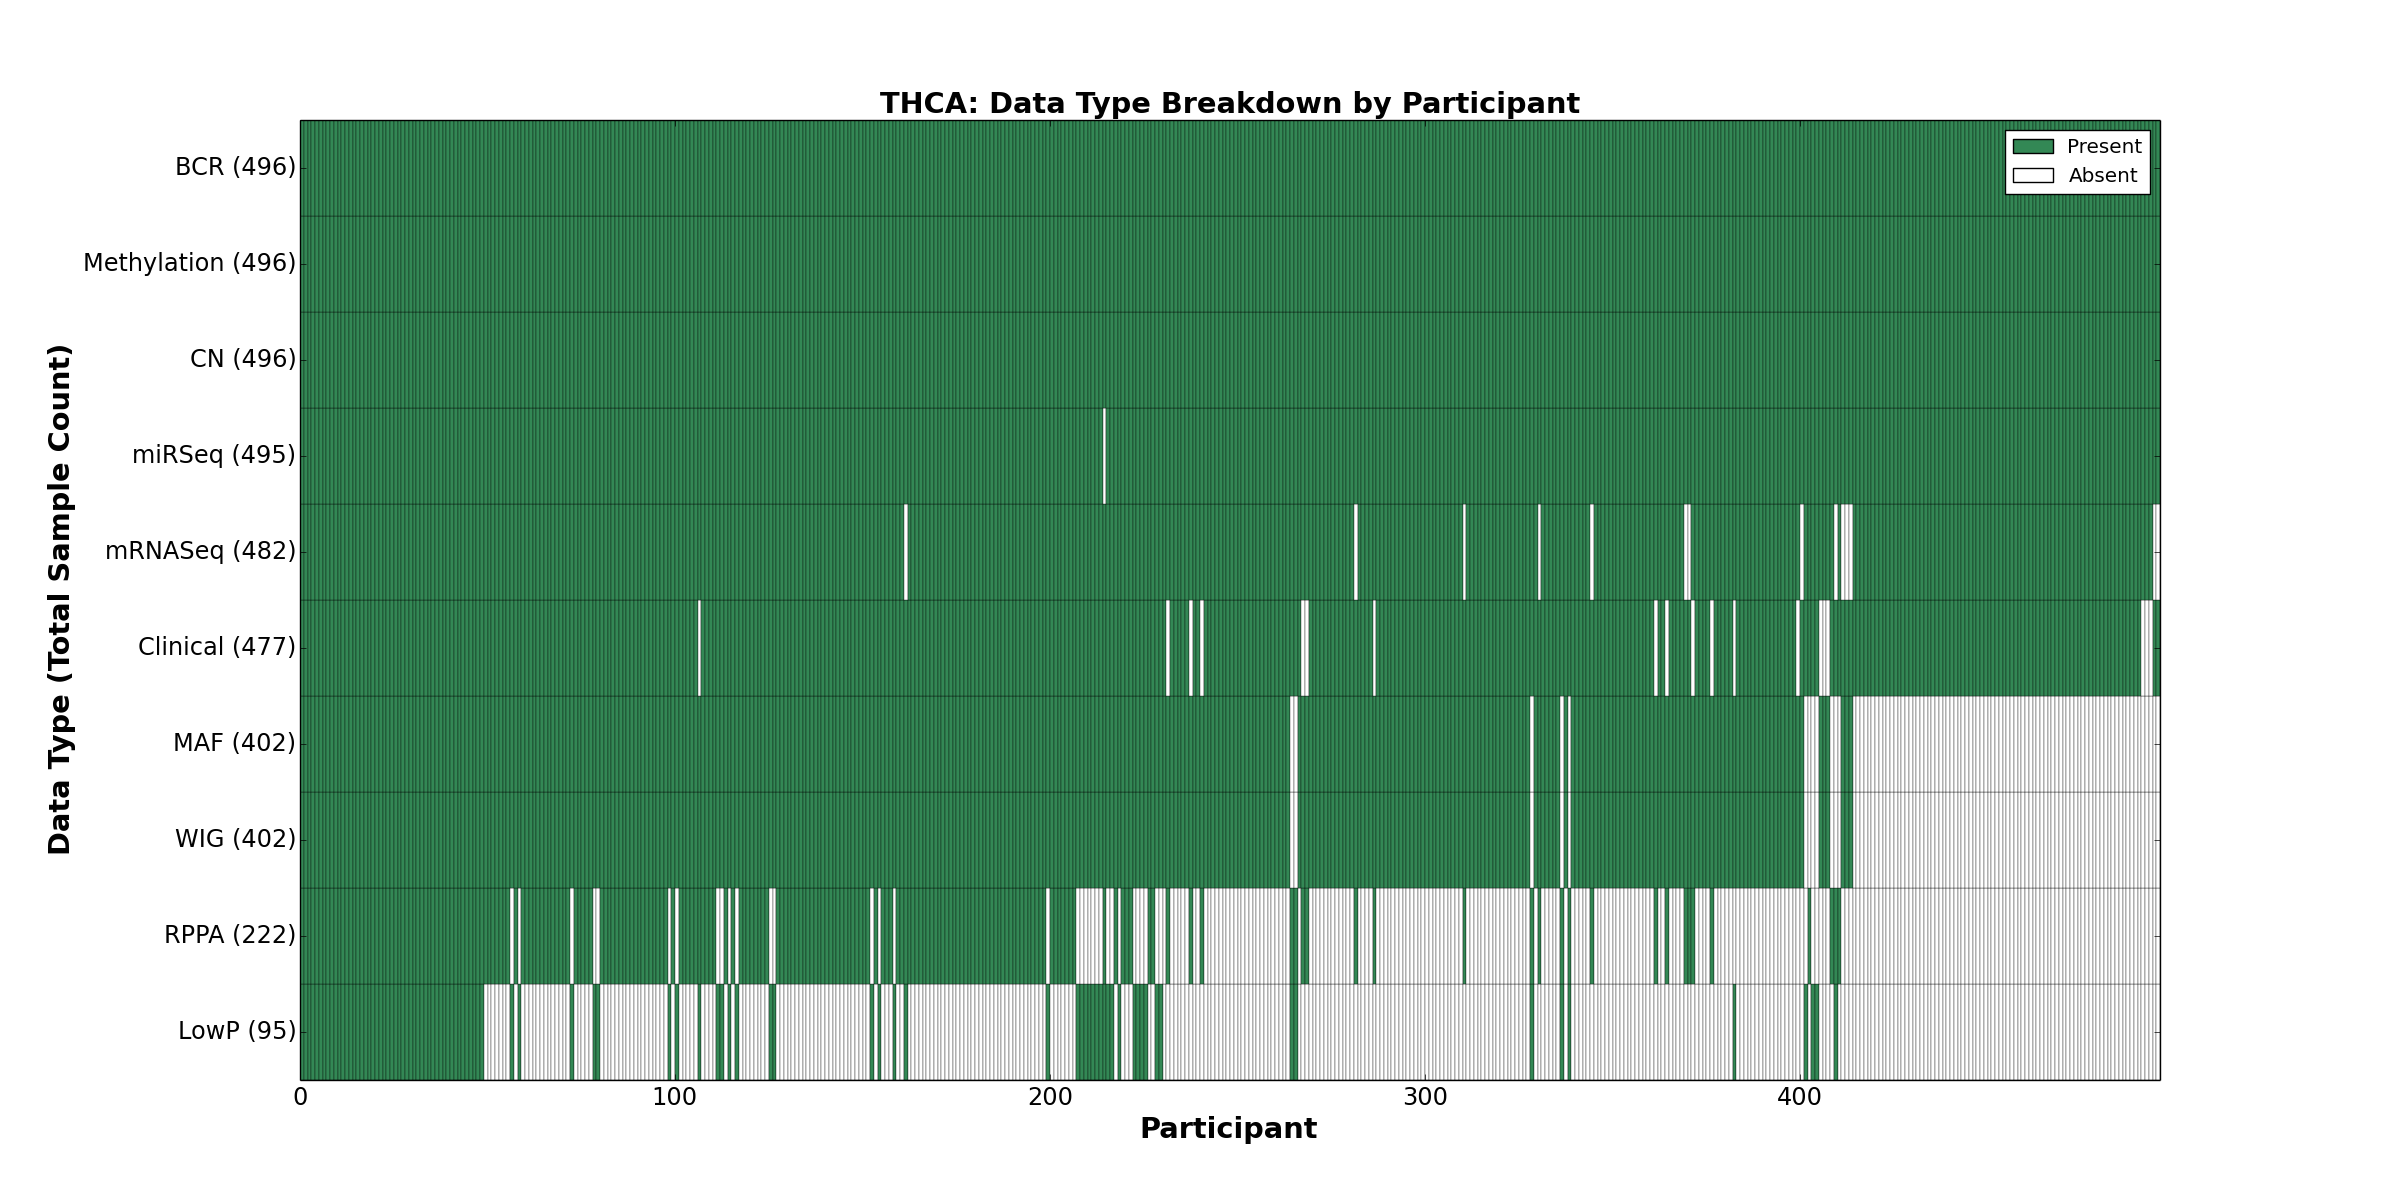
| THCA | 496 | 477 | 496 | 95 | 496 | 0 | 482 | 0 | 495 | 222 | 402 |
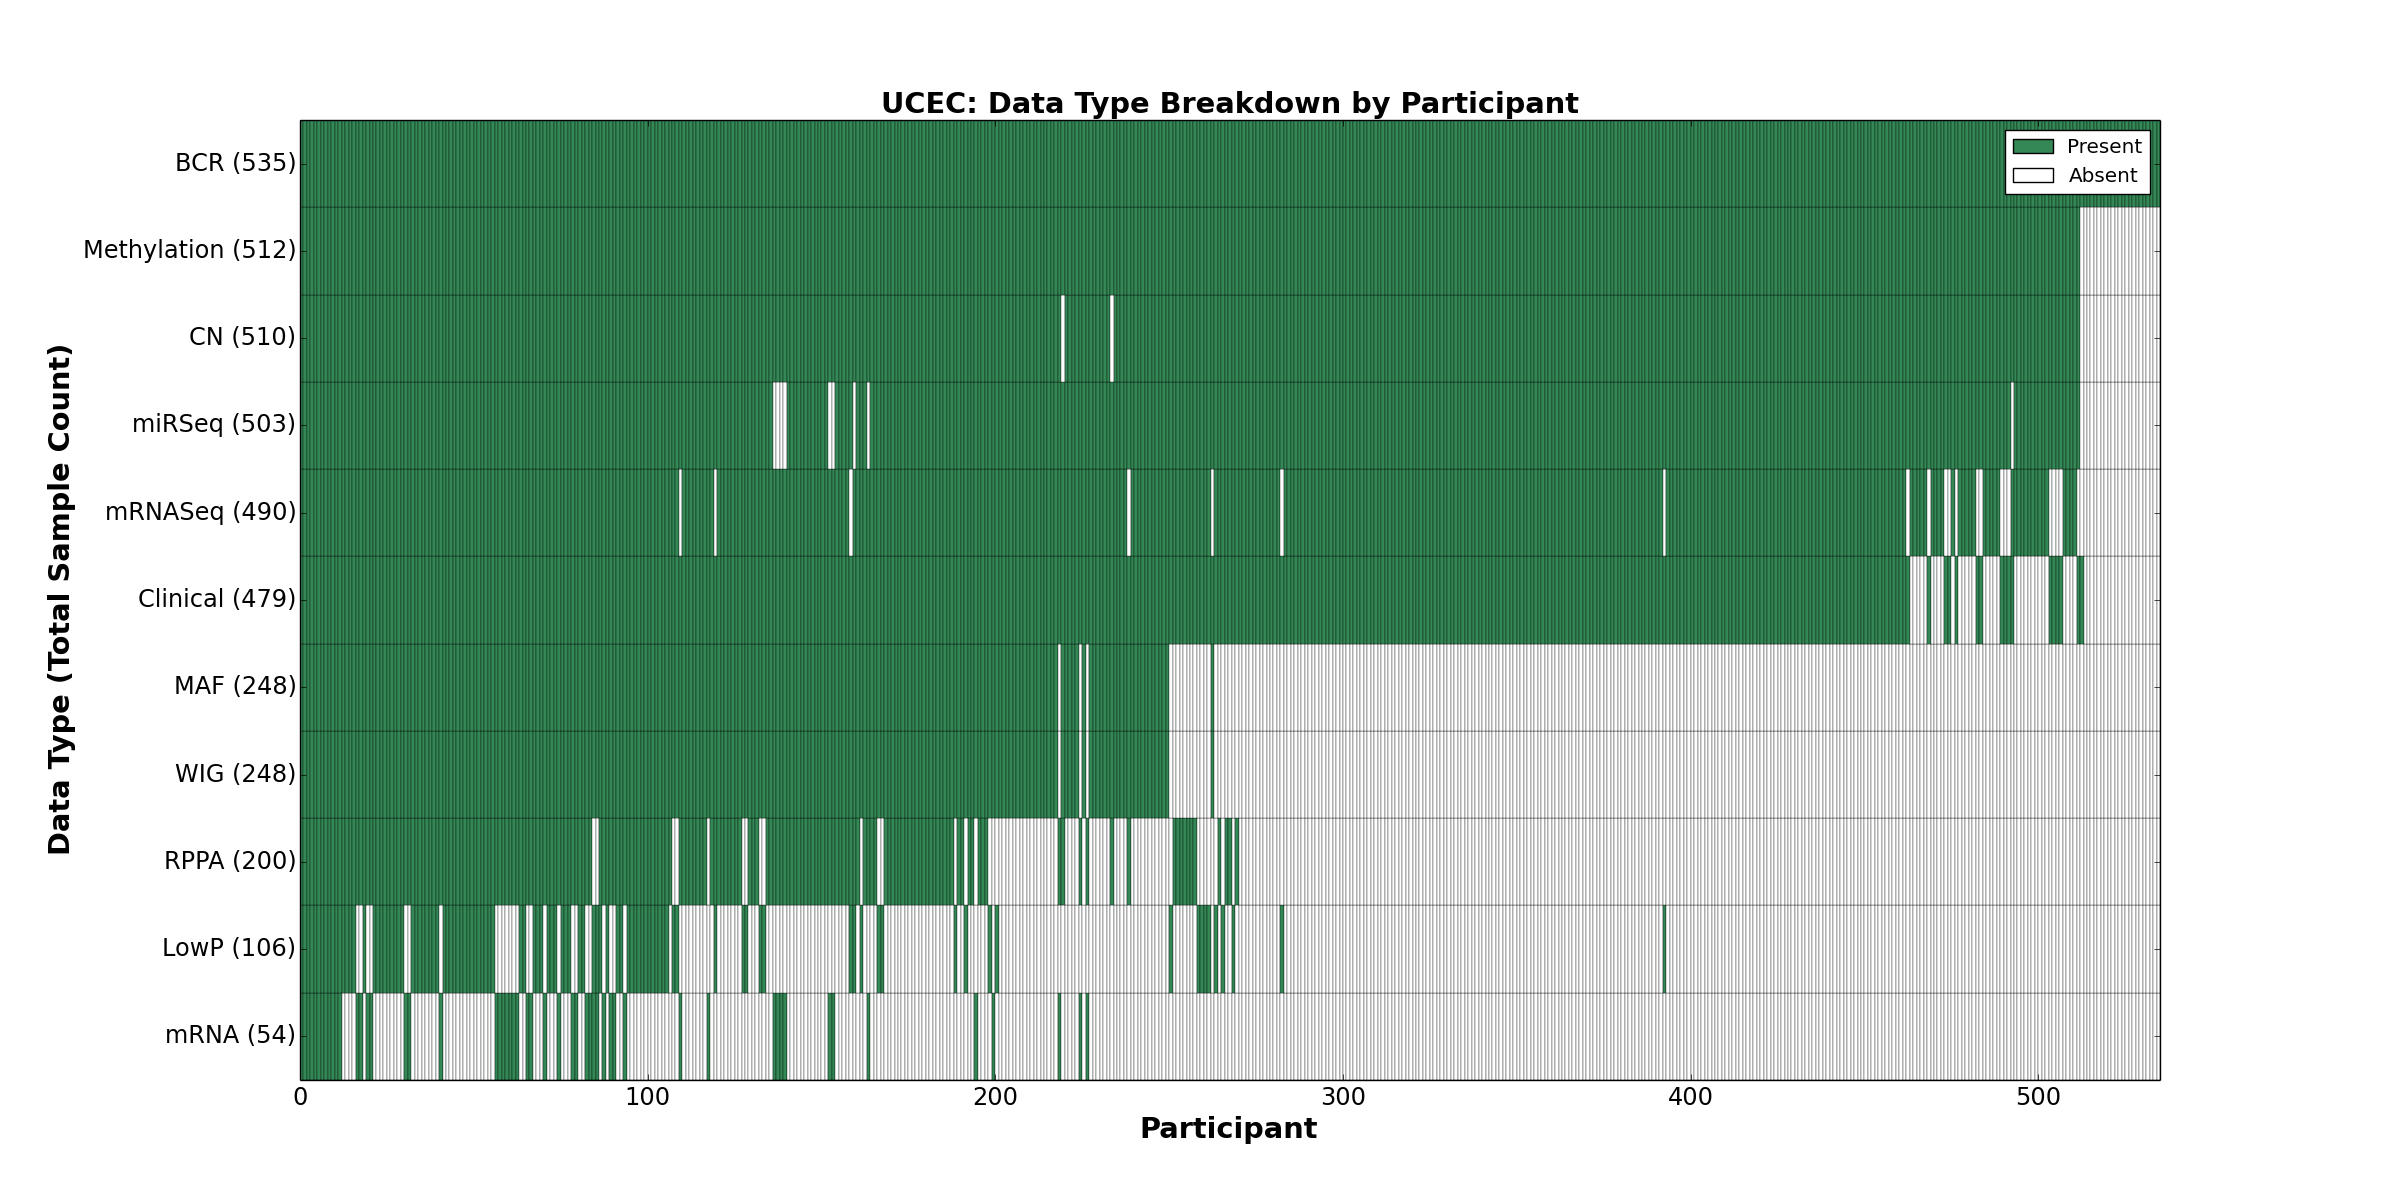
| UCEC | 535 | 479 | 510 | 106 | 512 | 54 | 490 | 0 | 503 | 200 | 248 |
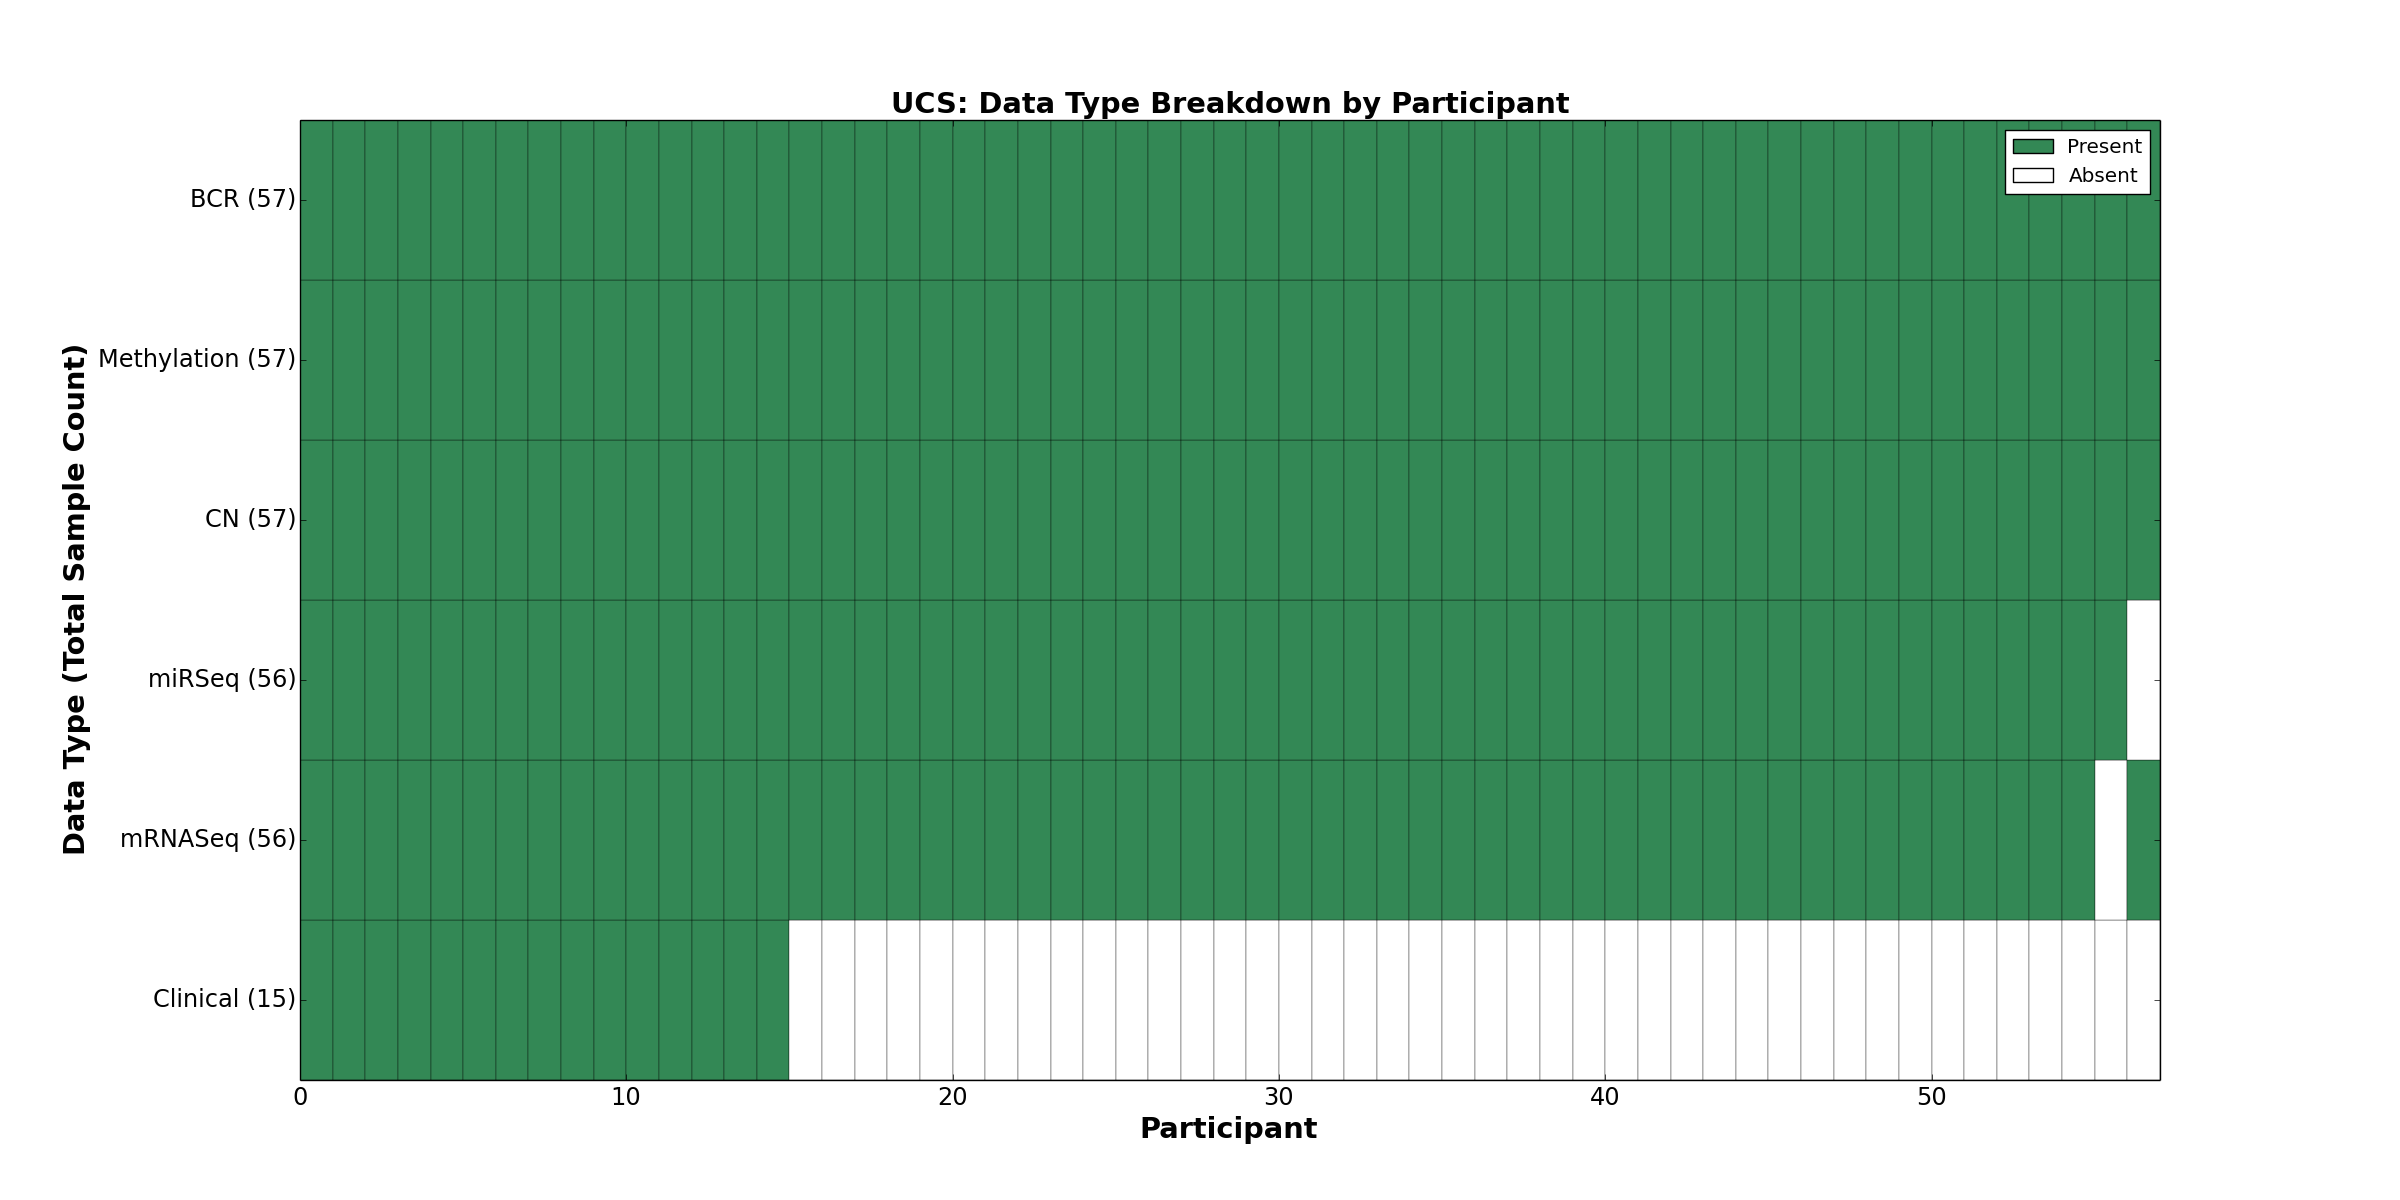
| UCS | 57 | 15 | 57 | 0 | 57 | 0 | 56 | 0 | 56 | 0 | 0 |
| Totals | 8548 | 7324 | 7971 | 859 | 7979 | 2133 | 6798 | 981 | 7151 | 2150 | 4668 |
Figure 1. Get High-res Image This figure depicts the distribution of available data on a per participant basis.
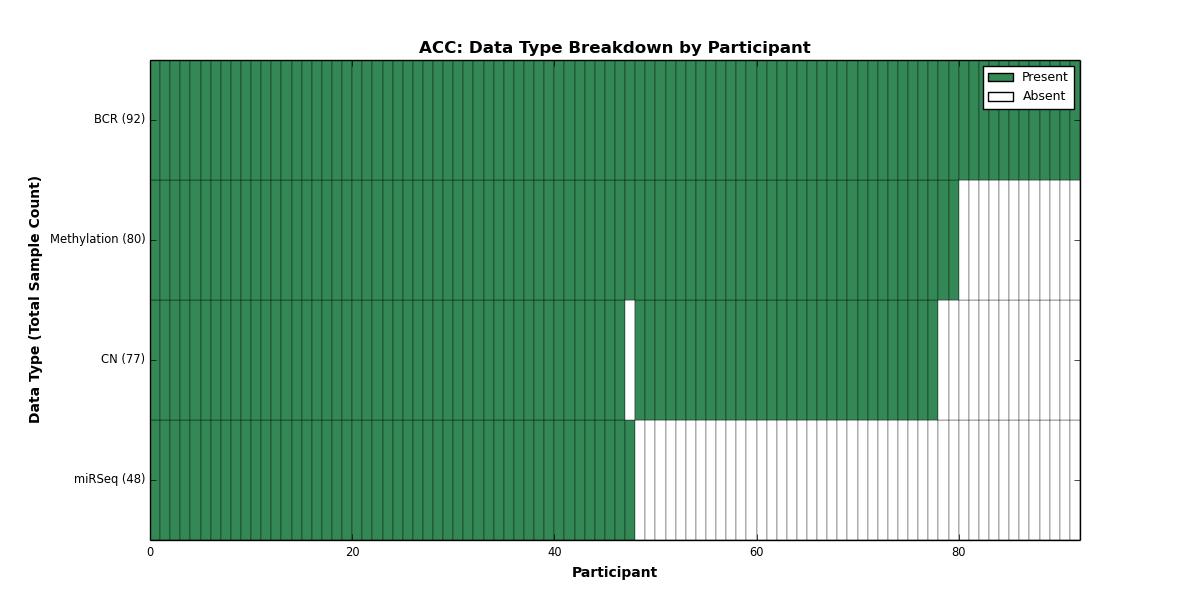
Figure 2. Get High-res Image This figure depicts the distribution of available data on a per participant basis.
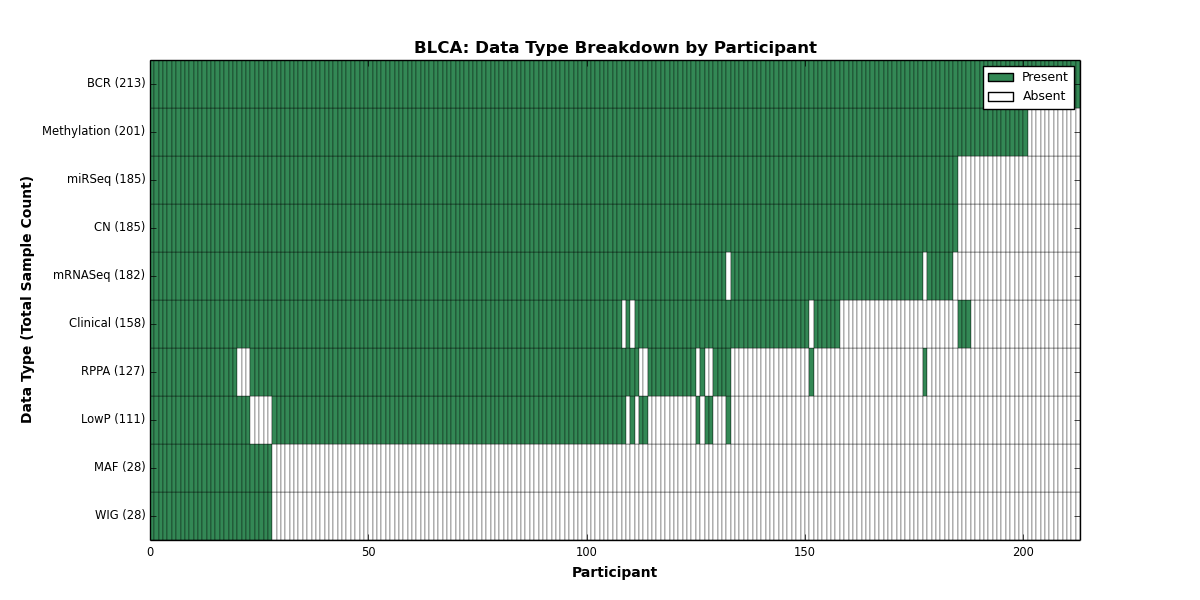
Figure 3. Get High-res Image This figure depicts the distribution of available data on a per participant basis.
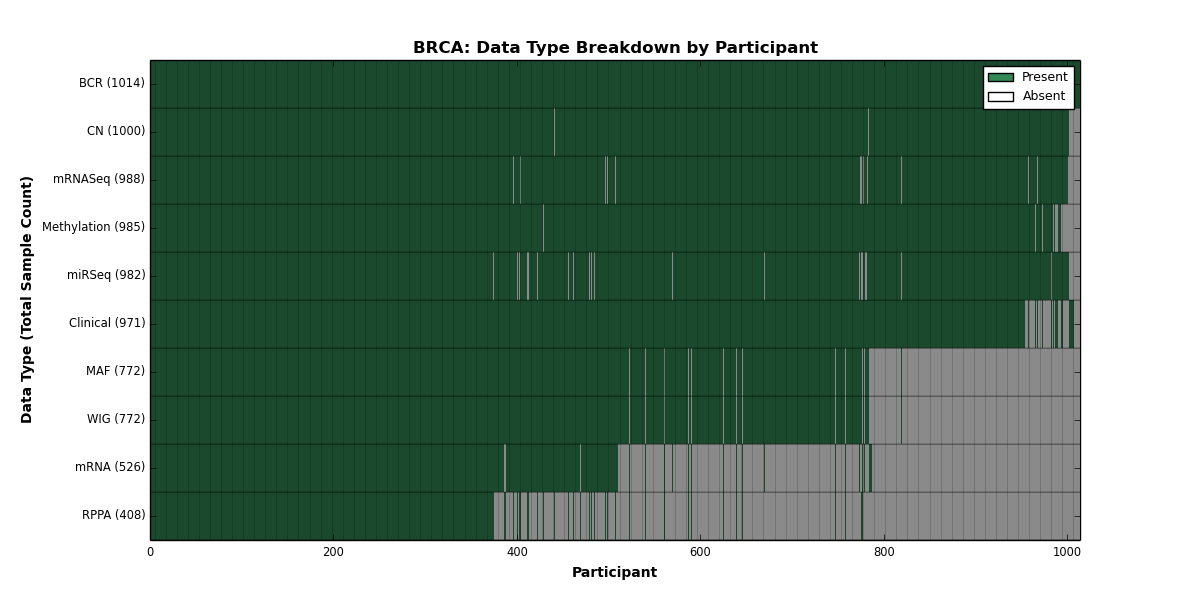
Figure 4. Get High-res Image This figure depicts the distribution of available data on a per participant basis.
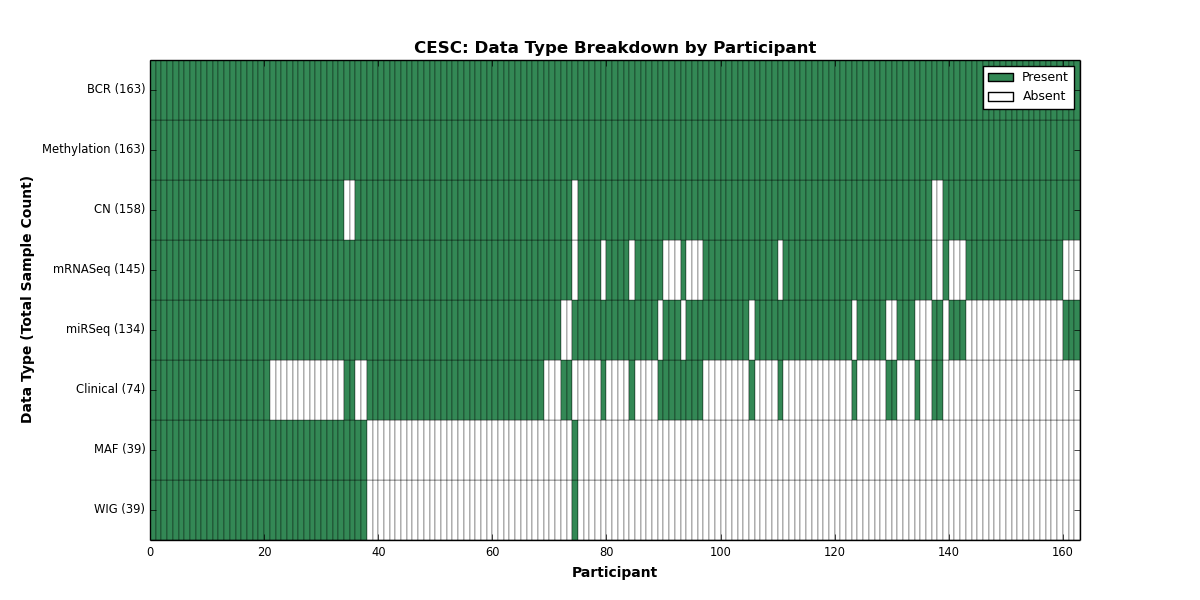
Figure 5. Get High-res Image This figure depicts the distribution of available data on a per participant basis.
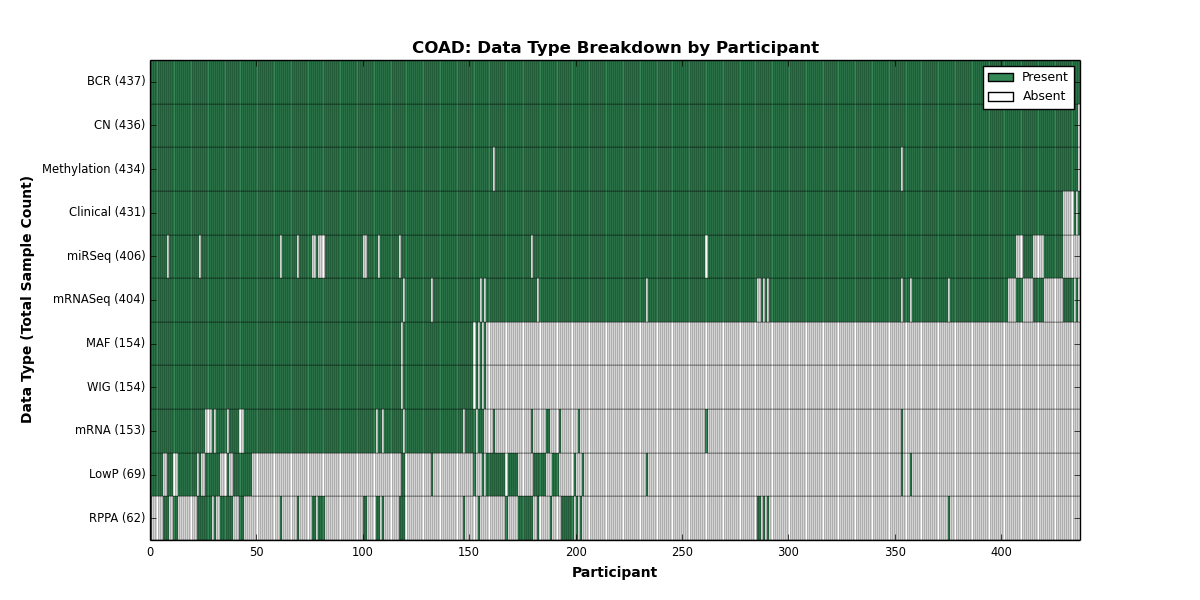
Figure 6. Get High-res Image This figure depicts the distribution of available data on a per participant basis.
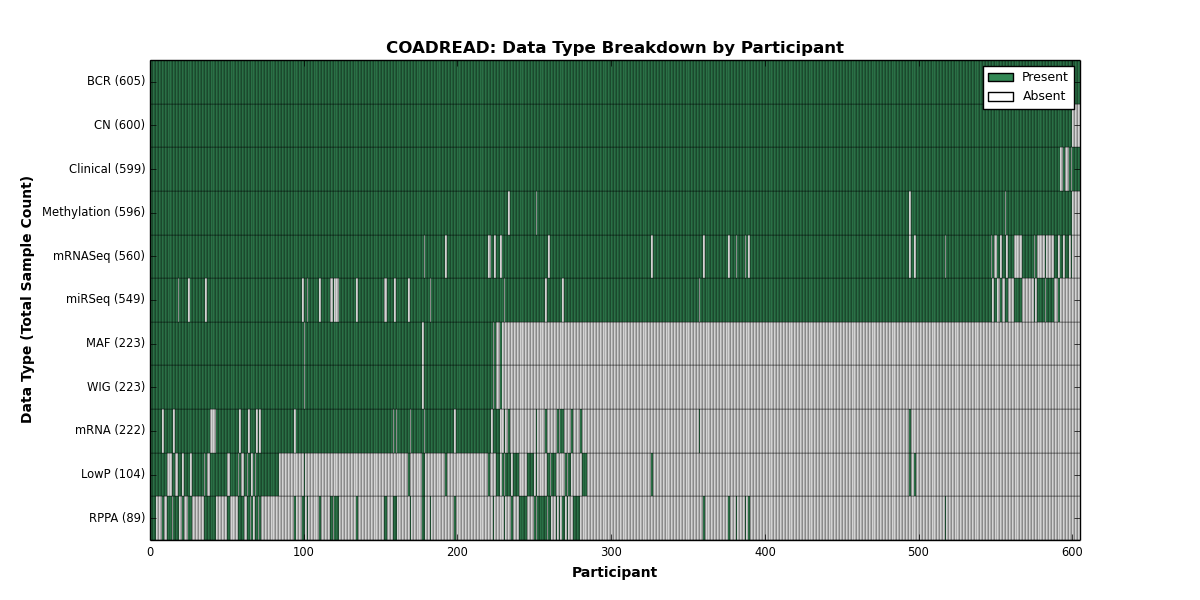
Figure 7. Get High-res Image This figure depicts the distribution of available data on a per participant basis.
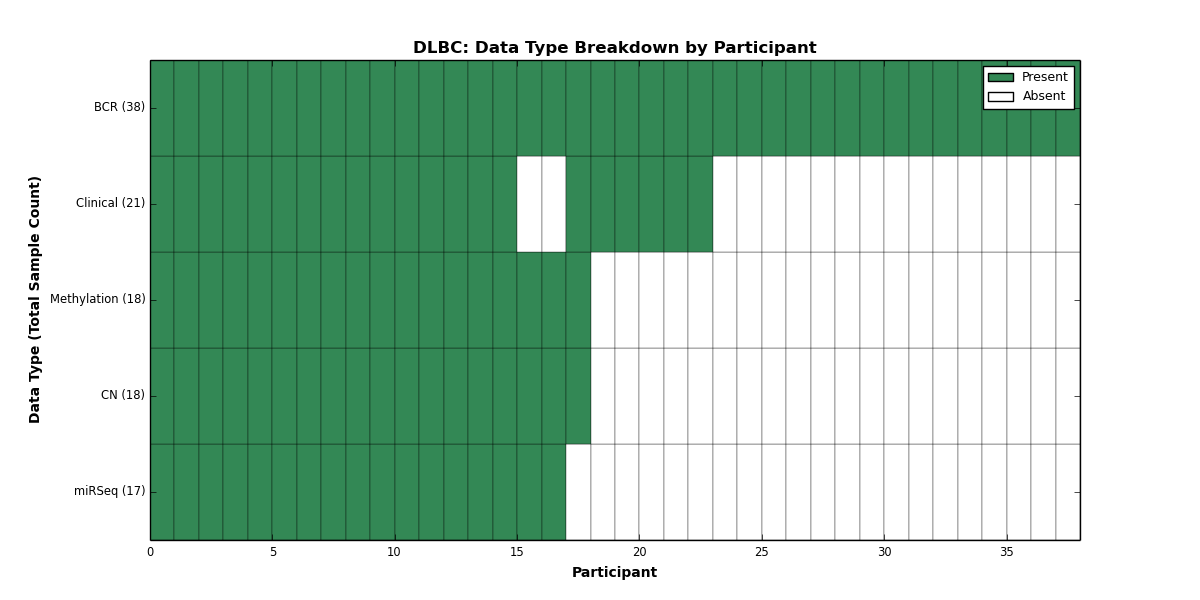
Figure 8. Get High-res Image This figure depicts the distribution of available data on a per participant basis.
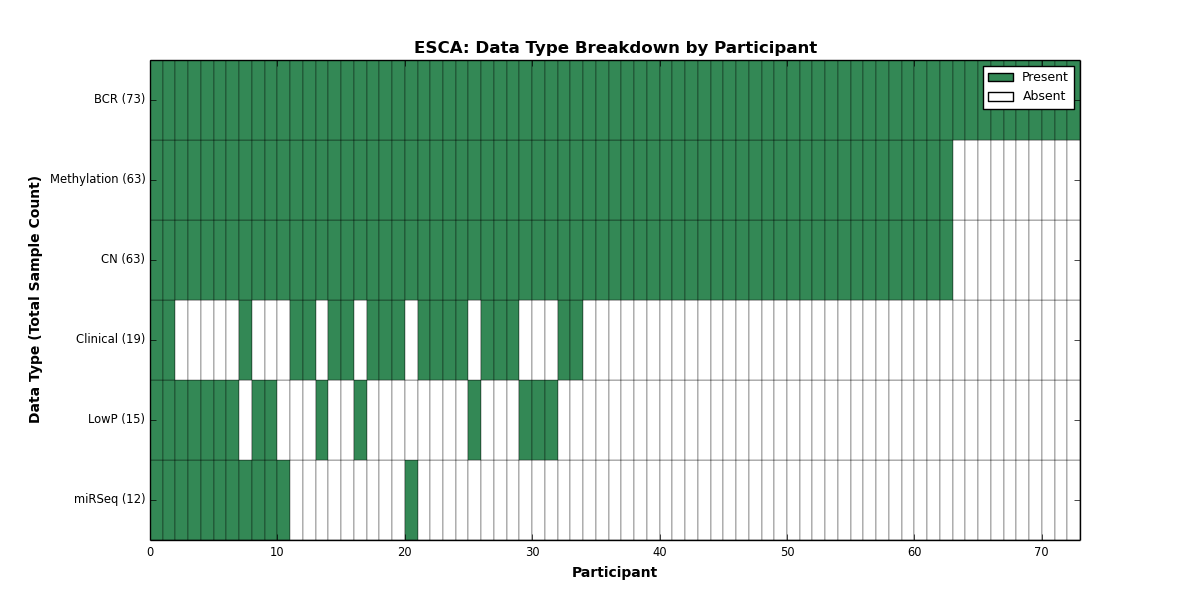
Figure 9. Get High-res Image This figure depicts the distribution of available data on a per participant basis.
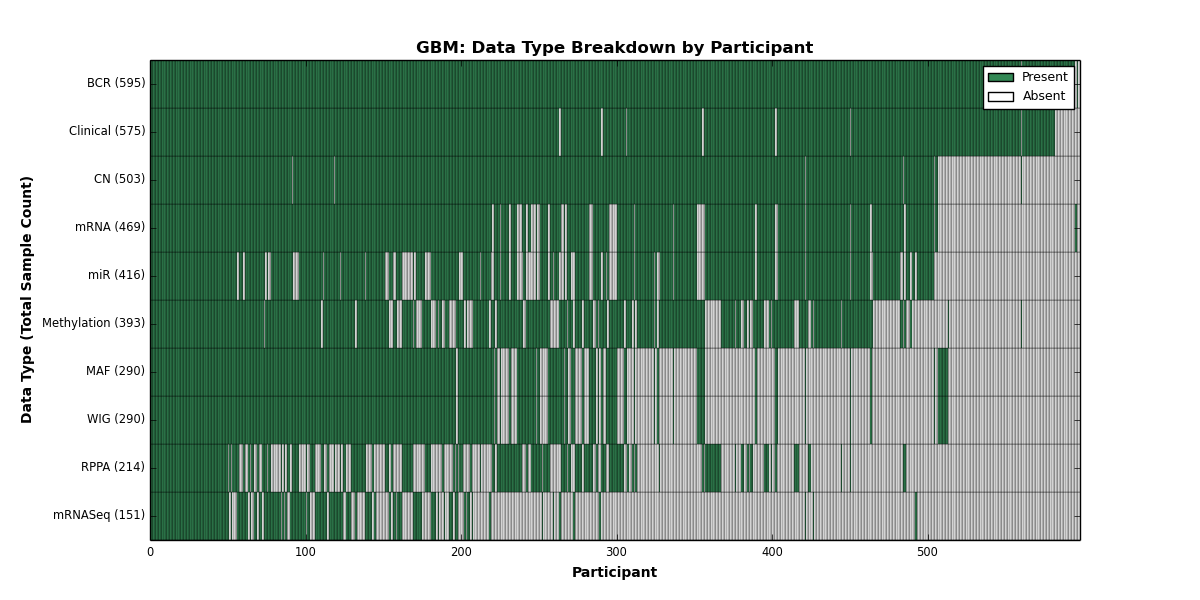
Figure 10. Get High-res Image This figure depicts the distribution of available data on a per participant basis.

Figure 11. Get High-res Image This figure depicts the distribution of available data on a per participant basis.
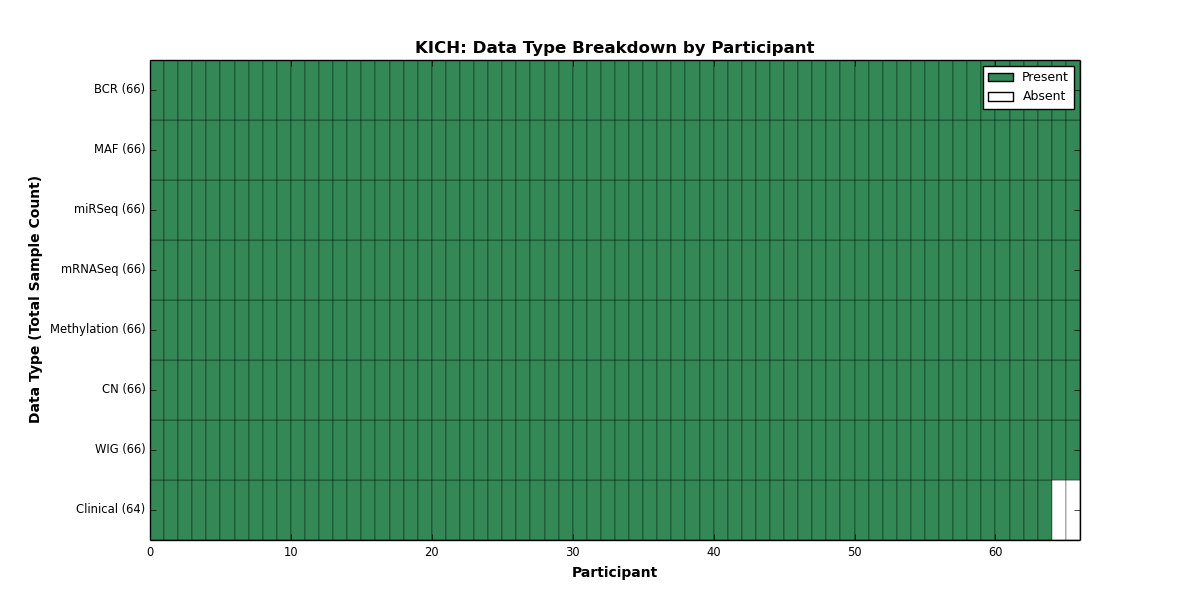
Figure 12. Get High-res Image This figure depicts the distribution of available data on a per participant basis.
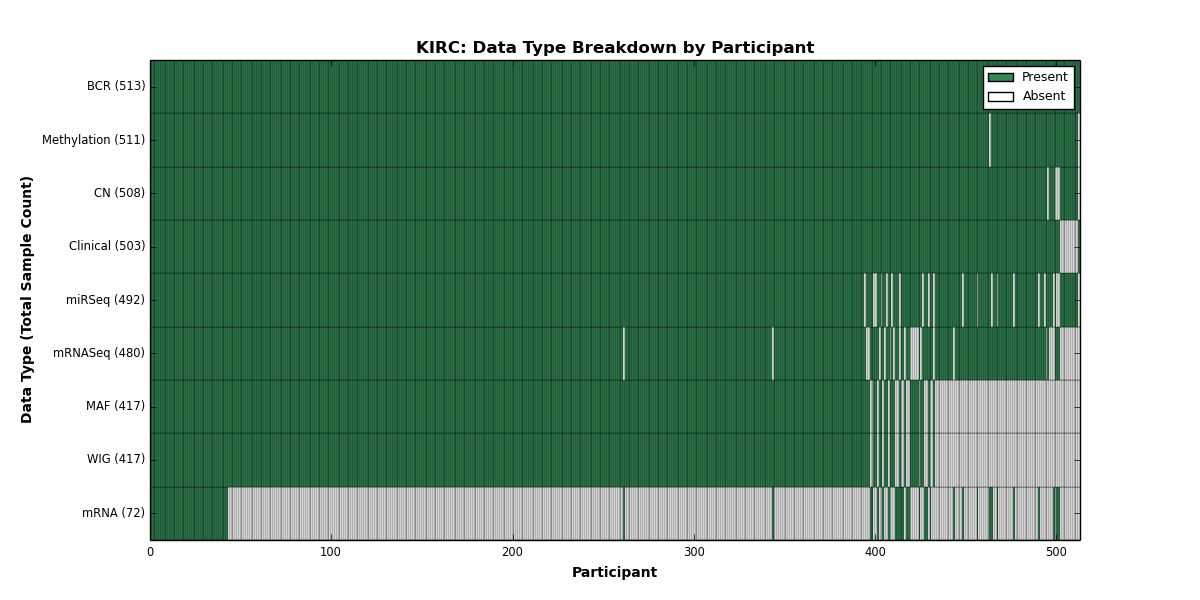
Figure 13. Get High-res Image This figure depicts the distribution of available data on a per participant basis.
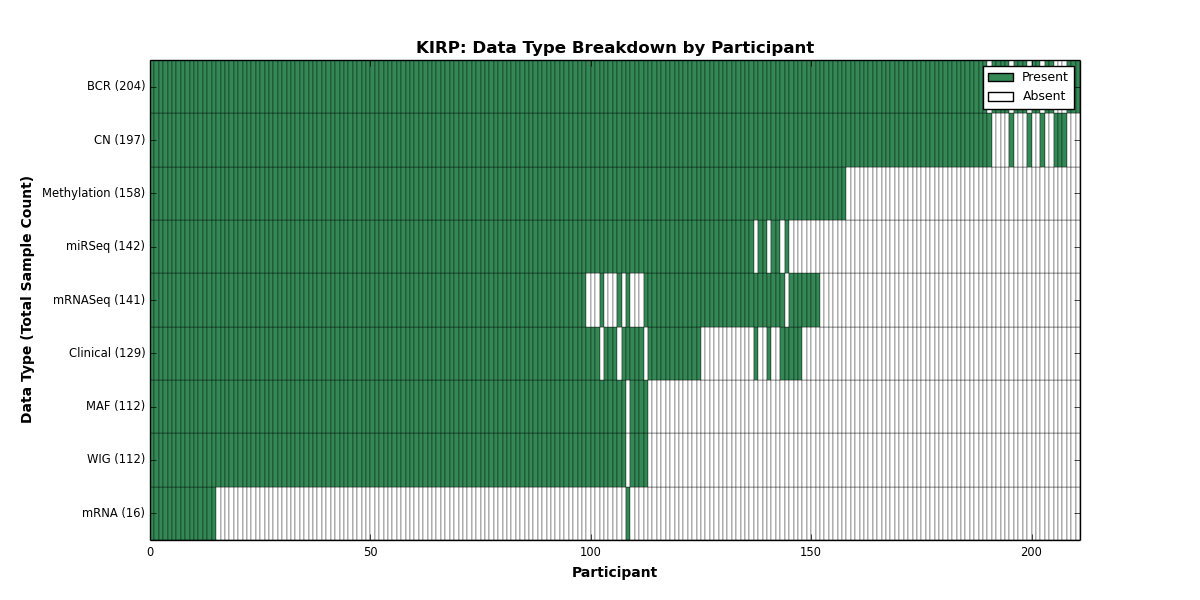
Figure 14. Get High-res Image This figure depicts the distribution of available data on a per participant basis.
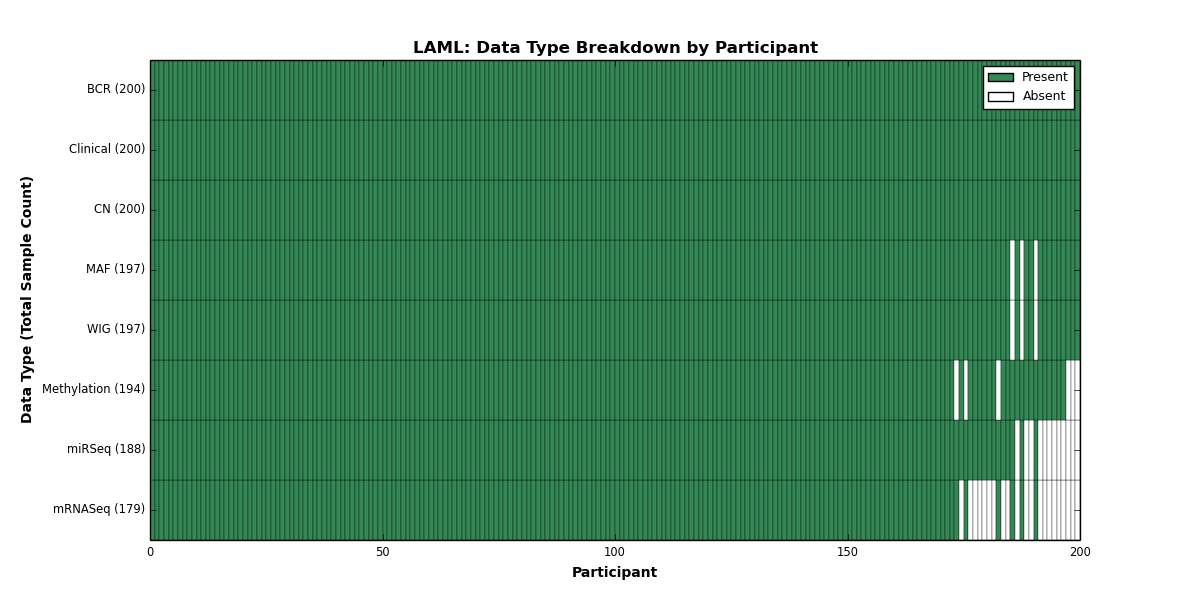
Figure 15. Get High-res Image This figure depicts the distribution of available data on a per participant basis.

Figure 16. Get High-res Image This figure depicts the distribution of available data on a per participant basis.

Figure 17. Get High-res Image This figure depicts the distribution of available data on a per participant basis.
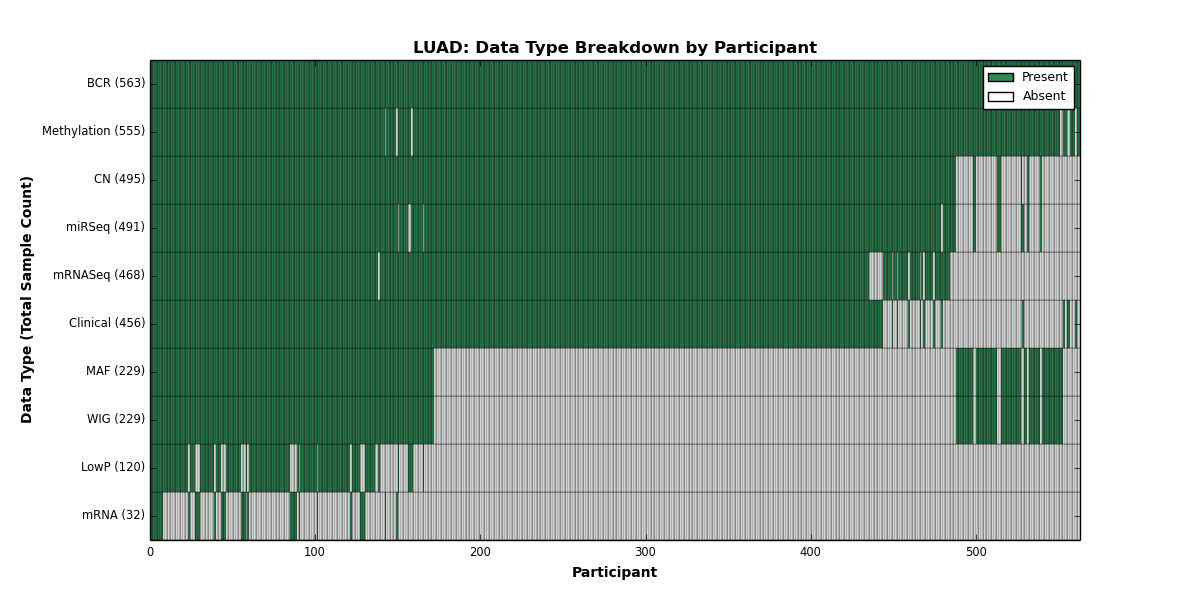
Figure 18. Get High-res Image This figure depicts the distribution of available data on a per participant basis.

Figure 19. Get High-res Image This figure depicts the distribution of available data on a per participant basis.
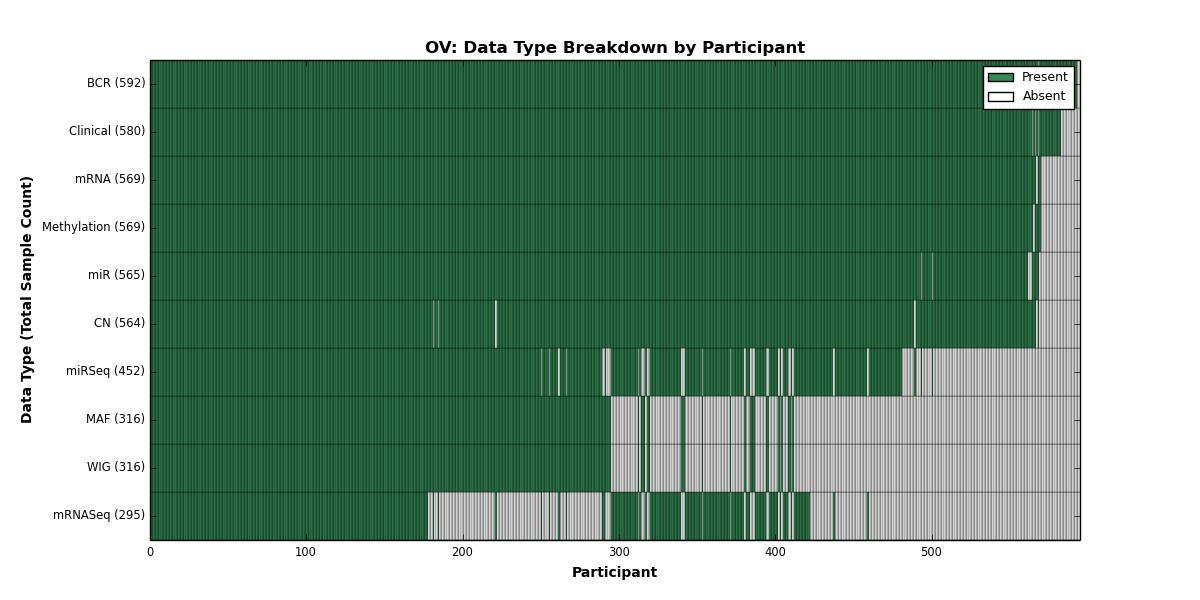
Figure 20. Get High-res Image This figure depicts the distribution of available data on a per participant basis.

Figure 21. Get High-res Image This figure depicts the distribution of available data on a per participant basis.
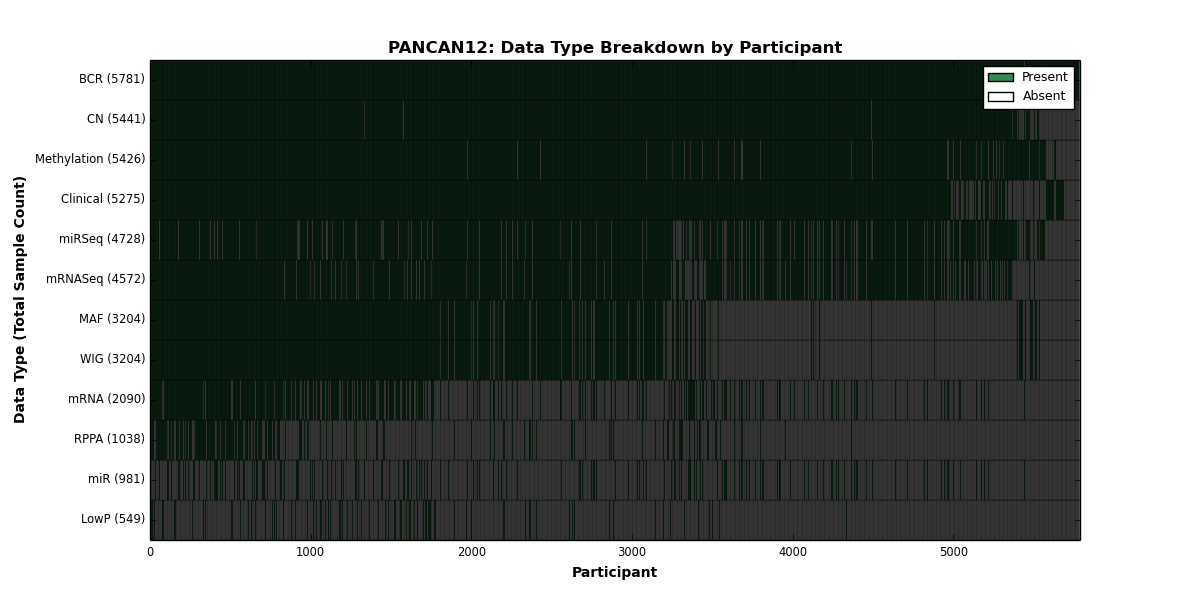
Figure 22. Get High-res Image This figure depicts the distribution of available data on a per participant basis.
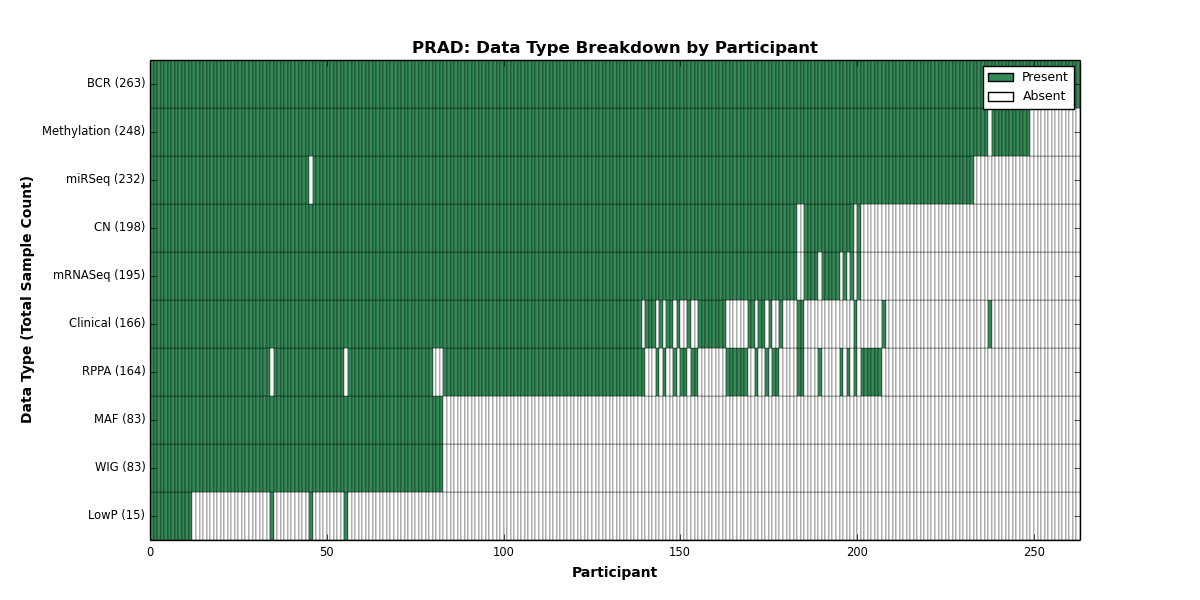
Figure 23. Get High-res Image This figure depicts the distribution of available data on a per participant basis.
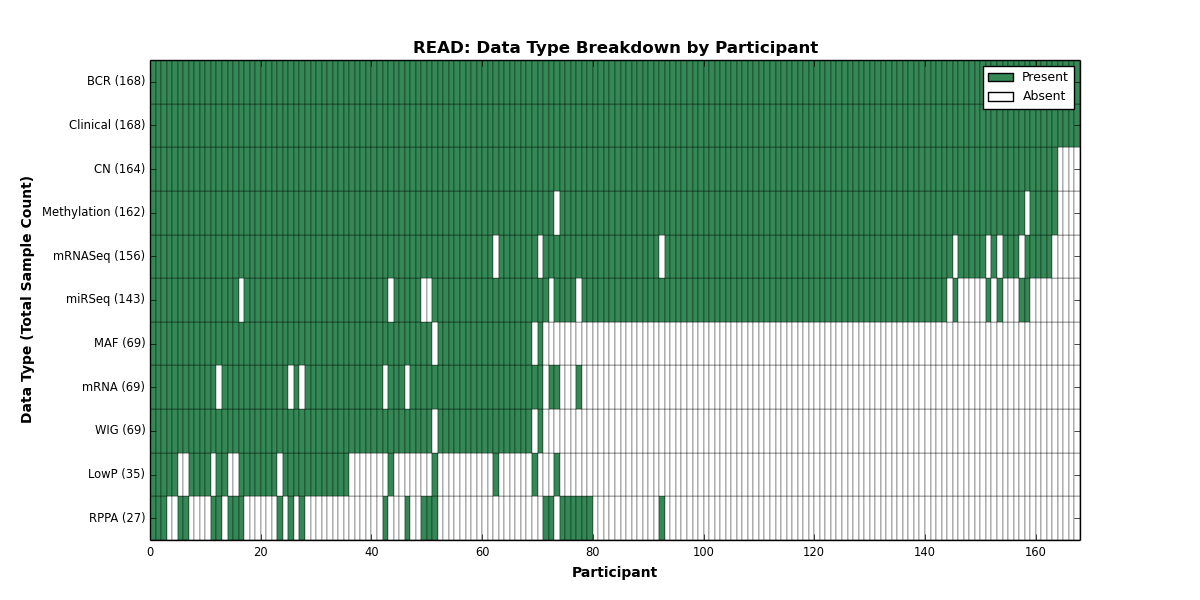
Figure 24. Get High-res Image This figure depicts the distribution of available data on a per participant basis.

Figure 25. Get High-res Image This figure depicts the distribution of available data on a per participant basis.
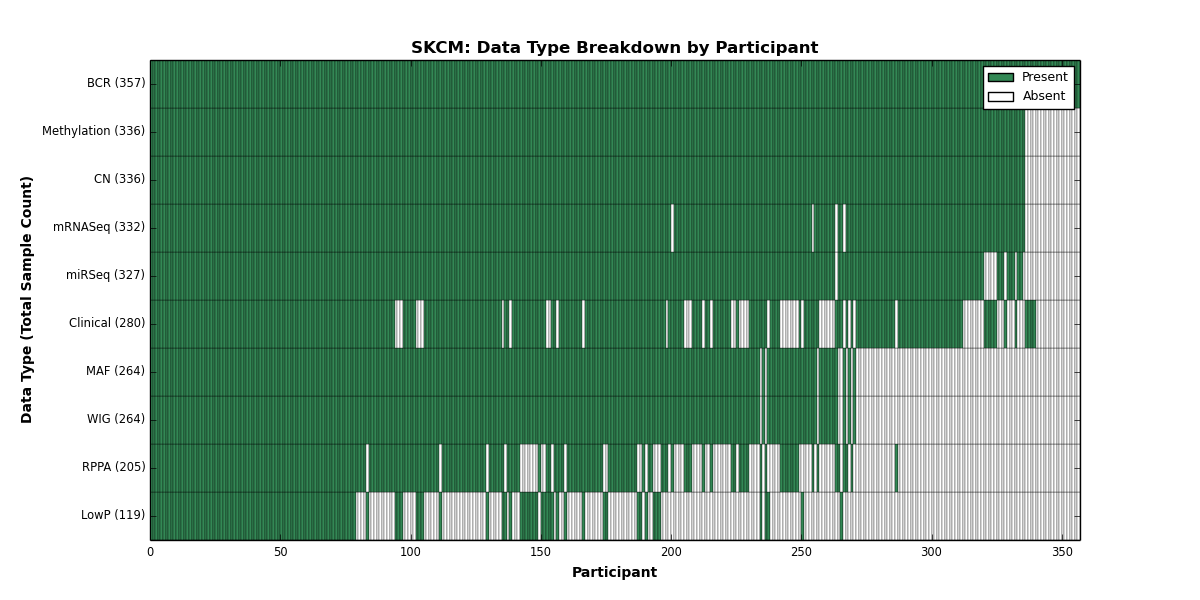
Figure 26. Get High-res Image This figure depicts the distribution of available data on a per participant basis.
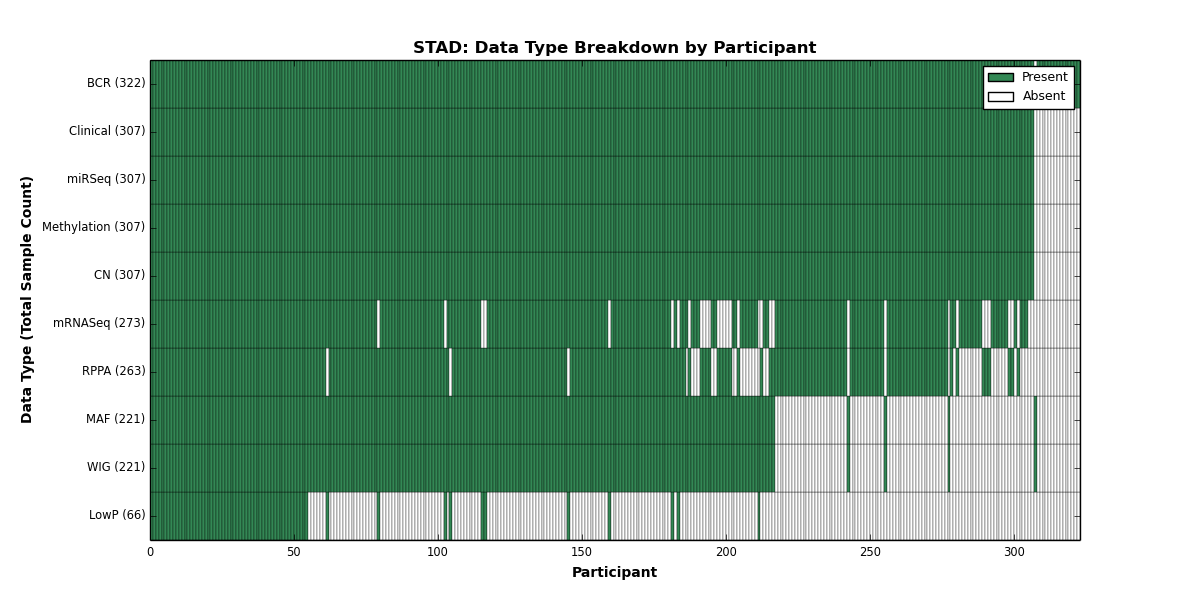
Figure 27. Get High-res Image This figure depicts the distribution of available data on a per participant basis.
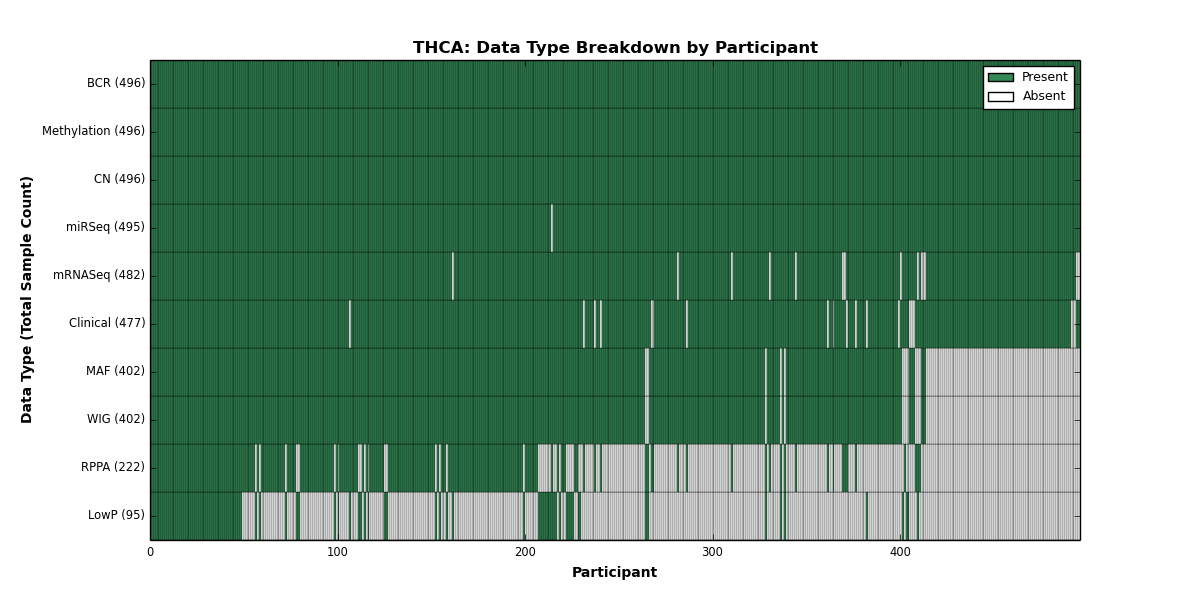
Figure 28. Get High-res Image This figure depicts the distribution of available data on a per participant basis.
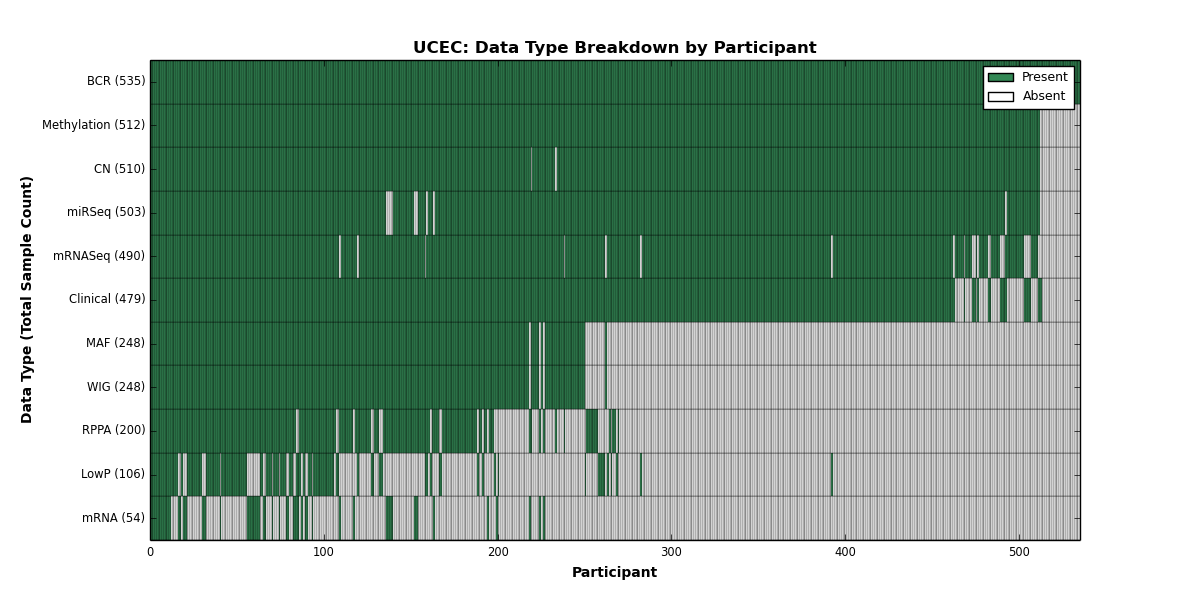
Figure 29. Get High-res Image This figure depicts the distribution of available data on a per participant basis.

For TCGA data, redaction is the removal of cases from the data prior to publication or release. Redacted cases are generally rare, but cases must be redacted when the TSS/BCR subject link is incorrect ("unknown patient identity"), or in the case of genotype mismatch, completely wrong cancer, or completely wrong organ/tissue. Redaction occurs regardless of a case's analyte characterization or DCC data deposition status.
Rescission is the removal of samples from the list of redactions. This happens if the reason for redaction is eventually cleared up. For clarity, rescinded redactions do not appear in this report.
Table 2. Get Full Table
| Barcode | UUID | Date | Type | Notes |
|---|---|---|---|---|
| TCGA-01-0629 | (none) | 09/02/2010 | GBM | [intgen.org]: Case was of non-ovarian origin |
| TCGA-01-0638 | (none) | 09/02/2010 | OV | [intgen.org]: Case was of non-ovarian origin |
| TCGA-02-0002 | (none) | 09/15/2010 | GBM | [intgen.org]: Genotype mismatch |
| TCGA-02-0117 | (none) | 09/15/2010 | GBM | [intgen.org]: Genotype mismatch |
| TCGA-02-2488 | (none) | 10/27/2011 | GBM | Note: Scheduled for shipment in B38 but was withdrawn due to SSTR mismatch. Case was uploaded, withdrawal was initiated after upload. Worked with DCC to remove data. |
| TCGA-06-0131 | d75996d6-9f02-4478-a4a1-dfa7ab41de77 | 06/17/2011 | GBM | [intgen.org]: Subject Withdrew Consent |
| TCGA-06-0748 | (none) | 10/27/2011 | GBM | Note: Scheduled for shipment in B8 but was withdrawn due to SSTR mismatch. Case was uploaded, withdrawal was initiated after upload. Worked with DCC to remove data. |
| TCGA-08-0384 | (none) | 11/22/2010 | GBM | IGC new redactions as of 11/10/2010 |
| TCGA-12-0653 | a7b55dae-c9b8-45c6-986f-fb1055f1c67b | 09/02/2010 | GBM | NA |
| TCGA-12-1601 | cc1459be-de8f-482e-9efe-65937db9dc45 | 09/02/2010 | GBM | NA |
| TCGA-13-1479 | (none) | 09/02/2010 | OV | [intgen.org]: Case was of non-ovarian origin |
| TCGA-14-0784 | fc52a226-9306-45d4-b608-4bdda831ad01 | 09/12/2011 | GBM | [intgen.org]: Genotype mismatch |
| TCGA-14-1036 | (none) | 10/27/2011 | GBM | Note: Scheduled for shipment in B38 but was withdrawn due to SSTR mismatch. Case was uploaded, withdrawal was initiated after upload. Worked with DCC to remove data |
| TCGA-14-1824 | (none) | 10/27/2011 | GBM | Note: Scheduled for shipment in B38 but was withdrawn due to SSTR mismatch. Case was uploaded, withdrawal was initiated after upload. Worked with DCC to remove data. |
| TCGA-24-0981 | 0c3ba4c0-d7a4-421a-af38-d5019ca45e06 | 10/28/2010 | OV | Duplicate Subject (with TCGA-04-1364) |
| TCGA-32-2498 | 0d5e5a6b-5113-43f2-836c-776207b21b56 | 12/19/2010 | GBM | NA |
| TCGA-33-4579 | 1169b8c3-e5ae-47a8-91db-0ce62a5958e2 | 06/17/2011 | LUSC | per Kenna, 6/7/2011 redact case since it does not seem to be a true primary (no definitive diagnosis of lung primary squamous). |
| TCGA-35-3621 | b3169af9-675d-4f3e-a806-1840f4fc0eff | 08/13/2013 | LUAD | Repeat of redaction for this patient to allow database to process |
| TCGA-35-3621 | b3169af9-675d-4f3e-a806-1840f4fc0eff | 09/14/2010 | LUAD | [intgen.org]: Genotype mismatch |
| TCGA-35-3621-01A-01W-0928-08 | a727b9e4-9361-4316-b306-01410dbb1be7 | 08/13/2013 | LUAD | Participant redacted for genotype mismatch. |
| TCGA-35-3621-01A-01W-0929-09 | 71fd8db4-d38f-4de6-b208-3f3d560781b7 | 08/13/2013 | LUAD | Participant had genotype mismatch |
| TCGA-35-3621-01A-01X-0930-08 | cef45577-addc-4ef7-85e0-f15e5305cfcb | 08/13/2013 | LUAD | Participant had genotype mismatch |
| TCGA-35-3621-01A-01X-0931-09 | 11d65680-a8be-471e-b1b9-8eda5f2bda4a | 08/13/2013 | LUAD | Participant had genotype mismatch |
| TCGA-35-3621-10A-01W-0928-08 | 1ed360b5-f03f-4cc2-a4dd-0d7b30fea6c1 | 08/13/2013 | LUAD | Participant had genotype mismatch |
| TCGA-35-3621-10A-01W-0929-09 | 4aacce08-2765-4c98-840c-7699593308cb | 08/13/2013 | LUAD | Participant had genotype mismatch |
| TCGA-35-3621-10A-01X-0930-08 | e2efc70f-7431-4a74-821d-2543b94fc2dc | 08/13/2013 | LUAD | Participant had genotype mismatch |
| TCGA-35-3621-10A-01X-0931-09 | 7dec3fdb-e049-42c0-b61c-321ab03e03fe | 08/13/2013 | LUAD | Participant had genotype mismatch |
| TCGA-66-2746 | 92c9813c-94d9-4dfb-af85-630e09ab4ff8 | 09/02/2010 | LUSC | [intgen.org]: Genotype mismatch |
| TCGA-66-2747 | 8555a382-6b13-45a3-88ed-f7a1b7f4f663 | 09/02/2010 | LUSC | [intgen.org]: Genotype mismatch |
| TCGA-66-2750 | 5c52af6d-8623-4ae9-a18c-b33ec7670db2 | 09/02/2010 | LUSC | [intgen.org]: Genotype mismatch |
| TCGA-66-2751 | c0d2291f-d67d-430e-bbbd-edca5ff2b380 | 09/02/2010 | LUSC | [intgen.org]: Genotype mismatch |
| TCGA-66-2752 | 89755df7-524b-4042-9566-a3ee7e521d3f | 09/02/2010 | LUSC | [intgen.org]: Genotype mismatch |
| TCGA-A6-2670 | 65bb7520-f055-43a8-b735-1152fa2c9e04 | 05/20/2011 | COAD | NA |
| TCGA-A7-A0DC | cb9f5e50-f49d-4899-8895-9367afcc1015 | 01/25/2011 | BRCA | DCIS and not invasive breast carcinoma from Jay Bowen/NWCH |
| TCGA-A7-A0DC | cb9f5e50-f49d-4899-8895-9367afcc1015 | 12/14/2010 | BRCA | Redaction due to incorrect type of tumor being submitted. |
| TCGA-AF-3912 | a4faf514-50af-43ed-b294-350ee0756250 | 05/20/2011 | READ | NA |
| TCGA-AJ-A4ZG-01A-11D-A27O-01 | (none) | 08/28/2013 | UCEC | NA |
| TCGA-AJ-A4ZG-01A-11D-A27P-09 | (none) | 08/28/2013 | UCEC | NA |
| TCGA-AJ-A4ZG-01A-11D-A27Y-05 | f25cde7d-4484-49d7-a70d-f903556b2f13 | 08/28/2013 | UCEC | NA |
| TCGA-AJ-A4ZG-01A-11R-A27R-13 | (none) | 08/28/2013 | UCEC | NA |
| TCGA-AJ-A4ZG-01A-11R-A27V-07 | 0bbd0820-73d0-4c6b-b707-43f201adfa31 | 08/28/2013 | UCEC | NA |
| TCGA-AJ-A4ZG-10A-01D-A27O-01 | (none) | 08/28/2013 | UCEC | NA |
| TCGA-AJ-A4ZG-10A-01D-A27P-09 | (none) | 08/28/2013 | UCEC | NA |
| TCGA-AJ-A4ZG-11A-11R-A27R-13 | (none) | 08/28/2013 | UCEC | NA |
| TCGA-AJ-A4ZG-11A-11R-A27V-07 | 21f6c172-64a1-4cab-8d61-a36fdf8870e2 | 08/28/2013 | UCEC | NA |
| TCGA-AN-A0FE | e4321d99-ed3b-4fc8-b016-2ff47d93a064 | 10/28/2010 | BRCA | Identical subject to TCGA-AN-A0FG |
| TCGA-AN-A0FG | 51d991f6-d998-420e-9357-48736c9ea0c1 | 10/28/2010 | BRCA | Identical subject to TCGA-AN-A0FE |
| TCGA-AR-A0U1-01A-11R-A114-13 | acd25a3b-1975-45a6-acdf-6433eecc05ae | 01/25/2013 | BRCA | RNA aliquot UUID: acd25a3b-1975-45a6-acdf-6433eecc05ae was found to have inconclusive identity (RNA only). There is no replacement aliquot for this UUID. |
| TCGA-AR-A0U1-01A-11R-A115-07 | 3450eaab-777a-46ab-9d13-8e0783c4a686 | 01/25/2013 | BRCA | RNA aliquot UUID: 3450eaab-777a-46ab-9d13-8e0783c4a686 was found to have inconclusive identity (RNA only). There is no replacement aliquot for this UUID. |
| TCGA-BH-A0B2 | 57a1604c-60b7-4b30-a75e-f70939532c5c | 01/25/2011 | BRCA | Normal tissue identity mismatch from Jay Bowen/NWCH |
| TCGA-BH-A0B2 | 57a1604c-60b7-4b30-a75e-f70939532c5c | 05/01/2013 | BRCA | This duplicates annot id 1233. It was issued to engage automatic nonviewability of related data. |
| TCGA-BH-A0HL-01A-11R-A034-07 | (none) | 01/21/2013 | BRCA | RNA aliquot UUID: 791dd985-420e-46a0-a770-ebaf0d2beaf1 was incorrectly assigned this barcode. The correct tcgaBarcode is TCGA-C4-A0F1-01A-11R-A034-07. |
| TCGA-BH-A0HL-01A-11R-A035-13 | (none) | 01/21/2013 | BRCA | NA |
| TCGA-BH-A0HN-01A-11R-A084-07 | (none) | 01/21/2013 | BRCA | RNA aliquot UUID: c0ccb685-0789-4559-9189-05b841173aff was incorrectly assigned this barcode. The correct tcgaBarcode is TCGA-C4-A0F7-01A-11R-A084-07. |
| TCGA-BH-A0HN-01A-11R-A085-13 | (none) | 01/21/2013 | BRCA | NA |
| TCGA-BR-4186 | 65834878-0e8d-4741-9e4c-2316105ad40d | 03/20/2012 | STAD | NA |
| TCGA-BR-4186 | 65834878-0e8d-4741-9e4c-2316105ad40d | 11/08/2012 | STAD | Site found that there was duplicate tissue in their biobank with another ID and different clinical data than that sent to TCGA. Case is being redacted but may be salvaged if the site can reconsile the correct clinical data to the tissue. |
| TCGA-BR-4190 | 282e979d-4ad9-4d42-8ffa-7487a94fa1f3 | 11/08/2012 | STAD | Site found that there was duplicate tissue in their biobank with another ID and different clinical data than that sent to TCGA. Case is being redacted but may be salvaged if the site can reconsile the correct clinical data to the tissue. |
| TCGA-BR-4194 | 2c650fe1-48b0-4f88-bc11-04096be48571 | 11/08/2012 | STAD | Site found that there was duplicate tissue in their biobank with another ID and different clinical data than that sent to TCGA. Case is being redacted but may be salvaged if the site can reconsile the correct clinical data to the tissue. |
| TCGA-BR-4195 | 7917234c-63be-4320-b7af-535381f99d99 | 11/08/2012 | STAD | Site found that there was duplicate tissue in their biobank with another ID and different clinical data than that sent to TCGA. Case is being redacted but may be salvaged if the site can reconsile the correct clinical data to the tissue. |
| TCGA-BR-4196 | c23e0eb6-e332-4a3b-9ffd-0d8f019f8ace | 11/18/2011 | STAD | NA |
| TCGA-BR-4197 | 4a27cbb6-754f-4a8d-8606-71af35d97279 | 11/18/2011 | STAD | NA |
| TCGA-BR-4199 | a73a0dc5-ac20-466b-ad11-d5cbbe9af2f7 | 11/08/2012 | STAD | Site found that there was duplicate tissue in their biobank with another ID and different clinical data than that sent to TCGA. Case is being redacted but may be salvaged if the site can reconsile the correct clinical data to the tissue. |
| TCGA-BR-4200 | b137efb4-35ca-4133-a2f6-490a684caa43 | 11/08/2012 | STAD | Site found that there was duplicate tissue in their biobank with another ID and different clinical data than that sent to TCGA. Case is being redacted but may be salvaged if the site can reconsile the correct clinical data to the tissue. |
| TCGA-BR-4205 | 65f14f48-13d8-4791-9335-92bb1599eb20 | 06/17/2011 | STAD | NA |
| TCGA-BR-4259 | 8430ea74-3ce9-4d7d-932c-e313f0069948 | 11/08/2012 | STAD | Site found that there was duplicate tissue in their biobank with another ID and different clinical data than that sent to TCGA. Case is being redacted but may be salvaged if the site can reconsile the correct clinical data to the tissue. |
| TCGA-BR-4260 | 4d26fcfe-4bed-4245-b30a-a95b48785fd9 | 11/18/2011 | STAD | NA |
| TCGA-BR-4261 | 5bd9831b-a70a-4519-823f-0580bc5c0c76 | 11/08/2012 | STAD | Site found that there was duplicate tissue in their biobank with another ID and different clinical data than that sent to TCGA. Case is being redacted but may be salvaged if the site can reconsile the correct clinical data to the tissue. |
| TCGA-BR-4263 | 826ae72b-aa6f-44ae-b683-83f6e8f708e6 | 11/18/2011 | STAD | NA |
| TCGA-BR-4264 | c036069a-a217-433b-a5b7-f5826ddbd7fa | 11/18/2011 | STAD | NA |
| TCGA-BR-4265 | 6e0e2a1f-bfc3-461a-8f66-fb74e6999785 | 11/08/2012 | STAD | Site found that there was duplicate tissue in their biobank with another ID and different clinical data than that sent to TCGA. Case is being redacted but may be salvaged if the site can reconsile the correct clinical data to the tissue. |
| TCGA-BR-4266 | 8d62ca4c-deca-46d3-8c97-c14ce34e1bf4 | 11/18/2011 | STAD | NA |
| TCGA-BR-4270 | 6d174bec-9574-42f1-b153-706d389aa36d | 11/18/2011 | STAD | NA |
| TCGA-BR-4271 | f9c581e5-7556-429f-81bd-373ede868f9c | 11/18/2011 | STAD | NA |
| TCGA-BR-4272 | 2e333a4c-9f9c-4bac-8451-95f1d84715c1 | 11/18/2011 | STAD | NA |
| TCGA-BR-4273 | 7cb06aa4-a199-4076-85c7-e30dc6adccdc | 11/18/2011 | STAD | NA |
| TCGA-BR-4274 | 684f9ddb-6820-4a46-a122-d4465c8ad3bd | 11/18/2011 | STAD | NA |
| TCGA-BR-4276 | cfe21d5f-c885-4907-b0ef-2420a91d8d30 | 11/18/2011 | STAD | NA |
| TCGA-BR-4277 | 9be0c7cd-1747-4d04-91ff-8021ffc240a9 | 11/08/2012 | STAD | Site found that there was duplicate tissue in their biobank with another ID and different clinical data than that sent to TCGA. Case is being redacted but may be salvaged if the site can reconsile the correct clinical data to the tissue. |
| TCGA-BR-4278 | cd83d7f5-4f30-4ac8-b3b8-f48577aae356 | 11/08/2012 | STAD | Site found that there was duplicate tissue in their biobank with another ID and different clinical data than that sent to TCGA. Case is being redacted but may be salvaged if the site can reconsile the correct clinical data to the tissue. |
| TCGA-BR-4281 | 5a2b30ea-e180-4228-b961-546828b50dcf | 11/08/2012 | STAD | Site found that there was duplicate tissue in their biobank with another ID and different clinical data than that sent to TCGA. Case is being redacted but may be salvaged if the site can reconsile the correct clinical data to the tissue. |
| TCGA-BR-4282 | f404c64a-8b6e-4799-9a24-0ce9f7afe3d9 | 06/17/2011 | STAD | NA |
| TCGA-BR-4283 | c55eee70-2967-4754-aabd-534bada30a3a | 03/20/2012 | STAD | Gender mismatch between clinical and genomic data. Site unable to provide/confirm correct data. |
| TCGA-BR-4283 | c55eee70-2967-4754-aabd-534bada30a3a | 11/08/2012 | STAD | Site found that there was duplicate tissue in their biobank with another ID and different clinical data than that sent to TCGA. Case is being redacted but may be salvaged if the site can reconsile the correct clinical data to the tissue. |
| TCGA-BR-4284 | 44486f21-3cea-4ced-a7f9-e2cb54129e21 | 11/08/2012 | STAD | Site found that there was duplicate tissue in their biobank with another ID and different clinical data than that sent to TCGA. Case is being redacted but may be salvaged if the site can reconsile the correct clinical data to the tissue. |
| TCGA-BR-4285 | 649bbb1c-0997-4b69-bb17-c327c558fe7f | 11/18/2011 | STAD | NA |
| TCGA-BR-4286 | 966eed09-6f55-45df-8e51-523442e85fa4 | 11/18/2011 | STAD | NA |
| TCGA-BR-4288 | 61d713f9-7763-4c17-9ca9-f5919cd2fb50 | 11/08/2012 | STAD | Site found that there was duplicate tissue in their biobank with another ID and different clinical data than that sent to TCGA. Case is being redacted but may be salvaged if the site can reconsile the correct clinical data to the tissue. |
| TCGA-BR-4291 | e4fee394-e1e2-4e67-8940-e7471e6c0bd8 | 11/08/2012 | STAD | Site found that there was duplicate tissue in their biobank with another ID and different clinical data than that sent to TCGA. Case is being redacted but may be salvaged if the site can reconsile the correct clinical data to the tissue. |
| TCGA-BR-4298 | 82c45707-2d84-4209-9376-76c2a67a7fbb | 11/08/2012 | STAD | Site found that there was duplicate tissue in their biobank with another ID and different clinical data than that sent to TCGA. Case is being redacted but may be salvaged if the site can reconsile the correct clinical data to the tissue. |
| TCGA-BR-4375 | 85b38301-c8b1-4d41-bc8f-3ac5e70287b8 | 11/08/2012 | STAD | Site found that there was duplicate tissue in their biobank with another ID and different clinical data than that sent to TCGA. Case is being redacted but may be salvaged if the site can reconsile the correct clinical data to the tissue. |
| TCGA-BR-4376 | ea5fc9b4-cafe-4649-b024-b33f904e2e3e | 11/08/2012 | STAD | Site found that there was duplicate tissue in their biobank with another ID and different clinical data than that sent to TCGA. Case is being redacted but may be salvaged if the site can reconsile the correct clinical data to the tissue. |
| TCGA-C4-A0EZ-01A-21R-A10U-07 | 737d212c-43cd-4925-a6a5-568964075a0d | 01/21/2013 | BLCA | RNA aliquot UUID: 737d212c-43cd-4925-a6a5-568964075a0d incorrectly assigned this barcode. The correct tcgaBarcode is TCGA-BH-A0HM-01A-11R-A10U-07. However, A0HM was redacted for unrelated reasons. The correct replacement aliquot for this UUID is tcgaBarcode: TCGA-C4-A0EZ-01A-21R-A24X-07, UUID: 8f482c29-37fe-400f-b178-224765a0c037. |
| TCGA-C4-A0EZ-01A-21R-A10V-13 | a979613c-5f14-47e9-a153-197552c289e6 | 01/21/2013 | BLCA | RNA aliquot UUID: a979613c-5f14-47e9-a153-197552c289e6 incorrectly assigned this barcode. The correct tcgaBarcode is TCGA-BH-A0HM-01A-11R-A10V-13. However, A0HM was redacted for unrelated reasons. The correct replacement aliquot for this UUID is tcgaBarcode: TCGA-C4-A0EZ-01A-21R-A24Y-13, UUID: 8f2b04bd-aa6d-4394-a654-5b8b03152d09. |
| TCGA-C4-A0F1-01A-11R-A10U-07 | (none) | 01/21/2013 | BLCA | RNA aliquot UUID: 1ee60bda-48df-4288-90cb-480fbfbc5d50 was incorrectly assigned this barcode. The correct tcgaBarcode is TCGA-BH-A0HL-01A-11R-A10U-07. |
| TCGA-C4-A0F1-01A-11R-A10V-13 | (none) | 01/21/2013 | BLCA | RNA aliquot UUID: 4819bd80-3cad-4071-9cbd-16eece970f4f was incorrectly assigned this barcode. The correct tcgaBarcode is TCGA-BH-A0HL-01A-11R-A10V-13. |
| TCGA-C4-A0F7-01A-11R-A10U-07 | (none) | 01/21/2013 | BLCA | RNA aliquot UUID: 6f0cf450-76f1-489d-9890-5093816c0680 was incorrectly assigned this barcode. The correct tcgaBarcode is TCGA-BH-A0HN-01A-11R-A10U-07. |
| TCGA-C4-A0F7-01A-11R-A10V-13 | (none) | 01/21/2013 | BLCA | RNA aliquot UUID: 2688aaae-389f-4fe9-a198-a95fa9b3ee9b incorrectly assigned to this barcode. The correct tcgaBarcode is TCGA-BH-A0HN-01A-11R-A10V-13. |
| TCGA-DD-A116-11A-11R-A130-13 | 6c8c920d-a2bf-4130-86ad-7ce83dc3fd1c | 01/25/2013 | LIHC | NA |
| TCGA-DD-A116-11A-11R-A131-07 | baf99a71-0ee9-4f3d-8f35-e350deea64de | 01/25/2013 | LIHC | NA |
| TCGA-DM-A286 | 224effcb-2d4b-429a-9247-42028ae577e5 | 06/25/2013 | COAD | See DCC JIRA ticket QUAL-243 |
| TCGA-DM-A286-01A-21-A17M-20 | 1d36958d-731f-4fe8-9f75-060e092f310f | 06/25/2013 | COAD | See DCC JIRA ticket QUAL-243 |
| TCGA-E2-A1IP | 826d8224-55fe-48c7-a5fe-ad81ac1ebba3 | 06/15/2011 | BRCA | Tumor and normal do not match |
| TCGA-E9-A1NC-01A-12R-A156-13 | fc5854f7-4865-468e-806b-7b1426b72889 | 01/25/2013 | BRCA | RNA aliquot UUID: fc5854f7-4865-468e-806b-7b1426b72889 was found to have inconclusive identity (RNA only). There is no replacement aliquot for this UUID. |
| TCGA-E9-A1NC-01A-12R-A157-07 | 60770e58-3b35-4222-97e9-d92e973f0203 | 01/25/2013 | BRCA | RNA aliquot UUID: 60770e58-3b35-4222-97e9-d92e973f0203 found to have inconclusive identity (RNA only). Replacement aliquot (TCGA-E9-A1NC-01A-21R-Full Aliquot ID will be updated when it ships) will ship to UNC ~1/30/2013. |
| TCGA-F4-6857 | e2fca12c-1a5a-4ba7-9233-d31560fc43be | 03/20/2012 | COAD | Gender mismatch between clinical and genomic data. Site unable to provide/confirm correct data. |
| TCGA-FQ-6551 | 965cfb59-cce1-4318-8772-0ba76c08457b | 04/23/2013 | PAAD | Redacted per ticket TCGA-1304. |
| TCGA-FQ-6552 | 38dae2b5-6346-46ec-adac-d4c76d2dc19f | 04/23/2013 | PAAD | This participant redacted per ticket TCGA-1304. |
| TCGA-FQ-6553 | f2db9877-ce60-42e4-8681-6734d3f8201e | 04/23/2013 | PRAD | This participant redacted per ticket TCGA-1304. |
| TCGA-FQ-6553 | f2db9877-ce60-42e4-8681-6734d3f8201e | 04/29/2013 | PAAD | Corrected from annot id 15982 (PAAD, from PRAD) |
| TCGA-FQ-6554 | 356323fb-27f9-41bb-bf35-f84342a800cc | 04/23/2013 | PAAD | This participant redacted per ticket TCGA-1304. |
| TCGA-FQ-6555 | ce8360cf-f670-4872-a1c9-0c5325a7699d | 04/23/2013 | PAAD | This participant redacted per ticket TCGA-1304. |
| TCGA-FQ-6558 | 0e1dfce0-771b-456f-9ef7-0ff0d59ac153 | 04/23/2013 | PAAD | This participant redacted per ticket TCGA-1304. |
| TCGA-FQ-6559 | c80f9e78-ba61-46ae-9062-9472281c19cb | 04/23/2013 | PAAD | This participant redacted per ticket TCGA-1304. |
| TCGA-O2-A5IC | ab95a0c5-c5ab-49a9-9d88-1f659bc76e36 | 09/05/2013 | LUSC | Duplicate Subject (with TCGA-60-2712) |
In many instances there is more than one aliquot for a given combination of individual, platform, and data type. However, only one aliquot may be ingested into Firehose. Therefore, a set of precedence rules are applied to select the most scientifically advantageous one among them. Two filters are applied to achieve this aim: an Analyte Replicate Filter and a Sort Replicate Filter.
The following precedence rules are applied when the aliquots have differing analytes. For RNA aliquots, T analytes are dropped in preference to H and R analytes, since T is the inferior extraction protocol. If H and R are encountered, H is the chosen analyte. This is somewhat arbitrary and subject to change, since it is not clear at present whether H or R is the better protocol. If there are multiple aliquots associated with the chosen RNA analyte, the aliquot with the later plate number is chosen. For DNA aliquots, D analytes (native DNA) are preferred over G, W, or X (whole-genome amplified) analytes, unless the G, W, or X analyte sample has a higher plate number.
The following precedence rules are applied when the analyte filter still produces more than one sample. The sort filter chooses the aliquot with the highest lexicographical sort value, to ensure that the barcode with the highest portion and/or plate number is selected when all other barcode fields are identical.
Table 3. Get Full Table Click on any filtered samples count to display a table detailing the filtered samples for the associated tumor type.
| Tumor Type | Filtered Samples Count |
|---|---|
| BLCA | 7 |
| BRCA | 35 |
| COAD | 450 |
| DLBC | 18 |
| GBM | 529 |
| HNSC | 18 |
| KIRC | 711 |
| KIRP | 133 |
| LGG | 8 |
| LUAD | 136 |
| LUSC | 165 |
| OV | 172 |
| READ | 58 |
| UCEC | 23 |
Table S1.
| Participant Id | DataType__Platform__Center__DataLevel__ProtocolName_Extension | Filter Reason | Removed Sample(s) | Chosen Sample |
|---|---|---|---|---|
| TCGA-BL-A13J | mirnaseq__illuminahiseq_mirnaseq__bcgsc_ca__Level_3__miR_isoform_expression__data | Analyte Replicate Filter | TCGA-BL-A13J-01A-11R-A10V-13 | TCGA-BL-A13J-01B-04R-A27D-13 |
| TCGA-BL-A0C8 | mirnaseq__illuminahiseq_mirnaseq__bcgsc_ca__Level_3__miR_isoform_expression__data | Analyte Replicate Filter | TCGA-BL-A0C8-01A-11R-A10V-13 | TCGA-BL-A0C8-01B-04R-A27D-13 |
| TCGA-BL-A13J | methylation__humanmethylation450__jhu_usc_edu__Level_3__within_bioassay_data_set_function__data | Analyte Replicate Filter | TCGA-BL-A13J-01A-11D-A10W-05 | TCGA-BL-A13J-01B-04D-A276-05 |
| TCGA-BL-A0C8 | methylation__humanmethylation450__jhu_usc_edu__Level_3__within_bioassay_data_set_function__data | Analyte Replicate Filter | TCGA-BL-A0C8-01A-11D-A10W-05 | TCGA-BL-A0C8-01B-04D-A276-05 |
| TCGA-BL-A13I | methylation__humanmethylation450__jhu_usc_edu__Level_3__within_bioassay_data_set_function__data | Analyte Replicate Filter | TCGA-BL-A13I-01A-11D-A13Z-05 | TCGA-BL-A13I-01B-04D-A276-05 |
| TCGA-BL-A13J | mirnaseq__illuminahiseq_mirnaseq__bcgsc_ca__Level_3__miR_gene_expression__data | Analyte Replicate Filter | TCGA-BL-A13J-01A-11R-A10V-13 | TCGA-BL-A13J-01B-04R-A27D-13 |
| TCGA-BL-A0C8 | mirnaseq__illuminahiseq_mirnaseq__bcgsc_ca__Level_3__miR_gene_expression__data | Analyte Replicate Filter | TCGA-BL-A0C8-01A-11R-A10V-13 | TCGA-BL-A0C8-01B-04R-A27D-13 |
Table S2.
| Participant Id | DataType__Platform__Center__DataLevel__ProtocolName_Extension | Filter Reason | Removed Sample(s) | Chosen Sample |
|---|---|---|---|---|
| TCGA-B6-A1KC | snp__genome_wide_snp_6__broad_mit_edu__Level_3__segmented_scna_minus_germline_cnv_hg19__seg | Analyte Replicate Filter | TCGA-B6-A1KC-01A-11D-A13J-01 | TCGA-B6-A1KC-01B-11D-A160-01 |
| TCGA-A7-A13D | mirnaseq__illuminahiseq_mirnaseq__bcgsc_ca__Level_3__miR_gene_expression__data | Analyte Replicate Filter | TCGA-A7-A13D-01A-13R-A12O-13 | TCGA-A7-A13D-01B-04R-A27D-13 |
| TCGA-A7-A13E | mirnaseq__illuminahiseq_mirnaseq__bcgsc_ca__Level_3__miR_gene_expression__data | Analyte Replicate Filter | TCGA-A7-A13E-01A-11R-A12O-13 | TCGA-A7-A13E-01B-06R-A27D-13 |
| TCGA-B6-A1KC | mirnaseq__illuminahiseq_mirnaseq__bcgsc_ca__Level_3__miR_gene_expression__data | Analyte Replicate Filter | TCGA-B6-A1KC-01A-11R-A13P-13 | TCGA-B6-A1KC-01B-11R-A156-13 |
| TCGA-A7-A26E | mirnaseq__illuminahiseq_mirnaseq__bcgsc_ca__Level_3__miR_gene_expression__data | Analyte Replicate Filter | TCGA-A7-A26E-01A-11R-A168-13 | TCGA-A7-A26E-01B-06R-A27D-13 |
| TCGA-A7-A26J | mirnaseq__illuminahiseq_mirnaseq__bcgsc_ca__Level_3__miR_gene_expression__data | Analyte Replicate Filter | TCGA-A7-A26J-01A-11R-A168-13 | TCGA-A7-A26J-01B-02R-A27D-13 |
| TCGA-A7-A13D | mirnaseq__illuminahiseq_mirnaseq__bcgsc_ca__Level_3__miR_isoform_expression__data | Analyte Replicate Filter | TCGA-A7-A13D-01A-13R-A12O-13 | TCGA-A7-A13D-01B-04R-A27D-13 |
| TCGA-A7-A13E | mirnaseq__illuminahiseq_mirnaseq__bcgsc_ca__Level_3__miR_isoform_expression__data | Analyte Replicate Filter | TCGA-A7-A13E-01A-11R-A12O-13 | TCGA-A7-A13E-01B-06R-A27D-13 |
| TCGA-B6-A1KC | mirnaseq__illuminahiseq_mirnaseq__bcgsc_ca__Level_3__miR_isoform_expression__data | Analyte Replicate Filter | TCGA-B6-A1KC-01A-11R-A13P-13 | TCGA-B6-A1KC-01B-11R-A156-13 |
| TCGA-A7-A26E | mirnaseq__illuminahiseq_mirnaseq__bcgsc_ca__Level_3__miR_isoform_expression__data | Analyte Replicate Filter | TCGA-A7-A26E-01A-11R-A168-13 | TCGA-A7-A26E-01B-06R-A27D-13 |
| TCGA-A7-A26J | mirnaseq__illuminahiseq_mirnaseq__bcgsc_ca__Level_3__miR_isoform_expression__data | Analyte Replicate Filter | TCGA-A7-A26J-01A-11R-A168-13 | TCGA-A7-A26J-01B-02R-A27D-13 |
| TCGA-B6-A1KC | snp__genome_wide_snp_6__broad_mit_edu__Level_2__tangent_copynumber__data | Analyte Replicate Filter | TCGA-B6-A1KC-01A-11D-A13J-01 | TCGA-B6-A1KC-01B-11D-A160-01 |
| TCGA-A7-A26E | snp__genome_wide_snp_6__broad_mit_edu__Level_2__raw_copynumber__data | Analyte Replicate Filter | TCGA-A7-A26E-01A-11D-A166-01 | TCGA-A7-A26E-01B-06D-A275-01 |
| TCGA-B6-A1KC | snp__genome_wide_snp_6__broad_mit_edu__Level_2__raw_copynumber__data | Analyte Replicate Filter | TCGA-B6-A1KC-01A-11D-A13J-01 | TCGA-B6-A1KC-01B-11D-A160-01 |
| TCGA-A7-A26J | snp__genome_wide_snp_6__broad_mit_edu__Level_2__raw_copynumber__data | Analyte Replicate Filter | TCGA-A7-A26J-01A-11D-A166-01 | TCGA-A7-A26J-01B-02D-A275-01 |
| TCGA-B6-A1KC | snp__genome_wide_snp_6__broad_mit_edu__Level_3__segmented_scna_minus_germline_cnv_hg18__seg | Analyte Replicate Filter | TCGA-B6-A1KC-01A-11D-A13J-01 | TCGA-B6-A1KC-01B-11D-A160-01 |
| TCGA-B6-A1KC | snp__genome_wide_snp_6__broad_mit_edu__Level_2__after_5NN_copy_number__data | Analyte Replicate Filter | TCGA-B6-A1KC-01A-11D-A13J-01 | TCGA-B6-A1KC-01B-11D-A160-01 |
| TCGA-B6-A1KC | snp__genome_wide_snp_6__broad_mit_edu__Level_2__no_outlier_copy_number__data | Analyte Replicate Filter | TCGA-B6-A1KC-01A-11D-A13J-01 | TCGA-B6-A1KC-01B-11D-A160-01 |
| TCGA-B6-A1KC | snp__genome_wide_snp_6__broad_mit_edu__Level_2__copynumber_byallele__data | Analyte Replicate Filter | TCGA-B6-A1KC-01A-11D-A13J-01 | TCGA-B6-A1KC-01B-11D-A160-01 |
| TCGA-A7-A26E | snp__genome_wide_snp_6__broad_mit_edu__Level_2__byallele_copynumber__data | Analyte Replicate Filter | TCGA-A7-A26E-01A-11D-A166-01 | TCGA-A7-A26E-01B-06D-A275-01 |
| TCGA-B6-A1KC | snp__genome_wide_snp_6__broad_mit_edu__Level_2__byallele_copynumber__data | Analyte Replicate Filter | TCGA-B6-A1KC-01A-11D-A13J-01 | TCGA-B6-A1KC-01B-11D-A160-01 |
| TCGA-A7-A26J | snp__genome_wide_snp_6__broad_mit_edu__Level_2__byallele_copynumber__data | Analyte Replicate Filter | TCGA-A7-A26J-01A-11D-A166-01 | TCGA-A7-A26J-01B-02D-A275-01 |
| TCGA-A7-A26E | snp__genome_wide_snp_6__broad_mit_edu__Level_2__birdseed_genotype__birdseed | Analyte Replicate Filter | TCGA-A7-A26E-01A-11D-A166-01 | TCGA-A7-A26E-01B-06D-A275-01 |
| TCGA-B6-A1KC | snp__genome_wide_snp_6__broad_mit_edu__Level_2__birdseed_genotype__birdseed | Analyte Replicate Filter | TCGA-B6-A1KC-01A-11D-A13J-01 | TCGA-B6-A1KC-01B-11D-A160-01 |
| TCGA-A7-A26J | snp__genome_wide_snp_6__broad_mit_edu__Level_2__birdseed_genotype__birdseed | Analyte Replicate Filter | TCGA-A7-A26J-01A-11D-A166-01 | TCGA-A7-A26J-01B-02D-A275-01 |
| TCGA-B6-A1KC | snp__genome_wide_snp_6__broad_mit_edu__Level_2__copy_number__data | Analyte Replicate Filter | TCGA-B6-A1KC-01A-11D-A13J-01 | TCGA-B6-A1KC-01B-11D-A160-01 |
| TCGA-A7-A26E | methylation__humanmethylation450__jhu_usc_edu__Level_3__within_bioassay_data_set_function__data | Analyte Replicate Filter | TCGA-A7-A26E-01A-11D-A16A-05 | TCGA-A7-A26E-01B-06D-A27B-05 |
| TCGA-B6-A1KC | methylation__humanmethylation450__jhu_usc_edu__Level_3__within_bioassay_data_set_function__data | Analyte Replicate Filter | TCGA-B6-A1KC-01A-11D-A13K-05 | TCGA-B6-A1KC-01B-11D-A161-05 |
| TCGA-A7-A26J | methylation__humanmethylation450__jhu_usc_edu__Level_3__within_bioassay_data_set_function__data | Analyte Replicate Filter | TCGA-A7-A26J-01A-11D-A16A-05 | TCGA-A7-A26J-01B-02D-A27B-05 |
| TCGA-A7-A26E | snp__genome_wide_snp_6__broad_mit_edu__Level_2__invariantset_medianpolish__data | Analyte Replicate Filter | TCGA-A7-A26E-01A-11D-A166-01 | TCGA-A7-A26E-01B-06D-A275-01 |
| TCGA-B6-A1KC | snp__genome_wide_snp_6__broad_mit_edu__Level_2__invariantset_medianpolish__data | Analyte Replicate Filter | TCGA-B6-A1KC-01A-11D-A13J-01 | TCGA-B6-A1KC-01B-11D-A160-01 |
| TCGA-A7-A26J | snp__genome_wide_snp_6__broad_mit_edu__Level_2__invariantset_medianpolish__data | Analyte Replicate Filter | TCGA-A7-A26J-01A-11D-A166-01 | TCGA-A7-A26J-01B-02D-A275-01 |
| TCGA-B6-A1KC | snp__genome_wide_snp_6__broad_mit_edu__Level_3__segmented_scna_hg18__seg | Analyte Replicate Filter | TCGA-B6-A1KC-01A-11D-A13J-01 | TCGA-B6-A1KC-01B-11D-A160-01 |
| TCGA-B6-A1KC | snp__genome_wide_snp_6__broad_mit_edu__Level_3__segmented_scna_hg19__seg | Analyte Replicate Filter | TCGA-B6-A1KC-01A-11D-A13J-01 | TCGA-B6-A1KC-01B-11D-A160-01 |
| TCGA-B6-A1KC | snp__genome_wide_snp_6__broad_mit_edu__Level_1__image_acquisition__data | Analyte Replicate Filter | TCGA-B6-A1KC-01A-11D-A13J-01 | TCGA-B6-A1KC-01B-11D-A160-01 |
Table S3.
| Participant Id | DataType__Platform__Center__DataLevel__ProtocolName_Extension | Filter Reason | Removed Sample(s) | Chosen Sample |
|---|---|---|---|---|
| TCGA-A6-2682 | snp__genome_wide_snp_6__broad_mit_edu__Level_2__tangent_copynumber__data | Analyte Replicate Filter | TCGA-A6-2682-01A-01D-1406-01 | TCGA-A6-2682-01A-01D-1549-01 |
| TCGA-AA-3522 | snp__genome_wide_snp_6__broad_mit_edu__Level_2__tangent_copynumber__data | Analyte Replicate Filter | TCGA-AA-3522-01A-01D-0819-01 | TCGA-AA-3522-01A-01D-1549-01 |
| TCGA-AA-3521 | snp__genome_wide_snp_6__broad_mit_edu__Level_2__tangent_copynumber__data | Analyte Replicate Filter | TCGA-AA-3521-01A-01D-0819-01 | TCGA-AA-3521-01A-01D-1549-01 |
| TCGA-A6-2685 | snp__genome_wide_snp_6__broad_mit_edu__Level_2__tangent_copynumber__data | Analyte Replicate Filter | TCGA-A6-2685-01A-01D-1406-01 | TCGA-A6-2685-01A-01D-1549-01 |
| TCGA-A6-2672 | snp__genome_wide_snp_6__broad_mit_edu__Level_2__tangent_copynumber__data | Analyte Replicate Filter | TCGA-A6-2672-01A-01D-0824-01 | TCGA-A6-2672-01A-01D-1549-01 |
| TCGA-A6-4107 | snp__genome_wide_snp_6__broad_mit_edu__Level_2__tangent_copynumber__data | Analyte Replicate Filter | TCGA-A6-4107-01A-02D-1406-01 | TCGA-A6-4107-01A-02D-1549-01 |
| TCGA-AA-3532 | snp__genome_wide_snp_6__broad_mit_edu__Level_2__tangent_copynumber__data | Analyte Replicate Filter | TCGA-AA-3532-01A-01D-0819-01 | TCGA-AA-3532-01A-01D-1549-01 |
| TCGA-A6-2678 | snp__genome_wide_snp_6__broad_mit_edu__Level_2__tangent_copynumber__data | Analyte Replicate Filter | TCGA-A6-2678-01A-01D-0819-01 | TCGA-A6-2678-01A-01D-1549-01 |
| TCGA-AA-3534 | snp__genome_wide_snp_6__broad_mit_edu__Level_2__tangent_copynumber__data | Analyte Replicate Filter | TCGA-AA-3534-01A-01D-0819-01 | TCGA-AA-3534-01A-01D-1549-01 |
| TCGA-AA-3526 | snp__genome_wide_snp_6__broad_mit_edu__Level_2__tangent_copynumber__data | Analyte Replicate Filter | TCGA-AA-3526-01A-02D-0819-01 | TCGA-AA-3526-01A-02D-1549-01 |
| TCGA-A6-2681 | snp__genome_wide_snp_6__broad_mit_edu__Level_2__tangent_copynumber__data | Analyte Replicate Filter | TCGA-A6-2681-01A-01D-1406-01 | TCGA-A6-2681-01A-01D-1549-01 |
| TCGA-A6-2679 | snp__genome_wide_snp_6__broad_mit_edu__Level_2__tangent_copynumber__data | Analyte Replicate Filter | TCGA-A6-2679-01A-02D-1406-01 | TCGA-A6-2679-01A-02D-1549-01 |
| TCGA-A6-2680 | snp__genome_wide_snp_6__broad_mit_edu__Level_2__tangent_copynumber__data | Analyte Replicate Filter | TCGA-A6-2680-01A-01D-1406-01 | TCGA-A6-2680-01A-01D-1549-01 |
| TCGA-A6-2686 | snp__genome_wide_snp_6__broad_mit_edu__Level_2__tangent_copynumber__data | Analyte Replicate Filter | TCGA-A6-2686-01A-01D-1406-01 | TCGA-A6-2686-01A-01D-1549-01 |
| TCGA-AA-3519 | snp__genome_wide_snp_6__broad_mit_edu__Level_2__tangent_copynumber__data | Analyte Replicate Filter | TCGA-AA-3519-01A-02D-0819-01 | TCGA-AA-3519-01A-02D-1549-01 |
| TCGA-AA-3525 | snp__genome_wide_snp_6__broad_mit_edu__Level_2__tangent_copynumber__data | Analyte Replicate Filter | TCGA-AA-3525-01A-02D-0824-01 | TCGA-AA-3525-01A-02D-1549-01 |
| TCGA-AA-3520 | snp__genome_wide_snp_6__broad_mit_edu__Level_2__tangent_copynumber__data | Analyte Replicate Filter | TCGA-AA-3520-01A-01D-0819-01 | TCGA-AA-3520-01A-01D-1549-01 |
| TCGA-A6-2677 | snp__genome_wide_snp_6__broad_mit_edu__Level_2__tangent_copynumber__data | Analyte Replicate Filter | TCGA-A6-2677-01A-01D-0819-01 | TCGA-A6-2677-01A-01D-1549-01 |
| TCGA-A6-2676 | snp__genome_wide_snp_6__broad_mit_edu__Level_2__tangent_copynumber__data | Analyte Replicate Filter | TCGA-A6-2676-01A-01D-0824-01 | TCGA-A6-2676-01A-01D-1549-01 |
| TCGA-A6-2684 | snp__genome_wide_snp_6__broad_mit_edu__Level_2__tangent_copynumber__data | Analyte Replicate Filter | TCGA-A6-2684-01A-01D-1406-01 | TCGA-A6-2684-01A-01D-1549-01 |
| TCGA-AA-3529 | snp__genome_wide_snp_6__broad_mit_edu__Level_2__tangent_copynumber__data | Analyte Replicate Filter | TCGA-AA-3529-01A-02D-0819-01 | TCGA-AA-3529-01A-02D-1549-01 |
| TCGA-AA-3527 | snp__genome_wide_snp_6__broad_mit_edu__Level_2__tangent_copynumber__data | Analyte Replicate Filter | TCGA-AA-3527-01A-01D-0819-01 | TCGA-AA-3527-01A-01D-1549-01 |
| TCGA-AA-3524 | snp__genome_wide_snp_6__broad_mit_edu__Level_2__tangent_copynumber__data | Analyte Replicate Filter | TCGA-AA-3524-01A-02D-0819-01 | TCGA-AA-3524-01A-02D-1549-01 |
| TCGA-AA-3531 | snp__genome_wide_snp_6__broad_mit_edu__Level_2__tangent_copynumber__data | Analyte Replicate Filter | TCGA-AA-3531-01A-01D-0819-01 | TCGA-AA-3531-01A-01D-1549-01 |
| TCGA-A6-2671 | snp__genome_wide_snp_6__broad_mit_edu__Level_2__tangent_copynumber__data | Analyte Replicate Filter | TCGA-A6-2671-01A-01D-1406-01 | TCGA-A6-2671-01A-01D-1549-01 |
| TCGA-AA-3518 | snp__genome_wide_snp_6__broad_mit_edu__Level_2__tangent_copynumber__data | Analyte Replicate Filter | TCGA-AA-3518-01A-02D-0824-01 | TCGA-AA-3518-01A-02D-1549-01 |
| TCGA-AA-3517 | snp__genome_wide_snp_6__broad_mit_edu__Level_2__tangent_copynumber__data | Analyte Replicate Filter | TCGA-AA-3517-01A-01D-0819-01 | TCGA-AA-3517-01A-01D-1549-01 |
| TCGA-AA-3530 | snp__genome_wide_snp_6__broad_mit_edu__Level_2__tangent_copynumber__data | Analyte Replicate Filter | TCGA-AA-3530-01A-01D-1018-01 | TCGA-AA-3530-01A-01D-1549-01 |
| TCGA-A6-2674 | snp__genome_wide_snp_6__broad_mit_edu__Level_2__tangent_copynumber__data | Analyte Replicate Filter | TCGA-A6-2674-01A-02D-0819-01 | TCGA-A6-2674-01A-02D-1549-01 |
| TCGA-AA-3516 | snp__genome_wide_snp_6__broad_mit_edu__Level_2__tangent_copynumber__data | Analyte Replicate Filter | TCGA-AA-3516-01A-02D-0824-01 | TCGA-AA-3516-01A-02D-1549-01 |
| TCGA-AA-3514 | snp__genome_wide_snp_6__broad_mit_edu__Level_2__tangent_copynumber__data | Analyte Replicate Filter | TCGA-AA-3514-01A-02D-0819-01 | TCGA-AA-3514-01A-02D-1549-01 |
| TCGA-A6-2683 | snp__genome_wide_snp_6__broad_mit_edu__Level_2__tangent_copynumber__data | Analyte Replicate Filter | TCGA-A6-2683-01A-01D-0819-01 | TCGA-A6-2683-01A-01D-1549-01 |
| TCGA-A6-2682 | snp__genome_wide_snp_6__broad_mit_edu__Level_2__copy_number__data | Analyte Replicate Filter | TCGA-A6-2682-01A-01D-1406-01 | TCGA-A6-2682-01A-01D-1549-01 |
| TCGA-AA-3521 | snp__genome_wide_snp_6__broad_mit_edu__Level_2__copy_number__data | Analyte Replicate Filter | TCGA-AA-3521-01A-01D-0819-01 | TCGA-AA-3521-01A-01D-1549-01 |
| TCGA-AA-3522 | snp__genome_wide_snp_6__broad_mit_edu__Level_2__copy_number__data | Analyte Replicate Filter | TCGA-AA-3522-01A-01D-0819-01 | TCGA-AA-3522-01A-01D-1549-01 |
| TCGA-A6-4107 | snp__genome_wide_snp_6__broad_mit_edu__Level_2__copy_number__data | Analyte Replicate Filter | TCGA-A6-4107-01A-02D-1406-01 | TCGA-A6-4107-01A-02D-1549-01 |
| TCGA-A6-2672 | snp__genome_wide_snp_6__broad_mit_edu__Level_2__copy_number__data | Analyte Replicate Filter | TCGA-A6-2672-01A-01D-0824-01 | TCGA-A6-2672-01A-01D-1549-01 |
| TCGA-AA-3532 | snp__genome_wide_snp_6__broad_mit_edu__Level_2__copy_number__data | Analyte Replicate Filter | TCGA-AA-3532-01A-01D-0819-01 | TCGA-AA-3532-01A-01D-1549-01 |
| TCGA-A6-2678 | snp__genome_wide_snp_6__broad_mit_edu__Level_2__copy_number__data | Analyte Replicate Filter | TCGA-A6-2678-01A-01D-0819-01 | TCGA-A6-2678-01A-01D-1549-01 |
| TCGA-AA-3534 | snp__genome_wide_snp_6__broad_mit_edu__Level_2__copy_number__data | Analyte Replicate Filter | TCGA-AA-3534-01A-01D-0819-01 | TCGA-AA-3534-01A-01D-1549-01 |
| TCGA-AA-3526 | snp__genome_wide_snp_6__broad_mit_edu__Level_2__copy_number__data | Analyte Replicate Filter | TCGA-AA-3526-01A-02D-0819-01 | TCGA-AA-3526-01A-02D-1549-01 |
| TCGA-A6-2681 | snp__genome_wide_snp_6__broad_mit_edu__Level_2__copy_number__data | Analyte Replicate Filter | TCGA-A6-2681-01A-01D-1406-01 | TCGA-A6-2681-01A-01D-1549-01 |
| TCGA-A6-2679 | snp__genome_wide_snp_6__broad_mit_edu__Level_2__copy_number__data | Analyte Replicate Filter | TCGA-A6-2679-01A-02D-1406-01 | TCGA-A6-2679-01A-02D-1549-01 |
| TCGA-A6-2680 | snp__genome_wide_snp_6__broad_mit_edu__Level_2__copy_number__data | Analyte Replicate Filter | TCGA-A6-2680-01A-01D-1406-01 | TCGA-A6-2680-01A-01D-1549-01 |
| TCGA-A6-2686 | snp__genome_wide_snp_6__broad_mit_edu__Level_2__copy_number__data | Analyte Replicate Filter | TCGA-A6-2686-01A-01D-1406-01 | TCGA-A6-2686-01A-01D-1549-01 |
| TCGA-AA-3519 | snp__genome_wide_snp_6__broad_mit_edu__Level_2__copy_number__data | Analyte Replicate Filter | TCGA-AA-3519-01A-02D-0819-01 | TCGA-AA-3519-01A-02D-1549-01 |
| TCGA-AA-3525 | snp__genome_wide_snp_6__broad_mit_edu__Level_2__copy_number__data | Analyte Replicate Filter | TCGA-AA-3525-01A-02D-0824-01 | TCGA-AA-3525-01A-02D-1549-01 |
| TCGA-AA-3520 | snp__genome_wide_snp_6__broad_mit_edu__Level_2__copy_number__data | Analyte Replicate Filter | TCGA-AA-3520-01A-01D-0819-01 | TCGA-AA-3520-01A-01D-1549-01 |
| TCGA-A6-2677 | snp__genome_wide_snp_6__broad_mit_edu__Level_2__copy_number__data | Analyte Replicate Filter | TCGA-A6-2677-01A-01D-0819-01 | TCGA-A6-2677-01A-01D-1549-01 |
| TCGA-A6-2676 | snp__genome_wide_snp_6__broad_mit_edu__Level_2__copy_number__data | Analyte Replicate Filter | TCGA-A6-2676-01A-01D-0824-01 | TCGA-A6-2676-01A-01D-1549-01 |
| TCGA-A6-2684 | snp__genome_wide_snp_6__broad_mit_edu__Level_2__copy_number__data | Analyte Replicate Filter | TCGA-A6-2684-01A-01D-1406-01 | TCGA-A6-2684-01A-01D-1549-01 |
| TCGA-AA-3529 | snp__genome_wide_snp_6__broad_mit_edu__Level_2__copy_number__data | Analyte Replicate Filter | TCGA-AA-3529-01A-02D-0819-01 | TCGA-AA-3529-01A-02D-1549-01 |
| TCGA-AA-3527 | snp__genome_wide_snp_6__broad_mit_edu__Level_2__copy_number__data | Analyte Replicate Filter | TCGA-AA-3527-01A-01D-0819-01 | TCGA-AA-3527-01A-01D-1549-01 |
| TCGA-AA-3524 | snp__genome_wide_snp_6__broad_mit_edu__Level_2__copy_number__data | Analyte Replicate Filter | TCGA-AA-3524-01A-02D-0819-01 | TCGA-AA-3524-01A-02D-1549-01 |
| TCGA-AA-3531 | snp__genome_wide_snp_6__broad_mit_edu__Level_2__copy_number__data | Analyte Replicate Filter | TCGA-AA-3531-01A-01D-0819-01 | TCGA-AA-3531-01A-01D-1549-01 |
| TCGA-A6-2671 | snp__genome_wide_snp_6__broad_mit_edu__Level_2__copy_number__data | Analyte Replicate Filter | TCGA-A6-2671-01A-01D-1406-01 | TCGA-A6-2671-01A-01D-1549-01 |
| TCGA-AA-3518 | snp__genome_wide_snp_6__broad_mit_edu__Level_2__copy_number__data | Analyte Replicate Filter | TCGA-AA-3518-01A-02D-0824-01 | TCGA-AA-3518-01A-02D-1549-01 |
| TCGA-AA-3517 | snp__genome_wide_snp_6__broad_mit_edu__Level_2__copy_number__data | Analyte Replicate Filter | TCGA-AA-3517-01A-01D-0819-01 | TCGA-AA-3517-01A-01D-1549-01 |
| TCGA-AA-3530 | snp__genome_wide_snp_6__broad_mit_edu__Level_2__copy_number__data | Analyte Replicate Filter | TCGA-AA-3530-01A-01D-1018-01 | TCGA-AA-3530-01A-01D-1549-01 |
| TCGA-A6-2674 | snp__genome_wide_snp_6__broad_mit_edu__Level_2__copy_number__data | Analyte Replicate Filter | TCGA-A6-2674-01A-02D-0819-01 | TCGA-A6-2674-01A-02D-1549-01 |
| TCGA-AA-3516 | snp__genome_wide_snp_6__broad_mit_edu__Level_2__copy_number__data | Analyte Replicate Filter | TCGA-AA-3516-01A-02D-0824-01 | TCGA-AA-3516-01A-02D-1549-01 |
| TCGA-A6-2685 | snp__genome_wide_snp_6__broad_mit_edu__Level_2__copy_number__data | Analyte Replicate Filter | TCGA-A6-2685-01A-01D-1406-01 | TCGA-A6-2685-01A-01D-1549-01 |
| TCGA-AA-3514 | snp__genome_wide_snp_6__broad_mit_edu__Level_2__copy_number__data | Analyte Replicate Filter | TCGA-AA-3514-01A-02D-0819-01 | TCGA-AA-3514-01A-02D-1549-01 |
| TCGA-A6-2683 | snp__genome_wide_snp_6__broad_mit_edu__Level_2__copy_number__data | Analyte Replicate Filter | TCGA-A6-2683-01A-01D-0819-01 | TCGA-A6-2683-01A-01D-1549-01 |
| TCGA-A6-3810 | snp__genome_wide_snp_6__broad_mit_edu__Level_2__birdseed_genotype__birdseed | Analyte Replicate Filter | TCGA-A6-3810-01A-01D-1018-01 | TCGA-A6-3810-01B-04D-A274-01 |
| TCGA-A6-2682 | snp__genome_wide_snp_6__broad_mit_edu__Level_2__birdseed_genotype__birdseed | Analyte Replicate Filter | TCGA-A6-2682-01A-01D-1406-01 | TCGA-A6-2682-01A-01D-1549-01 |
| TCGA-AA-3522 | snp__genome_wide_snp_6__broad_mit_edu__Level_2__birdseed_genotype__birdseed | Analyte Replicate Filter | TCGA-AA-3522-01A-01D-0819-01 | TCGA-AA-3522-01A-01D-1549-01 |
| TCGA-AA-3521 | snp__genome_wide_snp_6__broad_mit_edu__Level_2__birdseed_genotype__birdseed | Analyte Replicate Filter | TCGA-AA-3521-01A-01D-0819-01 | TCGA-AA-3521-01A-01D-1549-01 |
| TCGA-A6-5656 | snp__genome_wide_snp_6__broad_mit_edu__Level_2__birdseed_genotype__birdseed | Analyte Replicate Filter | TCGA-A6-5656-01A-21D-1834-01 | TCGA-A6-5656-01B-02D-A274-01 |
| TCGA-A6-2685 | snp__genome_wide_snp_6__broad_mit_edu__Level_2__birdseed_genotype__birdseed | Analyte Replicate Filter | TCGA-A6-2685-01A-01D-1406-01 | TCGA-A6-2685-01A-01D-1549-01 |
| TCGA-A6-2672 | snp__genome_wide_snp_6__broad_mit_edu__Level_2__birdseed_genotype__birdseed | Analyte Replicate Filter | TCGA-A6-2672-01A-01D-0824-01 | TCGA-A6-2672-01A-01D-1549-01 |
| TCGA-A6-4107 | snp__genome_wide_snp_6__broad_mit_edu__Level_2__birdseed_genotype__birdseed | Analyte Replicate Filter | TCGA-A6-4107-01A-02D-1406-01 | TCGA-A6-4107-01A-02D-1549-01 |
| TCGA-AA-3532 | snp__genome_wide_snp_6__broad_mit_edu__Level_2__birdseed_genotype__birdseed | Analyte Replicate Filter | TCGA-AA-3532-01A-01D-0819-01 | TCGA-AA-3532-01A-01D-1549-01 |
| TCGA-A6-2678 | snp__genome_wide_snp_6__broad_mit_edu__Level_2__birdseed_genotype__birdseed | Analyte Replicate Filter | TCGA-A6-2678-01A-01D-0819-01 | TCGA-A6-2678-01A-01D-1549-01 |
| TCGA-AA-3534 | snp__genome_wide_snp_6__broad_mit_edu__Level_2__birdseed_genotype__birdseed | Analyte Replicate Filter | TCGA-AA-3534-01A-01D-0819-01 | TCGA-AA-3534-01A-01D-1549-01 |
| TCGA-A6-3809 | snp__genome_wide_snp_6__broad_mit_edu__Level_2__birdseed_genotype__birdseed | Analyte Replicate Filter | TCGA-A6-3809-01A-01D-1018-01 | TCGA-A6-3809-01B-04D-A274-01 |
| TCGA-A6-6650 | snp__genome_wide_snp_6__broad_mit_edu__Level_2__birdseed_genotype__birdseed | Analyte Replicate Filter | TCGA-A6-6650-01A-11D-1770-01 | TCGA-A6-6650-01B-02D-A274-01 |
| TCGA-A6-5659 | snp__genome_wide_snp_6__broad_mit_edu__Level_2__birdseed_genotype__birdseed | Analyte Replicate Filter | TCGA-A6-5659-01A-01D-1649-01 | TCGA-A6-5659-01B-04D-A274-01 |
| TCGA-AA-3526 | snp__genome_wide_snp_6__broad_mit_edu__Level_2__birdseed_genotype__birdseed | Analyte Replicate Filter | TCGA-AA-3526-01A-02D-0819-01 | TCGA-AA-3526-01A-02D-1549-01 |
| TCGA-A6-6781 | snp__genome_wide_snp_6__broad_mit_edu__Level_2__birdseed_genotype__birdseed | Analyte Replicate Filter | TCGA-A6-6781-01A-22D-1923-01 | TCGA-A6-6781-01B-06D-A274-01 |
| TCGA-A6-2681 | snp__genome_wide_snp_6__broad_mit_edu__Level_2__birdseed_genotype__birdseed | Analyte Replicate Filter | TCGA-A6-2681-01A-01D-1406-01 | TCGA-A6-2681-01A-01D-1549-01 |
| TCGA-A6-2679 | snp__genome_wide_snp_6__broad_mit_edu__Level_2__birdseed_genotype__birdseed | Analyte Replicate Filter | TCGA-A6-2679-01A-02D-1406-01 | TCGA-A6-2679-01A-02D-1549-01 |
| TCGA-A6-2680 | snp__genome_wide_snp_6__broad_mit_edu__Level_2__birdseed_genotype__birdseed | Analyte Replicate Filter | TCGA-A6-2680-01A-01D-1406-01 | TCGA-A6-2680-01A-01D-1549-01 |
| TCGA-A6-2686 | snp__genome_wide_snp_6__broad_mit_edu__Level_2__birdseed_genotype__birdseed | Analyte Replicate Filter | TCGA-A6-2686-01A-01D-1406-01 | TCGA-A6-2686-01A-01D-1549-01 |
| TCGA-AA-3519 | snp__genome_wide_snp_6__broad_mit_edu__Level_2__birdseed_genotype__birdseed | Analyte Replicate Filter | TCGA-AA-3519-01A-02D-0819-01 | TCGA-AA-3519-01A-02D-1549-01 |
| TCGA-AA-3525 | snp__genome_wide_snp_6__broad_mit_edu__Level_2__birdseed_genotype__birdseed | Analyte Replicate Filter | TCGA-AA-3525-01A-02D-0824-01 | TCGA-AA-3525-01A-02D-1549-01 |
| TCGA-AA-3520 | snp__genome_wide_snp_6__broad_mit_edu__Level_2__birdseed_genotype__birdseed | Analyte Replicate Filter | TCGA-AA-3520-01A-01D-0819-01 | TCGA-AA-3520-01A-01D-1549-01 |
| TCGA-A6-2677 | snp__genome_wide_snp_6__broad_mit_edu__Level_2__birdseed_genotype__birdseed | Analyte Replicate Filter | TCGA-A6-2677-01A-01D-1549-01,TCGA-A6-2677-01A-01D-0819-01 | TCGA-A6-2677-01B-02D-A274-01 |
| TCGA-A6-2676 | snp__genome_wide_snp_6__broad_mit_edu__Level_2__birdseed_genotype__birdseed | Analyte Replicate Filter | TCGA-A6-2676-01A-01D-0824-01 | TCGA-A6-2676-01A-01D-1549-01 |
| TCGA-A6-2684 | snp__genome_wide_snp_6__broad_mit_edu__Level_2__birdseed_genotype__birdseed | Analyte Replicate Filter | TCGA-A6-2684-01A-01D-1406-01,TCGA-A6-2684-01A-01D-1549-01 | TCGA-A6-2684-01C-08D-A274-01 |
| TCGA-AA-3529 | snp__genome_wide_snp_6__broad_mit_edu__Level_2__birdseed_genotype__birdseed | Analyte Replicate Filter | TCGA-AA-3529-01A-02D-0819-01 | TCGA-AA-3529-01A-02D-1549-01 |
| TCGA-AA-3527 | snp__genome_wide_snp_6__broad_mit_edu__Level_2__birdseed_genotype__birdseed | Analyte Replicate Filter | TCGA-AA-3527-01A-01D-0819-01 | TCGA-AA-3527-01A-01D-1549-01 |
| TCGA-AA-3524 | snp__genome_wide_snp_6__broad_mit_edu__Level_2__birdseed_genotype__birdseed | Analyte Replicate Filter | TCGA-AA-3524-01A-02D-0819-01 | TCGA-AA-3524-01A-02D-1549-01 |
| TCGA-AA-3531 | snp__genome_wide_snp_6__broad_mit_edu__Level_2__birdseed_genotype__birdseed | Analyte Replicate Filter | TCGA-AA-3531-01A-01D-0819-01 | TCGA-AA-3531-01A-01D-1549-01 |
| TCGA-A6-2671 | snp__genome_wide_snp_6__broad_mit_edu__Level_2__birdseed_genotype__birdseed | Analyte Replicate Filter | TCGA-A6-2671-01A-01D-1406-01 | TCGA-A6-2671-01A-01D-1549-01 |
| TCGA-AA-3518 | snp__genome_wide_snp_6__broad_mit_edu__Level_2__birdseed_genotype__birdseed | Analyte Replicate Filter | TCGA-AA-3518-01A-02D-0824-01 | TCGA-AA-3518-01A-02D-1549-01 |
| TCGA-AA-3517 | snp__genome_wide_snp_6__broad_mit_edu__Level_2__birdseed_genotype__birdseed | Analyte Replicate Filter | TCGA-AA-3517-01A-01D-0819-01 | TCGA-AA-3517-01A-01D-1549-01 |
| TCGA-AA-3530 | snp__genome_wide_snp_6__broad_mit_edu__Level_2__birdseed_genotype__birdseed | Analyte Replicate Filter | TCGA-AA-3530-01A-01D-1018-01 | TCGA-AA-3530-01A-01D-1549-01 |
| TCGA-A6-2674 | snp__genome_wide_snp_6__broad_mit_edu__Level_2__birdseed_genotype__birdseed | Analyte Replicate Filter | TCGA-A6-2674-01A-02D-0819-01 | TCGA-A6-2674-01A-02D-1549-01 |
| TCGA-AA-3516 | snp__genome_wide_snp_6__broad_mit_edu__Level_2__birdseed_genotype__birdseed | Analyte Replicate Filter | TCGA-AA-3516-01A-02D-0824-01 | TCGA-AA-3516-01A-02D-1549-01 |
| TCGA-AA-3514 | snp__genome_wide_snp_6__broad_mit_edu__Level_2__birdseed_genotype__birdseed | Analyte Replicate Filter | TCGA-AA-3514-01A-02D-0819-01 | TCGA-AA-3514-01A-02D-1549-01 |
| TCGA-A6-2683 | snp__genome_wide_snp_6__broad_mit_edu__Level_2__birdseed_genotype__birdseed | Analyte Replicate Filter | TCGA-A6-2683-01A-01D-0819-01 | TCGA-A6-2683-01A-01D-1549-01 |
| TCGA-A6-6780 | snp__genome_wide_snp_6__broad_mit_edu__Level_2__birdseed_genotype__birdseed | Analyte Replicate Filter | TCGA-A6-6780-01A-11D-1834-01 | TCGA-A6-6780-01B-04D-A274-01 |
| TCGA-A6-2682 | snp__genome_wide_snp_6__broad_mit_edu__Level_2__after_5NN_copy_number__data | Analyte Replicate Filter | TCGA-A6-2682-01A-01D-1406-01 | TCGA-A6-2682-01A-01D-1549-01 |
| TCGA-AA-3521 | snp__genome_wide_snp_6__broad_mit_edu__Level_2__after_5NN_copy_number__data | Analyte Replicate Filter | TCGA-AA-3521-01A-01D-0819-01 | TCGA-AA-3521-01A-01D-1549-01 |
| TCGA-AA-3522 | snp__genome_wide_snp_6__broad_mit_edu__Level_2__after_5NN_copy_number__data | Analyte Replicate Filter | TCGA-AA-3522-01A-01D-0819-01 | TCGA-AA-3522-01A-01D-1549-01 |
| TCGA-A6-4107 | snp__genome_wide_snp_6__broad_mit_edu__Level_2__after_5NN_copy_number__data | Analyte Replicate Filter | TCGA-A6-4107-01A-02D-1406-01 | TCGA-A6-4107-01A-02D-1549-01 |
| TCGA-A6-2672 | snp__genome_wide_snp_6__broad_mit_edu__Level_2__after_5NN_copy_number__data | Analyte Replicate Filter | TCGA-A6-2672-01A-01D-0824-01 | TCGA-A6-2672-01A-01D-1549-01 |
| TCGA-AA-3532 | snp__genome_wide_snp_6__broad_mit_edu__Level_2__after_5NN_copy_number__data | Analyte Replicate Filter | TCGA-AA-3532-01A-01D-0819-01 | TCGA-AA-3532-01A-01D-1549-01 |
| TCGA-A6-2678 | snp__genome_wide_snp_6__broad_mit_edu__Level_2__after_5NN_copy_number__data | Analyte Replicate Filter | TCGA-A6-2678-01A-01D-0819-01 | TCGA-A6-2678-01A-01D-1549-01 |
| TCGA-AA-3534 | snp__genome_wide_snp_6__broad_mit_edu__Level_2__after_5NN_copy_number__data | Analyte Replicate Filter | TCGA-AA-3534-01A-01D-0819-01 | TCGA-AA-3534-01A-01D-1549-01 |
| TCGA-AA-3526 | snp__genome_wide_snp_6__broad_mit_edu__Level_2__after_5NN_copy_number__data | Analyte Replicate Filter | TCGA-AA-3526-01A-02D-0819-01 | TCGA-AA-3526-01A-02D-1549-01 |
| TCGA-A6-2681 | snp__genome_wide_snp_6__broad_mit_edu__Level_2__after_5NN_copy_number__data | Analyte Replicate Filter | TCGA-A6-2681-01A-01D-1406-01 | TCGA-A6-2681-01A-01D-1549-01 |
| TCGA-A6-2679 | snp__genome_wide_snp_6__broad_mit_edu__Level_2__after_5NN_copy_number__data | Analyte Replicate Filter | TCGA-A6-2679-01A-02D-1406-01 | TCGA-A6-2679-01A-02D-1549-01 |
| TCGA-A6-2680 | snp__genome_wide_snp_6__broad_mit_edu__Level_2__after_5NN_copy_number__data | Analyte Replicate Filter | TCGA-A6-2680-01A-01D-1406-01 | TCGA-A6-2680-01A-01D-1549-01 |
| TCGA-A6-2686 | snp__genome_wide_snp_6__broad_mit_edu__Level_2__after_5NN_copy_number__data | Analyte Replicate Filter | TCGA-A6-2686-01A-01D-1406-01 | TCGA-A6-2686-01A-01D-1549-01 |
| TCGA-AA-3519 | snp__genome_wide_snp_6__broad_mit_edu__Level_2__after_5NN_copy_number__data | Analyte Replicate Filter | TCGA-AA-3519-01A-02D-0819-01 | TCGA-AA-3519-01A-02D-1549-01 |
| TCGA-AA-3525 | snp__genome_wide_snp_6__broad_mit_edu__Level_2__after_5NN_copy_number__data | Analyte Replicate Filter | TCGA-AA-3525-01A-02D-0824-01 | TCGA-AA-3525-01A-02D-1549-01 |
| TCGA-AA-3520 | snp__genome_wide_snp_6__broad_mit_edu__Level_2__after_5NN_copy_number__data | Analyte Replicate Filter | TCGA-AA-3520-01A-01D-0819-01 | TCGA-AA-3520-01A-01D-1549-01 |
| TCGA-A6-2677 | snp__genome_wide_snp_6__broad_mit_edu__Level_2__after_5NN_copy_number__data | Analyte Replicate Filter | TCGA-A6-2677-01A-01D-0819-01 | TCGA-A6-2677-01A-01D-1549-01 |
| TCGA-A6-2676 | snp__genome_wide_snp_6__broad_mit_edu__Level_2__after_5NN_copy_number__data | Analyte Replicate Filter | TCGA-A6-2676-01A-01D-0824-01 | TCGA-A6-2676-01A-01D-1549-01 |
| TCGA-A6-2684 | snp__genome_wide_snp_6__broad_mit_edu__Level_2__after_5NN_copy_number__data | Analyte Replicate Filter | TCGA-A6-2684-01A-01D-1406-01 | TCGA-A6-2684-01A-01D-1549-01 |
| TCGA-AA-3529 | snp__genome_wide_snp_6__broad_mit_edu__Level_2__after_5NN_copy_number__data | Analyte Replicate Filter | TCGA-AA-3529-01A-02D-0819-01 | TCGA-AA-3529-01A-02D-1549-01 |
| TCGA-AA-3527 | snp__genome_wide_snp_6__broad_mit_edu__Level_2__after_5NN_copy_number__data | Analyte Replicate Filter | TCGA-AA-3527-01A-01D-0819-01 | TCGA-AA-3527-01A-01D-1549-01 |
| TCGA-AA-3524 | snp__genome_wide_snp_6__broad_mit_edu__Level_2__after_5NN_copy_number__data | Analyte Replicate Filter | TCGA-AA-3524-01A-02D-0819-01 | TCGA-AA-3524-01A-02D-1549-01 |
| TCGA-AA-3531 | snp__genome_wide_snp_6__broad_mit_edu__Level_2__after_5NN_copy_number__data | Analyte Replicate Filter | TCGA-AA-3531-01A-01D-0819-01 | TCGA-AA-3531-01A-01D-1549-01 |
| TCGA-A6-2671 | snp__genome_wide_snp_6__broad_mit_edu__Level_2__after_5NN_copy_number__data | Analyte Replicate Filter | TCGA-A6-2671-01A-01D-1406-01 | TCGA-A6-2671-01A-01D-1549-01 |
| TCGA-AA-3518 | snp__genome_wide_snp_6__broad_mit_edu__Level_2__after_5NN_copy_number__data | Analyte Replicate Filter | TCGA-AA-3518-01A-02D-0824-01 | TCGA-AA-3518-01A-02D-1549-01 |
| TCGA-AA-3517 | snp__genome_wide_snp_6__broad_mit_edu__Level_2__after_5NN_copy_number__data | Analyte Replicate Filter | TCGA-AA-3517-01A-01D-0819-01 | TCGA-AA-3517-01A-01D-1549-01 |
| TCGA-AA-3530 | snp__genome_wide_snp_6__broad_mit_edu__Level_2__after_5NN_copy_number__data | Analyte Replicate Filter | TCGA-AA-3530-01A-01D-1018-01 | TCGA-AA-3530-01A-01D-1549-01 |
| TCGA-A6-2674 | snp__genome_wide_snp_6__broad_mit_edu__Level_2__after_5NN_copy_number__data | Analyte Replicate Filter | TCGA-A6-2674-01A-02D-0819-01 | TCGA-A6-2674-01A-02D-1549-01 |
| TCGA-AA-3516 | snp__genome_wide_snp_6__broad_mit_edu__Level_2__after_5NN_copy_number__data | Analyte Replicate Filter | TCGA-AA-3516-01A-02D-0824-01 | TCGA-AA-3516-01A-02D-1549-01 |
| TCGA-A6-2685 | snp__genome_wide_snp_6__broad_mit_edu__Level_2__after_5NN_copy_number__data | Analyte Replicate Filter | TCGA-A6-2685-01A-01D-1406-01 | TCGA-A6-2685-01A-01D-1549-01 |
| TCGA-AA-3514 | snp__genome_wide_snp_6__broad_mit_edu__Level_2__after_5NN_copy_number__data | Analyte Replicate Filter | TCGA-AA-3514-01A-02D-0819-01 | TCGA-AA-3514-01A-02D-1549-01 |
| TCGA-A6-2683 | snp__genome_wide_snp_6__broad_mit_edu__Level_2__after_5NN_copy_number__data | Analyte Replicate Filter | TCGA-A6-2683-01A-01D-0819-01 | TCGA-A6-2683-01A-01D-1549-01 |
| TCGA-A6-6650 | methylation__humanmethylation450__jhu_usc_edu__Level_3__within_bioassay_data_set_function__data | Analyte Replicate Filter | TCGA-A6-6650-01A-11D-1772-05 | TCGA-A6-6650-01B-02D-A27A-05 |
| TCGA-A6-2684 | methylation__humanmethylation450__jhu_usc_edu__Level_3__within_bioassay_data_set_function__data | Analyte Replicate Filter | TCGA-A6-2684-01A-01D-1407-05 | TCGA-A6-2684-01C-08D-A27A-05 |
| TCGA-A6-5659 | methylation__humanmethylation450__jhu_usc_edu__Level_3__within_bioassay_data_set_function__data | Analyte Replicate Filter | TCGA-A6-5659-01A-01D-1651-05 | TCGA-A6-5659-01B-04D-A27A-05 |
| TCGA-A6-5656 | methylation__humanmethylation450__jhu_usc_edu__Level_3__within_bioassay_data_set_function__data | Analyte Replicate Filter | TCGA-A6-5656-01A-21D-1837-05 | TCGA-A6-5656-01B-02D-A27A-05 |
| TCGA-A6-6780 | methylation__humanmethylation450__jhu_usc_edu__Level_3__within_bioassay_data_set_function__data | Analyte Replicate Filter | TCGA-A6-6780-01A-11D-1837-05 | TCGA-A6-6780-01B-04D-A27A-05 |
| TCGA-A6-6781 | methylation__humanmethylation450__jhu_usc_edu__Level_3__within_bioassay_data_set_function__data | Analyte Replicate Filter | TCGA-A6-6781-01A-22D-1926-05 | TCGA-A6-6781-01B-06D-A27A-05 |
| TCGA-A6-2682 | snp__genome_wide_snp_6__broad_mit_edu__Level_1__image_acquisition__data | Analyte Replicate Filter | TCGA-A6-2682-01A-01D-1406-01 | TCGA-A6-2682-01A-01D-1549-01 |
| TCGA-AA-3521 | snp__genome_wide_snp_6__broad_mit_edu__Level_1__image_acquisition__data | Analyte Replicate Filter | TCGA-AA-3521-01A-01D-0819-01 | TCGA-AA-3521-01A-01D-1549-01 |
| TCGA-AA-3522 | snp__genome_wide_snp_6__broad_mit_edu__Level_1__image_acquisition__data | Analyte Replicate Filter | TCGA-AA-3522-01A-01D-0819-01 | TCGA-AA-3522-01A-01D-1549-01 |
| TCGA-A6-4107 | snp__genome_wide_snp_6__broad_mit_edu__Level_1__image_acquisition__data | Analyte Replicate Filter | TCGA-A6-4107-01A-02D-1406-01 | TCGA-A6-4107-01A-02D-1549-01 |
| TCGA-A6-2672 | snp__genome_wide_snp_6__broad_mit_edu__Level_1__image_acquisition__data | Analyte Replicate Filter | TCGA-A6-2672-01A-01D-0824-01 | TCGA-A6-2672-01A-01D-1549-01 |
| TCGA-AA-3532 | snp__genome_wide_snp_6__broad_mit_edu__Level_1__image_acquisition__data | Analyte Replicate Filter | TCGA-AA-3532-01A-01D-0819-01 | TCGA-AA-3532-01A-01D-1549-01 |
| TCGA-A6-2678 | snp__genome_wide_snp_6__broad_mit_edu__Level_1__image_acquisition__data | Analyte Replicate Filter | TCGA-A6-2678-01A-01D-0819-01 | TCGA-A6-2678-01A-01D-1549-01 |
| TCGA-AA-3534 | snp__genome_wide_snp_6__broad_mit_edu__Level_1__image_acquisition__data | Analyte Replicate Filter | TCGA-AA-3534-01A-01D-0819-01 | TCGA-AA-3534-01A-01D-1549-01 |
| TCGA-AA-3526 | snp__genome_wide_snp_6__broad_mit_edu__Level_1__image_acquisition__data | Analyte Replicate Filter | TCGA-AA-3526-01A-02D-0819-01 | TCGA-AA-3526-01A-02D-1549-01 |
| TCGA-A6-2681 | snp__genome_wide_snp_6__broad_mit_edu__Level_1__image_acquisition__data | Analyte Replicate Filter | TCGA-A6-2681-01A-01D-1406-01 | TCGA-A6-2681-01A-01D-1549-01 |
| TCGA-A6-2679 | snp__genome_wide_snp_6__broad_mit_edu__Level_1__image_acquisition__data | Analyte Replicate Filter | TCGA-A6-2679-01A-02D-1406-01 | TCGA-A6-2679-01A-02D-1549-01 |
| TCGA-A6-2680 | snp__genome_wide_snp_6__broad_mit_edu__Level_1__image_acquisition__data | Analyte Replicate Filter | TCGA-A6-2680-01A-01D-1406-01 | TCGA-A6-2680-01A-01D-1549-01 |
| TCGA-A6-2686 | snp__genome_wide_snp_6__broad_mit_edu__Level_1__image_acquisition__data | Analyte Replicate Filter | TCGA-A6-2686-01A-01D-1406-01 | TCGA-A6-2686-01A-01D-1549-01 |
| TCGA-AA-3519 | snp__genome_wide_snp_6__broad_mit_edu__Level_1__image_acquisition__data | Analyte Replicate Filter | TCGA-AA-3519-01A-02D-0819-01 | TCGA-AA-3519-01A-02D-1549-01 |
| TCGA-AA-3525 | snp__genome_wide_snp_6__broad_mit_edu__Level_1__image_acquisition__data | Analyte Replicate Filter | TCGA-AA-3525-01A-02D-0824-01 | TCGA-AA-3525-01A-02D-1549-01 |
| TCGA-AA-3520 | snp__genome_wide_snp_6__broad_mit_edu__Level_1__image_acquisition__data | Analyte Replicate Filter | TCGA-AA-3520-01A-01D-0819-01 | TCGA-AA-3520-01A-01D-1549-01 |
| TCGA-A6-2677 | snp__genome_wide_snp_6__broad_mit_edu__Level_1__image_acquisition__data | Analyte Replicate Filter | TCGA-A6-2677-01A-01D-0819-01 | TCGA-A6-2677-01A-01D-1549-01 |
| TCGA-A6-2676 | snp__genome_wide_snp_6__broad_mit_edu__Level_1__image_acquisition__data | Analyte Replicate Filter | TCGA-A6-2676-01A-01D-0824-01 | TCGA-A6-2676-01A-01D-1549-01 |
| TCGA-A6-2684 | snp__genome_wide_snp_6__broad_mit_edu__Level_1__image_acquisition__data | Analyte Replicate Filter | TCGA-A6-2684-01A-01D-1406-01 | TCGA-A6-2684-01A-01D-1549-01 |
| TCGA-AA-3529 | snp__genome_wide_snp_6__broad_mit_edu__Level_1__image_acquisition__data | Analyte Replicate Filter | TCGA-AA-3529-01A-02D-0819-01 | TCGA-AA-3529-01A-02D-1549-01 |
| TCGA-AA-3527 | snp__genome_wide_snp_6__broad_mit_edu__Level_1__image_acquisition__data | Analyte Replicate Filter | TCGA-AA-3527-01A-01D-0819-01 | TCGA-AA-3527-01A-01D-1549-01 |
| TCGA-AA-3524 | snp__genome_wide_snp_6__broad_mit_edu__Level_1__image_acquisition__data | Analyte Replicate Filter | TCGA-AA-3524-01A-02D-0819-01 | TCGA-AA-3524-01A-02D-1549-01 |
| TCGA-AA-3531 | snp__genome_wide_snp_6__broad_mit_edu__Level_1__image_acquisition__data | Analyte Replicate Filter | TCGA-AA-3531-01A-01D-0819-01 | TCGA-AA-3531-01A-01D-1549-01 |
| TCGA-A6-2671 | snp__genome_wide_snp_6__broad_mit_edu__Level_1__image_acquisition__data | Analyte Replicate Filter | TCGA-A6-2671-01A-01D-1406-01 | TCGA-A6-2671-01A-01D-1549-01 |
| TCGA-AA-3518 | snp__genome_wide_snp_6__broad_mit_edu__Level_1__image_acquisition__data | Analyte Replicate Filter | TCGA-AA-3518-01A-02D-0824-01 | TCGA-AA-3518-01A-02D-1549-01 |
| TCGA-AA-3517 | snp__genome_wide_snp_6__broad_mit_edu__Level_1__image_acquisition__data | Analyte Replicate Filter | TCGA-AA-3517-01A-01D-0819-01 | TCGA-AA-3517-01A-01D-1549-01 |
| TCGA-AA-3530 | snp__genome_wide_snp_6__broad_mit_edu__Level_1__image_acquisition__data | Analyte Replicate Filter | TCGA-AA-3530-01A-01D-1018-01 | TCGA-AA-3530-01A-01D-1549-01 |
| TCGA-A6-2674 | snp__genome_wide_snp_6__broad_mit_edu__Level_1__image_acquisition__data | Analyte Replicate Filter | TCGA-A6-2674-01A-02D-0819-01 | TCGA-A6-2674-01A-02D-1549-01 |
| TCGA-AA-3516 | snp__genome_wide_snp_6__broad_mit_edu__Level_1__image_acquisition__data | Analyte Replicate Filter | TCGA-AA-3516-01A-02D-0824-01 | TCGA-AA-3516-01A-02D-1549-01 |
| TCGA-A6-2685 | snp__genome_wide_snp_6__broad_mit_edu__Level_1__image_acquisition__data | Analyte Replicate Filter | TCGA-A6-2685-01A-01D-1406-01 | TCGA-A6-2685-01A-01D-1549-01 |
| TCGA-AA-3514 | snp__genome_wide_snp_6__broad_mit_edu__Level_1__image_acquisition__data | Analyte Replicate Filter | TCGA-AA-3514-01A-02D-0819-01 | TCGA-AA-3514-01A-02D-1549-01 |
| TCGA-A6-2683 | snp__genome_wide_snp_6__broad_mit_edu__Level_1__image_acquisition__data | Analyte Replicate Filter | TCGA-A6-2683-01A-01D-0819-01 | TCGA-A6-2683-01A-01D-1549-01 |
| TCGA-A6-2682 | snp__genome_wide_snp_6__broad_mit_edu__Level_3__segmented_scna_minus_germline_cnv_hg19__seg | Analyte Replicate Filter | TCGA-A6-2682-01A-01D-1406-01 | TCGA-A6-2682-01A-01D-1549-01 |
| TCGA-AA-3522 | snp__genome_wide_snp_6__broad_mit_edu__Level_3__segmented_scna_minus_germline_cnv_hg19__seg | Analyte Replicate Filter | TCGA-AA-3522-01A-01D-0819-01 | TCGA-AA-3522-01A-01D-1549-01 |
| TCGA-AA-3521 | snp__genome_wide_snp_6__broad_mit_edu__Level_3__segmented_scna_minus_germline_cnv_hg19__seg | Analyte Replicate Filter | TCGA-AA-3521-01A-01D-0819-01 | TCGA-AA-3521-01A-01D-1549-01 |
| TCGA-A6-2685 | snp__genome_wide_snp_6__broad_mit_edu__Level_3__segmented_scna_minus_germline_cnv_hg19__seg | Analyte Replicate Filter | TCGA-A6-2685-01A-01D-1406-01 | TCGA-A6-2685-01A-01D-1549-01 |
| TCGA-A6-2672 | snp__genome_wide_snp_6__broad_mit_edu__Level_3__segmented_scna_minus_germline_cnv_hg19__seg | Analyte Replicate Filter | TCGA-A6-2672-01A-01D-0824-01 | TCGA-A6-2672-01A-01D-1549-01 |
| TCGA-A6-4107 | snp__genome_wide_snp_6__broad_mit_edu__Level_3__segmented_scna_minus_germline_cnv_hg19__seg | Analyte Replicate Filter | TCGA-A6-4107-01A-02D-1406-01 | TCGA-A6-4107-01A-02D-1549-01 |
| TCGA-AA-3532 | snp__genome_wide_snp_6__broad_mit_edu__Level_3__segmented_scna_minus_germline_cnv_hg19__seg | Analyte Replicate Filter | TCGA-AA-3532-01A-01D-0819-01 | TCGA-AA-3532-01A-01D-1549-01 |
| TCGA-A6-2678 | snp__genome_wide_snp_6__broad_mit_edu__Level_3__segmented_scna_minus_germline_cnv_hg19__seg | Analyte Replicate Filter | TCGA-A6-2678-01A-01D-0819-01 | TCGA-A6-2678-01A-01D-1549-01 |
| TCGA-AA-3534 | snp__genome_wide_snp_6__broad_mit_edu__Level_3__segmented_scna_minus_germline_cnv_hg19__seg | Analyte Replicate Filter | TCGA-AA-3534-01A-01D-0819-01 | TCGA-AA-3534-01A-01D-1549-01 |
| TCGA-AA-3526 | snp__genome_wide_snp_6__broad_mit_edu__Level_3__segmented_scna_minus_germline_cnv_hg19__seg | Analyte Replicate Filter | TCGA-AA-3526-01A-02D-0819-01 | TCGA-AA-3526-01A-02D-1549-01 |
| TCGA-A6-2681 | snp__genome_wide_snp_6__broad_mit_edu__Level_3__segmented_scna_minus_germline_cnv_hg19__seg | Analyte Replicate Filter | TCGA-A6-2681-01A-01D-1406-01 | TCGA-A6-2681-01A-01D-1549-01 |
| TCGA-A6-2679 | snp__genome_wide_snp_6__broad_mit_edu__Level_3__segmented_scna_minus_germline_cnv_hg19__seg | Analyte Replicate Filter | TCGA-A6-2679-01A-02D-1406-01 | TCGA-A6-2679-01A-02D-1549-01 |
| TCGA-A6-2680 | snp__genome_wide_snp_6__broad_mit_edu__Level_3__segmented_scna_minus_germline_cnv_hg19__seg | Analyte Replicate Filter | TCGA-A6-2680-01A-01D-1406-01 | TCGA-A6-2680-01A-01D-1549-01 |
| TCGA-A6-2686 | snp__genome_wide_snp_6__broad_mit_edu__Level_3__segmented_scna_minus_germline_cnv_hg19__seg | Analyte Replicate Filter | TCGA-A6-2686-01A-01D-1406-01 | TCGA-A6-2686-01A-01D-1549-01 |
| TCGA-AA-3519 | snp__genome_wide_snp_6__broad_mit_edu__Level_3__segmented_scna_minus_germline_cnv_hg19__seg | Analyte Replicate Filter | TCGA-AA-3519-01A-02D-0819-01 | TCGA-AA-3519-01A-02D-1549-01 |
| TCGA-AA-3525 | snp__genome_wide_snp_6__broad_mit_edu__Level_3__segmented_scna_minus_germline_cnv_hg19__seg | Analyte Replicate Filter | TCGA-AA-3525-01A-02D-0824-01 | TCGA-AA-3525-01A-02D-1549-01 |
| TCGA-AA-3520 | snp__genome_wide_snp_6__broad_mit_edu__Level_3__segmented_scna_minus_germline_cnv_hg19__seg | Analyte Replicate Filter | TCGA-AA-3520-01A-01D-0819-01 | TCGA-AA-3520-01A-01D-1549-01 |
| TCGA-A6-2677 | snp__genome_wide_snp_6__broad_mit_edu__Level_3__segmented_scna_minus_germline_cnv_hg19__seg | Analyte Replicate Filter | TCGA-A6-2677-01A-01D-0819-01 | TCGA-A6-2677-01A-01D-1549-01 |
| TCGA-A6-2676 | snp__genome_wide_snp_6__broad_mit_edu__Level_3__segmented_scna_minus_germline_cnv_hg19__seg | Analyte Replicate Filter | TCGA-A6-2676-01A-01D-0824-01 | TCGA-A6-2676-01A-01D-1549-01 |
| TCGA-A6-2684 | snp__genome_wide_snp_6__broad_mit_edu__Level_3__segmented_scna_minus_germline_cnv_hg19__seg | Analyte Replicate Filter | TCGA-A6-2684-01A-01D-1406-01 | TCGA-A6-2684-01A-01D-1549-01 |
| TCGA-AA-3529 | snp__genome_wide_snp_6__broad_mit_edu__Level_3__segmented_scna_minus_germline_cnv_hg19__seg | Analyte Replicate Filter | TCGA-AA-3529-01A-02D-0819-01 | TCGA-AA-3529-01A-02D-1549-01 |
| TCGA-AA-3527 | snp__genome_wide_snp_6__broad_mit_edu__Level_3__segmented_scna_minus_germline_cnv_hg19__seg | Analyte Replicate Filter | TCGA-AA-3527-01A-01D-0819-01 | TCGA-AA-3527-01A-01D-1549-01 |
| TCGA-AA-3524 | snp__genome_wide_snp_6__broad_mit_edu__Level_3__segmented_scna_minus_germline_cnv_hg19__seg | Analyte Replicate Filter | TCGA-AA-3524-01A-02D-0819-01 | TCGA-AA-3524-01A-02D-1549-01 |
| TCGA-AA-3531 | snp__genome_wide_snp_6__broad_mit_edu__Level_3__segmented_scna_minus_germline_cnv_hg19__seg | Analyte Replicate Filter | TCGA-AA-3531-01A-01D-0819-01 | TCGA-AA-3531-01A-01D-1549-01 |
| TCGA-A6-2671 | snp__genome_wide_snp_6__broad_mit_edu__Level_3__segmented_scna_minus_germline_cnv_hg19__seg | Analyte Replicate Filter | TCGA-A6-2671-01A-01D-1406-01 | TCGA-A6-2671-01A-01D-1549-01 |
| TCGA-AA-3518 | snp__genome_wide_snp_6__broad_mit_edu__Level_3__segmented_scna_minus_germline_cnv_hg19__seg | Analyte Replicate Filter | TCGA-AA-3518-01A-02D-0824-01 | TCGA-AA-3518-01A-02D-1549-01 |
| TCGA-AA-3517 | snp__genome_wide_snp_6__broad_mit_edu__Level_3__segmented_scna_minus_germline_cnv_hg19__seg | Analyte Replicate Filter | TCGA-AA-3517-01A-01D-0819-01 | TCGA-AA-3517-01A-01D-1549-01 |
| TCGA-AA-3530 | snp__genome_wide_snp_6__broad_mit_edu__Level_3__segmented_scna_minus_germline_cnv_hg19__seg | Analyte Replicate Filter | TCGA-AA-3530-01A-01D-1018-01 | TCGA-AA-3530-01A-01D-1549-01 |
| TCGA-A6-2674 | snp__genome_wide_snp_6__broad_mit_edu__Level_3__segmented_scna_minus_germline_cnv_hg19__seg | Analyte Replicate Filter | TCGA-A6-2674-01A-02D-0819-01 | TCGA-A6-2674-01A-02D-1549-01 |
| TCGA-AA-3516 | snp__genome_wide_snp_6__broad_mit_edu__Level_3__segmented_scna_minus_germline_cnv_hg19__seg | Analyte Replicate Filter | TCGA-AA-3516-01A-02D-0824-01 | TCGA-AA-3516-01A-02D-1549-01 |
| TCGA-AA-3514 | snp__genome_wide_snp_6__broad_mit_edu__Level_3__segmented_scna_minus_germline_cnv_hg19__seg | Analyte Replicate Filter | TCGA-AA-3514-01A-02D-0819-01 | TCGA-AA-3514-01A-02D-1549-01 |
| TCGA-A6-2683 | snp__genome_wide_snp_6__broad_mit_edu__Level_3__segmented_scna_minus_germline_cnv_hg19__seg | Analyte Replicate Filter | TCGA-A6-2683-01A-01D-0819-01 | TCGA-A6-2683-01A-01D-1549-01 |
| TCGA-A6-2682 | snp__genome_wide_snp_6__broad_mit_edu__Level_3__segmented_scna_hg19__seg | Analyte Replicate Filter | TCGA-A6-2682-01A-01D-1406-01 | TCGA-A6-2682-01A-01D-1549-01 |
| TCGA-AA-3522 | snp__genome_wide_snp_6__broad_mit_edu__Level_3__segmented_scna_hg19__seg | Analyte Replicate Filter | TCGA-AA-3522-01A-01D-0819-01 | TCGA-AA-3522-01A-01D-1549-01 |
| TCGA-AA-3521 | snp__genome_wide_snp_6__broad_mit_edu__Level_3__segmented_scna_hg19__seg | Analyte Replicate Filter | TCGA-AA-3521-01A-01D-0819-01 | TCGA-AA-3521-01A-01D-1549-01 |
| TCGA-A6-2685 | snp__genome_wide_snp_6__broad_mit_edu__Level_3__segmented_scna_hg19__seg | Analyte Replicate Filter | TCGA-A6-2685-01A-01D-1406-01 | TCGA-A6-2685-01A-01D-1549-01 |
| TCGA-A6-2672 | snp__genome_wide_snp_6__broad_mit_edu__Level_3__segmented_scna_hg19__seg | Analyte Replicate Filter | TCGA-A6-2672-01A-01D-0824-01 | TCGA-A6-2672-01A-01D-1549-01 |
| TCGA-A6-4107 | snp__genome_wide_snp_6__broad_mit_edu__Level_3__segmented_scna_hg19__seg | Analyte Replicate Filter | TCGA-A6-4107-01A-02D-1406-01 | TCGA-A6-4107-01A-02D-1549-01 |
| TCGA-AA-3532 | snp__genome_wide_snp_6__broad_mit_edu__Level_3__segmented_scna_hg19__seg | Analyte Replicate Filter | TCGA-AA-3532-01A-01D-0819-01 | TCGA-AA-3532-01A-01D-1549-01 |
| TCGA-A6-2678 | snp__genome_wide_snp_6__broad_mit_edu__Level_3__segmented_scna_hg19__seg | Analyte Replicate Filter | TCGA-A6-2678-01A-01D-0819-01 | TCGA-A6-2678-01A-01D-1549-01 |
| TCGA-AA-3534 | snp__genome_wide_snp_6__broad_mit_edu__Level_3__segmented_scna_hg19__seg | Analyte Replicate Filter | TCGA-AA-3534-01A-01D-0819-01 | TCGA-AA-3534-01A-01D-1549-01 |
| TCGA-AA-3526 | snp__genome_wide_snp_6__broad_mit_edu__Level_3__segmented_scna_hg19__seg | Analyte Replicate Filter | TCGA-AA-3526-01A-02D-0819-01 | TCGA-AA-3526-01A-02D-1549-01 |
| TCGA-A6-2681 | snp__genome_wide_snp_6__broad_mit_edu__Level_3__segmented_scna_hg19__seg | Analyte Replicate Filter | TCGA-A6-2681-01A-01D-1406-01 | TCGA-A6-2681-01A-01D-1549-01 |
| TCGA-A6-2679 | snp__genome_wide_snp_6__broad_mit_edu__Level_3__segmented_scna_hg19__seg | Analyte Replicate Filter | TCGA-A6-2679-01A-02D-1406-01 | TCGA-A6-2679-01A-02D-1549-01 |
| TCGA-A6-2680 | snp__genome_wide_snp_6__broad_mit_edu__Level_3__segmented_scna_hg19__seg | Analyte Replicate Filter | TCGA-A6-2680-01A-01D-1406-01 | TCGA-A6-2680-01A-01D-1549-01 |
| TCGA-A6-2686 | snp__genome_wide_snp_6__broad_mit_edu__Level_3__segmented_scna_hg19__seg | Analyte Replicate Filter | TCGA-A6-2686-01A-01D-1406-01 | TCGA-A6-2686-01A-01D-1549-01 |
| TCGA-AA-3519 | snp__genome_wide_snp_6__broad_mit_edu__Level_3__segmented_scna_hg19__seg | Analyte Replicate Filter | TCGA-AA-3519-01A-02D-0819-01 | TCGA-AA-3519-01A-02D-1549-01 |
| TCGA-AA-3525 | snp__genome_wide_snp_6__broad_mit_edu__Level_3__segmented_scna_hg19__seg | Analyte Replicate Filter | TCGA-AA-3525-01A-02D-0824-01 | TCGA-AA-3525-01A-02D-1549-01 |
| TCGA-AA-3520 | snp__genome_wide_snp_6__broad_mit_edu__Level_3__segmented_scna_hg19__seg | Analyte Replicate Filter | TCGA-AA-3520-01A-01D-0819-01 | TCGA-AA-3520-01A-01D-1549-01 |
| TCGA-A6-2677 | snp__genome_wide_snp_6__broad_mit_edu__Level_3__segmented_scna_hg19__seg | Analyte Replicate Filter | TCGA-A6-2677-01A-01D-0819-01 | TCGA-A6-2677-01A-01D-1549-01 |
| TCGA-A6-2676 | snp__genome_wide_snp_6__broad_mit_edu__Level_3__segmented_scna_hg19__seg | Analyte Replicate Filter | TCGA-A6-2676-01A-01D-0824-01 | TCGA-A6-2676-01A-01D-1549-01 |
| TCGA-A6-2684 | snp__genome_wide_snp_6__broad_mit_edu__Level_3__segmented_scna_hg19__seg | Analyte Replicate Filter | TCGA-A6-2684-01A-01D-1406-01 | TCGA-A6-2684-01A-01D-1549-01 |
| TCGA-AA-3529 | snp__genome_wide_snp_6__broad_mit_edu__Level_3__segmented_scna_hg19__seg | Analyte Replicate Filter | TCGA-AA-3529-01A-02D-0819-01 | TCGA-AA-3529-01A-02D-1549-01 |
| TCGA-AA-3527 | snp__genome_wide_snp_6__broad_mit_edu__Level_3__segmented_scna_hg19__seg | Analyte Replicate Filter | TCGA-AA-3527-01A-01D-0819-01 | TCGA-AA-3527-01A-01D-1549-01 |
| TCGA-AA-3524 | snp__genome_wide_snp_6__broad_mit_edu__Level_3__segmented_scna_hg19__seg | Analyte Replicate Filter | TCGA-AA-3524-01A-02D-0819-01 | TCGA-AA-3524-01A-02D-1549-01 |
| TCGA-AA-3531 | snp__genome_wide_snp_6__broad_mit_edu__Level_3__segmented_scna_hg19__seg | Analyte Replicate Filter | TCGA-AA-3531-01A-01D-0819-01 | TCGA-AA-3531-01A-01D-1549-01 |
| TCGA-A6-2671 | snp__genome_wide_snp_6__broad_mit_edu__Level_3__segmented_scna_hg19__seg | Analyte Replicate Filter | TCGA-A6-2671-01A-01D-1406-01 | TCGA-A6-2671-01A-01D-1549-01 |
| TCGA-AA-3518 | snp__genome_wide_snp_6__broad_mit_edu__Level_3__segmented_scna_hg19__seg | Analyte Replicate Filter | TCGA-AA-3518-01A-02D-0824-01 | TCGA-AA-3518-01A-02D-1549-01 |
| TCGA-AA-3517 | snp__genome_wide_snp_6__broad_mit_edu__Level_3__segmented_scna_hg19__seg | Analyte Replicate Filter | TCGA-AA-3517-01A-01D-0819-01 | TCGA-AA-3517-01A-01D-1549-01 |
| TCGA-AA-3530 | snp__genome_wide_snp_6__broad_mit_edu__Level_3__segmented_scna_hg19__seg | Analyte Replicate Filter | TCGA-AA-3530-01A-01D-1018-01 | TCGA-AA-3530-01A-01D-1549-01 |
| TCGA-A6-2674 | snp__genome_wide_snp_6__broad_mit_edu__Level_3__segmented_scna_hg19__seg | Analyte Replicate Filter | TCGA-A6-2674-01A-02D-0819-01 | TCGA-A6-2674-01A-02D-1549-01 |
| TCGA-AA-3516 | snp__genome_wide_snp_6__broad_mit_edu__Level_3__segmented_scna_hg19__seg | Analyte Replicate Filter | TCGA-AA-3516-01A-02D-0824-01 | TCGA-AA-3516-01A-02D-1549-01 |
| TCGA-AA-3514 | snp__genome_wide_snp_6__broad_mit_edu__Level_3__segmented_scna_hg19__seg | Analyte Replicate Filter | TCGA-AA-3514-01A-02D-0819-01 | TCGA-AA-3514-01A-02D-1549-01 |
| TCGA-A6-2683 | snp__genome_wide_snp_6__broad_mit_edu__Level_3__segmented_scna_hg19__seg | Analyte Replicate Filter | TCGA-A6-2683-01A-01D-0819-01 | TCGA-A6-2683-01A-01D-1549-01 |
| TCGA-A6-3810 | snp__genome_wide_snp_6__broad_mit_edu__Level_2__raw_copynumber__data | Analyte Replicate Filter | TCGA-A6-3810-01A-01D-1018-01 | TCGA-A6-3810-01B-04D-A274-01 |
| TCGA-A6-2682 | snp__genome_wide_snp_6__broad_mit_edu__Level_2__raw_copynumber__data | Analyte Replicate Filter | TCGA-A6-2682-01A-01D-1406-01 | TCGA-A6-2682-01A-01D-1549-01 |
| TCGA-AA-3522 | snp__genome_wide_snp_6__broad_mit_edu__Level_2__raw_copynumber__data | Analyte Replicate Filter | TCGA-AA-3522-01A-01D-0819-01 | TCGA-AA-3522-01A-01D-1549-01 |
| TCGA-AA-3521 | snp__genome_wide_snp_6__broad_mit_edu__Level_2__raw_copynumber__data | Analyte Replicate Filter | TCGA-AA-3521-01A-01D-0819-01 | TCGA-AA-3521-01A-01D-1549-01 |
| TCGA-A6-5656 | snp__genome_wide_snp_6__broad_mit_edu__Level_2__raw_copynumber__data | Analyte Replicate Filter | TCGA-A6-5656-01A-21D-1834-01 | TCGA-A6-5656-01B-02D-A274-01 |
| TCGA-A6-2685 | snp__genome_wide_snp_6__broad_mit_edu__Level_2__raw_copynumber__data | Analyte Replicate Filter | TCGA-A6-2685-01A-01D-1406-01 | TCGA-A6-2685-01A-01D-1549-01 |
| TCGA-A6-2672 | snp__genome_wide_snp_6__broad_mit_edu__Level_2__raw_copynumber__data | Analyte Replicate Filter | TCGA-A6-2672-01A-01D-0824-01 | TCGA-A6-2672-01A-01D-1549-01 |
| TCGA-A6-4107 | snp__genome_wide_snp_6__broad_mit_edu__Level_2__raw_copynumber__data | Analyte Replicate Filter | TCGA-A6-4107-01A-02D-1406-01 | TCGA-A6-4107-01A-02D-1549-01 |
| TCGA-AA-3532 | snp__genome_wide_snp_6__broad_mit_edu__Level_2__raw_copynumber__data | Analyte Replicate Filter | TCGA-AA-3532-01A-01D-0819-01 | TCGA-AA-3532-01A-01D-1549-01 |
| TCGA-A6-2678 | snp__genome_wide_snp_6__broad_mit_edu__Level_2__raw_copynumber__data | Analyte Replicate Filter | TCGA-A6-2678-01A-01D-0819-01 | TCGA-A6-2678-01A-01D-1549-01 |
| TCGA-AA-3534 | snp__genome_wide_snp_6__broad_mit_edu__Level_2__raw_copynumber__data | Analyte Replicate Filter | TCGA-AA-3534-01A-01D-0819-01 | TCGA-AA-3534-01A-01D-1549-01 |
| TCGA-A6-3809 | snp__genome_wide_snp_6__broad_mit_edu__Level_2__raw_copynumber__data | Analyte Replicate Filter | TCGA-A6-3809-01A-01D-1018-01 | TCGA-A6-3809-01B-04D-A274-01 |
| TCGA-A6-6650 | snp__genome_wide_snp_6__broad_mit_edu__Level_2__raw_copynumber__data | Analyte Replicate Filter | TCGA-A6-6650-01A-11D-1770-01 | TCGA-A6-6650-01B-02D-A274-01 |
| TCGA-A6-5659 | snp__genome_wide_snp_6__broad_mit_edu__Level_2__raw_copynumber__data | Analyte Replicate Filter | TCGA-A6-5659-01A-01D-1649-01 | TCGA-A6-5659-01B-04D-A274-01 |
| TCGA-AA-3526 | snp__genome_wide_snp_6__broad_mit_edu__Level_2__raw_copynumber__data | Analyte Replicate Filter | TCGA-AA-3526-01A-02D-0819-01 | TCGA-AA-3526-01A-02D-1549-01 |
| TCGA-A6-6781 | snp__genome_wide_snp_6__broad_mit_edu__Level_2__raw_copynumber__data | Analyte Replicate Filter | TCGA-A6-6781-01A-22D-1923-01 | TCGA-A6-6781-01B-06D-A274-01 |
| TCGA-A6-2681 | snp__genome_wide_snp_6__broad_mit_edu__Level_2__raw_copynumber__data | Analyte Replicate Filter | TCGA-A6-2681-01A-01D-1406-01 | TCGA-A6-2681-01A-01D-1549-01 |
| TCGA-A6-2679 | snp__genome_wide_snp_6__broad_mit_edu__Level_2__raw_copynumber__data | Analyte Replicate Filter | TCGA-A6-2679-01A-02D-1406-01 | TCGA-A6-2679-01A-02D-1549-01 |
| TCGA-A6-2680 | snp__genome_wide_snp_6__broad_mit_edu__Level_2__raw_copynumber__data | Analyte Replicate Filter | TCGA-A6-2680-01A-01D-1406-01 | TCGA-A6-2680-01A-01D-1549-01 |
| TCGA-A6-2686 | snp__genome_wide_snp_6__broad_mit_edu__Level_2__raw_copynumber__data | Analyte Replicate Filter | TCGA-A6-2686-01A-01D-1406-01 | TCGA-A6-2686-01A-01D-1549-01 |
| TCGA-AA-3519 | snp__genome_wide_snp_6__broad_mit_edu__Level_2__raw_copynumber__data | Analyte Replicate Filter | TCGA-AA-3519-01A-02D-0819-01 | TCGA-AA-3519-01A-02D-1549-01 |
| TCGA-AA-3525 | snp__genome_wide_snp_6__broad_mit_edu__Level_2__raw_copynumber__data | Analyte Replicate Filter | TCGA-AA-3525-01A-02D-0824-01 | TCGA-AA-3525-01A-02D-1549-01 |
| TCGA-AA-3520 | snp__genome_wide_snp_6__broad_mit_edu__Level_2__raw_copynumber__data | Analyte Replicate Filter | TCGA-AA-3520-01A-01D-0819-01 | TCGA-AA-3520-01A-01D-1549-01 |
| TCGA-A6-2677 | snp__genome_wide_snp_6__broad_mit_edu__Level_2__raw_copynumber__data | Analyte Replicate Filter | TCGA-A6-2677-01A-01D-1549-01,TCGA-A6-2677-01A-01D-0819-01 | TCGA-A6-2677-01B-02D-A274-01 |
| TCGA-A6-2676 | snp__genome_wide_snp_6__broad_mit_edu__Level_2__raw_copynumber__data | Analyte Replicate Filter | TCGA-A6-2676-01A-01D-0824-01 | TCGA-A6-2676-01A-01D-1549-01 |
| TCGA-A6-2684 | snp__genome_wide_snp_6__broad_mit_edu__Level_2__raw_copynumber__data | Analyte Replicate Filter | TCGA-A6-2684-01A-01D-1406-01,TCGA-A6-2684-01A-01D-1549-01 | TCGA-A6-2684-01C-08D-A274-01 |
| TCGA-AA-3529 | snp__genome_wide_snp_6__broad_mit_edu__Level_2__raw_copynumber__data | Analyte Replicate Filter | TCGA-AA-3529-01A-02D-0819-01 | TCGA-AA-3529-01A-02D-1549-01 |
| TCGA-AA-3527 | snp__genome_wide_snp_6__broad_mit_edu__Level_2__raw_copynumber__data | Analyte Replicate Filter | TCGA-AA-3527-01A-01D-0819-01 | TCGA-AA-3527-01A-01D-1549-01 |
| TCGA-AA-3524 | snp__genome_wide_snp_6__broad_mit_edu__Level_2__raw_copynumber__data | Analyte Replicate Filter | TCGA-AA-3524-01A-02D-0819-01 | TCGA-AA-3524-01A-02D-1549-01 |
| TCGA-AA-3531 | snp__genome_wide_snp_6__broad_mit_edu__Level_2__raw_copynumber__data | Analyte Replicate Filter | TCGA-AA-3531-01A-01D-0819-01 | TCGA-AA-3531-01A-01D-1549-01 |
| TCGA-A6-2671 | snp__genome_wide_snp_6__broad_mit_edu__Level_2__raw_copynumber__data | Analyte Replicate Filter | TCGA-A6-2671-01A-01D-1406-01 | TCGA-A6-2671-01A-01D-1549-01 |
| TCGA-AA-3518 | snp__genome_wide_snp_6__broad_mit_edu__Level_2__raw_copynumber__data | Analyte Replicate Filter | TCGA-AA-3518-01A-02D-0824-01 | TCGA-AA-3518-01A-02D-1549-01 |
| TCGA-AA-3517 | snp__genome_wide_snp_6__broad_mit_edu__Level_2__raw_copynumber__data | Analyte Replicate Filter | TCGA-AA-3517-01A-01D-0819-01 | TCGA-AA-3517-01A-01D-1549-01 |
| TCGA-AA-3530 | snp__genome_wide_snp_6__broad_mit_edu__Level_2__raw_copynumber__data | Analyte Replicate Filter | TCGA-AA-3530-01A-01D-1018-01 | TCGA-AA-3530-01A-01D-1549-01 |
| TCGA-A6-2674 | snp__genome_wide_snp_6__broad_mit_edu__Level_2__raw_copynumber__data | Analyte Replicate Filter | TCGA-A6-2674-01A-02D-0819-01 | TCGA-A6-2674-01A-02D-1549-01 |
| TCGA-AA-3516 | snp__genome_wide_snp_6__broad_mit_edu__Level_2__raw_copynumber__data | Analyte Replicate Filter | TCGA-AA-3516-01A-02D-0824-01 | TCGA-AA-3516-01A-02D-1549-01 |
| TCGA-AA-3514 | snp__genome_wide_snp_6__broad_mit_edu__Level_2__raw_copynumber__data | Analyte Replicate Filter | TCGA-AA-3514-01A-02D-0819-01 | TCGA-AA-3514-01A-02D-1549-01 |
| TCGA-A6-2683 | snp__genome_wide_snp_6__broad_mit_edu__Level_2__raw_copynumber__data | Analyte Replicate Filter | TCGA-A6-2683-01A-01D-0819-01 | TCGA-A6-2683-01A-01D-1549-01 |
| TCGA-A6-6780 | snp__genome_wide_snp_6__broad_mit_edu__Level_2__raw_copynumber__data | Analyte Replicate Filter | TCGA-A6-6780-01A-11D-1834-01 | TCGA-A6-6780-01B-04D-A274-01 |
| TCGA-A6-3810 | snp__genome_wide_snp_6__broad_mit_edu__Level_2__byallele_copynumber__data | Analyte Replicate Filter | TCGA-A6-3810-01A-01D-1018-01 | TCGA-A6-3810-01B-04D-A274-01 |
| TCGA-A6-2682 | snp__genome_wide_snp_6__broad_mit_edu__Level_2__byallele_copynumber__data | Analyte Replicate Filter | TCGA-A6-2682-01A-01D-1406-01 | TCGA-A6-2682-01A-01D-1549-01 |
| TCGA-AA-3522 | snp__genome_wide_snp_6__broad_mit_edu__Level_2__byallele_copynumber__data | Analyte Replicate Filter | TCGA-AA-3522-01A-01D-0819-01 | TCGA-AA-3522-01A-01D-1549-01 |
| TCGA-AA-3521 | snp__genome_wide_snp_6__broad_mit_edu__Level_2__byallele_copynumber__data | Analyte Replicate Filter | TCGA-AA-3521-01A-01D-0819-01 | TCGA-AA-3521-01A-01D-1549-01 |
| TCGA-A6-5656 | snp__genome_wide_snp_6__broad_mit_edu__Level_2__byallele_copynumber__data | Analyte Replicate Filter | TCGA-A6-5656-01A-21D-1834-01 | TCGA-A6-5656-01B-02D-A274-01 |
| TCGA-A6-2685 | snp__genome_wide_snp_6__broad_mit_edu__Level_2__byallele_copynumber__data | Analyte Replicate Filter | TCGA-A6-2685-01A-01D-1406-01 | TCGA-A6-2685-01A-01D-1549-01 |
| TCGA-A6-2672 | snp__genome_wide_snp_6__broad_mit_edu__Level_2__byallele_copynumber__data | Analyte Replicate Filter | TCGA-A6-2672-01A-01D-0824-01 | TCGA-A6-2672-01A-01D-1549-01 |
| TCGA-A6-4107 | snp__genome_wide_snp_6__broad_mit_edu__Level_2__byallele_copynumber__data | Analyte Replicate Filter | TCGA-A6-4107-01A-02D-1406-01 | TCGA-A6-4107-01A-02D-1549-01 |
| TCGA-AA-3532 | snp__genome_wide_snp_6__broad_mit_edu__Level_2__byallele_copynumber__data | Analyte Replicate Filter | TCGA-AA-3532-01A-01D-0819-01 | TCGA-AA-3532-01A-01D-1549-01 |
| TCGA-A6-2678 | snp__genome_wide_snp_6__broad_mit_edu__Level_2__byallele_copynumber__data | Analyte Replicate Filter | TCGA-A6-2678-01A-01D-0819-01 | TCGA-A6-2678-01A-01D-1549-01 |
| TCGA-AA-3534 | snp__genome_wide_snp_6__broad_mit_edu__Level_2__byallele_copynumber__data | Analyte Replicate Filter | TCGA-AA-3534-01A-01D-0819-01 | TCGA-AA-3534-01A-01D-1549-01 |
| TCGA-A6-3809 | snp__genome_wide_snp_6__broad_mit_edu__Level_2__byallele_copynumber__data | Analyte Replicate Filter | TCGA-A6-3809-01A-01D-1018-01 | TCGA-A6-3809-01B-04D-A274-01 |
| TCGA-A6-6650 | snp__genome_wide_snp_6__broad_mit_edu__Level_2__byallele_copynumber__data | Analyte Replicate Filter | TCGA-A6-6650-01A-11D-1770-01 | TCGA-A6-6650-01B-02D-A274-01 |
| TCGA-A6-5659 | snp__genome_wide_snp_6__broad_mit_edu__Level_2__byallele_copynumber__data | Analyte Replicate Filter | TCGA-A6-5659-01A-01D-1649-01 | TCGA-A6-5659-01B-04D-A274-01 |
| TCGA-AA-3526 | snp__genome_wide_snp_6__broad_mit_edu__Level_2__byallele_copynumber__data | Analyte Replicate Filter | TCGA-AA-3526-01A-02D-0819-01 | TCGA-AA-3526-01A-02D-1549-01 |
| TCGA-A6-6781 | snp__genome_wide_snp_6__broad_mit_edu__Level_2__byallele_copynumber__data | Analyte Replicate Filter | TCGA-A6-6781-01A-22D-1923-01 | TCGA-A6-6781-01B-06D-A274-01 |
| TCGA-A6-2681 | snp__genome_wide_snp_6__broad_mit_edu__Level_2__byallele_copynumber__data | Analyte Replicate Filter | TCGA-A6-2681-01A-01D-1406-01 | TCGA-A6-2681-01A-01D-1549-01 |
| TCGA-A6-2679 | snp__genome_wide_snp_6__broad_mit_edu__Level_2__byallele_copynumber__data | Analyte Replicate Filter | TCGA-A6-2679-01A-02D-1406-01 | TCGA-A6-2679-01A-02D-1549-01 |
| TCGA-A6-2680 | snp__genome_wide_snp_6__broad_mit_edu__Level_2__byallele_copynumber__data | Analyte Replicate Filter | TCGA-A6-2680-01A-01D-1406-01 | TCGA-A6-2680-01A-01D-1549-01 |
| TCGA-A6-2686 | snp__genome_wide_snp_6__broad_mit_edu__Level_2__byallele_copynumber__data | Analyte Replicate Filter | TCGA-A6-2686-01A-01D-1406-01 | TCGA-A6-2686-01A-01D-1549-01 |
| TCGA-AA-3519 | snp__genome_wide_snp_6__broad_mit_edu__Level_2__byallele_copynumber__data | Analyte Replicate Filter | TCGA-AA-3519-01A-02D-0819-01 | TCGA-AA-3519-01A-02D-1549-01 |
| TCGA-AA-3525 | snp__genome_wide_snp_6__broad_mit_edu__Level_2__byallele_copynumber__data | Analyte Replicate Filter | TCGA-AA-3525-01A-02D-0824-01 | TCGA-AA-3525-01A-02D-1549-01 |
| TCGA-AA-3520 | snp__genome_wide_snp_6__broad_mit_edu__Level_2__byallele_copynumber__data | Analyte Replicate Filter | TCGA-AA-3520-01A-01D-0819-01 | TCGA-AA-3520-01A-01D-1549-01 |
| TCGA-A6-2677 | snp__genome_wide_snp_6__broad_mit_edu__Level_2__byallele_copynumber__data | Analyte Replicate Filter | TCGA-A6-2677-01A-01D-1549-01,TCGA-A6-2677-01A-01D-0819-01 | TCGA-A6-2677-01B-02D-A274-01 |
| TCGA-A6-2676 | snp__genome_wide_snp_6__broad_mit_edu__Level_2__byallele_copynumber__data | Analyte Replicate Filter | TCGA-A6-2676-01A-01D-0824-01 | TCGA-A6-2676-01A-01D-1549-01 |
| TCGA-A6-2684 | snp__genome_wide_snp_6__broad_mit_edu__Level_2__byallele_copynumber__data | Analyte Replicate Filter | TCGA-A6-2684-01A-01D-1406-01,TCGA-A6-2684-01A-01D-1549-01 | TCGA-A6-2684-01C-08D-A274-01 |
| TCGA-AA-3529 | snp__genome_wide_snp_6__broad_mit_edu__Level_2__byallele_copynumber__data | Analyte Replicate Filter | TCGA-AA-3529-01A-02D-0819-01 | TCGA-AA-3529-01A-02D-1549-01 |
| TCGA-AA-3527 | snp__genome_wide_snp_6__broad_mit_edu__Level_2__byallele_copynumber__data | Analyte Replicate Filter | TCGA-AA-3527-01A-01D-0819-01 | TCGA-AA-3527-01A-01D-1549-01 |
| TCGA-AA-3524 | snp__genome_wide_snp_6__broad_mit_edu__Level_2__byallele_copynumber__data | Analyte Replicate Filter | TCGA-AA-3524-01A-02D-0819-01 | TCGA-AA-3524-01A-02D-1549-01 |
| TCGA-AA-3531 | snp__genome_wide_snp_6__broad_mit_edu__Level_2__byallele_copynumber__data | Analyte Replicate Filter | TCGA-AA-3531-01A-01D-0819-01 | TCGA-AA-3531-01A-01D-1549-01 |
| TCGA-A6-2671 | snp__genome_wide_snp_6__broad_mit_edu__Level_2__byallele_copynumber__data | Analyte Replicate Filter | TCGA-A6-2671-01A-01D-1406-01 | TCGA-A6-2671-01A-01D-1549-01 |
| TCGA-AA-3518 | snp__genome_wide_snp_6__broad_mit_edu__Level_2__byallele_copynumber__data | Analyte Replicate Filter | TCGA-AA-3518-01A-02D-0824-01 | TCGA-AA-3518-01A-02D-1549-01 |
| TCGA-AA-3517 | snp__genome_wide_snp_6__broad_mit_edu__Level_2__byallele_copynumber__data | Analyte Replicate Filter | TCGA-AA-3517-01A-01D-0819-01 | TCGA-AA-3517-01A-01D-1549-01 |
| TCGA-AA-3530 | snp__genome_wide_snp_6__broad_mit_edu__Level_2__byallele_copynumber__data | Analyte Replicate Filter | TCGA-AA-3530-01A-01D-1018-01 | TCGA-AA-3530-01A-01D-1549-01 |
| TCGA-A6-2674 | snp__genome_wide_snp_6__broad_mit_edu__Level_2__byallele_copynumber__data | Analyte Replicate Filter | TCGA-A6-2674-01A-02D-0819-01 | TCGA-A6-2674-01A-02D-1549-01 |
| TCGA-AA-3516 | snp__genome_wide_snp_6__broad_mit_edu__Level_2__byallele_copynumber__data | Analyte Replicate Filter | TCGA-AA-3516-01A-02D-0824-01 | TCGA-AA-3516-01A-02D-1549-01 |
| TCGA-AA-3514 | snp__genome_wide_snp_6__broad_mit_edu__Level_2__byallele_copynumber__data | Analyte Replicate Filter | TCGA-AA-3514-01A-02D-0819-01 | TCGA-AA-3514-01A-02D-1549-01 |
| TCGA-A6-2683 | snp__genome_wide_snp_6__broad_mit_edu__Level_2__byallele_copynumber__data | Analyte Replicate Filter | TCGA-A6-2683-01A-01D-0819-01 | TCGA-A6-2683-01A-01D-1549-01 |
| TCGA-A6-6780 | snp__genome_wide_snp_6__broad_mit_edu__Level_2__byallele_copynumber__data | Analyte Replicate Filter | TCGA-A6-6780-01A-11D-1834-01 | TCGA-A6-6780-01B-04D-A274-01 |
| TCGA-A6-2682 | snp__genome_wide_snp_6__broad_mit_edu__Level_2__copynumber_byallele__data | Analyte Replicate Filter | TCGA-A6-2682-01A-01D-1406-01 | TCGA-A6-2682-01A-01D-1549-01 |
| TCGA-AA-3521 | snp__genome_wide_snp_6__broad_mit_edu__Level_2__copynumber_byallele__data | Analyte Replicate Filter | TCGA-AA-3521-01A-01D-0819-01 | TCGA-AA-3521-01A-01D-1549-01 |
| TCGA-AA-3522 | snp__genome_wide_snp_6__broad_mit_edu__Level_2__copynumber_byallele__data | Analyte Replicate Filter | TCGA-AA-3522-01A-01D-0819-01 | TCGA-AA-3522-01A-01D-1549-01 |
| TCGA-A6-4107 | snp__genome_wide_snp_6__broad_mit_edu__Level_2__copynumber_byallele__data | Analyte Replicate Filter | TCGA-A6-4107-01A-02D-1406-01 | TCGA-A6-4107-01A-02D-1549-01 |
| TCGA-A6-2672 | snp__genome_wide_snp_6__broad_mit_edu__Level_2__copynumber_byallele__data | Analyte Replicate Filter | TCGA-A6-2672-01A-01D-0824-01 | TCGA-A6-2672-01A-01D-1549-01 |
| TCGA-AA-3532 | snp__genome_wide_snp_6__broad_mit_edu__Level_2__copynumber_byallele__data | Analyte Replicate Filter | TCGA-AA-3532-01A-01D-0819-01 | TCGA-AA-3532-01A-01D-1549-01 |
| TCGA-A6-2678 | snp__genome_wide_snp_6__broad_mit_edu__Level_2__copynumber_byallele__data | Analyte Replicate Filter | TCGA-A6-2678-01A-01D-0819-01 | TCGA-A6-2678-01A-01D-1549-01 |
| TCGA-AA-3534 | snp__genome_wide_snp_6__broad_mit_edu__Level_2__copynumber_byallele__data | Analyte Replicate Filter | TCGA-AA-3534-01A-01D-0819-01 | TCGA-AA-3534-01A-01D-1549-01 |
| TCGA-AA-3526 | snp__genome_wide_snp_6__broad_mit_edu__Level_2__copynumber_byallele__data | Analyte Replicate Filter | TCGA-AA-3526-01A-02D-0819-01 | TCGA-AA-3526-01A-02D-1549-01 |
| TCGA-A6-2681 | snp__genome_wide_snp_6__broad_mit_edu__Level_2__copynumber_byallele__data | Analyte Replicate Filter | TCGA-A6-2681-01A-01D-1406-01 | TCGA-A6-2681-01A-01D-1549-01 |
| TCGA-A6-2679 | snp__genome_wide_snp_6__broad_mit_edu__Level_2__copynumber_byallele__data | Analyte Replicate Filter | TCGA-A6-2679-01A-02D-1406-01 | TCGA-A6-2679-01A-02D-1549-01 |
| TCGA-A6-2680 | snp__genome_wide_snp_6__broad_mit_edu__Level_2__copynumber_byallele__data | Analyte Replicate Filter | TCGA-A6-2680-01A-01D-1406-01 | TCGA-A6-2680-01A-01D-1549-01 |
| TCGA-A6-2686 | snp__genome_wide_snp_6__broad_mit_edu__Level_2__copynumber_byallele__data | Analyte Replicate Filter | TCGA-A6-2686-01A-01D-1406-01 | TCGA-A6-2686-01A-01D-1549-01 |
| TCGA-AA-3519 | snp__genome_wide_snp_6__broad_mit_edu__Level_2__copynumber_byallele__data | Analyte Replicate Filter | TCGA-AA-3519-01A-02D-0819-01 | TCGA-AA-3519-01A-02D-1549-01 |
| TCGA-AA-3525 | snp__genome_wide_snp_6__broad_mit_edu__Level_2__copynumber_byallele__data | Analyte Replicate Filter | TCGA-AA-3525-01A-02D-0824-01 | TCGA-AA-3525-01A-02D-1549-01 |
| TCGA-AA-3520 | snp__genome_wide_snp_6__broad_mit_edu__Level_2__copynumber_byallele__data | Analyte Replicate Filter | TCGA-AA-3520-01A-01D-0819-01 | TCGA-AA-3520-01A-01D-1549-01 |
| TCGA-A6-2677 | snp__genome_wide_snp_6__broad_mit_edu__Level_2__copynumber_byallele__data | Analyte Replicate Filter | TCGA-A6-2677-01A-01D-0819-01 | TCGA-A6-2677-01A-01D-1549-01 |
| TCGA-A6-2676 | snp__genome_wide_snp_6__broad_mit_edu__Level_2__copynumber_byallele__data | Analyte Replicate Filter | TCGA-A6-2676-01A-01D-0824-01 | TCGA-A6-2676-01A-01D-1549-01 |
| TCGA-A6-2684 | snp__genome_wide_snp_6__broad_mit_edu__Level_2__copynumber_byallele__data | Analyte Replicate Filter | TCGA-A6-2684-01A-01D-1406-01 | TCGA-A6-2684-01A-01D-1549-01 |
| TCGA-AA-3529 | snp__genome_wide_snp_6__broad_mit_edu__Level_2__copynumber_byallele__data | Analyte Replicate Filter | TCGA-AA-3529-01A-02D-0819-01 | TCGA-AA-3529-01A-02D-1549-01 |
| TCGA-AA-3527 | snp__genome_wide_snp_6__broad_mit_edu__Level_2__copynumber_byallele__data | Analyte Replicate Filter | TCGA-AA-3527-01A-01D-0819-01 | TCGA-AA-3527-01A-01D-1549-01 |
| TCGA-AA-3524 | snp__genome_wide_snp_6__broad_mit_edu__Level_2__copynumber_byallele__data | Analyte Replicate Filter | TCGA-AA-3524-01A-02D-0819-01 | TCGA-AA-3524-01A-02D-1549-01 |
| TCGA-AA-3531 | snp__genome_wide_snp_6__broad_mit_edu__Level_2__copynumber_byallele__data | Analyte Replicate Filter | TCGA-AA-3531-01A-01D-0819-01 | TCGA-AA-3531-01A-01D-1549-01 |
| TCGA-A6-2671 | snp__genome_wide_snp_6__broad_mit_edu__Level_2__copynumber_byallele__data | Analyte Replicate Filter | TCGA-A6-2671-01A-01D-1406-01 | TCGA-A6-2671-01A-01D-1549-01 |
| TCGA-AA-3518 | snp__genome_wide_snp_6__broad_mit_edu__Level_2__copynumber_byallele__data | Analyte Replicate Filter | TCGA-AA-3518-01A-02D-0824-01 | TCGA-AA-3518-01A-02D-1549-01 |
| TCGA-AA-3517 | snp__genome_wide_snp_6__broad_mit_edu__Level_2__copynumber_byallele__data | Analyte Replicate Filter | TCGA-AA-3517-01A-01D-0819-01 | TCGA-AA-3517-01A-01D-1549-01 |
| TCGA-AA-3530 | snp__genome_wide_snp_6__broad_mit_edu__Level_2__copynumber_byallele__data | Analyte Replicate Filter | TCGA-AA-3530-01A-01D-1018-01 | TCGA-AA-3530-01A-01D-1549-01 |
| TCGA-A6-2674 | snp__genome_wide_snp_6__broad_mit_edu__Level_2__copynumber_byallele__data | Analyte Replicate Filter | TCGA-A6-2674-01A-02D-0819-01 | TCGA-A6-2674-01A-02D-1549-01 |
| TCGA-AA-3516 | snp__genome_wide_snp_6__broad_mit_edu__Level_2__copynumber_byallele__data | Analyte Replicate Filter | TCGA-AA-3516-01A-02D-0824-01 | TCGA-AA-3516-01A-02D-1549-01 |
| TCGA-A6-2685 | snp__genome_wide_snp_6__broad_mit_edu__Level_2__copynumber_byallele__data | Analyte Replicate Filter | TCGA-A6-2685-01A-01D-1406-01 | TCGA-A6-2685-01A-01D-1549-01 |
| TCGA-AA-3514 | snp__genome_wide_snp_6__broad_mit_edu__Level_2__copynumber_byallele__data | Analyte Replicate Filter | TCGA-AA-3514-01A-02D-0819-01 | TCGA-AA-3514-01A-02D-1549-01 |
| TCGA-A6-2683 | snp__genome_wide_snp_6__broad_mit_edu__Level_2__copynumber_byallele__data | Analyte Replicate Filter | TCGA-A6-2683-01A-01D-0819-01 | TCGA-A6-2683-01A-01D-1549-01 |
| TCGA-A6-3810 | snp__genome_wide_snp_6__broad_mit_edu__Level_2__invariantset_medianpolish__data | Analyte Replicate Filter | TCGA-A6-3810-01A-01D-1018-01 | TCGA-A6-3810-01B-04D-A274-01 |
| TCGA-A6-2682 | snp__genome_wide_snp_6__broad_mit_edu__Level_2__invariantset_medianpolish__data | Analyte Replicate Filter | TCGA-A6-2682-01A-01D-1406-01 | TCGA-A6-2682-01A-01D-1549-01 |
| TCGA-AA-3522 | snp__genome_wide_snp_6__broad_mit_edu__Level_2__invariantset_medianpolish__data | Analyte Replicate Filter | TCGA-AA-3522-01A-01D-0819-01 | TCGA-AA-3522-01A-01D-1549-01 |
| TCGA-AA-3521 | snp__genome_wide_snp_6__broad_mit_edu__Level_2__invariantset_medianpolish__data | Analyte Replicate Filter | TCGA-AA-3521-01A-01D-0819-01 | TCGA-AA-3521-01A-01D-1549-01 |
| TCGA-AA-3530 | snp__genome_wide_snp_6__broad_mit_edu__Level_2__invariantset_medianpolish__data | Analyte Replicate Filter | TCGA-AA-3530-01A-01D-1018-01 | TCGA-AA-3530-01A-01D-1549-01 |
| TCGA-A6-5656 | snp__genome_wide_snp_6__broad_mit_edu__Level_2__invariantset_medianpolish__data | Analyte Replicate Filter | TCGA-A6-5656-01A-21D-1834-01 | TCGA-A6-5656-01B-02D-A274-01 |
| TCGA-AA-3534 | snp__genome_wide_snp_6__broad_mit_edu__Level_2__invariantset_medianpolish__data | Analyte Replicate Filter | TCGA-AA-3534-01A-01D-0819-01 | TCGA-AA-3534-01A-01D-1549-01 |
| TCGA-A6-2685 | snp__genome_wide_snp_6__broad_mit_edu__Level_2__invariantset_medianpolish__data | Analyte Replicate Filter | TCGA-A6-2685-01A-01D-1406-01 | TCGA-A6-2685-01A-01D-1549-01 |
| TCGA-A6-2672 | snp__genome_wide_snp_6__broad_mit_edu__Level_2__invariantset_medianpolish__data | Analyte Replicate Filter | TCGA-A6-2672-01A-01D-0824-01 | TCGA-A6-2672-01A-01D-1549-01 |
| TCGA-A6-4107 | snp__genome_wide_snp_6__broad_mit_edu__Level_2__invariantset_medianpolish__data | Analyte Replicate Filter | TCGA-A6-4107-01A-02D-1406-01 | TCGA-A6-4107-01A-02D-1549-01 |
| TCGA-AA-3532 | snp__genome_wide_snp_6__broad_mit_edu__Level_2__invariantset_medianpolish__data | Analyte Replicate Filter | TCGA-AA-3532-01A-01D-0819-01 | TCGA-AA-3532-01A-01D-1549-01 |
| TCGA-A6-2678 | snp__genome_wide_snp_6__broad_mit_edu__Level_2__invariantset_medianpolish__data | Analyte Replicate Filter | TCGA-A6-2678-01A-01D-0819-01 | TCGA-A6-2678-01A-01D-1549-01 |
| TCGA-A6-3809 | snp__genome_wide_snp_6__broad_mit_edu__Level_2__invariantset_medianpolish__data | Analyte Replicate Filter | TCGA-A6-3809-01A-01D-1018-01 | TCGA-A6-3809-01B-04D-A274-01 |
| TCGA-A6-6650 | snp__genome_wide_snp_6__broad_mit_edu__Level_2__invariantset_medianpolish__data | Analyte Replicate Filter | TCGA-A6-6650-01A-11D-1770-01 | TCGA-A6-6650-01B-02D-A274-01 |
| TCGA-A6-5659 | snp__genome_wide_snp_6__broad_mit_edu__Level_2__invariantset_medianpolish__data | Analyte Replicate Filter | TCGA-A6-5659-01A-01D-1649-01 | TCGA-A6-5659-01B-04D-A274-01 |
| TCGA-A6-6781 | snp__genome_wide_snp_6__broad_mit_edu__Level_2__invariantset_medianpolish__data | Analyte Replicate Filter | TCGA-A6-6781-01A-22D-1923-01 | TCGA-A6-6781-01B-06D-A274-01 |
| TCGA-A6-2681 | snp__genome_wide_snp_6__broad_mit_edu__Level_2__invariantset_medianpolish__data | Analyte Replicate Filter | TCGA-A6-2681-01A-01D-1406-01 | TCGA-A6-2681-01A-01D-1549-01 |
| TCGA-A6-2679 | snp__genome_wide_snp_6__broad_mit_edu__Level_2__invariantset_medianpolish__data | Analyte Replicate Filter | TCGA-A6-2679-01A-02D-1406-01 | TCGA-A6-2679-01A-02D-1549-01 |
| TCGA-A6-2680 | snp__genome_wide_snp_6__broad_mit_edu__Level_2__invariantset_medianpolish__data | Analyte Replicate Filter | TCGA-A6-2680-01A-01D-1406-01 | TCGA-A6-2680-01A-01D-1549-01 |
| TCGA-A6-2686 | snp__genome_wide_snp_6__broad_mit_edu__Level_2__invariantset_medianpolish__data | Analyte Replicate Filter | TCGA-A6-2686-01A-01D-1406-01 | TCGA-A6-2686-01A-01D-1549-01 |
| TCGA-AA-3519 | snp__genome_wide_snp_6__broad_mit_edu__Level_2__invariantset_medianpolish__data | Analyte Replicate Filter | TCGA-AA-3519-01A-02D-0819-01 | TCGA-AA-3519-01A-02D-1549-01 |
| TCGA-AA-3525 | snp__genome_wide_snp_6__broad_mit_edu__Level_2__invariantset_medianpolish__data | Analyte Replicate Filter | TCGA-AA-3525-01A-02D-0824-01 | TCGA-AA-3525-01A-02D-1549-01 |
| TCGA-AA-3520 | snp__genome_wide_snp_6__broad_mit_edu__Level_2__invariantset_medianpolish__data | Analyte Replicate Filter | TCGA-AA-3520-01A-01D-0819-01 | TCGA-AA-3520-01A-01D-1549-01 |
| TCGA-A6-2677 | snp__genome_wide_snp_6__broad_mit_edu__Level_2__invariantset_medianpolish__data | Analyte Replicate Filter | TCGA-A6-2677-01A-01D-1549-01,TCGA-A6-2677-01A-01D-0819-01 | TCGA-A6-2677-01B-02D-A274-01 |
| TCGA-A6-2676 | snp__genome_wide_snp_6__broad_mit_edu__Level_2__invariantset_medianpolish__data | Analyte Replicate Filter | TCGA-A6-2676-01A-01D-0824-01 | TCGA-A6-2676-01A-01D-1549-01 |
| TCGA-A6-2684 | snp__genome_wide_snp_6__broad_mit_edu__Level_2__invariantset_medianpolish__data | Analyte Replicate Filter | TCGA-A6-2684-01A-01D-1406-01,TCGA-A6-2684-01A-01D-1549-01 | TCGA-A6-2684-01C-08D-A274-01 |
| TCGA-AA-3529 | snp__genome_wide_snp_6__broad_mit_edu__Level_2__invariantset_medianpolish__data | Analyte Replicate Filter | TCGA-AA-3529-01A-02D-0819-01 | TCGA-AA-3529-01A-02D-1549-01 |
| TCGA-AA-3527 | snp__genome_wide_snp_6__broad_mit_edu__Level_2__invariantset_medianpolish__data | Analyte Replicate Filter | TCGA-AA-3527-01A-01D-0819-01 | TCGA-AA-3527-01A-01D-1549-01 |
| TCGA-AA-3524 | snp__genome_wide_snp_6__broad_mit_edu__Level_2__invariantset_medianpolish__data | Analyte Replicate Filter | TCGA-AA-3524-01A-02D-0819-01 | TCGA-AA-3524-01A-02D-1549-01 |
| TCGA-AA-3531 | snp__genome_wide_snp_6__broad_mit_edu__Level_2__invariantset_medianpolish__data | Analyte Replicate Filter | TCGA-AA-3531-01A-01D-0819-01 | TCGA-AA-3531-01A-01D-1549-01 |
| TCGA-A6-2671 | snp__genome_wide_snp_6__broad_mit_edu__Level_2__invariantset_medianpolish__data | Analyte Replicate Filter | TCGA-A6-2671-01A-01D-1406-01 | TCGA-A6-2671-01A-01D-1549-01 |
| TCGA-AA-3518 | snp__genome_wide_snp_6__broad_mit_edu__Level_2__invariantset_medianpolish__data | Analyte Replicate Filter | TCGA-AA-3518-01A-02D-0824-01 | TCGA-AA-3518-01A-02D-1549-01 |
| TCGA-AA-3517 | snp__genome_wide_snp_6__broad_mit_edu__Level_2__invariantset_medianpolish__data | Analyte Replicate Filter | TCGA-AA-3517-01A-01D-0819-01 | TCGA-AA-3517-01A-01D-1549-01 |
| TCGA-AA-3526 | snp__genome_wide_snp_6__broad_mit_edu__Level_2__invariantset_medianpolish__data | Analyte Replicate Filter | TCGA-AA-3526-01A-02D-0819-01 | TCGA-AA-3526-01A-02D-1549-01 |
| TCGA-A6-2674 | snp__genome_wide_snp_6__broad_mit_edu__Level_2__invariantset_medianpolish__data | Analyte Replicate Filter | TCGA-A6-2674-01A-02D-0819-01 | TCGA-A6-2674-01A-02D-1549-01 |
| TCGA-AA-3516 | snp__genome_wide_snp_6__broad_mit_edu__Level_2__invariantset_medianpolish__data | Analyte Replicate Filter | TCGA-AA-3516-01A-02D-0824-01 | TCGA-AA-3516-01A-02D-1549-01 |
| TCGA-AA-3514 | snp__genome_wide_snp_6__broad_mit_edu__Level_2__invariantset_medianpolish__data | Analyte Replicate Filter | TCGA-AA-3514-01A-02D-0819-01 | TCGA-AA-3514-01A-02D-1549-01 |
| TCGA-A6-2683 | snp__genome_wide_snp_6__broad_mit_edu__Level_2__invariantset_medianpolish__data | Analyte Replicate Filter | TCGA-A6-2683-01A-01D-0819-01 | TCGA-A6-2683-01A-01D-1549-01 |
| TCGA-A6-6780 | snp__genome_wide_snp_6__broad_mit_edu__Level_2__invariantset_medianpolish__data | Analyte Replicate Filter | TCGA-A6-6780-01A-11D-1834-01 | TCGA-A6-6780-01B-04D-A274-01 |
| TCGA-A6-2682 | snp__genome_wide_snp_6__broad_mit_edu__Level_3__segmented_scna_minus_germline_cnv_hg18__seg | Analyte Replicate Filter | TCGA-A6-2682-01A-01D-1406-01 | TCGA-A6-2682-01A-01D-1549-01 |
| TCGA-AA-3522 | snp__genome_wide_snp_6__broad_mit_edu__Level_3__segmented_scna_minus_germline_cnv_hg18__seg | Analyte Replicate Filter | TCGA-AA-3522-01A-01D-0819-01 | TCGA-AA-3522-01A-01D-1549-01 |
| TCGA-AA-3521 | snp__genome_wide_snp_6__broad_mit_edu__Level_3__segmented_scna_minus_germline_cnv_hg18__seg | Analyte Replicate Filter | TCGA-AA-3521-01A-01D-0819-01 | TCGA-AA-3521-01A-01D-1549-01 |
| TCGA-A6-2685 | snp__genome_wide_snp_6__broad_mit_edu__Level_3__segmented_scna_minus_germline_cnv_hg18__seg | Analyte Replicate Filter | TCGA-A6-2685-01A-01D-1406-01 | TCGA-A6-2685-01A-01D-1549-01 |
| TCGA-A6-2672 | snp__genome_wide_snp_6__broad_mit_edu__Level_3__segmented_scna_minus_germline_cnv_hg18__seg | Analyte Replicate Filter | TCGA-A6-2672-01A-01D-0824-01 | TCGA-A6-2672-01A-01D-1549-01 |
| TCGA-A6-4107 | snp__genome_wide_snp_6__broad_mit_edu__Level_3__segmented_scna_minus_germline_cnv_hg18__seg | Analyte Replicate Filter | TCGA-A6-4107-01A-02D-1406-01 | TCGA-A6-4107-01A-02D-1549-01 |
| TCGA-AA-3532 | snp__genome_wide_snp_6__broad_mit_edu__Level_3__segmented_scna_minus_germline_cnv_hg18__seg | Analyte Replicate Filter | TCGA-AA-3532-01A-01D-0819-01 | TCGA-AA-3532-01A-01D-1549-01 |
| TCGA-A6-2678 | snp__genome_wide_snp_6__broad_mit_edu__Level_3__segmented_scna_minus_germline_cnv_hg18__seg | Analyte Replicate Filter | TCGA-A6-2678-01A-01D-0819-01 | TCGA-A6-2678-01A-01D-1549-01 |
| TCGA-AA-3534 | snp__genome_wide_snp_6__broad_mit_edu__Level_3__segmented_scna_minus_germline_cnv_hg18__seg | Analyte Replicate Filter | TCGA-AA-3534-01A-01D-0819-01 | TCGA-AA-3534-01A-01D-1549-01 |
| TCGA-AA-3526 | snp__genome_wide_snp_6__broad_mit_edu__Level_3__segmented_scna_minus_germline_cnv_hg18__seg | Analyte Replicate Filter | TCGA-AA-3526-01A-02D-0819-01 | TCGA-AA-3526-01A-02D-1549-01 |
| TCGA-A6-2681 | snp__genome_wide_snp_6__broad_mit_edu__Level_3__segmented_scna_minus_germline_cnv_hg18__seg | Analyte Replicate Filter | TCGA-A6-2681-01A-01D-1406-01 | TCGA-A6-2681-01A-01D-1549-01 |
| TCGA-A6-2679 | snp__genome_wide_snp_6__broad_mit_edu__Level_3__segmented_scna_minus_germline_cnv_hg18__seg | Analyte Replicate Filter | TCGA-A6-2679-01A-02D-1406-01 | TCGA-A6-2679-01A-02D-1549-01 |
| TCGA-A6-2680 | snp__genome_wide_snp_6__broad_mit_edu__Level_3__segmented_scna_minus_germline_cnv_hg18__seg | Analyte Replicate Filter | TCGA-A6-2680-01A-01D-1406-01 | TCGA-A6-2680-01A-01D-1549-01 |
| TCGA-A6-2686 | snp__genome_wide_snp_6__broad_mit_edu__Level_3__segmented_scna_minus_germline_cnv_hg18__seg | Analyte Replicate Filter | TCGA-A6-2686-01A-01D-1406-01 | TCGA-A6-2686-01A-01D-1549-01 |
| TCGA-AA-3519 | snp__genome_wide_snp_6__broad_mit_edu__Level_3__segmented_scna_minus_germline_cnv_hg18__seg | Analyte Replicate Filter | TCGA-AA-3519-01A-02D-0819-01 | TCGA-AA-3519-01A-02D-1549-01 |
| TCGA-AA-3525 | snp__genome_wide_snp_6__broad_mit_edu__Level_3__segmented_scna_minus_germline_cnv_hg18__seg | Analyte Replicate Filter | TCGA-AA-3525-01A-02D-0824-01 | TCGA-AA-3525-01A-02D-1549-01 |
| TCGA-AA-3520 | snp__genome_wide_snp_6__broad_mit_edu__Level_3__segmented_scna_minus_germline_cnv_hg18__seg | Analyte Replicate Filter | TCGA-AA-3520-01A-01D-0819-01 | TCGA-AA-3520-01A-01D-1549-01 |
| TCGA-A6-2677 | snp__genome_wide_snp_6__broad_mit_edu__Level_3__segmented_scna_minus_germline_cnv_hg18__seg | Analyte Replicate Filter | TCGA-A6-2677-01A-01D-0819-01 | TCGA-A6-2677-01A-01D-1549-01 |
| TCGA-A6-2676 | snp__genome_wide_snp_6__broad_mit_edu__Level_3__segmented_scna_minus_germline_cnv_hg18__seg | Analyte Replicate Filter | TCGA-A6-2676-01A-01D-0824-01 | TCGA-A6-2676-01A-01D-1549-01 |
| TCGA-A6-2684 | snp__genome_wide_snp_6__broad_mit_edu__Level_3__segmented_scna_minus_germline_cnv_hg18__seg | Analyte Replicate Filter | TCGA-A6-2684-01A-01D-1406-01 | TCGA-A6-2684-01A-01D-1549-01 |
| TCGA-AA-3529 | snp__genome_wide_snp_6__broad_mit_edu__Level_3__segmented_scna_minus_germline_cnv_hg18__seg | Analyte Replicate Filter | TCGA-AA-3529-01A-02D-0819-01 | TCGA-AA-3529-01A-02D-1549-01 |
| TCGA-AA-3527 | snp__genome_wide_snp_6__broad_mit_edu__Level_3__segmented_scna_minus_germline_cnv_hg18__seg | Analyte Replicate Filter | TCGA-AA-3527-01A-01D-0819-01 | TCGA-AA-3527-01A-01D-1549-01 |
| TCGA-AA-3524 | snp__genome_wide_snp_6__broad_mit_edu__Level_3__segmented_scna_minus_germline_cnv_hg18__seg | Analyte Replicate Filter | TCGA-AA-3524-01A-02D-0819-01 | TCGA-AA-3524-01A-02D-1549-01 |
| TCGA-AA-3531 | snp__genome_wide_snp_6__broad_mit_edu__Level_3__segmented_scna_minus_germline_cnv_hg18__seg | Analyte Replicate Filter | TCGA-AA-3531-01A-01D-0819-01 | TCGA-AA-3531-01A-01D-1549-01 |
| TCGA-A6-2671 | snp__genome_wide_snp_6__broad_mit_edu__Level_3__segmented_scna_minus_germline_cnv_hg18__seg | Analyte Replicate Filter | TCGA-A6-2671-01A-01D-1406-01 | TCGA-A6-2671-01A-01D-1549-01 |
| TCGA-AA-3518 | snp__genome_wide_snp_6__broad_mit_edu__Level_3__segmented_scna_minus_germline_cnv_hg18__seg | Analyte Replicate Filter | TCGA-AA-3518-01A-02D-0824-01 | TCGA-AA-3518-01A-02D-1549-01 |
| TCGA-AA-3517 | snp__genome_wide_snp_6__broad_mit_edu__Level_3__segmented_scna_minus_germline_cnv_hg18__seg | Analyte Replicate Filter | TCGA-AA-3517-01A-01D-0819-01 | TCGA-AA-3517-01A-01D-1549-01 |
| TCGA-AA-3530 | snp__genome_wide_snp_6__broad_mit_edu__Level_3__segmented_scna_minus_germline_cnv_hg18__seg | Analyte Replicate Filter | TCGA-AA-3530-01A-01D-1018-01 | TCGA-AA-3530-01A-01D-1549-01 |
| TCGA-A6-2674 | snp__genome_wide_snp_6__broad_mit_edu__Level_3__segmented_scna_minus_germline_cnv_hg18__seg | Analyte Replicate Filter | TCGA-A6-2674-01A-02D-0819-01 | TCGA-A6-2674-01A-02D-1549-01 |
| TCGA-AA-3516 | snp__genome_wide_snp_6__broad_mit_edu__Level_3__segmented_scna_minus_germline_cnv_hg18__seg | Analyte Replicate Filter | TCGA-AA-3516-01A-02D-0824-01 | TCGA-AA-3516-01A-02D-1549-01 |
| TCGA-AA-3514 | snp__genome_wide_snp_6__broad_mit_edu__Level_3__segmented_scna_minus_germline_cnv_hg18__seg | Analyte Replicate Filter | TCGA-AA-3514-01A-02D-0819-01 | TCGA-AA-3514-01A-02D-1549-01 |
| TCGA-A6-2683 | snp__genome_wide_snp_6__broad_mit_edu__Level_3__segmented_scna_minus_germline_cnv_hg18__seg | Analyte Replicate Filter | TCGA-A6-2683-01A-01D-0819-01 | TCGA-A6-2683-01A-01D-1549-01 |
| TCGA-A6-2682 | snp__genome_wide_snp_6__broad_mit_edu__Level_3__segmented_scna_hg18__seg | Analyte Replicate Filter | TCGA-A6-2682-01A-01D-1406-01 | TCGA-A6-2682-01A-01D-1549-01 |
| TCGA-AA-3522 | snp__genome_wide_snp_6__broad_mit_edu__Level_3__segmented_scna_hg18__seg | Analyte Replicate Filter | TCGA-AA-3522-01A-01D-0819-01 | TCGA-AA-3522-01A-01D-1549-01 |
| TCGA-AA-3521 | snp__genome_wide_snp_6__broad_mit_edu__Level_3__segmented_scna_hg18__seg | Analyte Replicate Filter | TCGA-AA-3521-01A-01D-0819-01 | TCGA-AA-3521-01A-01D-1549-01 |
| TCGA-A6-2685 | snp__genome_wide_snp_6__broad_mit_edu__Level_3__segmented_scna_hg18__seg | Analyte Replicate Filter | TCGA-A6-2685-01A-01D-1406-01 | TCGA-A6-2685-01A-01D-1549-01 |
| TCGA-A6-2672 | snp__genome_wide_snp_6__broad_mit_edu__Level_3__segmented_scna_hg18__seg | Analyte Replicate Filter | TCGA-A6-2672-01A-01D-0824-01 | TCGA-A6-2672-01A-01D-1549-01 |
| TCGA-A6-4107 | snp__genome_wide_snp_6__broad_mit_edu__Level_3__segmented_scna_hg18__seg | Analyte Replicate Filter | TCGA-A6-4107-01A-02D-1406-01 | TCGA-A6-4107-01A-02D-1549-01 |
| TCGA-AA-3532 | snp__genome_wide_snp_6__broad_mit_edu__Level_3__segmented_scna_hg18__seg | Analyte Replicate Filter | TCGA-AA-3532-01A-01D-0819-01 | TCGA-AA-3532-01A-01D-1549-01 |
| TCGA-A6-2678 | snp__genome_wide_snp_6__broad_mit_edu__Level_3__segmented_scna_hg18__seg | Analyte Replicate Filter | TCGA-A6-2678-01A-01D-0819-01 | TCGA-A6-2678-01A-01D-1549-01 |
| TCGA-AA-3534 | snp__genome_wide_snp_6__broad_mit_edu__Level_3__segmented_scna_hg18__seg | Analyte Replicate Filter | TCGA-AA-3534-01A-01D-0819-01 | TCGA-AA-3534-01A-01D-1549-01 |
| TCGA-AA-3526 | snp__genome_wide_snp_6__broad_mit_edu__Level_3__segmented_scna_hg18__seg | Analyte Replicate Filter | TCGA-AA-3526-01A-02D-0819-01 | TCGA-AA-3526-01A-02D-1549-01 |
| TCGA-A6-2681 | snp__genome_wide_snp_6__broad_mit_edu__Level_3__segmented_scna_hg18__seg | Analyte Replicate Filter | TCGA-A6-2681-01A-01D-1406-01 | TCGA-A6-2681-01A-01D-1549-01 |
| TCGA-A6-2679 | snp__genome_wide_snp_6__broad_mit_edu__Level_3__segmented_scna_hg18__seg | Analyte Replicate Filter | TCGA-A6-2679-01A-02D-1406-01 | TCGA-A6-2679-01A-02D-1549-01 |
| TCGA-A6-2680 | snp__genome_wide_snp_6__broad_mit_edu__Level_3__segmented_scna_hg18__seg | Analyte Replicate Filter | TCGA-A6-2680-01A-01D-1406-01 | TCGA-A6-2680-01A-01D-1549-01 |
| TCGA-A6-2686 | snp__genome_wide_snp_6__broad_mit_edu__Level_3__segmented_scna_hg18__seg | Analyte Replicate Filter | TCGA-A6-2686-01A-01D-1406-01 | TCGA-A6-2686-01A-01D-1549-01 |
| TCGA-AA-3519 | snp__genome_wide_snp_6__broad_mit_edu__Level_3__segmented_scna_hg18__seg | Analyte Replicate Filter | TCGA-AA-3519-01A-02D-0819-01 | TCGA-AA-3519-01A-02D-1549-01 |
| TCGA-AA-3525 | snp__genome_wide_snp_6__broad_mit_edu__Level_3__segmented_scna_hg18__seg | Analyte Replicate Filter | TCGA-AA-3525-01A-02D-0824-01 | TCGA-AA-3525-01A-02D-1549-01 |
| TCGA-AA-3520 | snp__genome_wide_snp_6__broad_mit_edu__Level_3__segmented_scna_hg18__seg | Analyte Replicate Filter | TCGA-AA-3520-01A-01D-0819-01 | TCGA-AA-3520-01A-01D-1549-01 |
| TCGA-A6-2677 | snp__genome_wide_snp_6__broad_mit_edu__Level_3__segmented_scna_hg18__seg | Analyte Replicate Filter | TCGA-A6-2677-01A-01D-0819-01 | TCGA-A6-2677-01A-01D-1549-01 |
| TCGA-A6-2676 | snp__genome_wide_snp_6__broad_mit_edu__Level_3__segmented_scna_hg18__seg | Analyte Replicate Filter | TCGA-A6-2676-01A-01D-0824-01 | TCGA-A6-2676-01A-01D-1549-01 |
| TCGA-A6-2684 | snp__genome_wide_snp_6__broad_mit_edu__Level_3__segmented_scna_hg18__seg | Analyte Replicate Filter | TCGA-A6-2684-01A-01D-1406-01 | TCGA-A6-2684-01A-01D-1549-01 |
| TCGA-AA-3529 | snp__genome_wide_snp_6__broad_mit_edu__Level_3__segmented_scna_hg18__seg | Analyte Replicate Filter | TCGA-AA-3529-01A-02D-0819-01 | TCGA-AA-3529-01A-02D-1549-01 |
| TCGA-AA-3527 | snp__genome_wide_snp_6__broad_mit_edu__Level_3__segmented_scna_hg18__seg | Analyte Replicate Filter | TCGA-AA-3527-01A-01D-0819-01 | TCGA-AA-3527-01A-01D-1549-01 |
| TCGA-AA-3524 | snp__genome_wide_snp_6__broad_mit_edu__Level_3__segmented_scna_hg18__seg | Analyte Replicate Filter | TCGA-AA-3524-01A-02D-0819-01 | TCGA-AA-3524-01A-02D-1549-01 |
| TCGA-AA-3531 | snp__genome_wide_snp_6__broad_mit_edu__Level_3__segmented_scna_hg18__seg | Analyte Replicate Filter | TCGA-AA-3531-01A-01D-0819-01 | TCGA-AA-3531-01A-01D-1549-01 |
| TCGA-A6-2671 | snp__genome_wide_snp_6__broad_mit_edu__Level_3__segmented_scna_hg18__seg | Analyte Replicate Filter | TCGA-A6-2671-01A-01D-1406-01 | TCGA-A6-2671-01A-01D-1549-01 |
| TCGA-AA-3518 | snp__genome_wide_snp_6__broad_mit_edu__Level_3__segmented_scna_hg18__seg | Analyte Replicate Filter | TCGA-AA-3518-01A-02D-0824-01 | TCGA-AA-3518-01A-02D-1549-01 |
| TCGA-AA-3517 | snp__genome_wide_snp_6__broad_mit_edu__Level_3__segmented_scna_hg18__seg | Analyte Replicate Filter | TCGA-AA-3517-01A-01D-0819-01 | TCGA-AA-3517-01A-01D-1549-01 |
| TCGA-AA-3530 | snp__genome_wide_snp_6__broad_mit_edu__Level_3__segmented_scna_hg18__seg | Analyte Replicate Filter | TCGA-AA-3530-01A-01D-1018-01 | TCGA-AA-3530-01A-01D-1549-01 |
| TCGA-A6-2674 | snp__genome_wide_snp_6__broad_mit_edu__Level_3__segmented_scna_hg18__seg | Analyte Replicate Filter | TCGA-A6-2674-01A-02D-0819-01 | TCGA-A6-2674-01A-02D-1549-01 |
| TCGA-AA-3516 | snp__genome_wide_snp_6__broad_mit_edu__Level_3__segmented_scna_hg18__seg | Analyte Replicate Filter | TCGA-AA-3516-01A-02D-0824-01 | TCGA-AA-3516-01A-02D-1549-01 |
| TCGA-AA-3514 | snp__genome_wide_snp_6__broad_mit_edu__Level_3__segmented_scna_hg18__seg | Analyte Replicate Filter | TCGA-AA-3514-01A-02D-0819-01 | TCGA-AA-3514-01A-02D-1549-01 |
| TCGA-A6-2683 | snp__genome_wide_snp_6__broad_mit_edu__Level_3__segmented_scna_hg18__seg | Analyte Replicate Filter | TCGA-A6-2683-01A-01D-0819-01 | TCGA-A6-2683-01A-01D-1549-01 |
Table S4.
| Participant Id | DataType__Platform__Center__DataLevel__ProtocolName_Extension | Filter Reason | Removed Sample(s) | Chosen Sample |
|---|---|---|---|---|
| TCGA-GS-6633 | snp__genome_wide_snp_6__broad_mit_edu__Level_2__invariantset_medianpolish__data | Sort Replicate Filter | TCGA-GS-6633-10A-01D-1782-01 | TCGA-GS-6633-10B-01D-1782-01 |
| TCGA-GS-6634 | snp__genome_wide_snp_6__broad_mit_edu__Level_2__invariantset_medianpolish__data | Sort Replicate Filter | TCGA-GS-6634-10A-01D-1782-01 | TCGA-GS-6634-10B-01D-1782-01 |
| TCGA-GS-6633 | snp__genome_wide_snp_6__broad_mit_edu__Level_3__segmented_scna_hg18__seg | Sort Replicate Filter | TCGA-GS-6633-10A-01D-1782-01 | TCGA-GS-6633-10B-01D-1782-01 |
| TCGA-GS-6634 | snp__genome_wide_snp_6__broad_mit_edu__Level_3__segmented_scna_hg18__seg | Sort Replicate Filter | TCGA-GS-6634-10A-01D-1782-01 | TCGA-GS-6634-10B-01D-1782-01 |
| TCGA-GS-6633 | snp__genome_wide_snp_6__broad_mit_edu__Level_3__segmented_scna_minus_germline_cnv_hg18__seg | Sort Replicate Filter | TCGA-GS-6633-10A-01D-1782-01 | TCGA-GS-6633-10B-01D-1782-01 |
| TCGA-GS-6634 | snp__genome_wide_snp_6__broad_mit_edu__Level_3__segmented_scna_minus_germline_cnv_hg18__seg | Sort Replicate Filter | TCGA-GS-6634-10A-01D-1782-01 | TCGA-GS-6634-10B-01D-1782-01 |
| TCGA-GS-6633 | snp__genome_wide_snp_6__broad_mit_edu__Level_2__raw_copynumber__data | Sort Replicate Filter | TCGA-GS-6633-10A-01D-1782-01 | TCGA-GS-6633-10B-01D-1782-01 |
| TCGA-GS-6634 | snp__genome_wide_snp_6__broad_mit_edu__Level_2__raw_copynumber__data | Sort Replicate Filter | TCGA-GS-6634-10A-01D-1782-01 | TCGA-GS-6634-10B-01D-1782-01 |
| TCGA-GS-6633 | snp__genome_wide_snp_6__broad_mit_edu__Level_3__segmented_scna_minus_germline_cnv_hg19__seg | Sort Replicate Filter | TCGA-GS-6633-10A-01D-1782-01 | TCGA-GS-6633-10B-01D-1782-01 |
| TCGA-GS-6634 | snp__genome_wide_snp_6__broad_mit_edu__Level_3__segmented_scna_minus_germline_cnv_hg19__seg | Sort Replicate Filter | TCGA-GS-6634-10A-01D-1782-01 | TCGA-GS-6634-10B-01D-1782-01 |
| TCGA-GS-6633 | snp__genome_wide_snp_6__broad_mit_edu__Level_3__segmented_scna_hg19__seg | Sort Replicate Filter | TCGA-GS-6633-10A-01D-1782-01 | TCGA-GS-6633-10B-01D-1782-01 |
| TCGA-GS-6634 | snp__genome_wide_snp_6__broad_mit_edu__Level_3__segmented_scna_hg19__seg | Sort Replicate Filter | TCGA-GS-6634-10A-01D-1782-01 | TCGA-GS-6634-10B-01D-1782-01 |
| TCGA-GS-6633 | snp__genome_wide_snp_6__broad_mit_edu__Level_2__birdseed_genotype__birdseed | Sort Replicate Filter | TCGA-GS-6633-10A-01D-1782-01 | TCGA-GS-6633-10B-01D-1782-01 |
| TCGA-GS-6634 | snp__genome_wide_snp_6__broad_mit_edu__Level_2__birdseed_genotype__birdseed | Sort Replicate Filter | TCGA-GS-6634-10A-01D-1782-01 | TCGA-GS-6634-10B-01D-1782-01 |
| TCGA-GS-6633 | snp__genome_wide_snp_6__broad_mit_edu__Level_2__byallele_copynumber__data | Sort Replicate Filter | TCGA-GS-6633-10A-01D-1782-01 | TCGA-GS-6633-10B-01D-1782-01 |
| TCGA-GS-6634 | snp__genome_wide_snp_6__broad_mit_edu__Level_2__byallele_copynumber__data | Sort Replicate Filter | TCGA-GS-6634-10A-01D-1782-01 | TCGA-GS-6634-10B-01D-1782-01 |
| TCGA-GS-6633 | snp__genome_wide_snp_6__broad_mit_edu__Level_2__tangent_copynumber__data | Sort Replicate Filter | TCGA-GS-6633-10A-01D-1782-01 | TCGA-GS-6633-10B-01D-1782-01 |
| TCGA-GS-6634 | snp__genome_wide_snp_6__broad_mit_edu__Level_2__tangent_copynumber__data | Sort Replicate Filter | TCGA-GS-6634-10A-01D-1782-01 | TCGA-GS-6634-10B-01D-1782-01 |
Table S5.
| Participant Id | DataType__Platform__Center__DataLevel__ProtocolName_Extension | Filter Reason | Removed Sample(s) | Chosen Sample |
|---|---|---|---|---|
| TCGA-06-0129 | snp__genome_wide_snp_6__broad_mit_edu__Level_3__segmented_scna_hg19__seg | Analyte Replicate Filter | TCGA-06-0129-10A-01G-0289-01 | TCGA-06-0129-10A-01D-0214-01 |
| TCGA-06-0141 | snp__genome_wide_snp_6__broad_mit_edu__Level_3__segmented_scna_hg19__seg | Analyte Replicate Filter | TCGA-06-0141-10A-01G-0289-01 | TCGA-06-0141-10A-01D-0214-01 |
| TCGA-06-0143 | snp__genome_wide_snp_6__broad_mit_edu__Level_3__segmented_scna_hg19__seg | Analyte Replicate Filter | TCGA-06-0143-10A-01G-0289-01 | TCGA-06-0143-10A-01D-0214-01 |
| TCGA-06-0147 | snp__genome_wide_snp_6__broad_mit_edu__Level_3__segmented_scna_hg19__seg | Analyte Replicate Filter | TCGA-06-0147-10A-01D-0214-01 | TCGA-06-0147-10A-01D-0237-01 |
| TCGA-06-0128 | snp__genome_wide_snp_6__broad_mit_edu__Level_3__segmented_scna_hg19__seg | Analyte Replicate Filter | TCGA-06-0128-10A-01G-0289-01 | TCGA-06-0128-10A-01D-0214-01 |
| TCGA-06-0166 | snp__genome_wide_snp_6__broad_mit_edu__Level_3__segmented_scna_hg19__seg | Analyte Replicate Filter | TCGA-06-0166-01A-01G-0289-01 | TCGA-06-0166-01A-01D-0236-01 |
| TCGA-06-0126 | snp__genome_wide_snp_6__broad_mit_edu__Level_3__segmented_scna_hg19__seg | Analyte Replicate Filter | TCGA-06-0126-10A-01G-0289-01 | TCGA-06-0126-10A-01D-0214-01 |
| TCGA-06-0124 | snp__genome_wide_snp_6__broad_mit_edu__Level_3__segmented_scna_hg19__seg | Analyte Replicate Filter | TCGA-06-0124-10A-01G-0289-01 | TCGA-06-0124-10A-01D-0214-01 |
| TCGA-06-0130 | snp__genome_wide_snp_6__broad_mit_edu__Level_3__segmented_scna_hg19__seg | Analyte Replicate Filter | TCGA-06-0130-01A-01G-0289-01 | TCGA-06-0130-01A-01D-0214-01 |
| TCGA-06-0125 | snp__genome_wide_snp_6__broad_mit_edu__Level_3__segmented_scna_hg19__seg | Analyte Replicate Filter | TCGA-06-0125-10A-01G-0289-01 | TCGA-06-0125-10A-01D-0214-01 |
| TCGA-06-0126 | snp__genome_wide_snp_6__broad_mit_edu__Level_3__segmented_scna_hg19__seg | Analyte Replicate Filter | TCGA-06-0126-01A-01G-0289-01 | TCGA-06-0126-01A-01D-0214-01 |
| TCGA-06-0143 | snp__genome_wide_snp_6__broad_mit_edu__Level_3__segmented_scna_hg19__seg | Analyte Replicate Filter | TCGA-06-0143-01A-01G-0289-01 | TCGA-06-0143-01A-01D-0214-01 |
| TCGA-06-0141 | snp__genome_wide_snp_6__broad_mit_edu__Level_3__segmented_scna_hg19__seg | Analyte Replicate Filter | TCGA-06-0141-01A-01G-0289-01 | TCGA-06-0141-01A-01D-0214-01 |
| TCGA-06-0125 | snp__genome_wide_snp_6__broad_mit_edu__Level_3__segmented_scna_hg19__seg | Analyte Replicate Filter | TCGA-06-0125-01A-01G-0289-01 | TCGA-06-0125-01A-01D-0214-01 |
| TCGA-06-0122 | snp__genome_wide_snp_6__broad_mit_edu__Level_3__segmented_scna_hg19__seg | Analyte Replicate Filter | TCGA-06-0122-01A-01G-0289-01 | TCGA-06-0122-01A-01D-0214-01 |
| TCGA-06-0130 | snp__genome_wide_snp_6__broad_mit_edu__Level_3__segmented_scna_hg19__seg | Analyte Replicate Filter | TCGA-06-0130-10A-01G-0289-01 | TCGA-06-0130-10A-01D-0214-01 |
| TCGA-06-0124 | snp__genome_wide_snp_6__broad_mit_edu__Level_3__segmented_scna_hg19__seg | Analyte Replicate Filter | TCGA-06-0124-01A-01G-0289-01 | TCGA-06-0124-01A-01D-0214-01 |
| TCGA-06-0128 | snp__genome_wide_snp_6__broad_mit_edu__Level_3__segmented_scna_hg19__seg | Analyte Replicate Filter | TCGA-06-0128-01A-01G-0289-01 | TCGA-06-0128-01A-01D-0214-01 |
| TCGA-06-0216 | snp__genome_wide_snp_6__broad_mit_edu__Level_3__segmented_scna_hg19__seg | Analyte Replicate Filter | TCGA-06-0216-10A-01D-0237-01 | TCGA-06-0216-10A-01D-0333-01 |
| TCGA-06-0147 | snp__humanhap550__hudsonalpha_org__Level_2__Normal_LogR__data | Analyte Replicate Filter | TCGA-06-0147-10A-01D-0216-06 | TCGA-06-0147-10A-01D-0241-06 |
| TCGA-06-0148 | snp__humanhap550__hudsonalpha_org__Level_2__Normal_LogR__data | Analyte Replicate Filter | TCGA-06-0148-10A-01D-0216-06 | TCGA-06-0148-10A-01D-0241-06 |
| TCGA-06-0147 | snp__humanhap550__hudsonalpha_org__Level_2__genotyping__data | Analyte Replicate Filter | TCGA-06-0147-10A-01D-0216-06 | TCGA-06-0147-10A-01D-0241-06 |
| TCGA-06-0148 | snp__humanhap550__hudsonalpha_org__Level_2__genotyping__data | Analyte Replicate Filter | TCGA-06-0148-10A-01D-0216-06 | TCGA-06-0148-10A-01D-0241-06 |
| TCGA-06-0129 | snp__genome_wide_snp_6__broad_mit_edu__Level_2__copynumber_byallele__data | Analyte Replicate Filter | TCGA-06-0129-10A-01G-0289-01 | TCGA-06-0129-10A-01D-0214-01 |
| TCGA-06-0141 | snp__genome_wide_snp_6__broad_mit_edu__Level_2__copynumber_byallele__data | Analyte Replicate Filter | TCGA-06-0141-10A-01G-0289-01 | TCGA-06-0141-10A-01D-0214-01 |
| TCGA-06-0126 | snp__genome_wide_snp_6__broad_mit_edu__Level_2__copynumber_byallele__data | Analyte Replicate Filter | TCGA-06-0126-01A-01G-0289-01 | TCGA-06-0126-01A-01D-0214-01 |
| TCGA-06-0143 | snp__genome_wide_snp_6__broad_mit_edu__Level_2__copynumber_byallele__data | Analyte Replicate Filter | TCGA-06-0143-10A-01G-0289-01 | TCGA-06-0143-10A-01D-0214-01 |
| TCGA-06-0147 | snp__genome_wide_snp_6__broad_mit_edu__Level_2__copynumber_byallele__data | Analyte Replicate Filter | TCGA-06-0147-10A-01D-0214-01 | TCGA-06-0147-10A-01D-0237-01 |
| TCGA-06-0128 | snp__genome_wide_snp_6__broad_mit_edu__Level_2__copynumber_byallele__data | Analyte Replicate Filter | TCGA-06-0128-10A-01G-0289-01 | TCGA-06-0128-10A-01D-0214-01 |
| TCGA-06-0166 | snp__genome_wide_snp_6__broad_mit_edu__Level_2__copynumber_byallele__data | Analyte Replicate Filter | TCGA-06-0166-01A-01G-0289-01 | TCGA-06-0166-01A-01D-0236-01 |
| TCGA-06-0122 | snp__genome_wide_snp_6__broad_mit_edu__Level_2__copynumber_byallele__data | Analyte Replicate Filter | TCGA-06-0122-10A-01G-0289-01 | TCGA-06-0122-10A-01D-0214-01 |
| TCGA-06-0137 | snp__genome_wide_snp_6__broad_mit_edu__Level_2__copynumber_byallele__data | Sort Replicate Filter | TCGA-06-0137-01A-01D-0214-01,TCGA-06-0137-01A-02D-0214-01 | TCGA-06-0137-01B-02D-0214-01 |
| TCGA-06-0126 | snp__genome_wide_snp_6__broad_mit_edu__Level_2__copynumber_byallele__data | Analyte Replicate Filter | TCGA-06-0126-10A-01G-0289-01 | TCGA-06-0126-10A-01D-0214-01 |
| TCGA-06-0124 | snp__genome_wide_snp_6__broad_mit_edu__Level_2__copynumber_byallele__data | Analyte Replicate Filter | TCGA-06-0124-10A-01G-0289-01 | TCGA-06-0124-10A-01D-0214-01 |
| TCGA-06-0130 | snp__genome_wide_snp_6__broad_mit_edu__Level_2__copynumber_byallele__data | Analyte Replicate Filter | TCGA-06-0130-01A-01G-0289-01 | TCGA-06-0130-01A-01D-0214-01 |
| TCGA-06-0125 | snp__genome_wide_snp_6__broad_mit_edu__Level_2__copynumber_byallele__data | Analyte Replicate Filter | TCGA-06-0125-10A-01G-0289-01 | TCGA-06-0125-10A-01D-0214-01 |
| TCGA-06-0129 | snp__genome_wide_snp_6__broad_mit_edu__Level_2__copynumber_byallele__data | Analyte Replicate Filter | TCGA-06-0129-01A-01G-0289-01 | TCGA-06-0129-01A-01D-0214-01 |
| TCGA-06-0128 | snp__genome_wide_snp_6__broad_mit_edu__Level_2__copynumber_byallele__data | Analyte Replicate Filter | TCGA-06-0128-01A-01G-0289-01 | TCGA-06-0128-01A-01D-0214-01 |
| TCGA-06-0143 | snp__genome_wide_snp_6__broad_mit_edu__Level_2__copynumber_byallele__data | Analyte Replicate Filter | TCGA-06-0143-01A-01G-0289-01 | TCGA-06-0143-01A-01D-0214-01 |
| TCGA-06-0141 | snp__genome_wide_snp_6__broad_mit_edu__Level_2__copynumber_byallele__data | Analyte Replicate Filter | TCGA-06-0141-01A-01G-0289-01 | TCGA-06-0141-01A-01D-0214-01 |
| TCGA-06-0125 | snp__genome_wide_snp_6__broad_mit_edu__Level_2__copynumber_byallele__data | Analyte Replicate Filter | TCGA-06-0125-01A-01G-0289-01 | TCGA-06-0125-01A-01D-0214-01 |
| TCGA-06-0122 | snp__genome_wide_snp_6__broad_mit_edu__Level_2__copynumber_byallele__data | Analyte Replicate Filter | TCGA-06-0122-01A-01G-0289-01 | TCGA-06-0122-01A-01D-0214-01 |
| TCGA-06-0130 | snp__genome_wide_snp_6__broad_mit_edu__Level_2__copynumber_byallele__data | Analyte Replicate Filter | TCGA-06-0130-10A-01G-0289-01 | TCGA-06-0130-10A-01D-0214-01 |
| TCGA-06-0124 | snp__genome_wide_snp_6__broad_mit_edu__Level_2__copynumber_byallele__data | Analyte Replicate Filter | TCGA-06-0124-01A-01G-0289-01 | TCGA-06-0124-01A-01D-0214-01 |
| TCGA-06-0216 | snp__genome_wide_snp_6__broad_mit_edu__Level_2__copynumber_byallele__data | Analyte Replicate Filter | TCGA-06-0216-10A-01D-0237-01 | TCGA-06-0216-10A-01D-0333-01 |
| TCGA-06-0145 | snp__genome_wide_snp_6__broad_mit_edu__Level_2__copynumber_byallele__data | Sort Replicate Filter | TCGA-06-0145-01A-02D-0214-01,TCGA-06-0145-01A-03D-0214-01,TCGA-06-0145-01A-04D-0214-01,TCGA-06-0145-01A-05D-0214-01 | TCGA-06-0145-01A-06D-0214-01 |
| TCGA-06-0129 | snp__genome_wide_snp_6__broad_mit_edu__Level_2__byallele_copynumber__data | Analyte Replicate Filter | TCGA-06-0129-10A-01G-0289-01 | TCGA-06-0129-10A-01D-0214-01 |
| TCGA-06-0141 | snp__genome_wide_snp_6__broad_mit_edu__Level_2__byallele_copynumber__data | Analyte Replicate Filter | TCGA-06-0141-10A-01G-0289-01 | TCGA-06-0141-10A-01D-0214-01 |
| TCGA-06-0143 | snp__genome_wide_snp_6__broad_mit_edu__Level_2__byallele_copynumber__data | Analyte Replicate Filter | TCGA-06-0143-10A-01G-0289-01 | TCGA-06-0143-10A-01D-0214-01 |
| TCGA-06-0147 | snp__genome_wide_snp_6__broad_mit_edu__Level_2__byallele_copynumber__data | Analyte Replicate Filter | TCGA-06-0147-10A-01D-0214-01 | TCGA-06-0147-10A-01D-0237-01 |
| TCGA-06-0128 | snp__genome_wide_snp_6__broad_mit_edu__Level_2__byallele_copynumber__data | Analyte Replicate Filter | TCGA-06-0128-10A-01G-0289-01 | TCGA-06-0128-10A-01D-0214-01 |
| TCGA-06-0166 | snp__genome_wide_snp_6__broad_mit_edu__Level_2__byallele_copynumber__data | Analyte Replicate Filter | TCGA-06-0166-01A-01G-0289-01 | TCGA-06-0166-01A-01D-0236-01 |
| TCGA-06-0122 | snp__genome_wide_snp_6__broad_mit_edu__Level_2__byallele_copynumber__data | Analyte Replicate Filter | TCGA-06-0122-10A-01G-0289-01 | TCGA-06-0122-10A-01D-0214-01 |
| TCGA-06-0126 | snp__genome_wide_snp_6__broad_mit_edu__Level_2__byallele_copynumber__data | Analyte Replicate Filter | TCGA-06-0126-10A-01G-0289-01 | TCGA-06-0126-10A-01D-0214-01 |
| TCGA-06-0124 | snp__genome_wide_snp_6__broad_mit_edu__Level_2__byallele_copynumber__data | Analyte Replicate Filter | TCGA-06-0124-10A-01G-0289-01 | TCGA-06-0124-10A-01D-0214-01 |
| TCGA-06-0130 | snp__genome_wide_snp_6__broad_mit_edu__Level_2__byallele_copynumber__data | Analyte Replicate Filter | TCGA-06-0130-01A-01G-0289-01 | TCGA-06-0130-01A-01D-0214-01 |
| TCGA-06-0125 | snp__genome_wide_snp_6__broad_mit_edu__Level_2__byallele_copynumber__data | Analyte Replicate Filter | TCGA-06-0125-10A-01G-0289-01 | TCGA-06-0125-10A-01D-0214-01 |
| TCGA-06-0129 | snp__genome_wide_snp_6__broad_mit_edu__Level_2__byallele_copynumber__data | Analyte Replicate Filter | TCGA-06-0129-01A-01G-0289-01 | TCGA-06-0129-01A-01D-0214-01 |
| TCGA-06-0126 | snp__genome_wide_snp_6__broad_mit_edu__Level_2__byallele_copynumber__data | Analyte Replicate Filter | TCGA-06-0126-01A-01G-0289-01 | TCGA-06-0126-01A-01D-0214-01 |
| TCGA-06-0143 | snp__genome_wide_snp_6__broad_mit_edu__Level_2__byallele_copynumber__data | Analyte Replicate Filter | TCGA-06-0143-01A-01G-0289-01 | TCGA-06-0143-01A-01D-0214-01 |
| TCGA-06-0141 | snp__genome_wide_snp_6__broad_mit_edu__Level_2__byallele_copynumber__data | Analyte Replicate Filter | TCGA-06-0141-01A-01G-0289-01 | TCGA-06-0141-01A-01D-0214-01 |
| TCGA-06-0125 | snp__genome_wide_snp_6__broad_mit_edu__Level_2__byallele_copynumber__data | Analyte Replicate Filter | TCGA-06-0125-01A-01G-0289-01 | TCGA-06-0125-01A-01D-0214-01 |
| TCGA-06-0122 | snp__genome_wide_snp_6__broad_mit_edu__Level_2__byallele_copynumber__data | Analyte Replicate Filter | TCGA-06-0122-01A-01G-0289-01 | TCGA-06-0122-01A-01D-0214-01 |
| TCGA-06-0130 | snp__genome_wide_snp_6__broad_mit_edu__Level_2__byallele_copynumber__data | Analyte Replicate Filter | TCGA-06-0130-10A-01G-0289-01 | TCGA-06-0130-10A-01D-0214-01 |
| TCGA-06-0124 | snp__genome_wide_snp_6__broad_mit_edu__Level_2__byallele_copynumber__data | Analyte Replicate Filter | TCGA-06-0124-01A-01G-0289-01 | TCGA-06-0124-01A-01D-0214-01 |
| TCGA-06-0128 | snp__genome_wide_snp_6__broad_mit_edu__Level_2__byallele_copynumber__data | Analyte Replicate Filter | TCGA-06-0128-01A-01G-0289-01 | TCGA-06-0128-01A-01D-0214-01 |
| TCGA-06-0216 | snp__genome_wide_snp_6__broad_mit_edu__Level_2__byallele_copynumber__data | Analyte Replicate Filter | TCGA-06-0216-10A-01D-0237-01 | TCGA-06-0216-10A-01D-0333-01 |
| TCGA-06-0148 | transcriptome__agilentg4502a_07_1__unc_edu__Level_2__unc_lowess_normalization_probe_level__data | Sort Replicate Filter | TCGA-06-0148-01A-04R-0229-07,TCGA-06-0148-01A-03R-0229-07 | TCGA-06-0148-01A-05R-0229-07 |
| TCGA-06-0156 | transcriptome__agilentg4502a_07_1__unc_edu__Level_2__unc_lowess_normalization_probe_level__data | Sort Replicate Filter | TCGA-06-0156-01A-02R-0229-07 | TCGA-06-0156-01A-03R-0229-07 |
| TCGA-06-0137 | transcriptome__agilentg4502a_07_1__unc_edu__Level_2__unc_lowess_normalization_probe_level__data | Sort Replicate Filter | TCGA-06-0137-01A-02R-0213-07,TCGA-06-0137-01A-01R-0213-07 | TCGA-06-0137-01B-02R-0213-07 |
| TCGA-06-0145 | transcriptome__agilentg4502a_07_1__unc_edu__Level_2__unc_lowess_normalization_probe_level__data | Sort Replicate Filter | TCGA-06-0145-01A-02R-0213-07,TCGA-06-0145-01A-03R-0213-07,TCGA-06-0145-01A-05R-0213-07,TCGA-06-0145-01A-04R-0213-07 | TCGA-06-0145-01A-06R-0213-07 |
| TCGA-06-0148 | methylation__illuminadnamethylation_oma002_cpi__jhu_usc_edu__Level_1__within_bioassay_data_set_function__data | Sort Replicate Filter | TCGA-06-0148-01A-04D-0242-05,TCGA-06-0148-01A-03D-0242-05 | TCGA-06-0148-01A-05D-0242-05 |
| TCGA-06-0156 | methylation__illuminadnamethylation_oma002_cpi__jhu_usc_edu__Level_1__within_bioassay_data_set_function__data | Sort Replicate Filter | TCGA-06-0156-01A-02D-0242-05 | TCGA-06-0156-01A-03D-0242-05 |
| TCGA-06-0137 | methylation__illuminadnamethylation_oma002_cpi__jhu_usc_edu__Level_1__within_bioassay_data_set_function__data | Sort Replicate Filter | TCGA-06-0137-01A-02D-0218-05,TCGA-06-0137-01A-01D-0218-05 | TCGA-06-0137-01B-02D-0218-05 |
| TCGA-06-0145 | methylation__illuminadnamethylation_oma002_cpi__jhu_usc_edu__Level_1__within_bioassay_data_set_function__data | Sort Replicate Filter | TCGA-06-0145-01A-05D-0218-05,TCGA-06-0145-01A-04D-0218-05,TCGA-06-0145-01A-02D-0218-05,TCGA-06-0145-01A-03D-0218-05 | TCGA-06-0145-01A-06D-0218-05 |
| TCGA-06-0129 | snp__genome_wide_snp_6__broad_mit_edu__Level_2__no_outlier_copy_number__data | Analyte Replicate Filter | TCGA-06-0129-10A-01G-0289-01 | TCGA-06-0129-10A-01D-0214-01 |
| TCGA-06-0141 | snp__genome_wide_snp_6__broad_mit_edu__Level_2__no_outlier_copy_number__data | Analyte Replicate Filter | TCGA-06-0141-10A-01G-0289-01 | TCGA-06-0141-10A-01D-0214-01 |
| TCGA-06-0126 | snp__genome_wide_snp_6__broad_mit_edu__Level_2__no_outlier_copy_number__data | Analyte Replicate Filter | TCGA-06-0126-01A-01G-0289-01 | TCGA-06-0126-01A-01D-0214-01 |
| TCGA-06-0126 | snp__genome_wide_snp_6__broad_mit_edu__Level_2__no_outlier_copy_number__data | Analyte Replicate Filter | TCGA-06-0126-10A-01G-0289-01 | TCGA-06-0126-10A-01D-0214-01 |
| TCGA-06-0143 | snp__genome_wide_snp_6__broad_mit_edu__Level_2__no_outlier_copy_number__data | Analyte Replicate Filter | TCGA-06-0143-10A-01G-0289-01 | TCGA-06-0143-10A-01D-0214-01 |
| TCGA-06-0166 | snp__genome_wide_snp_6__broad_mit_edu__Level_2__no_outlier_copy_number__data | Analyte Replicate Filter | TCGA-06-0166-01A-01G-0289-01 | TCGA-06-0166-01A-01D-0236-01 |
| TCGA-06-0147 | snp__genome_wide_snp_6__broad_mit_edu__Level_2__no_outlier_copy_number__data | Analyte Replicate Filter | TCGA-06-0147-10A-01D-0214-01 | TCGA-06-0147-10A-01D-0237-01 |
| TCGA-06-0122 | snp__genome_wide_snp_6__broad_mit_edu__Level_2__no_outlier_copy_number__data | Analyte Replicate Filter | TCGA-06-0122-10A-01G-0289-01 | TCGA-06-0122-10A-01D-0214-01 |
| TCGA-06-0137 | snp__genome_wide_snp_6__broad_mit_edu__Level_2__no_outlier_copy_number__data | Sort Replicate Filter | TCGA-06-0137-01A-01D-0214-01,TCGA-06-0137-01A-02D-0214-01 | TCGA-06-0137-01B-02D-0214-01 |
| TCGA-06-0124 | snp__genome_wide_snp_6__broad_mit_edu__Level_2__no_outlier_copy_number__data | Analyte Replicate Filter | TCGA-06-0124-10A-01G-0289-01 | TCGA-06-0124-10A-01D-0214-01 |
| TCGA-06-0130 | snp__genome_wide_snp_6__broad_mit_edu__Level_2__no_outlier_copy_number__data | Analyte Replicate Filter | TCGA-06-0130-01A-01G-0289-01 | TCGA-06-0130-01A-01D-0214-01 |
| TCGA-06-0125 | snp__genome_wide_snp_6__broad_mit_edu__Level_2__no_outlier_copy_number__data | Analyte Replicate Filter | TCGA-06-0125-10A-01G-0289-01 | TCGA-06-0125-10A-01D-0214-01 |
| TCGA-06-0129 | snp__genome_wide_snp_6__broad_mit_edu__Level_2__no_outlier_copy_number__data | Analyte Replicate Filter | TCGA-06-0129-01A-01G-0289-01 | TCGA-06-0129-01A-01D-0214-01 |
| TCGA-06-0128 | snp__genome_wide_snp_6__broad_mit_edu__Level_2__no_outlier_copy_number__data | Analyte Replicate Filter | TCGA-06-0128-01A-01G-0289-01 | TCGA-06-0128-01A-01D-0214-01 |
| TCGA-06-0143 | snp__genome_wide_snp_6__broad_mit_edu__Level_2__no_outlier_copy_number__data | Analyte Replicate Filter | TCGA-06-0143-01A-01G-0289-01 | TCGA-06-0143-01A-01D-0214-01 |
| TCGA-06-0141 | snp__genome_wide_snp_6__broad_mit_edu__Level_2__no_outlier_copy_number__data | Analyte Replicate Filter | TCGA-06-0141-01A-01G-0289-01 | TCGA-06-0141-01A-01D-0214-01 |
| TCGA-06-0125 | snp__genome_wide_snp_6__broad_mit_edu__Level_2__no_outlier_copy_number__data | Analyte Replicate Filter | TCGA-06-0125-01A-01G-0289-01 | TCGA-06-0125-01A-01D-0214-01 |
| TCGA-06-0122 | snp__genome_wide_snp_6__broad_mit_edu__Level_2__no_outlier_copy_number__data | Analyte Replicate Filter | TCGA-06-0122-01A-01G-0289-01 | TCGA-06-0122-01A-01D-0214-01 |
| TCGA-06-0130 | snp__genome_wide_snp_6__broad_mit_edu__Level_2__no_outlier_copy_number__data | Analyte Replicate Filter | TCGA-06-0130-10A-01G-0289-01 | TCGA-06-0130-10A-01D-0214-01 |
| TCGA-06-0124 | snp__genome_wide_snp_6__broad_mit_edu__Level_2__no_outlier_copy_number__data | Analyte Replicate Filter | TCGA-06-0124-01A-01G-0289-01 | TCGA-06-0124-01A-01D-0214-01 |
| TCGA-06-0128 | snp__genome_wide_snp_6__broad_mit_edu__Level_2__no_outlier_copy_number__data | Analyte Replicate Filter | TCGA-06-0128-10A-01G-0289-01 | TCGA-06-0128-10A-01D-0214-01 |
| TCGA-06-0216 | snp__genome_wide_snp_6__broad_mit_edu__Level_2__no_outlier_copy_number__data | Analyte Replicate Filter | TCGA-06-0216-10A-01D-0237-01 | TCGA-06-0216-10A-01D-0333-01 |
| TCGA-06-0145 | snp__genome_wide_snp_6__broad_mit_edu__Level_2__no_outlier_copy_number__data | Sort Replicate Filter | TCGA-06-0145-01A-05D-0214-01,TCGA-06-0145-01A-02D-0214-01,TCGA-06-0145-01A-03D-0214-01,TCGA-06-0145-01A-04D-0214-01 | TCGA-06-0145-01A-06D-0214-01 |
| TCGA-06-0129 | snp__genome_wide_snp_6__broad_mit_edu__Level_2__invariantset_medianpolish__data | Analyte Replicate Filter | TCGA-06-0129-10A-01G-0289-01 | TCGA-06-0129-10A-01D-0214-01 |
| TCGA-06-0141 | snp__genome_wide_snp_6__broad_mit_edu__Level_2__invariantset_medianpolish__data | Analyte Replicate Filter | TCGA-06-0141-10A-01G-0289-01 | TCGA-06-0141-10A-01D-0214-01 |
| TCGA-06-0143 | snp__genome_wide_snp_6__broad_mit_edu__Level_2__invariantset_medianpolish__data | Analyte Replicate Filter | TCGA-06-0143-10A-01G-0289-01 | TCGA-06-0143-10A-01D-0214-01 |
| TCGA-06-0147 | snp__genome_wide_snp_6__broad_mit_edu__Level_2__invariantset_medianpolish__data | Analyte Replicate Filter | TCGA-06-0147-10A-01D-0214-01 | TCGA-06-0147-10A-01D-0237-01 |
| TCGA-06-0128 | snp__genome_wide_snp_6__broad_mit_edu__Level_2__invariantset_medianpolish__data | Analyte Replicate Filter | TCGA-06-0128-10A-01G-0289-01 | TCGA-06-0128-10A-01D-0214-01 |
| TCGA-06-0166 | snp__genome_wide_snp_6__broad_mit_edu__Level_2__invariantset_medianpolish__data | Analyte Replicate Filter | TCGA-06-0166-01A-01G-0289-01 | TCGA-06-0166-01A-01D-0236-01 |
| TCGA-06-0122 | snp__genome_wide_snp_6__broad_mit_edu__Level_2__invariantset_medianpolish__data | Analyte Replicate Filter | TCGA-06-0122-10A-01G-0289-01 | TCGA-06-0122-10A-01D-0214-01 |
| TCGA-06-0126 | snp__genome_wide_snp_6__broad_mit_edu__Level_2__invariantset_medianpolish__data | Analyte Replicate Filter | TCGA-06-0126-10A-01G-0289-01 | TCGA-06-0126-10A-01D-0214-01 |
| TCGA-06-0124 | snp__genome_wide_snp_6__broad_mit_edu__Level_2__invariantset_medianpolish__data | Analyte Replicate Filter | TCGA-06-0124-10A-01G-0289-01 | TCGA-06-0124-10A-01D-0214-01 |
| TCGA-06-0130 | snp__genome_wide_snp_6__broad_mit_edu__Level_2__invariantset_medianpolish__data | Analyte Replicate Filter | TCGA-06-0130-01A-01G-0289-01 | TCGA-06-0130-01A-01D-0214-01 |
| TCGA-06-0125 | snp__genome_wide_snp_6__broad_mit_edu__Level_2__invariantset_medianpolish__data | Analyte Replicate Filter | TCGA-06-0125-10A-01G-0289-01 | TCGA-06-0125-10A-01D-0214-01 |
| TCGA-06-0129 | snp__genome_wide_snp_6__broad_mit_edu__Level_2__invariantset_medianpolish__data | Analyte Replicate Filter | TCGA-06-0129-01A-01G-0289-01 | TCGA-06-0129-01A-01D-0214-01 |
| TCGA-06-0126 | snp__genome_wide_snp_6__broad_mit_edu__Level_2__invariantset_medianpolish__data | Analyte Replicate Filter | TCGA-06-0126-01A-01G-0289-01 | TCGA-06-0126-01A-01D-0214-01 |
| TCGA-06-0143 | snp__genome_wide_snp_6__broad_mit_edu__Level_2__invariantset_medianpolish__data | Analyte Replicate Filter | TCGA-06-0143-01A-01G-0289-01 | TCGA-06-0143-01A-01D-0214-01 |
| TCGA-06-0141 | snp__genome_wide_snp_6__broad_mit_edu__Level_2__invariantset_medianpolish__data | Analyte Replicate Filter | TCGA-06-0141-01A-01G-0289-01 | TCGA-06-0141-01A-01D-0214-01 |
| TCGA-06-0125 | snp__genome_wide_snp_6__broad_mit_edu__Level_2__invariantset_medianpolish__data | Analyte Replicate Filter | TCGA-06-0125-01A-01G-0289-01 | TCGA-06-0125-01A-01D-0214-01 |
| TCGA-06-0122 | snp__genome_wide_snp_6__broad_mit_edu__Level_2__invariantset_medianpolish__data | Analyte Replicate Filter | TCGA-06-0122-01A-01G-0289-01 | TCGA-06-0122-01A-01D-0214-01 |
| TCGA-06-0130 | snp__genome_wide_snp_6__broad_mit_edu__Level_2__invariantset_medianpolish__data | Analyte Replicate Filter | TCGA-06-0130-10A-01G-0289-01 | TCGA-06-0130-10A-01D-0214-01 |
| TCGA-06-0124 | snp__genome_wide_snp_6__broad_mit_edu__Level_2__invariantset_medianpolish__data | Analyte Replicate Filter | TCGA-06-0124-01A-01G-0289-01 | TCGA-06-0124-01A-01D-0214-01 |
| TCGA-06-0128 | snp__genome_wide_snp_6__broad_mit_edu__Level_2__invariantset_medianpolish__data | Analyte Replicate Filter | TCGA-06-0128-01A-01G-0289-01 | TCGA-06-0128-01A-01D-0214-01 |
| TCGA-06-0216 | snp__genome_wide_snp_6__broad_mit_edu__Level_2__invariantset_medianpolish__data | Analyte Replicate Filter | TCGA-06-0216-10A-01D-0237-01 | TCGA-06-0216-10A-01D-0333-01 |
| TCGA-06-0148 | snp__genome_wide_snp_6__broad_mit_edu__Level_2__invariantset_medianpolish__data | Analyte Replicate Filter | TCGA-06-0148-10A-01D-0214-01 | TCGA-06-0148-10A-01D-0237-01 |
| TCGA-06-0147 | cna__hg_cgh_244a__mskcc_org__Level_1__feature_extraction__data | Analyte Replicate Filter | TCGA-06-0147-10A-01D-0215-04 | TCGA-06-0147-10A-01D-0239-04 |
| TCGA-06-0137 | cna__hg_cgh_244a__mskcc_org__Level_1__feature_extraction__data | Sort Replicate Filter | TCGA-06-0137-01A-01D-0215-04,TCGA-06-0137-01A-02D-0215-04 | TCGA-06-0137-01B-02D-0215-04 |
| TCGA-08-0350 | cna__hg_cgh_244a__mskcc_org__Level_1__feature_extraction__data | Analyte Replicate Filter | TCGA-08-0350-01A-01G-0294-04 | TCGA-08-0350-01A-01D-0304-04 |
| TCGA-08-0354 | cna__hg_cgh_244a__mskcc_org__Level_1__feature_extraction__data | Analyte Replicate Filter | TCGA-08-0354-01A-01G-0294-04 | TCGA-08-0354-01A-01D-0304-04 |
| TCGA-08-0380 | cna__hg_cgh_244a__mskcc_org__Level_1__feature_extraction__data | Analyte Replicate Filter | TCGA-08-0380-01A-01G-0294-04 | TCGA-08-0380-01A-01D-0304-04 |
| TCGA-08-0375 | cna__hg_cgh_244a__mskcc_org__Level_1__feature_extraction__data | Analyte Replicate Filter | TCGA-08-0375-01A-01G-0294-04 | TCGA-08-0375-01A-01D-0304-04 |
| TCGA-08-0344 | cna__hg_cgh_244a__mskcc_org__Level_1__feature_extraction__data | Analyte Replicate Filter | TCGA-08-0344-01A-01G-0294-04 | TCGA-08-0344-01A-01D-0304-04 |
| TCGA-06-0148 | cna__hg_cgh_244a__mskcc_org__Level_1__feature_extraction__data | Sort Replicate Filter | TCGA-06-0148-01A-03D-0238-04,TCGA-06-0148-01A-04D-0238-04 | TCGA-06-0148-01A-05D-0238-04 |
| TCGA-06-0156 | cna__hg_cgh_244a__mskcc_org__Level_1__feature_extraction__data | Sort Replicate Filter | TCGA-06-0156-01A-02D-0238-04 | TCGA-06-0156-01A-03D-0238-04 |
| TCGA-06-0148 | cna__hg_cgh_244a__mskcc_org__Level_1__feature_extraction__data | Analyte Replicate Filter | TCGA-06-0148-10A-01D-0215-04 | TCGA-06-0148-10A-01D-0239-04 |
| TCGA-06-0216 | cna__hg_cgh_244a__mskcc_org__Level_1__feature_extraction__data | Analyte Replicate Filter | TCGA-06-0216-10A-01D-0239-04 | TCGA-06-0216-10A-01D-0334-04 |
| TCGA-06-0145 | cna__hg_cgh_244a__mskcc_org__Level_1__feature_extraction__data | Sort Replicate Filter | TCGA-06-0145-01A-02D-0215-04,TCGA-06-0145-01A-03D-0215-04,TCGA-06-0145-01A-04D-0215-04,TCGA-06-0145-01A-05D-0215-04 | TCGA-06-0145-01A-06D-0215-04 |
| TCGA-08-0351 | cna__hg_cgh_244a__mskcc_org__Level_1__feature_extraction__data | Analyte Replicate Filter | TCGA-08-0351-01A-01G-0294-04 | TCGA-08-0351-01A-01D-0304-04 |
| TCGA-06-0148 | methylation__illuminadnamethylation_oma002_cpi__jhu_usc_edu__Level_2__within_bioassay_data_set_function__data | Sort Replicate Filter | TCGA-06-0148-01A-04D-0242-05,TCGA-06-0148-01A-03D-0242-05 | TCGA-06-0148-01A-05D-0242-05 |
| TCGA-06-0156 | methylation__illuminadnamethylation_oma002_cpi__jhu_usc_edu__Level_2__within_bioassay_data_set_function__data | Sort Replicate Filter | TCGA-06-0156-01A-02D-0242-05 | TCGA-06-0156-01A-03D-0242-05 |
| TCGA-06-0137 | methylation__illuminadnamethylation_oma002_cpi__jhu_usc_edu__Level_2__within_bioassay_data_set_function__data | Sort Replicate Filter | TCGA-06-0137-01A-02D-0218-05,TCGA-06-0137-01A-01D-0218-05 | TCGA-06-0137-01B-02D-0218-05 |
| TCGA-06-0145 | methylation__illuminadnamethylation_oma002_cpi__jhu_usc_edu__Level_2__within_bioassay_data_set_function__data | Sort Replicate Filter | TCGA-06-0145-01A-05D-0218-05,TCGA-06-0145-01A-04D-0218-05,TCGA-06-0145-01A-02D-0218-05,TCGA-06-0145-01A-03D-0218-05 | TCGA-06-0145-01A-06D-0218-05 |
| TCGA-06-0147 | snp__humanhap550__hudsonalpha_org__Level_1__XandYintensity__data | Analyte Replicate Filter | TCGA-06-0147-10A-01D-0216-06 | TCGA-06-0147-10A-01D-0241-06 |
| TCGA-06-0137 | snp__humanhap550__hudsonalpha_org__Level_1__XandYintensity__data | Sort Replicate Filter | TCGA-06-0137-01A-02D-0216-06,TCGA-06-0137-01A-01D-0216-06 | TCGA-06-0137-01B-02D-0216-06 |
| TCGA-06-0148 | snp__humanhap550__hudsonalpha_org__Level_1__XandYintensity__data | Sort Replicate Filter | TCGA-06-0148-01A-03D-0240-06,TCGA-06-0148-01A-04D-0240-06 | TCGA-06-0148-01A-05D-0240-06 |
| TCGA-06-0156 | snp__humanhap550__hudsonalpha_org__Level_1__XandYintensity__data | Sort Replicate Filter | TCGA-06-0156-01A-02D-0240-06 | TCGA-06-0156-01A-03D-0240-06 |
| TCGA-06-0148 | snp__humanhap550__hudsonalpha_org__Level_1__XandYintensity__data | Analyte Replicate Filter | TCGA-06-0148-10A-01D-0216-06 | TCGA-06-0148-10A-01D-0241-06 |
| TCGA-06-0216 | snp__humanhap550__hudsonalpha_org__Level_1__XandYintensity__data | Analyte Replicate Filter | TCGA-06-0216-10A-01D-0241-06 | TCGA-06-0216-10A-01D-0335-06 |
| TCGA-06-0145 | snp__humanhap550__hudsonalpha_org__Level_1__XandYintensity__data | Sort Replicate Filter | TCGA-06-0145-01A-05D-0216-06,TCGA-06-0145-01A-02D-0216-06,TCGA-06-0145-01A-04D-0216-06,TCGA-06-0145-01A-03D-0216-06 | TCGA-06-0145-01A-06D-0216-06 |
| TCGA-06-0147 | cna__hg_cgh_244a__mskcc_org__Level_3__segmentation_data_computation__seg | Analyte Replicate Filter | TCGA-06-0147-10A-01D-0215-04 | TCGA-06-0147-10A-01D-0239-04 |
| TCGA-06-0137 | cna__hg_cgh_244a__mskcc_org__Level_3__segmentation_data_computation__seg | Sort Replicate Filter | TCGA-06-0137-01A-01D-0215-04,TCGA-06-0137-01A-02D-0215-04 | TCGA-06-0137-01B-02D-0215-04 |
| TCGA-08-0350 | cna__hg_cgh_244a__mskcc_org__Level_3__segmentation_data_computation__seg | Analyte Replicate Filter | TCGA-08-0350-01A-01G-0294-04 | TCGA-08-0350-01A-01D-0304-04 |
| TCGA-08-0354 | cna__hg_cgh_244a__mskcc_org__Level_3__segmentation_data_computation__seg | Analyte Replicate Filter | TCGA-08-0354-01A-01G-0294-04 | TCGA-08-0354-01A-01D-0304-04 |
| TCGA-08-0380 | cna__hg_cgh_244a__mskcc_org__Level_3__segmentation_data_computation__seg | Analyte Replicate Filter | TCGA-08-0380-01A-01G-0294-04 | TCGA-08-0380-01A-01D-0304-04 |
| TCGA-08-0375 | cna__hg_cgh_244a__mskcc_org__Level_3__segmentation_data_computation__seg | Analyte Replicate Filter | TCGA-08-0375-01A-01G-0294-04 | TCGA-08-0375-01A-01D-0304-04 |
| TCGA-08-0344 | cna__hg_cgh_244a__mskcc_org__Level_3__segmentation_data_computation__seg | Analyte Replicate Filter | TCGA-08-0344-01A-01G-0294-04 | TCGA-08-0344-01A-01D-0304-04 |
| TCGA-06-0148 | cna__hg_cgh_244a__mskcc_org__Level_3__segmentation_data_computation__seg | Sort Replicate Filter | TCGA-06-0148-01A-03D-0238-04,TCGA-06-0148-01A-04D-0238-04 | TCGA-06-0148-01A-05D-0238-04 |
| TCGA-06-0156 | cna__hg_cgh_244a__mskcc_org__Level_3__segmentation_data_computation__seg | Sort Replicate Filter | TCGA-06-0156-01A-02D-0238-04 | TCGA-06-0156-01A-03D-0238-04 |
| TCGA-06-0148 | cna__hg_cgh_244a__mskcc_org__Level_3__segmentation_data_computation__seg | Analyte Replicate Filter | TCGA-06-0148-10A-01D-0215-04 | TCGA-06-0148-10A-01D-0239-04 |
| TCGA-06-0216 | cna__hg_cgh_244a__mskcc_org__Level_3__segmentation_data_computation__seg | Analyte Replicate Filter | TCGA-06-0216-10A-01D-0239-04 | TCGA-06-0216-10A-01D-0334-04 |
| TCGA-06-0145 | cna__hg_cgh_244a__mskcc_org__Level_3__segmentation_data_computation__seg | Sort Replicate Filter | TCGA-06-0145-01A-02D-0215-04,TCGA-06-0145-01A-03D-0215-04,TCGA-06-0145-01A-04D-0215-04,TCGA-06-0145-01A-05D-0215-04 | TCGA-06-0145-01A-06D-0215-04 |
| TCGA-08-0351 | cna__hg_cgh_244a__mskcc_org__Level_3__segmentation_data_computation__seg | Analyte Replicate Filter | TCGA-08-0351-01A-01G-0294-04 | TCGA-08-0351-01A-01D-0304-04 |
| TCGA-06-0129 | snp__genome_wide_snp_6__broad_mit_edu__Level_2__copy_number__data | Analyte Replicate Filter | TCGA-06-0129-10A-01G-0289-01 | TCGA-06-0129-10A-01D-0214-01 |
| TCGA-06-0141 | snp__genome_wide_snp_6__broad_mit_edu__Level_2__copy_number__data | Analyte Replicate Filter | TCGA-06-0141-10A-01G-0289-01 | TCGA-06-0141-10A-01D-0214-01 |
| TCGA-06-0126 | snp__genome_wide_snp_6__broad_mit_edu__Level_2__copy_number__data | Analyte Replicate Filter | TCGA-06-0126-01A-01G-0289-01 | TCGA-06-0126-01A-01D-0214-01 |
| TCGA-06-0143 | snp__genome_wide_snp_6__broad_mit_edu__Level_2__copy_number__data | Analyte Replicate Filter | TCGA-06-0143-10A-01G-0289-01 | TCGA-06-0143-10A-01D-0214-01 |
| TCGA-06-0147 | snp__genome_wide_snp_6__broad_mit_edu__Level_2__copy_number__data | Analyte Replicate Filter | TCGA-06-0147-10A-01D-0214-01 | TCGA-06-0147-10A-01D-0237-01 |
| TCGA-06-0128 | snp__genome_wide_snp_6__broad_mit_edu__Level_2__copy_number__data | Analyte Replicate Filter | TCGA-06-0128-10A-01G-0289-01 | TCGA-06-0128-10A-01D-0214-01 |
| TCGA-06-0166 | snp__genome_wide_snp_6__broad_mit_edu__Level_2__copy_number__data | Analyte Replicate Filter | TCGA-06-0166-01A-01G-0289-01 | TCGA-06-0166-01A-01D-0236-01 |
| TCGA-06-0122 | snp__genome_wide_snp_6__broad_mit_edu__Level_2__copy_number__data | Analyte Replicate Filter | TCGA-06-0122-10A-01G-0289-01 | TCGA-06-0122-10A-01D-0214-01 |
| TCGA-06-0137 | snp__genome_wide_snp_6__broad_mit_edu__Level_2__copy_number__data | Sort Replicate Filter | TCGA-06-0137-01A-01D-0214-01,TCGA-06-0137-01A-02D-0214-01 | TCGA-06-0137-01B-02D-0214-01 |
| TCGA-06-0126 | snp__genome_wide_snp_6__broad_mit_edu__Level_2__copy_number__data | Analyte Replicate Filter | TCGA-06-0126-10A-01G-0289-01 | TCGA-06-0126-10A-01D-0214-01 |
| TCGA-06-0124 | snp__genome_wide_snp_6__broad_mit_edu__Level_2__copy_number__data | Analyte Replicate Filter | TCGA-06-0124-10A-01G-0289-01 | TCGA-06-0124-10A-01D-0214-01 |
| TCGA-06-0130 | snp__genome_wide_snp_6__broad_mit_edu__Level_2__copy_number__data | Analyte Replicate Filter | TCGA-06-0130-01A-01G-0289-01 | TCGA-06-0130-01A-01D-0214-01 |
| TCGA-06-0125 | snp__genome_wide_snp_6__broad_mit_edu__Level_2__copy_number__data | Analyte Replicate Filter | TCGA-06-0125-10A-01G-0289-01 | TCGA-06-0125-10A-01D-0214-01 |
| TCGA-06-0129 | snp__genome_wide_snp_6__broad_mit_edu__Level_2__copy_number__data | Analyte Replicate Filter | TCGA-06-0129-01A-01G-0289-01 | TCGA-06-0129-01A-01D-0214-01 |
| TCGA-06-0128 | snp__genome_wide_snp_6__broad_mit_edu__Level_2__copy_number__data | Analyte Replicate Filter | TCGA-06-0128-01A-01G-0289-01 | TCGA-06-0128-01A-01D-0214-01 |
| TCGA-06-0143 | snp__genome_wide_snp_6__broad_mit_edu__Level_2__copy_number__data | Analyte Replicate Filter | TCGA-06-0143-01A-01G-0289-01 | TCGA-06-0143-01A-01D-0214-01 |
| TCGA-06-0141 | snp__genome_wide_snp_6__broad_mit_edu__Level_2__copy_number__data | Analyte Replicate Filter | TCGA-06-0141-01A-01G-0289-01 | TCGA-06-0141-01A-01D-0214-01 |
| TCGA-06-0125 | snp__genome_wide_snp_6__broad_mit_edu__Level_2__copy_number__data | Analyte Replicate Filter | TCGA-06-0125-01A-01G-0289-01 | TCGA-06-0125-01A-01D-0214-01 |
| TCGA-06-0122 | snp__genome_wide_snp_6__broad_mit_edu__Level_2__copy_number__data | Analyte Replicate Filter | TCGA-06-0122-01A-01G-0289-01 | TCGA-06-0122-01A-01D-0214-01 |
| TCGA-06-0130 | snp__genome_wide_snp_6__broad_mit_edu__Level_2__copy_number__data | Analyte Replicate Filter | TCGA-06-0130-10A-01G-0289-01 | TCGA-06-0130-10A-01D-0214-01 |
| TCGA-06-0124 | snp__genome_wide_snp_6__broad_mit_edu__Level_2__copy_number__data | Analyte Replicate Filter | TCGA-06-0124-01A-01G-0289-01 | TCGA-06-0124-01A-01D-0214-01 |
| TCGA-06-0216 | snp__genome_wide_snp_6__broad_mit_edu__Level_2__copy_number__data | Analyte Replicate Filter | TCGA-06-0216-10A-01D-0237-01 | TCGA-06-0216-10A-01D-0333-01 |
| TCGA-06-0145 | snp__genome_wide_snp_6__broad_mit_edu__Level_2__copy_number__data | Sort Replicate Filter | TCGA-06-0145-01A-02D-0214-01,TCGA-06-0145-01A-03D-0214-01,TCGA-06-0145-01A-04D-0214-01,TCGA-06-0145-01A-05D-0214-01 | TCGA-06-0145-01A-06D-0214-01 |
| TCGA-06-0137 | methylation__humanmethylation27__jhu_usc_edu__Level_2__within_bioassay_data_set_function__data | Sort Replicate Filter | TCGA-06-0137-01A-02D-0218-05,TCGA-06-0137-01A-01D-0218-05 | TCGA-06-0137-01B-02D-0218-05 |
| TCGA-06-0145 | methylation__humanmethylation27__jhu_usc_edu__Level_2__within_bioassay_data_set_function__data | Sort Replicate Filter | TCGA-06-0145-01A-05D-0218-05,TCGA-06-0145-01A-04D-0218-05,TCGA-06-0145-01A-02D-0218-05,TCGA-06-0145-01A-03D-0218-05 | TCGA-06-0145-01A-06D-0218-05 |
| TCGA-06-0129 | snp__genome_wide_snp_6__broad_mit_edu__Level_3__segmented_scna_hg18__seg | Analyte Replicate Filter | TCGA-06-0129-10A-01G-0289-01 | TCGA-06-0129-10A-01D-0214-01 |
| TCGA-06-0141 | snp__genome_wide_snp_6__broad_mit_edu__Level_3__segmented_scna_hg18__seg | Analyte Replicate Filter | TCGA-06-0141-10A-01G-0289-01 | TCGA-06-0141-10A-01D-0214-01 |
| TCGA-06-0143 | snp__genome_wide_snp_6__broad_mit_edu__Level_3__segmented_scna_hg18__seg | Analyte Replicate Filter | TCGA-06-0143-10A-01G-0289-01 | TCGA-06-0143-10A-01D-0214-01 |
| TCGA-06-0147 | snp__genome_wide_snp_6__broad_mit_edu__Level_3__segmented_scna_hg18__seg | Analyte Replicate Filter | TCGA-06-0147-10A-01D-0214-01 | TCGA-06-0147-10A-01D-0237-01 |
| TCGA-06-0128 | snp__genome_wide_snp_6__broad_mit_edu__Level_3__segmented_scna_hg18__seg | Analyte Replicate Filter | TCGA-06-0128-10A-01G-0289-01 | TCGA-06-0128-10A-01D-0214-01 |
| TCGA-06-0166 | snp__genome_wide_snp_6__broad_mit_edu__Level_3__segmented_scna_hg18__seg | Analyte Replicate Filter | TCGA-06-0166-01A-01G-0289-01 | TCGA-06-0166-01A-01D-0236-01 |
| TCGA-06-0126 | snp__genome_wide_snp_6__broad_mit_edu__Level_3__segmented_scna_hg18__seg | Analyte Replicate Filter | TCGA-06-0126-10A-01G-0289-01 | TCGA-06-0126-10A-01D-0214-01 |
| TCGA-06-0124 | snp__genome_wide_snp_6__broad_mit_edu__Level_3__segmented_scna_hg18__seg | Analyte Replicate Filter | TCGA-06-0124-10A-01G-0289-01 | TCGA-06-0124-10A-01D-0214-01 |
| TCGA-06-0130 | snp__genome_wide_snp_6__broad_mit_edu__Level_3__segmented_scna_hg18__seg | Analyte Replicate Filter | TCGA-06-0130-01A-01G-0289-01 | TCGA-06-0130-01A-01D-0214-01 |
| TCGA-06-0125 | snp__genome_wide_snp_6__broad_mit_edu__Level_3__segmented_scna_hg18__seg | Analyte Replicate Filter | TCGA-06-0125-10A-01G-0289-01 | TCGA-06-0125-10A-01D-0214-01 |
| TCGA-06-0126 | snp__genome_wide_snp_6__broad_mit_edu__Level_3__segmented_scna_hg18__seg | Analyte Replicate Filter | TCGA-06-0126-01A-01G-0289-01 | TCGA-06-0126-01A-01D-0214-01 |
| TCGA-06-0143 | snp__genome_wide_snp_6__broad_mit_edu__Level_3__segmented_scna_hg18__seg | Analyte Replicate Filter | TCGA-06-0143-01A-01G-0289-01 | TCGA-06-0143-01A-01D-0214-01 |
| TCGA-06-0141 | snp__genome_wide_snp_6__broad_mit_edu__Level_3__segmented_scna_hg18__seg | Analyte Replicate Filter | TCGA-06-0141-01A-01G-0289-01 | TCGA-06-0141-01A-01D-0214-01 |
| TCGA-06-0125 | snp__genome_wide_snp_6__broad_mit_edu__Level_3__segmented_scna_hg18__seg | Analyte Replicate Filter | TCGA-06-0125-01A-01G-0289-01 | TCGA-06-0125-01A-01D-0214-01 |
| TCGA-06-0122 | snp__genome_wide_snp_6__broad_mit_edu__Level_3__segmented_scna_hg18__seg | Analyte Replicate Filter | TCGA-06-0122-01A-01G-0289-01 | TCGA-06-0122-01A-01D-0214-01 |
| TCGA-06-0130 | snp__genome_wide_snp_6__broad_mit_edu__Level_3__segmented_scna_hg18__seg | Analyte Replicate Filter | TCGA-06-0130-10A-01G-0289-01 | TCGA-06-0130-10A-01D-0214-01 |
| TCGA-06-0124 | snp__genome_wide_snp_6__broad_mit_edu__Level_3__segmented_scna_hg18__seg | Analyte Replicate Filter | TCGA-06-0124-01A-01G-0289-01 | TCGA-06-0124-01A-01D-0214-01 |
| TCGA-06-0128 | snp__genome_wide_snp_6__broad_mit_edu__Level_3__segmented_scna_hg18__seg | Analyte Replicate Filter | TCGA-06-0128-01A-01G-0289-01 | TCGA-06-0128-01A-01D-0214-01 |
| TCGA-06-0216 | snp__genome_wide_snp_6__broad_mit_edu__Level_3__segmented_scna_hg18__seg | Analyte Replicate Filter | TCGA-06-0216-10A-01D-0237-01 | TCGA-06-0216-10A-01D-0333-01 |
| TCGA-06-0137 | transcriptome__ht_hg_u133a__broad_mit_edu__Level_2__probeset_rma__data | Sort Replicate Filter | TCGA-06-0137-01A-02R-0219-01,TCGA-06-0137-01A-01R-0219-01 | TCGA-06-0137-01B-02R-0219-01 |
| TCGA-06-0148 | transcriptome__ht_hg_u133a__broad_mit_edu__Level_2__probeset_rma__data | Sort Replicate Filter | TCGA-06-0148-01A-03R-0233-01,TCGA-06-0148-01A-04R-0233-01 | TCGA-06-0148-01A-05R-0233-01 |
| TCGA-06-0156 | transcriptome__ht_hg_u133a__broad_mit_edu__Level_2__probeset_rma__data | Sort Replicate Filter | TCGA-06-0156-01A-02R-0233-01 | TCGA-06-0156-01A-03R-0233-01 |
| TCGA-06-0145 | transcriptome__ht_hg_u133a__broad_mit_edu__Level_2__probeset_rma__data | Sort Replicate Filter | TCGA-06-0145-01A-02R-0219-01,TCGA-06-0145-01A-04R-0219-01,TCGA-06-0145-01A-03R-0219-01,TCGA-06-0145-01A-05R-0219-01 | TCGA-06-0145-01A-06R-0219-01 |
| TCGA-06-0129 | snp__genome_wide_snp_6__broad_mit_edu__Level_2__birdseed_genotype__data | Analyte Replicate Filter | TCGA-06-0129-10A-01G-0289-01 | TCGA-06-0129-10A-01D-0214-01 |
| TCGA-06-0141 | snp__genome_wide_snp_6__broad_mit_edu__Level_2__birdseed_genotype__data | Analyte Replicate Filter | TCGA-06-0141-10A-01G-0289-01 | TCGA-06-0141-10A-01D-0214-01 |
| TCGA-06-0126 | snp__genome_wide_snp_6__broad_mit_edu__Level_2__birdseed_genotype__data | Analyte Replicate Filter | TCGA-06-0126-01A-01G-0289-01 | TCGA-06-0126-01A-01D-0214-01 |
| TCGA-06-0143 | snp__genome_wide_snp_6__broad_mit_edu__Level_2__birdseed_genotype__data | Analyte Replicate Filter | TCGA-06-0143-10A-01G-0289-01 | TCGA-06-0143-10A-01D-0214-01 |
| TCGA-06-0147 | snp__genome_wide_snp_6__broad_mit_edu__Level_2__birdseed_genotype__data | Analyte Replicate Filter | TCGA-06-0147-10A-01D-0214-01 | TCGA-06-0147-10A-01D-0237-01 |
| TCGA-06-0128 | snp__genome_wide_snp_6__broad_mit_edu__Level_2__birdseed_genotype__data | Analyte Replicate Filter | TCGA-06-0128-10A-01G-0289-01 | TCGA-06-0128-10A-01D-0214-01 |
| TCGA-06-0166 | snp__genome_wide_snp_6__broad_mit_edu__Level_2__birdseed_genotype__data | Analyte Replicate Filter | TCGA-06-0166-01A-01G-0289-01 | TCGA-06-0166-01A-01D-0236-01 |
| TCGA-06-0122 | snp__genome_wide_snp_6__broad_mit_edu__Level_2__birdseed_genotype__data | Analyte Replicate Filter | TCGA-06-0122-10A-01G-0289-01 | TCGA-06-0122-10A-01D-0214-01 |
| TCGA-06-0137 | snp__genome_wide_snp_6__broad_mit_edu__Level_2__birdseed_genotype__data | Sort Replicate Filter | TCGA-06-0137-01A-01D-0214-01,TCGA-06-0137-01A-02D-0214-01 | TCGA-06-0137-01B-02D-0214-01 |
| TCGA-06-0126 | snp__genome_wide_snp_6__broad_mit_edu__Level_2__birdseed_genotype__data | Analyte Replicate Filter | TCGA-06-0126-10A-01G-0289-01 | TCGA-06-0126-10A-01D-0214-01 |
| TCGA-06-0124 | snp__genome_wide_snp_6__broad_mit_edu__Level_2__birdseed_genotype__data | Analyte Replicate Filter | TCGA-06-0124-10A-01G-0289-01 | TCGA-06-0124-10A-01D-0214-01 |
| TCGA-06-0130 | snp__genome_wide_snp_6__broad_mit_edu__Level_2__birdseed_genotype__data | Analyte Replicate Filter | TCGA-06-0130-01A-01G-0289-01 | TCGA-06-0130-01A-01D-0214-01 |
| TCGA-06-0125 | snp__genome_wide_snp_6__broad_mit_edu__Level_2__birdseed_genotype__data | Analyte Replicate Filter | TCGA-06-0125-10A-01G-0289-01 | TCGA-06-0125-10A-01D-0214-01 |
| TCGA-06-0129 | snp__genome_wide_snp_6__broad_mit_edu__Level_2__birdseed_genotype__data | Analyte Replicate Filter | TCGA-06-0129-01A-01G-0289-01 | TCGA-06-0129-01A-01D-0214-01 |
| TCGA-06-0128 | snp__genome_wide_snp_6__broad_mit_edu__Level_2__birdseed_genotype__data | Analyte Replicate Filter | TCGA-06-0128-01A-01G-0289-01 | TCGA-06-0128-01A-01D-0214-01 |
| TCGA-06-0143 | snp__genome_wide_snp_6__broad_mit_edu__Level_2__birdseed_genotype__data | Analyte Replicate Filter | TCGA-06-0143-01A-01G-0289-01 | TCGA-06-0143-01A-01D-0214-01 |
| TCGA-06-0141 | snp__genome_wide_snp_6__broad_mit_edu__Level_2__birdseed_genotype__data | Analyte Replicate Filter | TCGA-06-0141-01A-01G-0289-01 | TCGA-06-0141-01A-01D-0214-01 |
| TCGA-06-0125 | snp__genome_wide_snp_6__broad_mit_edu__Level_2__birdseed_genotype__data | Analyte Replicate Filter | TCGA-06-0125-01A-01G-0289-01 | TCGA-06-0125-01A-01D-0214-01 |
| TCGA-06-0122 | snp__genome_wide_snp_6__broad_mit_edu__Level_2__birdseed_genotype__data | Analyte Replicate Filter | TCGA-06-0122-01A-01G-0289-01 | TCGA-06-0122-01A-01D-0214-01 |
| TCGA-06-0130 | snp__genome_wide_snp_6__broad_mit_edu__Level_2__birdseed_genotype__data | Analyte Replicate Filter | TCGA-06-0130-10A-01G-0289-01 | TCGA-06-0130-10A-01D-0214-01 |
| TCGA-06-0124 | snp__genome_wide_snp_6__broad_mit_edu__Level_2__birdseed_genotype__data | Analyte Replicate Filter | TCGA-06-0124-01A-01G-0289-01 | TCGA-06-0124-01A-01D-0214-01 |
| TCGA-06-0216 | snp__genome_wide_snp_6__broad_mit_edu__Level_2__birdseed_genotype__data | Analyte Replicate Filter | TCGA-06-0216-10A-01D-0237-01 | TCGA-06-0216-10A-01D-0333-01 |
| TCGA-06-0145 | snp__genome_wide_snp_6__broad_mit_edu__Level_2__birdseed_genotype__data | Sort Replicate Filter | TCGA-06-0145-01A-02D-0214-01,TCGA-06-0145-01A-03D-0214-01,TCGA-06-0145-01A-04D-0214-01,TCGA-06-0145-01A-05D-0214-01 | TCGA-06-0145-01A-06D-0214-01 |
| TCGA-06-0129 | cna__hg_cgh_244a__hms_harvard_edu__Level_3__segmentation__seg | Analyte Replicate Filter | TCGA-06-0129-10A-01G-0288-02 | TCGA-06-0129-10A-01D-0217-02 |
| TCGA-06-0168 | cna__hg_cgh_244a__hms_harvard_edu__Level_3__segmentation__seg | Sort Replicate Filter | TCGA-06-0168-01A-01D-0234-02 | TCGA-06-0168-01A-02D-0234-02 |
| TCGA-06-0141 | cna__hg_cgh_244a__hms_harvard_edu__Level_3__segmentation__seg | Analyte Replicate Filter | TCGA-06-0141-10A-01G-0288-02 | TCGA-06-0141-10A-01D-0217-02 |
| TCGA-06-0126 | cna__hg_cgh_244a__hms_harvard_edu__Level_3__segmentation__seg | Analyte Replicate Filter | TCGA-06-0126-01A-01G-0288-02 | TCGA-06-0126-01A-01D-0217-02 |
| TCGA-06-0143 | cna__hg_cgh_244a__hms_harvard_edu__Level_3__segmentation__seg | Analyte Replicate Filter | TCGA-06-0143-10A-01G-0288-02 | TCGA-06-0143-10A-01D-0217-02 |
| TCGA-06-0128 | cna__hg_cgh_244a__hms_harvard_edu__Level_3__segmentation__seg | Analyte Replicate Filter | TCGA-06-0128-10A-01G-0288-02 | TCGA-06-0128-10A-01D-0217-02 |
| TCGA-06-0166 | cna__hg_cgh_244a__hms_harvard_edu__Level_3__segmentation__seg | Analyte Replicate Filter | TCGA-06-0166-01A-01G-0288-02 | TCGA-06-0166-01A-01D-0234-02 |
| TCGA-06-0122 | cna__hg_cgh_244a__hms_harvard_edu__Level_3__segmentation__seg | Analyte Replicate Filter | TCGA-06-0122-10A-01G-0288-02 | TCGA-06-0122-10A-01D-0217-02 |
| TCGA-06-0137 | cna__hg_cgh_244a__hms_harvard_edu__Level_3__segmentation__seg | Sort Replicate Filter | TCGA-06-0137-01A-02D-0217-02,TCGA-06-0137-01A-01D-0217-02 | TCGA-06-0137-01B-02D-0217-02 |
| TCGA-06-0126 | cna__hg_cgh_244a__hms_harvard_edu__Level_3__segmentation__seg | Analyte Replicate Filter | TCGA-06-0126-10A-01G-0288-02 | TCGA-06-0126-10A-01D-0217-02 |
| TCGA-06-0124 | cna__hg_cgh_244a__hms_harvard_edu__Level_3__segmentation__seg | Analyte Replicate Filter | TCGA-06-0124-10A-01G-0288-02 | TCGA-06-0124-10A-01D-0217-02 |
| TCGA-06-0130 | cna__hg_cgh_244a__hms_harvard_edu__Level_3__segmentation__seg | Analyte Replicate Filter | TCGA-06-0130-01A-01G-0288-02 | TCGA-06-0130-01A-01D-0217-02 |
| TCGA-06-0125 | cna__hg_cgh_244a__hms_harvard_edu__Level_3__segmentation__seg | Analyte Replicate Filter | TCGA-06-0125-10A-01G-0288-02 | TCGA-06-0125-10A-01D-0217-02 |
| TCGA-06-0129 | cna__hg_cgh_244a__hms_harvard_edu__Level_3__segmentation__seg | Analyte Replicate Filter | TCGA-06-0129-01A-01G-0288-02 | TCGA-06-0129-01A-01D-0217-02 |
| TCGA-06-0128 | cna__hg_cgh_244a__hms_harvard_edu__Level_3__segmentation__seg | Analyte Replicate Filter | TCGA-06-0128-01A-01G-0288-02 | TCGA-06-0128-01A-01D-0217-02 |
| TCGA-06-0166 | cna__hg_cgh_244a__hms_harvard_edu__Level_3__segmentation__seg | Analyte Replicate Filter | TCGA-06-0166-10A-01G-0288-02 | TCGA-06-0166-10A-01D-0235-02 |
| TCGA-06-0211 | cna__hg_cgh_244a__hms_harvard_edu__Level_3__segmentation__seg | Sort Replicate Filter | TCGA-06-0211-01A-01D-0234-02 | TCGA-06-0211-01B-01D-0234-02 |
| TCGA-06-0143 | cna__hg_cgh_244a__hms_harvard_edu__Level_3__segmentation__seg | Analyte Replicate Filter | TCGA-06-0143-01A-01G-0288-02 | TCGA-06-0143-01A-01D-0271-02 |
| TCGA-06-0208 | cna__hg_cgh_244a__hms_harvard_edu__Level_3__segmentation__seg | Sort Replicate Filter | TCGA-06-0208-01A-01D-0234-02 | TCGA-06-0208-01B-01D-0234-02 |
| TCGA-06-0141 | cna__hg_cgh_244a__hms_harvard_edu__Level_3__segmentation__seg | Analyte Replicate Filter | TCGA-06-0141-01A-01G-0288-02 | TCGA-06-0141-01A-01D-0217-02 |
| TCGA-06-0176 | cna__hg_cgh_244a__hms_harvard_edu__Level_3__segmentation__seg | Sort Replicate Filter | TCGA-06-0176-01A-02D-0234-02 | TCGA-06-0176-01A-03D-0234-02 |
| TCGA-06-0125 | cna__hg_cgh_244a__hms_harvard_edu__Level_3__segmentation__seg | Analyte Replicate Filter | TCGA-06-0125-01A-01G-0288-02 | TCGA-06-0125-01A-01D-0217-02 |
| TCGA-06-0122 | cna__hg_cgh_244a__hms_harvard_edu__Level_3__segmentation__seg | Analyte Replicate Filter | TCGA-06-0122-01A-01G-0288-02 | TCGA-06-0122-01A-01D-0217-02 |
| TCGA-06-0148 | cna__hg_cgh_244a__hms_harvard_edu__Level_3__segmentation__seg | Sort Replicate Filter | TCGA-06-0148-01A-03D-0234-02,TCGA-06-0148-01A-04D-0234-02,TCGA-06-0148-01A-01D-0217-02 | TCGA-06-0148-01A-05D-0234-02 |
| TCGA-06-0216 | cna__hg_cgh_244a__hms_harvard_edu__Level_3__segmentation__seg | Analyte Replicate Filter | TCGA-06-0216-01A-01D-0234-02 | TCGA-06-0216-01B-01D-0336-02 |
| TCGA-06-0154 | cna__hg_cgh_244a__hms_harvard_edu__Level_3__segmentation__seg | Sort Replicate Filter | TCGA-06-0154-01A-02D-0234-02 | TCGA-06-0154-01A-03D-0234-02 |
| TCGA-06-0156 | cna__hg_cgh_244a__hms_harvard_edu__Level_3__segmentation__seg | Sort Replicate Filter | TCGA-06-0156-01A-02D-0234-02,TCGA-06-0156-01A-01D-0234-02 | TCGA-06-0156-01A-03D-0234-02 |
| TCGA-06-0138 | cna__hg_cgh_244a__hms_harvard_edu__Level_3__segmentation__seg | Sort Replicate Filter | TCGA-06-0138-01A-01D-0234-02 | TCGA-06-0138-01A-02D-0234-02 |
| TCGA-06-0147 | cna__hg_cgh_244a__hms_harvard_edu__Level_3__segmentation__seg | Analyte Replicate Filter | TCGA-06-0147-01A-01D-0217-02 | TCGA-06-0147-01A-02D-0234-02 |
| TCGA-06-0210 | cna__hg_cgh_244a__hms_harvard_edu__Level_3__segmentation__seg | Analyte Replicate Filter | TCGA-06-0210-01B-01D-0234-02 | TCGA-06-0210-01A-01D-0271-02 |
| TCGA-06-0130 | cna__hg_cgh_244a__hms_harvard_edu__Level_3__segmentation__seg | Analyte Replicate Filter | TCGA-06-0130-10A-01G-0288-02 | TCGA-06-0130-10A-01D-0217-02 |
| TCGA-06-0124 | cna__hg_cgh_244a__hms_harvard_edu__Level_3__segmentation__seg | Analyte Replicate Filter | TCGA-06-0124-01A-01G-0288-02 | TCGA-06-0124-01A-01D-0217-02 |
| TCGA-06-0145 | cna__hg_cgh_244a__hms_harvard_edu__Level_3__segmentation__seg | Sort Replicate Filter | TCGA-06-0145-01A-04D-0217-02,TCGA-06-0145-01A-05D-0217-02,TCGA-06-0145-01A-03D-0217-02,TCGA-06-0145-01A-02D-0217-02 | TCGA-06-0145-01A-06D-0217-02 |
| TCGA-19-1788 | mirna__h_mirna_8x15k__unc_edu__Level_2__unc_quantile_normalization__data | Analyte Replicate Filter | TCGA-19-1788-01A-01T-0599-07 | TCGA-19-1788-01A-01T-0656-07 |
| TCGA-26-1799 | mirna__h_mirna_8x15k__unc_edu__Level_2__unc_quantile_normalization__data | Analyte Replicate Filter | TCGA-26-1799-01A-02T-0599-07 | TCGA-26-1799-01A-02T-0656-07 |
| TCGA-28-1751 | mirna__h_mirna_8x15k__unc_edu__Level_2__unc_quantile_normalization__data | Analyte Replicate Filter | TCGA-28-1751-01A-02T-0599-07 | TCGA-28-1751-01A-02T-0675-07 |
| TCGA-27-1833 | mirna__h_mirna_8x15k__unc_edu__Level_2__unc_quantile_normalization__data | Analyte Replicate Filter | TCGA-27-1833-01A-01T-0599-07 | TCGA-27-1833-01A-01T-0656-07 |
| TCGA-14-1825 | mirna__h_mirna_8x15k__unc_edu__Level_2__unc_quantile_normalization__data | Analyte Replicate Filter | TCGA-14-1825-01A-01T-0599-07 | TCGA-14-1825-01A-01T-0656-07 |
| TCGA-06-0148 | methylation__illuminadnamethylation_oma003_cpi__jhu_usc_edu__Level_2__within_bioassay_data_set_function__data | Sort Replicate Filter | TCGA-06-0148-01A-04D-0242-05,TCGA-06-0148-01A-03D-0242-05 | TCGA-06-0148-01A-05D-0242-05 |
| TCGA-06-0156 | methylation__illuminadnamethylation_oma003_cpi__jhu_usc_edu__Level_2__within_bioassay_data_set_function__data | Sort Replicate Filter | TCGA-06-0156-01A-02D-0242-05 | TCGA-06-0156-01A-03D-0242-05 |
| TCGA-06-0137 | methylation__illuminadnamethylation_oma003_cpi__jhu_usc_edu__Level_2__within_bioassay_data_set_function__data | Sort Replicate Filter | TCGA-06-0137-01A-02D-0218-05,TCGA-06-0137-01A-01D-0218-05 | TCGA-06-0137-01B-02D-0218-05 |
| TCGA-06-0145 | methylation__illuminadnamethylation_oma003_cpi__jhu_usc_edu__Level_2__within_bioassay_data_set_function__data | Sort Replicate Filter | TCGA-06-0145-01A-05D-0218-05,TCGA-06-0145-01A-04D-0218-05,TCGA-06-0145-01A-02D-0218-05,TCGA-06-0145-01A-03D-0218-05 | TCGA-06-0145-01A-06D-0218-05 |
| TCGA-06-0129 | snp__genome_wide_snp_6__broad_mit_edu__Level_3__segmented_scna_minus_germline_cnv_hg19__seg | Analyte Replicate Filter | TCGA-06-0129-10A-01G-0289-01 | TCGA-06-0129-10A-01D-0214-01 |
| TCGA-06-0141 | snp__genome_wide_snp_6__broad_mit_edu__Level_3__segmented_scna_minus_germline_cnv_hg19__seg | Analyte Replicate Filter | TCGA-06-0141-10A-01G-0289-01 | TCGA-06-0141-10A-01D-0214-01 |
| TCGA-06-0143 | snp__genome_wide_snp_6__broad_mit_edu__Level_3__segmented_scna_minus_germline_cnv_hg19__seg | Analyte Replicate Filter | TCGA-06-0143-10A-01G-0289-01 | TCGA-06-0143-10A-01D-0214-01 |
| TCGA-06-0147 | snp__genome_wide_snp_6__broad_mit_edu__Level_3__segmented_scna_minus_germline_cnv_hg19__seg | Analyte Replicate Filter | TCGA-06-0147-10A-01D-0214-01 | TCGA-06-0147-10A-01D-0237-01 |
| TCGA-06-0128 | snp__genome_wide_snp_6__broad_mit_edu__Level_3__segmented_scna_minus_germline_cnv_hg19__seg | Analyte Replicate Filter | TCGA-06-0128-10A-01G-0289-01 | TCGA-06-0128-10A-01D-0214-01 |
| TCGA-06-0166 | snp__genome_wide_snp_6__broad_mit_edu__Level_3__segmented_scna_minus_germline_cnv_hg19__seg | Analyte Replicate Filter | TCGA-06-0166-01A-01G-0289-01 | TCGA-06-0166-01A-01D-0236-01 |
| TCGA-06-0126 | snp__genome_wide_snp_6__broad_mit_edu__Level_3__segmented_scna_minus_germline_cnv_hg19__seg | Analyte Replicate Filter | TCGA-06-0126-10A-01G-0289-01 | TCGA-06-0126-10A-01D-0214-01 |
| TCGA-06-0124 | snp__genome_wide_snp_6__broad_mit_edu__Level_3__segmented_scna_minus_germline_cnv_hg19__seg | Analyte Replicate Filter | TCGA-06-0124-10A-01G-0289-01 | TCGA-06-0124-10A-01D-0214-01 |
| TCGA-06-0130 | snp__genome_wide_snp_6__broad_mit_edu__Level_3__segmented_scna_minus_germline_cnv_hg19__seg | Analyte Replicate Filter | TCGA-06-0130-01A-01G-0289-01 | TCGA-06-0130-01A-01D-0214-01 |
| TCGA-06-0125 | snp__genome_wide_snp_6__broad_mit_edu__Level_3__segmented_scna_minus_germline_cnv_hg19__seg | Analyte Replicate Filter | TCGA-06-0125-10A-01G-0289-01 | TCGA-06-0125-10A-01D-0214-01 |
| TCGA-06-0126 | snp__genome_wide_snp_6__broad_mit_edu__Level_3__segmented_scna_minus_germline_cnv_hg19__seg | Analyte Replicate Filter | TCGA-06-0126-01A-01G-0289-01 | TCGA-06-0126-01A-01D-0214-01 |
| TCGA-06-0143 | snp__genome_wide_snp_6__broad_mit_edu__Level_3__segmented_scna_minus_germline_cnv_hg19__seg | Analyte Replicate Filter | TCGA-06-0143-01A-01G-0289-01 | TCGA-06-0143-01A-01D-0214-01 |
| TCGA-06-0141 | snp__genome_wide_snp_6__broad_mit_edu__Level_3__segmented_scna_minus_germline_cnv_hg19__seg | Analyte Replicate Filter | TCGA-06-0141-01A-01G-0289-01 | TCGA-06-0141-01A-01D-0214-01 |
| TCGA-06-0125 | snp__genome_wide_snp_6__broad_mit_edu__Level_3__segmented_scna_minus_germline_cnv_hg19__seg | Analyte Replicate Filter | TCGA-06-0125-01A-01G-0289-01 | TCGA-06-0125-01A-01D-0214-01 |
| TCGA-06-0122 | snp__genome_wide_snp_6__broad_mit_edu__Level_3__segmented_scna_minus_germline_cnv_hg19__seg | Analyte Replicate Filter | TCGA-06-0122-01A-01G-0289-01 | TCGA-06-0122-01A-01D-0214-01 |
| TCGA-06-0130 | snp__genome_wide_snp_6__broad_mit_edu__Level_3__segmented_scna_minus_germline_cnv_hg19__seg | Analyte Replicate Filter | TCGA-06-0130-10A-01G-0289-01 | TCGA-06-0130-10A-01D-0214-01 |
| TCGA-06-0124 | snp__genome_wide_snp_6__broad_mit_edu__Level_3__segmented_scna_minus_germline_cnv_hg19__seg | Analyte Replicate Filter | TCGA-06-0124-01A-01G-0289-01 | TCGA-06-0124-01A-01D-0214-01 |
| TCGA-06-0128 | snp__genome_wide_snp_6__broad_mit_edu__Level_3__segmented_scna_minus_germline_cnv_hg19__seg | Analyte Replicate Filter | TCGA-06-0128-01A-01G-0289-01 | TCGA-06-0128-01A-01D-0214-01 |
| TCGA-06-0216 | snp__genome_wide_snp_6__broad_mit_edu__Level_3__segmented_scna_minus_germline_cnv_hg19__seg | Analyte Replicate Filter | TCGA-06-0216-10A-01D-0237-01 | TCGA-06-0216-10A-01D-0333-01 |
| TCGA-06-0147 | cna__hg_cgh_244a__mskcc_org__Level_2__bioassay_data_transformation__data | Analyte Replicate Filter | TCGA-06-0147-10A-01D-0215-04 | TCGA-06-0147-10A-01D-0239-04 |
| TCGA-06-0137 | cna__hg_cgh_244a__mskcc_org__Level_2__bioassay_data_transformation__data | Sort Replicate Filter | TCGA-06-0137-01A-01D-0215-04,TCGA-06-0137-01A-02D-0215-04 | TCGA-06-0137-01B-02D-0215-04 |
| TCGA-08-0350 | cna__hg_cgh_244a__mskcc_org__Level_2__bioassay_data_transformation__data | Analyte Replicate Filter | TCGA-08-0350-01A-01G-0294-04 | TCGA-08-0350-01A-01D-0304-04 |
| TCGA-08-0354 | cna__hg_cgh_244a__mskcc_org__Level_2__bioassay_data_transformation__data | Analyte Replicate Filter | TCGA-08-0354-01A-01G-0294-04 | TCGA-08-0354-01A-01D-0304-04 |
| TCGA-08-0380 | cna__hg_cgh_244a__mskcc_org__Level_2__bioassay_data_transformation__data | Analyte Replicate Filter | TCGA-08-0380-01A-01G-0294-04 | TCGA-08-0380-01A-01D-0304-04 |
| TCGA-08-0375 | cna__hg_cgh_244a__mskcc_org__Level_2__bioassay_data_transformation__data | Analyte Replicate Filter | TCGA-08-0375-01A-01G-0294-04 | TCGA-08-0375-01A-01D-0304-04 |
| TCGA-08-0344 | cna__hg_cgh_244a__mskcc_org__Level_2__bioassay_data_transformation__data | Analyte Replicate Filter | TCGA-08-0344-01A-01G-0294-04 | TCGA-08-0344-01A-01D-0304-04 |
| TCGA-06-0148 | cna__hg_cgh_244a__mskcc_org__Level_2__bioassay_data_transformation__data | Sort Replicate Filter | TCGA-06-0148-01A-03D-0238-04,TCGA-06-0148-01A-04D-0238-04 | TCGA-06-0148-01A-05D-0238-04 |
| TCGA-06-0156 | cna__hg_cgh_244a__mskcc_org__Level_2__bioassay_data_transformation__data | Sort Replicate Filter | TCGA-06-0156-01A-02D-0238-04 | TCGA-06-0156-01A-03D-0238-04 |
| TCGA-06-0148 | cna__hg_cgh_244a__mskcc_org__Level_2__bioassay_data_transformation__data | Analyte Replicate Filter | TCGA-06-0148-10A-01D-0215-04 | TCGA-06-0148-10A-01D-0239-04 |
| TCGA-06-0216 | cna__hg_cgh_244a__mskcc_org__Level_2__bioassay_data_transformation__data | Analyte Replicate Filter | TCGA-06-0216-10A-01D-0239-04 | TCGA-06-0216-10A-01D-0334-04 |
| TCGA-06-0145 | cna__hg_cgh_244a__mskcc_org__Level_2__bioassay_data_transformation__data | Sort Replicate Filter | TCGA-06-0145-01A-02D-0215-04,TCGA-06-0145-01A-03D-0215-04,TCGA-06-0145-01A-04D-0215-04,TCGA-06-0145-01A-05D-0215-04 | TCGA-06-0145-01A-06D-0215-04 |
| TCGA-08-0351 | cna__hg_cgh_244a__mskcc_org__Level_2__bioassay_data_transformation__data | Analyte Replicate Filter | TCGA-08-0351-01A-01G-0294-04 | TCGA-08-0351-01A-01D-0304-04 |
| TCGA-06-0129 | snp__genome_wide_snp_6__broad_mit_edu__Level_2__tangent_copynumber__data | Analyte Replicate Filter | TCGA-06-0129-10A-01G-0289-01 | TCGA-06-0129-10A-01D-0214-01 |
| TCGA-06-0141 | snp__genome_wide_snp_6__broad_mit_edu__Level_2__tangent_copynumber__data | Analyte Replicate Filter | TCGA-06-0141-10A-01G-0289-01 | TCGA-06-0141-10A-01D-0214-01 |
| TCGA-06-0143 | snp__genome_wide_snp_6__broad_mit_edu__Level_2__tangent_copynumber__data | Analyte Replicate Filter | TCGA-06-0143-10A-01G-0289-01 | TCGA-06-0143-10A-01D-0214-01 |
| TCGA-06-0147 | snp__genome_wide_snp_6__broad_mit_edu__Level_2__tangent_copynumber__data | Analyte Replicate Filter | TCGA-06-0147-10A-01D-0214-01 | TCGA-06-0147-10A-01D-0237-01 |
| TCGA-06-0128 | snp__genome_wide_snp_6__broad_mit_edu__Level_2__tangent_copynumber__data | Analyte Replicate Filter | TCGA-06-0128-10A-01G-0289-01 | TCGA-06-0128-10A-01D-0214-01 |
| TCGA-06-0166 | snp__genome_wide_snp_6__broad_mit_edu__Level_2__tangent_copynumber__data | Analyte Replicate Filter | TCGA-06-0166-01A-01G-0289-01 | TCGA-06-0166-01A-01D-0236-01 |
| TCGA-06-0126 | snp__genome_wide_snp_6__broad_mit_edu__Level_2__tangent_copynumber__data | Analyte Replicate Filter | TCGA-06-0126-10A-01G-0289-01 | TCGA-06-0126-10A-01D-0214-01 |
| TCGA-06-0124 | snp__genome_wide_snp_6__broad_mit_edu__Level_2__tangent_copynumber__data | Analyte Replicate Filter | TCGA-06-0124-10A-01G-0289-01 | TCGA-06-0124-10A-01D-0214-01 |
| TCGA-06-0130 | snp__genome_wide_snp_6__broad_mit_edu__Level_2__tangent_copynumber__data | Analyte Replicate Filter | TCGA-06-0130-01A-01G-0289-01 | TCGA-06-0130-01A-01D-0214-01 |
| TCGA-06-0125 | snp__genome_wide_snp_6__broad_mit_edu__Level_2__tangent_copynumber__data | Analyte Replicate Filter | TCGA-06-0125-10A-01G-0289-01 | TCGA-06-0125-10A-01D-0214-01 |
| TCGA-06-0126 | snp__genome_wide_snp_6__broad_mit_edu__Level_2__tangent_copynumber__data | Analyte Replicate Filter | TCGA-06-0126-01A-01G-0289-01 | TCGA-06-0126-01A-01D-0214-01 |
| TCGA-06-0143 | snp__genome_wide_snp_6__broad_mit_edu__Level_2__tangent_copynumber__data | Analyte Replicate Filter | TCGA-06-0143-01A-01G-0289-01 | TCGA-06-0143-01A-01D-0214-01 |
| TCGA-06-0141 | snp__genome_wide_snp_6__broad_mit_edu__Level_2__tangent_copynumber__data | Analyte Replicate Filter | TCGA-06-0141-01A-01G-0289-01 | TCGA-06-0141-01A-01D-0214-01 |
| TCGA-06-0125 | snp__genome_wide_snp_6__broad_mit_edu__Level_2__tangent_copynumber__data | Analyte Replicate Filter | TCGA-06-0125-01A-01G-0289-01 | TCGA-06-0125-01A-01D-0214-01 |
| TCGA-06-0122 | snp__genome_wide_snp_6__broad_mit_edu__Level_2__tangent_copynumber__data | Analyte Replicate Filter | TCGA-06-0122-01A-01G-0289-01 | TCGA-06-0122-01A-01D-0214-01 |
| TCGA-06-0130 | snp__genome_wide_snp_6__broad_mit_edu__Level_2__tangent_copynumber__data | Analyte Replicate Filter | TCGA-06-0130-10A-01G-0289-01 | TCGA-06-0130-10A-01D-0214-01 |
| TCGA-06-0124 | snp__genome_wide_snp_6__broad_mit_edu__Level_2__tangent_copynumber__data | Analyte Replicate Filter | TCGA-06-0124-01A-01G-0289-01 | TCGA-06-0124-01A-01D-0214-01 |
| TCGA-06-0128 | snp__genome_wide_snp_6__broad_mit_edu__Level_2__tangent_copynumber__data | Analyte Replicate Filter | TCGA-06-0128-01A-01G-0289-01 | TCGA-06-0128-01A-01D-0214-01 |
| TCGA-06-0216 | snp__genome_wide_snp_6__broad_mit_edu__Level_2__tangent_copynumber__data | Analyte Replicate Filter | TCGA-06-0216-10A-01D-0237-01 | TCGA-06-0216-10A-01D-0333-01 |
| TCGA-06-0147 | snp__humanhap550__hudsonalpha_org__Level_2__B_allele_freq__data | Analyte Replicate Filter | TCGA-06-0147-10A-01D-0216-06 | TCGA-06-0147-10A-01D-0241-06 |
| TCGA-06-0148 | snp__humanhap550__hudsonalpha_org__Level_2__B_allele_freq__data | Analyte Replicate Filter | TCGA-06-0148-10A-01D-0216-06 | TCGA-06-0148-10A-01D-0241-06 |
| TCGA-06-0156 | rnaseqv2__illuminahiseq_rnaseqv2__unc_edu__Level_3__RSEM_genes_normalized__data | Sort Replicate Filter | TCGA-06-0156-01A-02R-1849-01 | TCGA-06-0156-01A-03R-1849-01 |
| TCGA-06-0137 | exon__huex_1_0_st_v2__lbl_gov__Level_3__quantile_normalization_gene__data | Sort Replicate Filter | TCGA-06-0137-01A-01R-0212-03,TCGA-06-0137-01A-02R-0212-03 | TCGA-06-0137-01B-02R-0212-03 |
| TCGA-06-0148 | exon__huex_1_0_st_v2__lbl_gov__Level_3__quantile_normalization_gene__data | Sort Replicate Filter | TCGA-06-0148-01A-03R-0232-03,TCGA-06-0148-01A-04R-0232-03 | TCGA-06-0148-01A-05R-0232-03 |
| TCGA-06-0156 | exon__huex_1_0_st_v2__lbl_gov__Level_3__quantile_normalization_gene__data | Sort Replicate Filter | TCGA-06-0156-01A-02R-0232-03 | TCGA-06-0156-01A-03R-0232-03 |
| TCGA-06-0145 | exon__huex_1_0_st_v2__lbl_gov__Level_3__quantile_normalization_gene__data | Sort Replicate Filter | TCGA-06-0145-01A-02R-0212-03,TCGA-06-0145-01A-05R-0212-03,TCGA-06-0145-01A-04R-0212-03,TCGA-06-0145-01A-03R-0212-03 | TCGA-06-0145-01A-06R-0212-03 |
| TCGA-06-0137 | exon__huex_1_0_st_v2__lbl_gov__Level_3__segmented_as_firma__data | Sort Replicate Filter | TCGA-06-0137-01A-01R-0212-03,TCGA-06-0137-01A-02R-0212-03 | TCGA-06-0137-01B-02R-0212-03 |
| TCGA-06-0148 | exon__huex_1_0_st_v2__lbl_gov__Level_3__segmented_as_firma__data | Sort Replicate Filter | TCGA-06-0148-01A-03R-0232-03,TCGA-06-0148-01A-04R-0232-03 | TCGA-06-0148-01A-05R-0232-03 |
| TCGA-06-0156 | exon__huex_1_0_st_v2__lbl_gov__Level_3__segmented_as_firma__data | Sort Replicate Filter | TCGA-06-0156-01A-02R-0232-03 | TCGA-06-0156-01A-03R-0232-03 |
| TCGA-06-0145 | exon__huex_1_0_st_v2__lbl_gov__Level_3__segmented_as_firma__data | Sort Replicate Filter | TCGA-06-0145-01A-02R-0212-03,TCGA-06-0145-01A-05R-0212-03,TCGA-06-0145-01A-04R-0212-03,TCGA-06-0145-01A-03R-0212-03 | TCGA-06-0145-01A-06R-0212-03 |
| TCGA-06-0156 | rnaseqv2__illuminahiseq_rnaseqv2__unc_edu__Level_3__RSEM_isoforms_normalized__data | Sort Replicate Filter | TCGA-06-0156-01A-02R-1849-01 | TCGA-06-0156-01A-03R-1849-01 |
| TCGA-06-0129 | snp__genome_wide_snp_6__broad_mit_edu__Level_2__after_5NN_copy_number__data | Analyte Replicate Filter | TCGA-06-0129-10A-01G-0289-01 | TCGA-06-0129-10A-01D-0214-01 |
| TCGA-06-0141 | snp__genome_wide_snp_6__broad_mit_edu__Level_2__after_5NN_copy_number__data | Analyte Replicate Filter | TCGA-06-0141-10A-01G-0289-01 | TCGA-06-0141-10A-01D-0214-01 |
| TCGA-06-0126 | snp__genome_wide_snp_6__broad_mit_edu__Level_2__after_5NN_copy_number__data | Analyte Replicate Filter | TCGA-06-0126-01A-01G-0289-01 | TCGA-06-0126-01A-01D-0214-01 |
| TCGA-06-0143 | snp__genome_wide_snp_6__broad_mit_edu__Level_2__after_5NN_copy_number__data | Analyte Replicate Filter | TCGA-06-0143-10A-01G-0289-01 | TCGA-06-0143-10A-01D-0214-01 |
| TCGA-06-0147 | snp__genome_wide_snp_6__broad_mit_edu__Level_2__after_5NN_copy_number__data | Analyte Replicate Filter | TCGA-06-0147-10A-01D-0214-01 | TCGA-06-0147-10A-01D-0237-01 |
| TCGA-06-0128 | snp__genome_wide_snp_6__broad_mit_edu__Level_2__after_5NN_copy_number__data | Analyte Replicate Filter | TCGA-06-0128-10A-01G-0289-01 | TCGA-06-0128-10A-01D-0214-01 |
| TCGA-06-0166 | snp__genome_wide_snp_6__broad_mit_edu__Level_2__after_5NN_copy_number__data | Analyte Replicate Filter | TCGA-06-0166-01A-01G-0289-01 | TCGA-06-0166-01A-01D-0236-01 |
| TCGA-06-0137 | snp__genome_wide_snp_6__broad_mit_edu__Level_2__after_5NN_copy_number__data | Sort Replicate Filter | TCGA-06-0137-01A-01D-0214-01,TCGA-06-0137-01A-02D-0214-01 | TCGA-06-0137-01B-02D-0214-01 |
| TCGA-06-0126 | snp__genome_wide_snp_6__broad_mit_edu__Level_2__after_5NN_copy_number__data | Analyte Replicate Filter | TCGA-06-0126-10A-01G-0289-01 | TCGA-06-0126-10A-01D-0214-01 |
| TCGA-06-0124 | snp__genome_wide_snp_6__broad_mit_edu__Level_2__after_5NN_copy_number__data | Analyte Replicate Filter | TCGA-06-0124-10A-01G-0289-01 | TCGA-06-0124-10A-01D-0214-01 |
| TCGA-06-0130 | snp__genome_wide_snp_6__broad_mit_edu__Level_2__after_5NN_copy_number__data | Analyte Replicate Filter | TCGA-06-0130-01A-01G-0289-01 | TCGA-06-0130-01A-01D-0214-01 |
| TCGA-06-0125 | snp__genome_wide_snp_6__broad_mit_edu__Level_2__after_5NN_copy_number__data | Analyte Replicate Filter | TCGA-06-0125-10A-01G-0289-01 | TCGA-06-0125-10A-01D-0214-01 |
| TCGA-06-0128 | snp__genome_wide_snp_6__broad_mit_edu__Level_2__after_5NN_copy_number__data | Analyte Replicate Filter | TCGA-06-0128-01A-01G-0289-01 | TCGA-06-0128-01A-01D-0214-01 |
| TCGA-06-0143 | snp__genome_wide_snp_6__broad_mit_edu__Level_2__after_5NN_copy_number__data | Analyte Replicate Filter | TCGA-06-0143-01A-01G-0289-01 | TCGA-06-0143-01A-01D-0214-01 |
| TCGA-06-0141 | snp__genome_wide_snp_6__broad_mit_edu__Level_2__after_5NN_copy_number__data | Analyte Replicate Filter | TCGA-06-0141-01A-01G-0289-01 | TCGA-06-0141-01A-01D-0214-01 |
| TCGA-06-0125 | snp__genome_wide_snp_6__broad_mit_edu__Level_2__after_5NN_copy_number__data | Analyte Replicate Filter | TCGA-06-0125-01A-01G-0289-01 | TCGA-06-0125-01A-01D-0214-01 |
| TCGA-06-0122 | snp__genome_wide_snp_6__broad_mit_edu__Level_2__after_5NN_copy_number__data | Analyte Replicate Filter | TCGA-06-0122-01A-01G-0289-01 | TCGA-06-0122-01A-01D-0214-01 |
| TCGA-06-0130 | snp__genome_wide_snp_6__broad_mit_edu__Level_2__after_5NN_copy_number__data | Analyte Replicate Filter | TCGA-06-0130-10A-01G-0289-01 | TCGA-06-0130-10A-01D-0214-01 |
| TCGA-06-0124 | snp__genome_wide_snp_6__broad_mit_edu__Level_2__after_5NN_copy_number__data | Analyte Replicate Filter | TCGA-06-0124-01A-01G-0289-01 | TCGA-06-0124-01A-01D-0214-01 |
| TCGA-06-0216 | snp__genome_wide_snp_6__broad_mit_edu__Level_2__after_5NN_copy_number__data | Analyte Replicate Filter | TCGA-06-0216-10A-01D-0237-01 | TCGA-06-0216-10A-01D-0333-01 |
| TCGA-06-0145 | snp__genome_wide_snp_6__broad_mit_edu__Level_2__after_5NN_copy_number__data | Sort Replicate Filter | TCGA-06-0145-01A-03D-0214-01,TCGA-06-0145-01A-04D-0214-01,TCGA-06-0145-01A-05D-0214-01 | TCGA-06-0145-01A-06D-0214-01 |
| TCGA-19-1788 | mirna__h_mirna_8x15k__unc_edu__Level_3__unc_DWD_Batch_adjusted__data | Analyte Replicate Filter | TCGA-19-1788-01A-01T-0599-07 | TCGA-19-1788-01A-01T-0656-07 |
| TCGA-26-1799 | mirna__h_mirna_8x15k__unc_edu__Level_3__unc_DWD_Batch_adjusted__data | Analyte Replicate Filter | TCGA-26-1799-01A-02T-0599-07 | TCGA-26-1799-01A-02T-0656-07 |
| TCGA-28-1751 | mirna__h_mirna_8x15k__unc_edu__Level_3__unc_DWD_Batch_adjusted__data | Analyte Replicate Filter | TCGA-28-1751-01A-02T-0599-07 | TCGA-28-1751-01A-02T-0675-07 |
| TCGA-27-1833 | mirna__h_mirna_8x15k__unc_edu__Level_3__unc_DWD_Batch_adjusted__data | Analyte Replicate Filter | TCGA-27-1833-01A-01T-0599-07 | TCGA-27-1833-01A-01T-0656-07 |
| TCGA-14-1825 | mirna__h_mirna_8x15k__unc_edu__Level_3__unc_DWD_Batch_adjusted__data | Analyte Replicate Filter | TCGA-14-1825-01A-01T-0599-07 | TCGA-14-1825-01A-01T-0656-07 |
| TCGA-06-0137 | transcriptome__ht_hg_u133a__broad_mit_edu__Level_3__gene_rma__data | Sort Replicate Filter | TCGA-06-0137-01A-02R-0219-01,TCGA-06-0137-01A-01R-0219-01 | TCGA-06-0137-01B-02R-0219-01 |
| TCGA-06-0148 | transcriptome__ht_hg_u133a__broad_mit_edu__Level_3__gene_rma__data | Sort Replicate Filter | TCGA-06-0148-01A-03R-0233-01,TCGA-06-0148-01A-04R-0233-01 | TCGA-06-0148-01A-05R-0233-01 |
| TCGA-06-0156 | transcriptome__ht_hg_u133a__broad_mit_edu__Level_3__gene_rma__data | Sort Replicate Filter | TCGA-06-0156-01A-02R-0233-01 | TCGA-06-0156-01A-03R-0233-01 |
| TCGA-06-0145 | transcriptome__ht_hg_u133a__broad_mit_edu__Level_3__gene_rma__data | Sort Replicate Filter | TCGA-06-0145-01A-02R-0219-01,TCGA-06-0145-01A-04R-0219-01,TCGA-06-0145-01A-03R-0219-01,TCGA-06-0145-01A-05R-0219-01 | TCGA-06-0145-01A-06R-0219-01 |
| TCGA-06-0156 | rnaseqv2__illuminahiseq_rnaseqv2__unc_edu__Level_3__junction_quantification__data | Sort Replicate Filter | TCGA-06-0156-01A-02R-1849-01 | TCGA-06-0156-01A-03R-1849-01 |
| TCGA-06-0129 | cna__hg_cgh_244a__hms_harvard_edu__Level_1__image_acquisition__data | Analyte Replicate Filter | TCGA-06-0129-10A-01G-0288-02 | TCGA-06-0129-10A-01D-0217-02 |
| TCGA-06-0141 | cna__hg_cgh_244a__hms_harvard_edu__Level_1__image_acquisition__data | Analyte Replicate Filter | TCGA-06-0141-10A-01G-0288-02 | TCGA-06-0141-10A-01D-0217-02 |
| TCGA-06-0126 | cna__hg_cgh_244a__hms_harvard_edu__Level_1__image_acquisition__data | Analyte Replicate Filter | TCGA-06-0126-01A-01G-0288-02 | TCGA-06-0126-01A-01D-0217-02 |
| TCGA-06-0143 | cna__hg_cgh_244a__hms_harvard_edu__Level_1__image_acquisition__data | Analyte Replicate Filter | TCGA-06-0143-10A-01G-0288-02 | TCGA-06-0143-10A-01D-0217-02 |
| TCGA-06-0128 | cna__hg_cgh_244a__hms_harvard_edu__Level_1__image_acquisition__data | Analyte Replicate Filter | TCGA-06-0128-10A-01G-0288-02 | TCGA-06-0128-10A-01D-0217-02 |
| TCGA-06-0166 | cna__hg_cgh_244a__hms_harvard_edu__Level_1__image_acquisition__data | Analyte Replicate Filter | TCGA-06-0166-01A-01G-0288-02 | TCGA-06-0166-01A-01D-0234-02 |
| TCGA-06-0122 | cna__hg_cgh_244a__hms_harvard_edu__Level_1__image_acquisition__data | Analyte Replicate Filter | TCGA-06-0122-10A-01G-0288-02 | TCGA-06-0122-10A-01D-0217-02 |
| TCGA-06-0137 | cna__hg_cgh_244a__hms_harvard_edu__Level_1__image_acquisition__data | Sort Replicate Filter | TCGA-06-0137-01A-01D-0217-02,TCGA-06-0137-01A-02D-0217-02 | TCGA-06-0137-01B-02D-0217-02 |
| TCGA-06-0126 | cna__hg_cgh_244a__hms_harvard_edu__Level_1__image_acquisition__data | Analyte Replicate Filter | TCGA-06-0126-10A-01G-0288-02 | TCGA-06-0126-10A-01D-0217-02 |
| TCGA-06-0124 | cna__hg_cgh_244a__hms_harvard_edu__Level_1__image_acquisition__data | Analyte Replicate Filter | TCGA-06-0124-10A-01G-0288-02 | TCGA-06-0124-10A-01D-0217-02 |
| TCGA-06-0130 | cna__hg_cgh_244a__hms_harvard_edu__Level_1__image_acquisition__data | Analyte Replicate Filter | TCGA-06-0130-01A-01G-0288-02 | TCGA-06-0130-01A-01D-0217-02 |
| TCGA-06-0125 | cna__hg_cgh_244a__hms_harvard_edu__Level_1__image_acquisition__data | Analyte Replicate Filter | TCGA-06-0125-10A-01G-0288-02 | TCGA-06-0125-10A-01D-0217-02 |
| TCGA-06-0129 | cna__hg_cgh_244a__hms_harvard_edu__Level_1__image_acquisition__data | Analyte Replicate Filter | TCGA-06-0129-01A-01G-0288-02 | TCGA-06-0129-01A-01D-0217-02 |
| TCGA-06-0128 | cna__hg_cgh_244a__hms_harvard_edu__Level_1__image_acquisition__data | Analyte Replicate Filter | TCGA-06-0128-01A-01G-0288-02 | TCGA-06-0128-01A-01D-0217-02 |
| TCGA-06-0166 | cna__hg_cgh_244a__hms_harvard_edu__Level_1__image_acquisition__data | Analyte Replicate Filter | TCGA-06-0166-10A-01G-0288-02 | TCGA-06-0166-10A-01D-0235-02 |
| TCGA-06-0211 | cna__hg_cgh_244a__hms_harvard_edu__Level_1__image_acquisition__data | Sort Replicate Filter | TCGA-06-0211-01A-01D-0234-02 | TCGA-06-0211-01B-01D-0234-02 |
| TCGA-06-0143 | cna__hg_cgh_244a__hms_harvard_edu__Level_1__image_acquisition__data | Analyte Replicate Filter | TCGA-06-0143-01A-01G-0288-02 | TCGA-06-0143-01A-01D-0271-02 |
| TCGA-06-0208 | cna__hg_cgh_244a__hms_harvard_edu__Level_1__image_acquisition__data | Sort Replicate Filter | TCGA-06-0208-01A-01D-0234-02 | TCGA-06-0208-01B-01D-0234-02 |
| TCGA-06-0141 | cna__hg_cgh_244a__hms_harvard_edu__Level_1__image_acquisition__data | Analyte Replicate Filter | TCGA-06-0141-01A-01G-0288-02 | TCGA-06-0141-01A-01D-0217-02 |
| TCGA-06-0176 | cna__hg_cgh_244a__hms_harvard_edu__Level_1__image_acquisition__data | Sort Replicate Filter | TCGA-06-0176-01A-02D-0234-02 | TCGA-06-0176-01A-03D-0234-02 |
| TCGA-06-0168 | cna__hg_cgh_244a__hms_harvard_edu__Level_1__image_acquisition__data | Sort Replicate Filter | TCGA-06-0168-01A-01D-0234-02 | TCGA-06-0168-01A-02D-0234-02 |
| TCGA-06-0125 | cna__hg_cgh_244a__hms_harvard_edu__Level_1__image_acquisition__data | Analyte Replicate Filter | TCGA-06-0125-01A-01G-0288-02 | TCGA-06-0125-01A-01D-0217-02 |
| TCGA-06-0122 | cna__hg_cgh_244a__hms_harvard_edu__Level_1__image_acquisition__data | Analyte Replicate Filter | TCGA-06-0122-01A-01G-0288-02 | TCGA-06-0122-01A-01D-0217-02 |
| TCGA-06-0148 | cna__hg_cgh_244a__hms_harvard_edu__Level_1__image_acquisition__data | Sort Replicate Filter | TCGA-06-0148-01A-01D-0217-02,TCGA-06-0148-01A-03D-0234-02,TCGA-06-0148-01A-04D-0234-02 | TCGA-06-0148-01A-05D-0234-02 |
| TCGA-06-0216 | cna__hg_cgh_244a__hms_harvard_edu__Level_1__image_acquisition__data | Analyte Replicate Filter | TCGA-06-0216-01A-01D-0234-02 | TCGA-06-0216-01B-01D-0336-02 |
| TCGA-06-0156 | cna__hg_cgh_244a__hms_harvard_edu__Level_1__image_acquisition__data | Sort Replicate Filter | TCGA-06-0156-01A-01D-0234-02,TCGA-06-0156-01A-02D-0234-02 | TCGA-06-0156-01A-03D-0234-02 |
| TCGA-06-0138 | cna__hg_cgh_244a__hms_harvard_edu__Level_1__image_acquisition__data | Sort Replicate Filter | TCGA-06-0138-01A-01D-0234-02 | TCGA-06-0138-01A-02D-0234-02 |
| TCGA-06-0147 | cna__hg_cgh_244a__hms_harvard_edu__Level_1__image_acquisition__data | Analyte Replicate Filter | TCGA-06-0147-01A-01D-0217-02 | TCGA-06-0147-01A-02D-0234-02 |
| TCGA-06-0210 | cna__hg_cgh_244a__hms_harvard_edu__Level_1__image_acquisition__data | Analyte Replicate Filter | TCGA-06-0210-01B-01D-0234-02 | TCGA-06-0210-01A-01D-0271-02 |
| TCGA-06-0130 | cna__hg_cgh_244a__hms_harvard_edu__Level_1__image_acquisition__data | Analyte Replicate Filter | TCGA-06-0130-10A-01G-0288-02 | TCGA-06-0130-10A-01D-0217-02 |
| TCGA-06-0124 | cna__hg_cgh_244a__hms_harvard_edu__Level_1__image_acquisition__data | Analyte Replicate Filter | TCGA-06-0124-01A-01G-0288-02 | TCGA-06-0124-01A-01D-0217-02 |
| TCGA-06-0145 | cna__hg_cgh_244a__hms_harvard_edu__Level_1__image_acquisition__data | Sort Replicate Filter | TCGA-06-0145-01A-02D-0217-02,TCGA-06-0145-01A-03D-0217-02,TCGA-06-0145-01A-04D-0217-02,TCGA-06-0145-01A-05D-0217-02 | TCGA-06-0145-01A-06D-0217-02 |
| TCGA-06-0154 | cna__hg_cgh_244a__hms_harvard_edu__Level_1__image_acquisition__data | Sort Replicate Filter | TCGA-06-0154-01A-02D-0234-02 | TCGA-06-0154-01A-03D-0234-02 |
| TCGA-06-0129 | snp__genome_wide_snp_6__broad_mit_edu__Level_1__image_acquisition__data | Analyte Replicate Filter | TCGA-06-0129-10A-01G-0289-01 | TCGA-06-0129-10A-01D-0214-01 |
| TCGA-06-0141 | snp__genome_wide_snp_6__broad_mit_edu__Level_1__image_acquisition__data | Analyte Replicate Filter | TCGA-06-0141-10A-01G-0289-01 | TCGA-06-0141-10A-01D-0214-01 |
| TCGA-06-0126 | snp__genome_wide_snp_6__broad_mit_edu__Level_1__image_acquisition__data | Analyte Replicate Filter | TCGA-06-0126-01A-01G-0289-01 | TCGA-06-0126-01A-01D-0214-01 |
| TCGA-06-0143 | snp__genome_wide_snp_6__broad_mit_edu__Level_1__image_acquisition__data | Analyte Replicate Filter | TCGA-06-0143-10A-01G-0289-01 | TCGA-06-0143-10A-01D-0214-01 |
| TCGA-06-0147 | snp__genome_wide_snp_6__broad_mit_edu__Level_1__image_acquisition__data | Analyte Replicate Filter | TCGA-06-0147-10A-01D-0214-01 | TCGA-06-0147-10A-01D-0237-01 |
| TCGA-06-0128 | snp__genome_wide_snp_6__broad_mit_edu__Level_1__image_acquisition__data | Analyte Replicate Filter | TCGA-06-0128-10A-01G-0289-01 | TCGA-06-0128-10A-01D-0214-01 |
| TCGA-06-0166 | snp__genome_wide_snp_6__broad_mit_edu__Level_1__image_acquisition__data | Analyte Replicate Filter | TCGA-06-0166-01A-01G-0289-01 | TCGA-06-0166-01A-01D-0236-01 |
| TCGA-06-0122 | snp__genome_wide_snp_6__broad_mit_edu__Level_1__image_acquisition__data | Analyte Replicate Filter | TCGA-06-0122-10A-01G-0289-01 | TCGA-06-0122-10A-01D-0214-01 |
| TCGA-06-0137 | snp__genome_wide_snp_6__broad_mit_edu__Level_1__image_acquisition__data | Sort Replicate Filter | TCGA-06-0137-01A-01D-0214-01,TCGA-06-0137-01A-02D-0214-01 | TCGA-06-0137-01B-02D-0214-01 |
| TCGA-06-0126 | snp__genome_wide_snp_6__broad_mit_edu__Level_1__image_acquisition__data | Analyte Replicate Filter | TCGA-06-0126-10A-01G-0289-01 | TCGA-06-0126-10A-01D-0214-01 |
| TCGA-06-0124 | snp__genome_wide_snp_6__broad_mit_edu__Level_1__image_acquisition__data | Analyte Replicate Filter | TCGA-06-0124-10A-01G-0289-01 | TCGA-06-0124-10A-01D-0214-01 |
| TCGA-06-0130 | snp__genome_wide_snp_6__broad_mit_edu__Level_1__image_acquisition__data | Analyte Replicate Filter | TCGA-06-0130-01A-01G-0289-01 | TCGA-06-0130-01A-01D-0214-01 |
| TCGA-06-0125 | snp__genome_wide_snp_6__broad_mit_edu__Level_1__image_acquisition__data | Analyte Replicate Filter | TCGA-06-0125-10A-01G-0289-01 | TCGA-06-0125-10A-01D-0214-01 |
| TCGA-06-0129 | snp__genome_wide_snp_6__broad_mit_edu__Level_1__image_acquisition__data | Analyte Replicate Filter | TCGA-06-0129-01A-01G-0289-01 | TCGA-06-0129-01A-01D-0214-01 |
| TCGA-06-0128 | snp__genome_wide_snp_6__broad_mit_edu__Level_1__image_acquisition__data | Analyte Replicate Filter | TCGA-06-0128-01A-01G-0289-01 | TCGA-06-0128-01A-01D-0214-01 |
| TCGA-06-0143 | snp__genome_wide_snp_6__broad_mit_edu__Level_1__image_acquisition__data | Analyte Replicate Filter | TCGA-06-0143-01A-01G-0289-01 | TCGA-06-0143-01A-01D-0214-01 |
| TCGA-06-0141 | snp__genome_wide_snp_6__broad_mit_edu__Level_1__image_acquisition__data | Analyte Replicate Filter | TCGA-06-0141-01A-01G-0289-01 | TCGA-06-0141-01A-01D-0214-01 |
| TCGA-06-0125 | snp__genome_wide_snp_6__broad_mit_edu__Level_1__image_acquisition__data | Analyte Replicate Filter | TCGA-06-0125-01A-01G-0289-01 | TCGA-06-0125-01A-01D-0214-01 |
| TCGA-06-0122 | snp__genome_wide_snp_6__broad_mit_edu__Level_1__image_acquisition__data | Analyte Replicate Filter | TCGA-06-0122-01A-01G-0289-01 | TCGA-06-0122-01A-01D-0214-01 |
| TCGA-06-0130 | snp__genome_wide_snp_6__broad_mit_edu__Level_1__image_acquisition__data | Analyte Replicate Filter | TCGA-06-0130-10A-01G-0289-01 | TCGA-06-0130-10A-01D-0214-01 |
| TCGA-06-0124 | snp__genome_wide_snp_6__broad_mit_edu__Level_1__image_acquisition__data | Analyte Replicate Filter | TCGA-06-0124-01A-01G-0289-01 | TCGA-06-0124-01A-01D-0214-01 |
| TCGA-06-0216 | snp__genome_wide_snp_6__broad_mit_edu__Level_1__image_acquisition__data | Analyte Replicate Filter | TCGA-06-0216-10A-01D-0237-01 | TCGA-06-0216-10A-01D-0333-01 |
| TCGA-06-0145 | snp__genome_wide_snp_6__broad_mit_edu__Level_1__image_acquisition__data | Sort Replicate Filter | TCGA-06-0145-01A-02D-0214-01,TCGA-06-0145-01A-03D-0214-01,TCGA-06-0145-01A-04D-0214-01,TCGA-06-0145-01A-05D-0214-01 | TCGA-06-0145-01A-06D-0214-01 |
| TCGA-06-0148 | snp__genome_wide_snp_6__broad_mit_edu__Level_1__image_acquisition__data | Analyte Replicate Filter | TCGA-06-0148-10A-01D-0214-01 | TCGA-06-0148-10A-01D-0237-01 |
| TCGA-06-0129 | snp__genome_wide_snp_6__broad_mit_edu__Level_2__birdseed_genotype__birdseed | Analyte Replicate Filter | TCGA-06-0129-10A-01G-0289-01 | TCGA-06-0129-10A-01D-0214-01 |
| TCGA-06-0141 | snp__genome_wide_snp_6__broad_mit_edu__Level_2__birdseed_genotype__birdseed | Analyte Replicate Filter | TCGA-06-0141-10A-01G-0289-01 | TCGA-06-0141-10A-01D-0214-01 |
| TCGA-06-0143 | snp__genome_wide_snp_6__broad_mit_edu__Level_2__birdseed_genotype__birdseed | Analyte Replicate Filter | TCGA-06-0143-10A-01G-0289-01 | TCGA-06-0143-10A-01D-0214-01 |
| TCGA-06-0147 | snp__genome_wide_snp_6__broad_mit_edu__Level_2__birdseed_genotype__birdseed | Analyte Replicate Filter | TCGA-06-0147-10A-01D-0214-01 | TCGA-06-0147-10A-01D-0237-01 |
| TCGA-06-0128 | snp__genome_wide_snp_6__broad_mit_edu__Level_2__birdseed_genotype__birdseed | Analyte Replicate Filter | TCGA-06-0128-10A-01G-0289-01 | TCGA-06-0128-10A-01D-0214-01 |
| TCGA-06-0166 | snp__genome_wide_snp_6__broad_mit_edu__Level_2__birdseed_genotype__birdseed | Analyte Replicate Filter | TCGA-06-0166-01A-01G-0289-01 | TCGA-06-0166-01A-01D-0236-01 |
| TCGA-06-0122 | snp__genome_wide_snp_6__broad_mit_edu__Level_2__birdseed_genotype__birdseed | Analyte Replicate Filter | TCGA-06-0122-10A-01G-0289-01 | TCGA-06-0122-10A-01D-0214-01 |
| TCGA-06-0126 | snp__genome_wide_snp_6__broad_mit_edu__Level_2__birdseed_genotype__birdseed | Analyte Replicate Filter | TCGA-06-0126-10A-01G-0289-01 | TCGA-06-0126-10A-01D-0214-01 |
| TCGA-06-0124 | snp__genome_wide_snp_6__broad_mit_edu__Level_2__birdseed_genotype__birdseed | Analyte Replicate Filter | TCGA-06-0124-10A-01G-0289-01 | TCGA-06-0124-10A-01D-0214-01 |
| TCGA-06-0130 | snp__genome_wide_snp_6__broad_mit_edu__Level_2__birdseed_genotype__birdseed | Analyte Replicate Filter | TCGA-06-0130-01A-01G-0289-01 | TCGA-06-0130-01A-01D-0214-01 |
| TCGA-06-0125 | snp__genome_wide_snp_6__broad_mit_edu__Level_2__birdseed_genotype__birdseed | Analyte Replicate Filter | TCGA-06-0125-10A-01G-0289-01 | TCGA-06-0125-10A-01D-0214-01 |
| TCGA-06-0129 | snp__genome_wide_snp_6__broad_mit_edu__Level_2__birdseed_genotype__birdseed | Analyte Replicate Filter | TCGA-06-0129-01A-01G-0289-01 | TCGA-06-0129-01A-01D-0214-01 |
| TCGA-06-0126 | snp__genome_wide_snp_6__broad_mit_edu__Level_2__birdseed_genotype__birdseed | Analyte Replicate Filter | TCGA-06-0126-01A-01G-0289-01 | TCGA-06-0126-01A-01D-0214-01 |
| TCGA-06-0143 | snp__genome_wide_snp_6__broad_mit_edu__Level_2__birdseed_genotype__birdseed | Analyte Replicate Filter | TCGA-06-0143-01A-01G-0289-01 | TCGA-06-0143-01A-01D-0214-01 |
| TCGA-06-0141 | snp__genome_wide_snp_6__broad_mit_edu__Level_2__birdseed_genotype__birdseed | Analyte Replicate Filter | TCGA-06-0141-01A-01G-0289-01 | TCGA-06-0141-01A-01D-0214-01 |
| TCGA-06-0125 | snp__genome_wide_snp_6__broad_mit_edu__Level_2__birdseed_genotype__birdseed | Analyte Replicate Filter | TCGA-06-0125-01A-01G-0289-01 | TCGA-06-0125-01A-01D-0214-01 |
| TCGA-06-0122 | snp__genome_wide_snp_6__broad_mit_edu__Level_2__birdseed_genotype__birdseed | Analyte Replicate Filter | TCGA-06-0122-01A-01G-0289-01 | TCGA-06-0122-01A-01D-0214-01 |
| TCGA-06-0130 | snp__genome_wide_snp_6__broad_mit_edu__Level_2__birdseed_genotype__birdseed | Analyte Replicate Filter | TCGA-06-0130-10A-01G-0289-01 | TCGA-06-0130-10A-01D-0214-01 |
| TCGA-06-0124 | snp__genome_wide_snp_6__broad_mit_edu__Level_2__birdseed_genotype__birdseed | Analyte Replicate Filter | TCGA-06-0124-01A-01G-0289-01 | TCGA-06-0124-01A-01D-0214-01 |
| TCGA-06-0128 | snp__genome_wide_snp_6__broad_mit_edu__Level_2__birdseed_genotype__birdseed | Analyte Replicate Filter | TCGA-06-0128-01A-01G-0289-01 | TCGA-06-0128-01A-01D-0214-01 |
| TCGA-06-0216 | snp__genome_wide_snp_6__broad_mit_edu__Level_2__birdseed_genotype__birdseed | Analyte Replicate Filter | TCGA-06-0216-10A-01D-0237-01 | TCGA-06-0216-10A-01D-0333-01 |
| TCGA-06-0156 | rnaseqv2__illuminahiseq_rnaseqv2__unc_edu__Level_3__exon_quantification__data | Sort Replicate Filter | TCGA-06-0156-01A-02R-1849-01 | TCGA-06-0156-01A-03R-1849-01 |
| TCGA-06-0147 | snp__humanhap550__hudsonalpha_org__Level_3__segmented_cnv__seg | Analyte Replicate Filter | TCGA-06-0147-10A-01D-0216-06 | TCGA-06-0147-10A-01D-0241-06 |
| TCGA-06-0148 | snp__humanhap550__hudsonalpha_org__Level_3__segmented_cnv__seg | Analyte Replicate Filter | TCGA-06-0148-10A-01D-0216-06 | TCGA-06-0148-10A-01D-0241-06 |
| TCGA-06-0129 | cna__hg_cgh_244a__hms_harvard_edu__Level_2__lowess_global_normalization__data | Analyte Replicate Filter | TCGA-06-0129-10A-01G-0288-02 | TCGA-06-0129-10A-01D-0217-02 |
| TCGA-06-0141 | cna__hg_cgh_244a__hms_harvard_edu__Level_2__lowess_global_normalization__data | Analyte Replicate Filter | TCGA-06-0141-10A-01G-0288-02 | TCGA-06-0141-10A-01D-0217-02 |
| TCGA-06-0126 | cna__hg_cgh_244a__hms_harvard_edu__Level_2__lowess_global_normalization__data | Analyte Replicate Filter | TCGA-06-0126-01A-01G-0288-02 | TCGA-06-0126-01A-01D-0217-02 |
| TCGA-06-0143 | cna__hg_cgh_244a__hms_harvard_edu__Level_2__lowess_global_normalization__data | Analyte Replicate Filter | TCGA-06-0143-10A-01G-0288-02 | TCGA-06-0143-10A-01D-0217-02 |
| TCGA-06-0128 | cna__hg_cgh_244a__hms_harvard_edu__Level_2__lowess_global_normalization__data | Analyte Replicate Filter | TCGA-06-0128-10A-01G-0288-02 | TCGA-06-0128-10A-01D-0217-02 |
| TCGA-06-0166 | cna__hg_cgh_244a__hms_harvard_edu__Level_2__lowess_global_normalization__data | Analyte Replicate Filter | TCGA-06-0166-01A-01G-0288-02 | TCGA-06-0166-01A-01D-0234-02 |
| TCGA-06-0122 | cna__hg_cgh_244a__hms_harvard_edu__Level_2__lowess_global_normalization__data | Analyte Replicate Filter | TCGA-06-0122-10A-01G-0288-02 | TCGA-06-0122-10A-01D-0217-02 |
| TCGA-06-0137 | cna__hg_cgh_244a__hms_harvard_edu__Level_2__lowess_global_normalization__data | Sort Replicate Filter | TCGA-06-0137-01A-01D-0217-02,TCGA-06-0137-01A-02D-0217-02 | TCGA-06-0137-01B-02D-0217-02 |
| TCGA-06-0126 | cna__hg_cgh_244a__hms_harvard_edu__Level_2__lowess_global_normalization__data | Analyte Replicate Filter | TCGA-06-0126-10A-01G-0288-02 | TCGA-06-0126-10A-01D-0217-02 |
| TCGA-06-0124 | cna__hg_cgh_244a__hms_harvard_edu__Level_2__lowess_global_normalization__data | Analyte Replicate Filter | TCGA-06-0124-10A-01G-0288-02 | TCGA-06-0124-10A-01D-0217-02 |
| TCGA-06-0130 | cna__hg_cgh_244a__hms_harvard_edu__Level_2__lowess_global_normalization__data | Analyte Replicate Filter | TCGA-06-0130-01A-01G-0288-02 | TCGA-06-0130-01A-01D-0217-02 |
| TCGA-06-0125 | cna__hg_cgh_244a__hms_harvard_edu__Level_2__lowess_global_normalization__data | Analyte Replicate Filter | TCGA-06-0125-10A-01G-0288-02 | TCGA-06-0125-10A-01D-0217-02 |
| TCGA-06-0129 | cna__hg_cgh_244a__hms_harvard_edu__Level_2__lowess_global_normalization__data | Analyte Replicate Filter | TCGA-06-0129-01A-01G-0288-02 | TCGA-06-0129-01A-01D-0217-02 |
| TCGA-06-0128 | cna__hg_cgh_244a__hms_harvard_edu__Level_2__lowess_global_normalization__data | Analyte Replicate Filter | TCGA-06-0128-01A-01G-0288-02 | TCGA-06-0128-01A-01D-0217-02 |
| TCGA-06-0166 | cna__hg_cgh_244a__hms_harvard_edu__Level_2__lowess_global_normalization__data | Analyte Replicate Filter | TCGA-06-0166-10A-01G-0288-02 | TCGA-06-0166-10A-01D-0235-02 |
| TCGA-06-0211 | cna__hg_cgh_244a__hms_harvard_edu__Level_2__lowess_global_normalization__data | Sort Replicate Filter | TCGA-06-0211-01A-01D-0234-02 | TCGA-06-0211-01B-01D-0234-02 |
| TCGA-06-0143 | cna__hg_cgh_244a__hms_harvard_edu__Level_2__lowess_global_normalization__data | Analyte Replicate Filter | TCGA-06-0143-01A-01G-0288-02 | TCGA-06-0143-01A-01D-0271-02 |
| TCGA-06-0208 | cna__hg_cgh_244a__hms_harvard_edu__Level_2__lowess_global_normalization__data | Sort Replicate Filter | TCGA-06-0208-01A-01D-0234-02 | TCGA-06-0208-01B-01D-0234-02 |
| TCGA-06-0141 | cna__hg_cgh_244a__hms_harvard_edu__Level_2__lowess_global_normalization__data | Analyte Replicate Filter | TCGA-06-0141-01A-01G-0288-02 | TCGA-06-0141-01A-01D-0217-02 |
| TCGA-06-0176 | cna__hg_cgh_244a__hms_harvard_edu__Level_2__lowess_global_normalization__data | Sort Replicate Filter | TCGA-06-0176-01A-02D-0234-02 | TCGA-06-0176-01A-03D-0234-02 |
| TCGA-06-0168 | cna__hg_cgh_244a__hms_harvard_edu__Level_2__lowess_global_normalization__data | Sort Replicate Filter | TCGA-06-0168-01A-01D-0234-02 | TCGA-06-0168-01A-02D-0234-02 |
| TCGA-06-0125 | cna__hg_cgh_244a__hms_harvard_edu__Level_2__lowess_global_normalization__data | Analyte Replicate Filter | TCGA-06-0125-01A-01G-0288-02 | TCGA-06-0125-01A-01D-0217-02 |
| TCGA-06-0122 | cna__hg_cgh_244a__hms_harvard_edu__Level_2__lowess_global_normalization__data | Analyte Replicate Filter | TCGA-06-0122-01A-01G-0288-02 | TCGA-06-0122-01A-01D-0217-02 |
| TCGA-06-0148 | cna__hg_cgh_244a__hms_harvard_edu__Level_2__lowess_global_normalization__data | Sort Replicate Filter | TCGA-06-0148-01A-01D-0217-02,TCGA-06-0148-01A-03D-0234-02,TCGA-06-0148-01A-04D-0234-02 | TCGA-06-0148-01A-05D-0234-02 |
| TCGA-06-0216 | cna__hg_cgh_244a__hms_harvard_edu__Level_2__lowess_global_normalization__data | Analyte Replicate Filter | TCGA-06-0216-01A-01D-0234-02 | TCGA-06-0216-01B-01D-0336-02 |
| TCGA-06-0156 | cna__hg_cgh_244a__hms_harvard_edu__Level_2__lowess_global_normalization__data | Sort Replicate Filter | TCGA-06-0156-01A-01D-0234-02,TCGA-06-0156-01A-02D-0234-02 | TCGA-06-0156-01A-03D-0234-02 |
| TCGA-06-0138 | cna__hg_cgh_244a__hms_harvard_edu__Level_2__lowess_global_normalization__data | Sort Replicate Filter | TCGA-06-0138-01A-01D-0234-02 | TCGA-06-0138-01A-02D-0234-02 |
| TCGA-06-0147 | cna__hg_cgh_244a__hms_harvard_edu__Level_2__lowess_global_normalization__data | Analyte Replicate Filter | TCGA-06-0147-01A-01D-0217-02 | TCGA-06-0147-01A-02D-0234-02 |
| TCGA-06-0210 | cna__hg_cgh_244a__hms_harvard_edu__Level_2__lowess_global_normalization__data | Analyte Replicate Filter | TCGA-06-0210-01B-01D-0234-02 | TCGA-06-0210-01A-01D-0271-02 |
| TCGA-06-0130 | cna__hg_cgh_244a__hms_harvard_edu__Level_2__lowess_global_normalization__data | Analyte Replicate Filter | TCGA-06-0130-10A-01G-0288-02 | TCGA-06-0130-10A-01D-0217-02 |
| TCGA-06-0124 | cna__hg_cgh_244a__hms_harvard_edu__Level_2__lowess_global_normalization__data | Analyte Replicate Filter | TCGA-06-0124-01A-01G-0288-02 | TCGA-06-0124-01A-01D-0217-02 |
| TCGA-06-0145 | cna__hg_cgh_244a__hms_harvard_edu__Level_2__lowess_global_normalization__data | Sort Replicate Filter | TCGA-06-0145-01A-02D-0217-02,TCGA-06-0145-01A-03D-0217-02,TCGA-06-0145-01A-04D-0217-02,TCGA-06-0145-01A-05D-0217-02 | TCGA-06-0145-01A-06D-0217-02 |
| TCGA-06-0154 | cna__hg_cgh_244a__hms_harvard_edu__Level_2__lowess_global_normalization__data | Sort Replicate Filter | TCGA-06-0154-01A-02D-0234-02 | TCGA-06-0154-01A-03D-0234-02 |
| TCGA-06-0137 | exon__huex_1_0_st_v2__lbl_gov__Level_2__quantile_normalization_exon__data | Sort Replicate Filter | TCGA-06-0137-01A-01R-0212-03,TCGA-06-0137-01A-02R-0212-03 | TCGA-06-0137-01B-02R-0212-03 |
| TCGA-06-0148 | exon__huex_1_0_st_v2__lbl_gov__Level_2__quantile_normalization_exon__data | Sort Replicate Filter | TCGA-06-0148-01A-03R-0232-03,TCGA-06-0148-01A-04R-0232-03 | TCGA-06-0148-01A-05R-0232-03 |
| TCGA-06-0156 | exon__huex_1_0_st_v2__lbl_gov__Level_2__quantile_normalization_exon__data | Sort Replicate Filter | TCGA-06-0156-01A-02R-0232-03 | TCGA-06-0156-01A-03R-0232-03 |
| TCGA-06-0145 | exon__huex_1_0_st_v2__lbl_gov__Level_2__quantile_normalization_exon__data | Sort Replicate Filter | TCGA-06-0145-01A-02R-0212-03,TCGA-06-0145-01A-05R-0212-03,TCGA-06-0145-01A-04R-0212-03,TCGA-06-0145-01A-03R-0212-03 | TCGA-06-0145-01A-06R-0212-03 |
| TCGA-06-0129 | snp__genome_wide_snp_6__broad_mit_edu__Level_3__segmented_scna_minus_germline_cnv_hg18__seg | Analyte Replicate Filter | TCGA-06-0129-10A-01G-0289-01 | TCGA-06-0129-10A-01D-0214-01 |
| TCGA-06-0141 | snp__genome_wide_snp_6__broad_mit_edu__Level_3__segmented_scna_minus_germline_cnv_hg18__seg | Analyte Replicate Filter | TCGA-06-0141-10A-01G-0289-01 | TCGA-06-0141-10A-01D-0214-01 |
| TCGA-06-0143 | snp__genome_wide_snp_6__broad_mit_edu__Level_3__segmented_scna_minus_germline_cnv_hg18__seg | Analyte Replicate Filter | TCGA-06-0143-10A-01G-0289-01 | TCGA-06-0143-10A-01D-0214-01 |
| TCGA-06-0147 | snp__genome_wide_snp_6__broad_mit_edu__Level_3__segmented_scna_minus_germline_cnv_hg18__seg | Analyte Replicate Filter | TCGA-06-0147-10A-01D-0214-01 | TCGA-06-0147-10A-01D-0237-01 |
| TCGA-06-0128 | snp__genome_wide_snp_6__broad_mit_edu__Level_3__segmented_scna_minus_germline_cnv_hg18__seg | Analyte Replicate Filter | TCGA-06-0128-10A-01G-0289-01 | TCGA-06-0128-10A-01D-0214-01 |
| TCGA-06-0166 | snp__genome_wide_snp_6__broad_mit_edu__Level_3__segmented_scna_minus_germline_cnv_hg18__seg | Analyte Replicate Filter | TCGA-06-0166-01A-01G-0289-01 | TCGA-06-0166-01A-01D-0236-01 |
| TCGA-06-0126 | snp__genome_wide_snp_6__broad_mit_edu__Level_3__segmented_scna_minus_germline_cnv_hg18__seg | Analyte Replicate Filter | TCGA-06-0126-10A-01G-0289-01 | TCGA-06-0126-10A-01D-0214-01 |
| TCGA-06-0124 | snp__genome_wide_snp_6__broad_mit_edu__Level_3__segmented_scna_minus_germline_cnv_hg18__seg | Analyte Replicate Filter | TCGA-06-0124-10A-01G-0289-01 | TCGA-06-0124-10A-01D-0214-01 |
| TCGA-06-0130 | snp__genome_wide_snp_6__broad_mit_edu__Level_3__segmented_scna_minus_germline_cnv_hg18__seg | Analyte Replicate Filter | TCGA-06-0130-01A-01G-0289-01 | TCGA-06-0130-01A-01D-0214-01 |
| TCGA-06-0125 | snp__genome_wide_snp_6__broad_mit_edu__Level_3__segmented_scna_minus_germline_cnv_hg18__seg | Analyte Replicate Filter | TCGA-06-0125-10A-01G-0289-01 | TCGA-06-0125-10A-01D-0214-01 |
| TCGA-06-0126 | snp__genome_wide_snp_6__broad_mit_edu__Level_3__segmented_scna_minus_germline_cnv_hg18__seg | Analyte Replicate Filter | TCGA-06-0126-01A-01G-0289-01 | TCGA-06-0126-01A-01D-0214-01 |
| TCGA-06-0143 | snp__genome_wide_snp_6__broad_mit_edu__Level_3__segmented_scna_minus_germline_cnv_hg18__seg | Analyte Replicate Filter | TCGA-06-0143-01A-01G-0289-01 | TCGA-06-0143-01A-01D-0214-01 |
| TCGA-06-0141 | snp__genome_wide_snp_6__broad_mit_edu__Level_3__segmented_scna_minus_germline_cnv_hg18__seg | Analyte Replicate Filter | TCGA-06-0141-01A-01G-0289-01 | TCGA-06-0141-01A-01D-0214-01 |
| TCGA-06-0125 | snp__genome_wide_snp_6__broad_mit_edu__Level_3__segmented_scna_minus_germline_cnv_hg18__seg | Analyte Replicate Filter | TCGA-06-0125-01A-01G-0289-01 | TCGA-06-0125-01A-01D-0214-01 |
| TCGA-06-0122 | snp__genome_wide_snp_6__broad_mit_edu__Level_3__segmented_scna_minus_germline_cnv_hg18__seg | Analyte Replicate Filter | TCGA-06-0122-01A-01G-0289-01 | TCGA-06-0122-01A-01D-0214-01 |
| TCGA-06-0130 | snp__genome_wide_snp_6__broad_mit_edu__Level_3__segmented_scna_minus_germline_cnv_hg18__seg | Analyte Replicate Filter | TCGA-06-0130-10A-01G-0289-01 | TCGA-06-0130-10A-01D-0214-01 |
| TCGA-06-0124 | snp__genome_wide_snp_6__broad_mit_edu__Level_3__segmented_scna_minus_germline_cnv_hg18__seg | Analyte Replicate Filter | TCGA-06-0124-01A-01G-0289-01 | TCGA-06-0124-01A-01D-0214-01 |
| TCGA-06-0128 | snp__genome_wide_snp_6__broad_mit_edu__Level_3__segmented_scna_minus_germline_cnv_hg18__seg | Analyte Replicate Filter | TCGA-06-0128-01A-01G-0289-01 | TCGA-06-0128-01A-01D-0214-01 |
| TCGA-06-0216 | snp__genome_wide_snp_6__broad_mit_edu__Level_3__segmented_scna_minus_germline_cnv_hg18__seg | Analyte Replicate Filter | TCGA-06-0216-10A-01D-0237-01 | TCGA-06-0216-10A-01D-0333-01 |
| TCGA-06-0137 | methylation__humanmethylation27__jhu_usc_edu__Level_3__within_bioassay_data_set_function__data | Sort Replicate Filter | TCGA-06-0137-01A-02D-0218-05,TCGA-06-0137-01A-01D-0218-05 | TCGA-06-0137-01B-02D-0218-05 |
| TCGA-06-0145 | methylation__humanmethylation27__jhu_usc_edu__Level_3__within_bioassay_data_set_function__data | Sort Replicate Filter | TCGA-06-0145-01A-05D-0218-05,TCGA-06-0145-01A-04D-0218-05,TCGA-06-0145-01A-02D-0218-05,TCGA-06-0145-01A-03D-0218-05 | TCGA-06-0145-01A-06D-0218-05 |
| TCGA-06-0156 | rnaseqv2__illuminahiseq_rnaseqv2__unc_edu__Level_3__RSEM_genes__data | Sort Replicate Filter | TCGA-06-0156-01A-02R-1849-01 | TCGA-06-0156-01A-03R-1849-01 |
| TCGA-06-0148 | transcriptome__agilentg4502a_07_1__unc_edu__Level_3__unc_lowess_normalization_gene_level__data | Sort Replicate Filter | TCGA-06-0148-01A-04R-0229-07,TCGA-06-0148-01A-03R-0229-07 | TCGA-06-0148-01A-05R-0229-07 |
| TCGA-06-0156 | transcriptome__agilentg4502a_07_1__unc_edu__Level_3__unc_lowess_normalization_gene_level__data | Sort Replicate Filter | TCGA-06-0156-01A-02R-0229-07 | TCGA-06-0156-01A-03R-0229-07 |
| TCGA-06-0137 | transcriptome__agilentg4502a_07_1__unc_edu__Level_3__unc_lowess_normalization_gene_level__data | Sort Replicate Filter | TCGA-06-0137-01A-02R-0213-07,TCGA-06-0137-01A-01R-0213-07 | TCGA-06-0137-01B-02R-0213-07 |
| TCGA-06-0145 | transcriptome__agilentg4502a_07_1__unc_edu__Level_3__unc_lowess_normalization_gene_level__data | Sort Replicate Filter | TCGA-06-0145-01A-02R-0213-07,TCGA-06-0145-01A-03R-0213-07,TCGA-06-0145-01A-05R-0213-07,TCGA-06-0145-01A-04R-0213-07 | TCGA-06-0145-01A-06R-0213-07 |
| TCGA-06-0129 | snp__genome_wide_snp_6__broad_mit_edu__Level_2__raw_copynumber__data | Analyte Replicate Filter | TCGA-06-0129-10A-01G-0289-01 | TCGA-06-0129-10A-01D-0214-01 |
| TCGA-06-0141 | snp__genome_wide_snp_6__broad_mit_edu__Level_2__raw_copynumber__data | Analyte Replicate Filter | TCGA-06-0141-10A-01G-0289-01 | TCGA-06-0141-10A-01D-0214-01 |
| TCGA-06-0143 | snp__genome_wide_snp_6__broad_mit_edu__Level_2__raw_copynumber__data | Analyte Replicate Filter | TCGA-06-0143-10A-01G-0289-01 | TCGA-06-0143-10A-01D-0214-01 |
| TCGA-06-0147 | snp__genome_wide_snp_6__broad_mit_edu__Level_2__raw_copynumber__data | Analyte Replicate Filter | TCGA-06-0147-10A-01D-0214-01 | TCGA-06-0147-10A-01D-0237-01 |
| TCGA-06-0128 | snp__genome_wide_snp_6__broad_mit_edu__Level_2__raw_copynumber__data | Analyte Replicate Filter | TCGA-06-0128-10A-01G-0289-01 | TCGA-06-0128-10A-01D-0214-01 |
| TCGA-06-0166 | snp__genome_wide_snp_6__broad_mit_edu__Level_2__raw_copynumber__data | Analyte Replicate Filter | TCGA-06-0166-01A-01G-0289-01 | TCGA-06-0166-01A-01D-0236-01 |
| TCGA-06-0122 | snp__genome_wide_snp_6__broad_mit_edu__Level_2__raw_copynumber__data | Analyte Replicate Filter | TCGA-06-0122-10A-01G-0289-01 | TCGA-06-0122-10A-01D-0214-01 |
| TCGA-06-0126 | snp__genome_wide_snp_6__broad_mit_edu__Level_2__raw_copynumber__data | Analyte Replicate Filter | TCGA-06-0126-10A-01G-0289-01 | TCGA-06-0126-10A-01D-0214-01 |
| TCGA-06-0124 | snp__genome_wide_snp_6__broad_mit_edu__Level_2__raw_copynumber__data | Analyte Replicate Filter | TCGA-06-0124-10A-01G-0289-01 | TCGA-06-0124-10A-01D-0214-01 |
| TCGA-06-0130 | snp__genome_wide_snp_6__broad_mit_edu__Level_2__raw_copynumber__data | Analyte Replicate Filter | TCGA-06-0130-01A-01G-0289-01 | TCGA-06-0130-01A-01D-0214-01 |
| TCGA-06-0125 | snp__genome_wide_snp_6__broad_mit_edu__Level_2__raw_copynumber__data | Analyte Replicate Filter | TCGA-06-0125-10A-01G-0289-01 | TCGA-06-0125-10A-01D-0214-01 |
| TCGA-06-0129 | snp__genome_wide_snp_6__broad_mit_edu__Level_2__raw_copynumber__data | Analyte Replicate Filter | TCGA-06-0129-01A-01G-0289-01 | TCGA-06-0129-01A-01D-0214-01 |
| TCGA-06-0126 | snp__genome_wide_snp_6__broad_mit_edu__Level_2__raw_copynumber__data | Analyte Replicate Filter | TCGA-06-0126-01A-01G-0289-01 | TCGA-06-0126-01A-01D-0214-01 |
| TCGA-06-0143 | snp__genome_wide_snp_6__broad_mit_edu__Level_2__raw_copynumber__data | Analyte Replicate Filter | TCGA-06-0143-01A-01G-0289-01 | TCGA-06-0143-01A-01D-0214-01 |
| TCGA-06-0141 | snp__genome_wide_snp_6__broad_mit_edu__Level_2__raw_copynumber__data | Analyte Replicate Filter | TCGA-06-0141-01A-01G-0289-01 | TCGA-06-0141-01A-01D-0214-01 |
| TCGA-06-0125 | snp__genome_wide_snp_6__broad_mit_edu__Level_2__raw_copynumber__data | Analyte Replicate Filter | TCGA-06-0125-01A-01G-0289-01 | TCGA-06-0125-01A-01D-0214-01 |
| TCGA-06-0122 | snp__genome_wide_snp_6__broad_mit_edu__Level_2__raw_copynumber__data | Analyte Replicate Filter | TCGA-06-0122-01A-01G-0289-01 | TCGA-06-0122-01A-01D-0214-01 |
| TCGA-06-0130 | snp__genome_wide_snp_6__broad_mit_edu__Level_2__raw_copynumber__data | Analyte Replicate Filter | TCGA-06-0130-10A-01G-0289-01 | TCGA-06-0130-10A-01D-0214-01 |
| TCGA-06-0124 | snp__genome_wide_snp_6__broad_mit_edu__Level_2__raw_copynumber__data | Analyte Replicate Filter | TCGA-06-0124-01A-01G-0289-01 | TCGA-06-0124-01A-01D-0214-01 |
| TCGA-06-0128 | snp__genome_wide_snp_6__broad_mit_edu__Level_2__raw_copynumber__data | Analyte Replicate Filter | TCGA-06-0128-01A-01G-0289-01 | TCGA-06-0128-01A-01D-0214-01 |
| TCGA-06-0216 | snp__genome_wide_snp_6__broad_mit_edu__Level_2__raw_copynumber__data | Analyte Replicate Filter | TCGA-06-0216-10A-01D-0237-01 | TCGA-06-0216-10A-01D-0333-01 |
Table S6.
| Participant Id | DataType__Platform__Center__DataLevel__ProtocolName_Extension | Filter Reason | Removed Sample(s) | Chosen Sample |
|---|---|---|---|---|
| TCGA-CV-6955 | snp__genome_wide_snp_6__broad_mit_edu__Level_2__tangent_copynumber__data | Analyte Replicate Filter | TCGA-CV-6955-01A-11D-2010-01 | TCGA-CV-6955-01A-11D-2062-01 |
| TCGA-CV-6956 | snp__genome_wide_snp_6__broad_mit_edu__Level_2__tangent_copynumber__data | Analyte Replicate Filter | TCGA-CV-6956-01A-21D-2010-01 | TCGA-CV-6956-01A-21D-2062-01 |
| TCGA-CV-6955 | snp__genome_wide_snp_6__broad_mit_edu__Level_2__byallele_copynumber__data | Analyte Replicate Filter | TCGA-CV-6955-01A-11D-2010-01 | TCGA-CV-6955-01A-11D-2062-01 |
| TCGA-CV-6956 | snp__genome_wide_snp_6__broad_mit_edu__Level_2__byallele_copynumber__data | Analyte Replicate Filter | TCGA-CV-6956-01A-21D-2010-01 | TCGA-CV-6956-01A-21D-2062-01 |
| TCGA-CV-6955 | snp__genome_wide_snp_6__broad_mit_edu__Level_2__invariantset_medianpolish__data | Analyte Replicate Filter | TCGA-CV-6955-01A-11D-2010-01 | TCGA-CV-6955-01A-11D-2062-01 |
| TCGA-CV-6956 | snp__genome_wide_snp_6__broad_mit_edu__Level_2__invariantset_medianpolish__data | Analyte Replicate Filter | TCGA-CV-6956-01A-21D-2010-01 | TCGA-CV-6956-01A-21D-2062-01 |
| TCGA-CV-6955 | snp__genome_wide_snp_6__broad_mit_edu__Level_2__birdseed_genotype__birdseed | Analyte Replicate Filter | TCGA-CV-6955-01A-11D-2010-01 | TCGA-CV-6955-01A-11D-2062-01 |
| TCGA-CV-6956 | snp__genome_wide_snp_6__broad_mit_edu__Level_2__birdseed_genotype__birdseed | Analyte Replicate Filter | TCGA-CV-6956-01A-21D-2010-01 | TCGA-CV-6956-01A-21D-2062-01 |
| TCGA-CV-6955 | snp__genome_wide_snp_6__broad_mit_edu__Level_3__segmented_scna_minus_germline_cnv_hg18__seg | Analyte Replicate Filter | TCGA-CV-6955-01A-11D-2010-01 | TCGA-CV-6955-01A-11D-2062-01 |
| TCGA-CV-6956 | snp__genome_wide_snp_6__broad_mit_edu__Level_3__segmented_scna_minus_germline_cnv_hg18__seg | Analyte Replicate Filter | TCGA-CV-6956-01A-21D-2010-01 | TCGA-CV-6956-01A-21D-2062-01 |
| TCGA-CV-6955 | snp__genome_wide_snp_6__broad_mit_edu__Level_3__segmented_scna_hg19__seg | Analyte Replicate Filter | TCGA-CV-6955-01A-11D-2010-01 | TCGA-CV-6955-01A-11D-2062-01 |
| TCGA-CV-6956 | snp__genome_wide_snp_6__broad_mit_edu__Level_3__segmented_scna_hg19__seg | Analyte Replicate Filter | TCGA-CV-6956-01A-21D-2010-01 | TCGA-CV-6956-01A-21D-2062-01 |
| TCGA-CV-6955 | snp__genome_wide_snp_6__broad_mit_edu__Level_3__segmented_scna_minus_germline_cnv_hg19__seg | Analyte Replicate Filter | TCGA-CV-6955-01A-11D-2010-01 | TCGA-CV-6955-01A-11D-2062-01 |
| TCGA-CV-6956 | snp__genome_wide_snp_6__broad_mit_edu__Level_3__segmented_scna_minus_germline_cnv_hg19__seg | Analyte Replicate Filter | TCGA-CV-6956-01A-21D-2010-01 | TCGA-CV-6956-01A-21D-2062-01 |
| TCGA-CV-6955 | snp__genome_wide_snp_6__broad_mit_edu__Level_3__segmented_scna_hg18__seg | Analyte Replicate Filter | TCGA-CV-6955-01A-11D-2010-01 | TCGA-CV-6955-01A-11D-2062-01 |
| TCGA-CV-6956 | snp__genome_wide_snp_6__broad_mit_edu__Level_3__segmented_scna_hg18__seg | Analyte Replicate Filter | TCGA-CV-6956-01A-21D-2010-01 | TCGA-CV-6956-01A-21D-2062-01 |
| TCGA-CV-6955 | snp__genome_wide_snp_6__broad_mit_edu__Level_2__raw_copynumber__data | Analyte Replicate Filter | TCGA-CV-6955-01A-11D-2010-01 | TCGA-CV-6955-01A-11D-2062-01 |
| TCGA-CV-6956 | snp__genome_wide_snp_6__broad_mit_edu__Level_2__raw_copynumber__data | Analyte Replicate Filter | TCGA-CV-6956-01A-21D-2010-01 | TCGA-CV-6956-01A-21D-2062-01 |
Table S7.
| Participant Id | DataType__Platform__Center__DataLevel__ProtocolName_Extension | Filter Reason | Removed Sample(s) | Chosen Sample |
|---|---|---|---|---|
| TCGA-CJ-4639 | snp__genome_wide_snp_6__broad_mit_edu__Level_2__copy_number__data | Analyte Replicate Filter | TCGA-CJ-4639-01A-01D-1185-01 | TCGA-CJ-4639-01A-02D-1322-01 |
| TCGA-A3-3324 | snp__genome_wide_snp_6__broad_mit_edu__Level_2__copy_number__data | Analyte Replicate Filter | TCGA-A3-3324-01A-01D-0858-01 | TCGA-A3-3324-01A-02D-1322-01 |
| TCGA-A3-3331 | snp__genome_wide_snp_6__broad_mit_edu__Level_2__copy_number__data | Analyte Replicate Filter | TCGA-A3-3331-01A-01D-0858-01 | TCGA-A3-3331-01A-02D-1322-01 |
| TCGA-CJ-4637 | snp__genome_wide_snp_6__broad_mit_edu__Level_2__copy_number__data | Analyte Replicate Filter | TCGA-CJ-4637-01A-01D-1185-01 | TCGA-CJ-4637-01A-02D-1322-01 |
| TCGA-BP-4161 | snp__genome_wide_snp_6__broad_mit_edu__Level_2__copy_number__data | Analyte Replicate Filter | TCGA-BP-4161-01A-01D-1185-01 | TCGA-BP-4161-01A-02D-1322-01 |
| TCGA-B8-4148 | snp__genome_wide_snp_6__broad_mit_edu__Level_2__copy_number__data | Analyte Replicate Filter | TCGA-B8-4148-01A-01D-1185-01 | TCGA-B8-4148-01A-02D-1322-01 |
| TCGA-A3-3362 | snp__genome_wide_snp_6__broad_mit_edu__Level_2__copy_number__data | Analyte Replicate Filter | TCGA-A3-3362-01A-01D-1185-01 | TCGA-A3-3362-01A-02D-1322-01 |
| TCGA-BP-4163 | snp__genome_wide_snp_6__broad_mit_edu__Level_2__copy_number__data | Analyte Replicate Filter | TCGA-BP-4163-01A-01D-1185-01 | TCGA-BP-4163-01A-02D-1322-01 |
| TCGA-A3-3317 | snp__genome_wide_snp_6__broad_mit_edu__Level_2__copy_number__data | Analyte Replicate Filter | TCGA-A3-3317-01A-01D-0858-01 | TCGA-A3-3317-01A-02D-1322-01 |
| TCGA-AK-3436 | snp__genome_wide_snp_6__broad_mit_edu__Level_2__copy_number__data | Analyte Replicate Filter | TCGA-AK-3436-01A-01D-1185-01 | TCGA-AK-3436-01A-02D-1322-01 |
| TCGA-BP-4162 | snp__genome_wide_snp_6__broad_mit_edu__Level_2__copy_number__data | Analyte Replicate Filter | TCGA-BP-4162-01A-01D-1185-01 | TCGA-BP-4162-01A-02D-1322-01 |
| TCGA-BP-4164 | snp__genome_wide_snp_6__broad_mit_edu__Level_2__copy_number__data | Analyte Replicate Filter | TCGA-BP-4164-01A-01D-1185-01 | TCGA-BP-4164-01A-02D-1322-01 |
| TCGA-B2-3923 | snp__genome_wide_snp_6__broad_mit_edu__Level_2__copy_number__data | Analyte Replicate Filter | TCGA-B2-3923-01A-01D-1185-01 | TCGA-B2-3923-01A-02D-1322-01 |
| TCGA-BP-4167 | snp__genome_wide_snp_6__broad_mit_edu__Level_2__copy_number__data | Analyte Replicate Filter | TCGA-BP-4167-01A-01D-1185-01 | TCGA-BP-4167-01A-02D-1322-01 |
| TCGA-A3-3347 | snp__genome_wide_snp_6__broad_mit_edu__Level_2__copy_number__data | Analyte Replicate Filter | TCGA-A3-3347-01A-01D-1185-01 | TCGA-A3-3347-01A-02D-1322-01 |
| TCGA-AK-3440 | snp__genome_wide_snp_6__broad_mit_edu__Level_2__copy_number__data | Analyte Replicate Filter | TCGA-AK-3440-01A-01D-0858-01 | TCGA-AK-3440-01A-02D-1274-01 |
| TCGA-CJ-4644 | snp__genome_wide_snp_6__broad_mit_edu__Level_2__copy_number__data | Analyte Replicate Filter | TCGA-CJ-4644-01A-01D-1185-01 | TCGA-CJ-4644-01A-02D-1322-01 |
| TCGA-AK-3465 | snp__genome_wide_snp_6__broad_mit_edu__Level_2__copy_number__data | Analyte Replicate Filter | TCGA-AK-3465-01A-01D-0858-01 | TCGA-AK-3465-01A-02D-1322-01 |
| TCGA-A3-3319 | snp__genome_wide_snp_6__broad_mit_edu__Level_2__copy_number__data | Analyte Replicate Filter | TCGA-A3-3319-01A-01D-0858-01 | TCGA-A3-3319-01A-02D-1322-01 |
| TCGA-CJ-4643 | snp__genome_wide_snp_6__broad_mit_edu__Level_2__copy_number__data | Analyte Replicate Filter | TCGA-CJ-4643-01A-01D-1185-01 | TCGA-CJ-4643-01A-02D-1322-01 |
| TCGA-B8-4619 | snp__genome_wide_snp_6__broad_mit_edu__Level_2__copy_number__data | Analyte Replicate Filter | TCGA-B8-4619-01A-01D-1185-01,TCGA-B8-4619-01A-02D-1322-01 | TCGA-B8-4619-01A-02D-1549-01 |
| TCGA-A3-3383 | snp__genome_wide_snp_6__broad_mit_edu__Level_2__copy_number__data | Analyte Replicate Filter | TCGA-A3-3383-01A-01D-0858-01 | TCGA-A3-3383-01A-02D-1322-01 |
| TCGA-AK-3456 | snp__genome_wide_snp_6__broad_mit_edu__Level_2__copy_number__data | Analyte Replicate Filter | TCGA-AK-3456-01A-01D-1185-01 | TCGA-AK-3456-01A-02D-1322-01 |
| TCGA-A3-3311 | snp__genome_wide_snp_6__broad_mit_edu__Level_2__copy_number__data | Analyte Replicate Filter | TCGA-A3-3311-01A-01D-0858-01 | TCGA-A3-3311-01A-02D-1322-01 |
| TCGA-A3-3351 | snp__genome_wide_snp_6__broad_mit_edu__Level_2__copy_number__data | Analyte Replicate Filter | TCGA-A3-3351-01A-01D-1185-01 | TCGA-A3-3351-01A-02D-1322-01 |
| TCGA-A3-3320 | snp__genome_wide_snp_6__broad_mit_edu__Level_2__copy_number__data | Analyte Replicate Filter | TCGA-A3-3320-01A-01D-0858-01 | TCGA-A3-3320-01A-02D-1322-01 |
| TCGA-CJ-4640 | snp__genome_wide_snp_6__broad_mit_edu__Level_2__copy_number__data | Analyte Replicate Filter | TCGA-CJ-4640-01A-01D-1185-01 | TCGA-CJ-4640-01A-02D-1322-01 |
| TCGA-A3-3313 | snp__genome_wide_snp_6__broad_mit_edu__Level_2__copy_number__data | Analyte Replicate Filter | TCGA-A3-3313-01A-01D-0858-01 | TCGA-A3-3313-01A-02D-1322-01 |
| TCGA-AK-3453 | snp__genome_wide_snp_6__broad_mit_edu__Level_2__copy_number__data | Analyte Replicate Filter | TCGA-AK-3453-01A-01D-0858-01 | TCGA-AK-3453-01A-02D-1274-01 |
| TCGA-CJ-4638 | snp__genome_wide_snp_6__broad_mit_edu__Level_2__copy_number__data | Analyte Replicate Filter | TCGA-CJ-4638-01A-01D-1185-01 | TCGA-CJ-4638-01A-02D-1322-01 |
| TCGA-CJ-4641 | snp__genome_wide_snp_6__broad_mit_edu__Level_2__copy_number__data | Analyte Replicate Filter | TCGA-CJ-4641-01A-01D-1185-01 | TCGA-CJ-4641-01A-02D-1322-01 |
| TCGA-B2-4102 | snp__genome_wide_snp_6__broad_mit_edu__Level_2__copy_number__data | Analyte Replicate Filter | TCGA-B2-4102-01A-01D-1185-01 | TCGA-B2-4102-01A-02D-1322-01 |
| TCGA-CJ-4636 | snp__genome_wide_snp_6__broad_mit_edu__Level_2__copy_number__data | Analyte Replicate Filter | TCGA-CJ-4636-01A-01D-1185-01 | TCGA-CJ-4636-01A-02D-1322-01 |
| TCGA-A3-3308 | snp__genome_wide_snp_6__broad_mit_edu__Level_2__copy_number__data | Analyte Replicate Filter | TCGA-A3-3308-01A-01D-0858-01 | TCGA-A3-3308-01A-02D-1322-01 |
| TCGA-A3-3372 | snp__genome_wide_snp_6__broad_mit_edu__Level_2__copy_number__data | Analyte Replicate Filter | TCGA-A3-3372-01A-01D-0858-01 | TCGA-A3-3372-01A-02D-1322-01 |
| TCGA-AK-3429 | snp__genome_wide_snp_6__broad_mit_edu__Level_2__copy_number__data | Analyte Replicate Filter | TCGA-AK-3429-01A-01D-1185-01 | TCGA-AK-3429-01A-02D-1322-01 |
| TCGA-AK-3444 | snp__genome_wide_snp_6__broad_mit_edu__Level_2__copy_number__data | Analyte Replicate Filter | TCGA-AK-3444-01A-01D-0858-01 | TCGA-AK-3444-01A-02D-1322-01 |
| TCGA-B2-4098 | snp__genome_wide_snp_6__broad_mit_edu__Level_2__copy_number__data | Analyte Replicate Filter | TCGA-B2-4098-01A-01D-1185-01 | TCGA-B2-4098-01A-02D-1322-01 |
| TCGA-CJ-4634 | snp__genome_wide_snp_6__broad_mit_edu__Level_2__copy_number__data | Analyte Replicate Filter | TCGA-CJ-4634-01A-01D-1185-01 | TCGA-CJ-4634-01A-02D-1322-01 |
| TCGA-AK-3443 | snp__genome_wide_snp_6__broad_mit_edu__Level_2__copy_number__data | Analyte Replicate Filter | TCGA-AK-3443-01A-01D-0858-01 | TCGA-AK-3443-01A-02D-1322-01 |
| TCGA-A3-3323 | snp__genome_wide_snp_6__broad_mit_edu__Level_2__copy_number__data | Analyte Replicate Filter | TCGA-A3-3323-01A-01D-0858-01 | TCGA-A3-3323-01A-02D-1322-01 |
| TCGA-B8-4622 | snp__genome_wide_snp_6__broad_mit_edu__Level_2__copy_number__data | Analyte Replicate Filter | TCGA-B8-4622-01A-02D-1274-01 | TCGA-B8-4622-01A-02D-1549-01 |
| TCGA-A3-3374 | snp__genome_wide_snp_6__broad_mit_edu__Level_2__copy_number__data | Analyte Replicate Filter | TCGA-A3-3374-01A-01D-0858-01 | TCGA-A3-3374-01A-02D-1322-01 |
| TCGA-A3-3382 | snp__genome_wide_snp_6__broad_mit_edu__Level_2__copy_number__data | Analyte Replicate Filter | TCGA-A3-3382-01A-01D-0858-01 | TCGA-A3-3382-01A-02D-1322-01 |
| TCGA-A3-3378 | snp__genome_wide_snp_6__broad_mit_edu__Level_2__copy_number__data | Analyte Replicate Filter | TCGA-A3-3378-01A-01D-0858-01 | TCGA-A3-3378-01A-02D-1322-01 |
| TCGA-AK-3453 | snp__genome_wide_snp_6__broad_mit_edu__Level_2__copy_number__data | Analyte Replicate Filter | TCGA-AK-3453-10A-01D-0858-01 | TCGA-AK-3453-10A-01D-1274-01 |
| TCGA-AK-3426 | snp__genome_wide_snp_6__broad_mit_edu__Level_2__copy_number__data | Analyte Replicate Filter | TCGA-AK-3426-01A-01D-1185-01 | TCGA-AK-3426-01A-02D-1322-01 |
| TCGA-B8-4620 | snp__genome_wide_snp_6__broad_mit_edu__Level_2__copy_number__data | Analyte Replicate Filter | TCGA-B8-4620-01A-01D-1185-01,TCGA-B8-4620-01A-02D-1322-01 | TCGA-B8-4620-01A-01D-1549-01 |
| TCGA-A3-3322 | snp__genome_wide_snp_6__broad_mit_edu__Level_2__copy_number__data | Analyte Replicate Filter | TCGA-A3-3322-01A-01D-0858-01 | TCGA-A3-3322-01A-02D-1322-01 |
| TCGA-CJ-4639 | snp__genome_wide_snp_6__broad_mit_edu__Level_3__segmented_scna_hg19__seg | Analyte Replicate Filter | TCGA-CJ-4639-01A-01D-1185-01 | TCGA-CJ-4639-01A-02D-1322-01 |
| TCGA-CJ-4636 | snp__genome_wide_snp_6__broad_mit_edu__Level_3__segmented_scna_hg19__seg | Analyte Replicate Filter | TCGA-CJ-4636-01A-01D-1185-01 | TCGA-CJ-4636-01A-02D-1322-01 |
| TCGA-A3-3331 | snp__genome_wide_snp_6__broad_mit_edu__Level_3__segmented_scna_hg19__seg | Analyte Replicate Filter | TCGA-A3-3331-01A-01D-0858-01 | TCGA-A3-3331-01A-02D-1322-01 |
| TCGA-A3-3324 | snp__genome_wide_snp_6__broad_mit_edu__Level_3__segmented_scna_hg19__seg | Analyte Replicate Filter | TCGA-A3-3324-01A-01D-0858-01 | TCGA-A3-3324-01A-02D-1322-01 |
| TCGA-A3-3351 | snp__genome_wide_snp_6__broad_mit_edu__Level_3__segmented_scna_hg19__seg | Analyte Replicate Filter | TCGA-A3-3351-01A-01D-1185-01 | TCGA-A3-3351-01A-02D-1322-01 |
| TCGA-BP-4163 | snp__genome_wide_snp_6__broad_mit_edu__Level_3__segmented_scna_hg19__seg | Analyte Replicate Filter | TCGA-BP-4163-01A-01D-1185-01 | TCGA-BP-4163-01A-02D-1322-01 |
| TCGA-A3-3317 | snp__genome_wide_snp_6__broad_mit_edu__Level_3__segmented_scna_hg19__seg | Analyte Replicate Filter | TCGA-A3-3317-01A-01D-0858-01 | TCGA-A3-3317-01A-02D-1322-01 |
| TCGA-AK-3465 | snp__genome_wide_snp_6__broad_mit_edu__Level_3__segmented_scna_hg19__seg | Analyte Replicate Filter | TCGA-AK-3465-01A-01D-0858-01 | TCGA-AK-3465-01A-02D-1322-01 |
| TCGA-AK-3436 | snp__genome_wide_snp_6__broad_mit_edu__Level_3__segmented_scna_hg19__seg | Analyte Replicate Filter | TCGA-AK-3436-01A-01D-1185-01 | TCGA-AK-3436-01A-02D-1322-01 |
| TCGA-BP-4162 | snp__genome_wide_snp_6__broad_mit_edu__Level_3__segmented_scna_hg19__seg | Analyte Replicate Filter | TCGA-BP-4162-01A-01D-1185-01 | TCGA-BP-4162-01A-02D-1322-01 |
| TCGA-BP-4167 | snp__genome_wide_snp_6__broad_mit_edu__Level_3__segmented_scna_hg19__seg | Analyte Replicate Filter | TCGA-BP-4167-01A-01D-1185-01 | TCGA-BP-4167-01A-02D-1322-01 |
| TCGA-B2-3923 | snp__genome_wide_snp_6__broad_mit_edu__Level_3__segmented_scna_hg19__seg | Analyte Replicate Filter | TCGA-B2-3923-01A-01D-1185-01 | TCGA-B2-3923-01A-02D-1322-01 |
| TCGA-CJ-4638 | snp__genome_wide_snp_6__broad_mit_edu__Level_3__segmented_scna_hg19__seg | Analyte Replicate Filter | TCGA-CJ-4638-01A-01D-1185-01 | TCGA-CJ-4638-01A-02D-1322-01 |
| TCGA-A3-3347 | snp__genome_wide_snp_6__broad_mit_edu__Level_3__segmented_scna_hg19__seg | Analyte Replicate Filter | TCGA-A3-3347-01A-01D-1185-01 | TCGA-A3-3347-01A-02D-1322-01 |
| TCGA-AK-3440 | snp__genome_wide_snp_6__broad_mit_edu__Level_3__segmented_scna_hg19__seg | Analyte Replicate Filter | TCGA-AK-3440-01A-01D-0858-01 | TCGA-AK-3440-01A-02D-1274-01 |
| TCGA-CJ-4644 | snp__genome_wide_snp_6__broad_mit_edu__Level_3__segmented_scna_hg19__seg | Analyte Replicate Filter | TCGA-CJ-4644-01A-01D-1185-01 | TCGA-CJ-4644-01A-02D-1322-01 |
| TCGA-A3-3319 | snp__genome_wide_snp_6__broad_mit_edu__Level_3__segmented_scna_hg19__seg | Analyte Replicate Filter | TCGA-A3-3319-01A-01D-0858-01 | TCGA-A3-3319-01A-02D-1322-01 |
| TCGA-CJ-4643 | snp__genome_wide_snp_6__broad_mit_edu__Level_3__segmented_scna_hg19__seg | Analyte Replicate Filter | TCGA-CJ-4643-01A-01D-1185-01 | TCGA-CJ-4643-01A-02D-1322-01 |
| TCGA-B8-4619 | snp__genome_wide_snp_6__broad_mit_edu__Level_3__segmented_scna_hg19__seg | Analyte Replicate Filter | TCGA-B8-4619-01A-01D-1185-01,TCGA-B8-4619-01A-02D-1322-01 | TCGA-B8-4619-01A-02D-1549-01 |
| TCGA-A3-3383 | snp__genome_wide_snp_6__broad_mit_edu__Level_3__segmented_scna_hg19__seg | Analyte Replicate Filter | TCGA-A3-3383-01A-01D-0858-01 | TCGA-A3-3383-01A-02D-1322-01 |
| TCGA-AK-3456 | snp__genome_wide_snp_6__broad_mit_edu__Level_3__segmented_scna_hg19__seg | Analyte Replicate Filter | TCGA-AK-3456-01A-01D-1185-01 | TCGA-AK-3456-01A-02D-1322-01 |
| TCGA-A3-3311 | snp__genome_wide_snp_6__broad_mit_edu__Level_3__segmented_scna_hg19__seg | Analyte Replicate Filter | TCGA-A3-3311-01A-01D-0858-01 | TCGA-A3-3311-01A-02D-1322-01 |
| TCGA-A3-3322 | snp__genome_wide_snp_6__broad_mit_edu__Level_3__segmented_scna_hg19__seg | Analyte Replicate Filter | TCGA-A3-3322-01A-01D-0858-01 | TCGA-A3-3322-01A-02D-1322-01 |
| TCGA-BP-4161 | snp__genome_wide_snp_6__broad_mit_edu__Level_3__segmented_scna_hg19__seg | Analyte Replicate Filter | TCGA-BP-4161-01A-01D-1185-01 | TCGA-BP-4161-01A-02D-1322-01 |
| TCGA-A3-3320 | snp__genome_wide_snp_6__broad_mit_edu__Level_3__segmented_scna_hg19__seg | Analyte Replicate Filter | TCGA-A3-3320-01A-01D-0858-01 | TCGA-A3-3320-01A-02D-1322-01 |
| TCGA-CJ-4640 | snp__genome_wide_snp_6__broad_mit_edu__Level_3__segmented_scna_hg19__seg | Analyte Replicate Filter | TCGA-CJ-4640-01A-01D-1185-01 | TCGA-CJ-4640-01A-02D-1322-01 |
| TCGA-A3-3313 | snp__genome_wide_snp_6__broad_mit_edu__Level_3__segmented_scna_hg19__seg | Analyte Replicate Filter | TCGA-A3-3313-01A-01D-0858-01 | TCGA-A3-3313-01A-02D-1322-01 |
| TCGA-AK-3453 | snp__genome_wide_snp_6__broad_mit_edu__Level_3__segmented_scna_hg19__seg | Analyte Replicate Filter | TCGA-AK-3453-01A-01D-0858-01 | TCGA-AK-3453-01A-02D-1274-01 |
| TCGA-CJ-4641 | snp__genome_wide_snp_6__broad_mit_edu__Level_3__segmented_scna_hg19__seg | Analyte Replicate Filter | TCGA-CJ-4641-01A-01D-1185-01 | TCGA-CJ-4641-01A-02D-1322-01 |
| TCGA-B2-4102 | snp__genome_wide_snp_6__broad_mit_edu__Level_3__segmented_scna_hg19__seg | Analyte Replicate Filter | TCGA-B2-4102-01A-01D-1185-01 | TCGA-B2-4102-01A-02D-1322-01 |
| TCGA-B8-4148 | snp__genome_wide_snp_6__broad_mit_edu__Level_3__segmented_scna_hg19__seg | Analyte Replicate Filter | TCGA-B8-4148-01A-01D-1185-01 | TCGA-B8-4148-01A-02D-1322-01 |
| TCGA-A3-3362 | snp__genome_wide_snp_6__broad_mit_edu__Level_3__segmented_scna_hg19__seg | Analyte Replicate Filter | TCGA-A3-3362-01A-01D-1185-01 | TCGA-A3-3362-01A-02D-1322-01 |
| TCGA-A3-3308 | snp__genome_wide_snp_6__broad_mit_edu__Level_3__segmented_scna_hg19__seg | Analyte Replicate Filter | TCGA-A3-3308-01A-01D-0858-01 | TCGA-A3-3308-01A-02D-1322-01 |
| TCGA-BP-4164 | snp__genome_wide_snp_6__broad_mit_edu__Level_3__segmented_scna_hg19__seg | Analyte Replicate Filter | TCGA-BP-4164-01A-01D-1185-01 | TCGA-BP-4164-01A-02D-1322-01 |
| TCGA-A3-3372 | snp__genome_wide_snp_6__broad_mit_edu__Level_3__segmented_scna_hg19__seg | Analyte Replicate Filter | TCGA-A3-3372-01A-01D-0858-01 | TCGA-A3-3372-01A-02D-1322-01 |
| TCGA-AK-3429 | snp__genome_wide_snp_6__broad_mit_edu__Level_3__segmented_scna_hg19__seg | Analyte Replicate Filter | TCGA-AK-3429-01A-01D-1185-01 | TCGA-AK-3429-01A-02D-1322-01 |
| TCGA-AK-3444 | snp__genome_wide_snp_6__broad_mit_edu__Level_3__segmented_scna_hg19__seg | Analyte Replicate Filter | TCGA-AK-3444-01A-01D-0858-01 | TCGA-AK-3444-01A-02D-1322-01 |
| TCGA-CJ-4634 | snp__genome_wide_snp_6__broad_mit_edu__Level_3__segmented_scna_hg19__seg | Analyte Replicate Filter | TCGA-CJ-4634-01A-01D-1185-01 | TCGA-CJ-4634-01A-02D-1322-01 |
| TCGA-AK-3443 | snp__genome_wide_snp_6__broad_mit_edu__Level_3__segmented_scna_hg19__seg | Analyte Replicate Filter | TCGA-AK-3443-01A-01D-0858-01 | TCGA-AK-3443-01A-02D-1322-01 |
| TCGA-B8-4622 | snp__genome_wide_snp_6__broad_mit_edu__Level_3__segmented_scna_hg19__seg | Analyte Replicate Filter | TCGA-B8-4622-01A-02D-1274-01 | TCGA-B8-4622-01A-02D-1549-01 |
| TCGA-A3-3378 | snp__genome_wide_snp_6__broad_mit_edu__Level_3__segmented_scna_hg19__seg | Analyte Replicate Filter | TCGA-A3-3378-01A-01D-0858-01 | TCGA-A3-3378-01A-02D-1322-01 |
| TCGA-CJ-4637 | snp__genome_wide_snp_6__broad_mit_edu__Level_3__segmented_scna_hg19__seg | Analyte Replicate Filter | TCGA-CJ-4637-01A-01D-1185-01 | TCGA-CJ-4637-01A-02D-1322-01 |
| TCGA-AK-3453 | snp__genome_wide_snp_6__broad_mit_edu__Level_3__segmented_scna_hg19__seg | Analyte Replicate Filter | TCGA-AK-3453-10A-01D-0858-01 | TCGA-AK-3453-10A-01D-1274-01 |
| TCGA-AK-3426 | snp__genome_wide_snp_6__broad_mit_edu__Level_3__segmented_scna_hg19__seg | Analyte Replicate Filter | TCGA-AK-3426-01A-01D-1185-01 | TCGA-AK-3426-01A-02D-1322-01 |
| TCGA-B8-4620 | snp__genome_wide_snp_6__broad_mit_edu__Level_3__segmented_scna_hg19__seg | Analyte Replicate Filter | TCGA-B8-4620-01A-01D-1185-01,TCGA-B8-4620-01A-02D-1322-01 | TCGA-B8-4620-01A-01D-1549-01 |
| TCGA-CJ-4639 | snp__genome_wide_snp_6__broad_mit_edu__Level_2__no_outlier_copy_number__data | Analyte Replicate Filter | TCGA-CJ-4639-01A-01D-1185-01 | TCGA-CJ-4639-01A-02D-1322-01 |
| TCGA-A3-3324 | snp__genome_wide_snp_6__broad_mit_edu__Level_2__no_outlier_copy_number__data | Analyte Replicate Filter | TCGA-A3-3324-01A-01D-0858-01 | TCGA-A3-3324-01A-02D-1322-01 |
| TCGA-A3-3331 | snp__genome_wide_snp_6__broad_mit_edu__Level_2__no_outlier_copy_number__data | Analyte Replicate Filter | TCGA-A3-3331-01A-01D-0858-01 | TCGA-A3-3331-01A-02D-1322-01 |
| TCGA-CJ-4637 | snp__genome_wide_snp_6__broad_mit_edu__Level_2__no_outlier_copy_number__data | Analyte Replicate Filter | TCGA-CJ-4637-01A-01D-1185-01 | TCGA-CJ-4637-01A-02D-1322-01 |
| TCGA-BP-4161 | snp__genome_wide_snp_6__broad_mit_edu__Level_2__no_outlier_copy_number__data | Analyte Replicate Filter | TCGA-BP-4161-01A-01D-1185-01 | TCGA-BP-4161-01A-02D-1322-01 |
| TCGA-B8-4148 | snp__genome_wide_snp_6__broad_mit_edu__Level_2__no_outlier_copy_number__data | Analyte Replicate Filter | TCGA-B8-4148-01A-01D-1185-01 | TCGA-B8-4148-01A-02D-1322-01 |
| TCGA-A3-3362 | snp__genome_wide_snp_6__broad_mit_edu__Level_2__no_outlier_copy_number__data | Analyte Replicate Filter | TCGA-A3-3362-01A-01D-1185-01 | TCGA-A3-3362-01A-02D-1322-01 |
| TCGA-BP-4163 | snp__genome_wide_snp_6__broad_mit_edu__Level_2__no_outlier_copy_number__data | Analyte Replicate Filter | TCGA-BP-4163-01A-01D-1185-01 | TCGA-BP-4163-01A-02D-1322-01 |
| TCGA-A3-3317 | snp__genome_wide_snp_6__broad_mit_edu__Level_2__no_outlier_copy_number__data | Analyte Replicate Filter | TCGA-A3-3317-01A-01D-0858-01 | TCGA-A3-3317-01A-02D-1322-01 |
| TCGA-AK-3436 | snp__genome_wide_snp_6__broad_mit_edu__Level_2__no_outlier_copy_number__data | Analyte Replicate Filter | TCGA-AK-3436-01A-01D-1185-01 | TCGA-AK-3436-01A-02D-1322-01 |
| TCGA-BP-4162 | snp__genome_wide_snp_6__broad_mit_edu__Level_2__no_outlier_copy_number__data | Analyte Replicate Filter | TCGA-BP-4162-01A-01D-1185-01 | TCGA-BP-4162-01A-02D-1322-01 |
| TCGA-BP-4164 | snp__genome_wide_snp_6__broad_mit_edu__Level_2__no_outlier_copy_number__data | Analyte Replicate Filter | TCGA-BP-4164-01A-01D-1185-01 | TCGA-BP-4164-01A-02D-1322-01 |
| TCGA-B2-3923 | snp__genome_wide_snp_6__broad_mit_edu__Level_2__no_outlier_copy_number__data | Analyte Replicate Filter | TCGA-B2-3923-01A-01D-1185-01 | TCGA-B2-3923-01A-02D-1322-01 |
| TCGA-BP-4167 | snp__genome_wide_snp_6__broad_mit_edu__Level_2__no_outlier_copy_number__data | Analyte Replicate Filter | TCGA-BP-4167-01A-01D-1185-01 | TCGA-BP-4167-01A-02D-1322-01 |
| TCGA-A3-3347 | snp__genome_wide_snp_6__broad_mit_edu__Level_2__no_outlier_copy_number__data | Analyte Replicate Filter | TCGA-A3-3347-01A-01D-1185-01 | TCGA-A3-3347-01A-02D-1322-01 |
| TCGA-AK-3440 | snp__genome_wide_snp_6__broad_mit_edu__Level_2__no_outlier_copy_number__data | Analyte Replicate Filter | TCGA-AK-3440-01A-01D-0858-01 | TCGA-AK-3440-01A-02D-1274-01 |
| TCGA-CJ-4644 | snp__genome_wide_snp_6__broad_mit_edu__Level_2__no_outlier_copy_number__data | Analyte Replicate Filter | TCGA-CJ-4644-01A-01D-1185-01 | TCGA-CJ-4644-01A-02D-1322-01 |
| TCGA-AK-3465 | snp__genome_wide_snp_6__broad_mit_edu__Level_2__no_outlier_copy_number__data | Analyte Replicate Filter | TCGA-AK-3465-01A-01D-0858-01 | TCGA-AK-3465-01A-02D-1322-01 |
| TCGA-A3-3319 | snp__genome_wide_snp_6__broad_mit_edu__Level_2__no_outlier_copy_number__data | Analyte Replicate Filter | TCGA-A3-3319-01A-01D-0858-01 | TCGA-A3-3319-01A-02D-1322-01 |
| TCGA-CJ-4643 | snp__genome_wide_snp_6__broad_mit_edu__Level_2__no_outlier_copy_number__data | Analyte Replicate Filter | TCGA-CJ-4643-01A-01D-1185-01 | TCGA-CJ-4643-01A-02D-1322-01 |
| TCGA-B8-4619 | snp__genome_wide_snp_6__broad_mit_edu__Level_2__no_outlier_copy_number__data | Analyte Replicate Filter | TCGA-B8-4619-01A-01D-1185-01,TCGA-B8-4619-01A-02D-1322-01 | TCGA-B8-4619-01A-02D-1549-01 |
| TCGA-A3-3383 | snp__genome_wide_snp_6__broad_mit_edu__Level_2__no_outlier_copy_number__data | Analyte Replicate Filter | TCGA-A3-3383-01A-01D-0858-01 | TCGA-A3-3383-01A-02D-1322-01 |
| TCGA-AK-3456 | snp__genome_wide_snp_6__broad_mit_edu__Level_2__no_outlier_copy_number__data | Analyte Replicate Filter | TCGA-AK-3456-01A-01D-1185-01 | TCGA-AK-3456-01A-02D-1322-01 |
| TCGA-A3-3311 | snp__genome_wide_snp_6__broad_mit_edu__Level_2__no_outlier_copy_number__data | Analyte Replicate Filter | TCGA-A3-3311-01A-01D-0858-01 | TCGA-A3-3311-01A-02D-1322-01 |
| TCGA-A3-3351 | snp__genome_wide_snp_6__broad_mit_edu__Level_2__no_outlier_copy_number__data | Analyte Replicate Filter | TCGA-A3-3351-01A-01D-1185-01 | TCGA-A3-3351-01A-02D-1322-01 |
| TCGA-A3-3320 | snp__genome_wide_snp_6__broad_mit_edu__Level_2__no_outlier_copy_number__data | Analyte Replicate Filter | TCGA-A3-3320-01A-01D-0858-01 | TCGA-A3-3320-01A-02D-1322-01 |
| TCGA-CJ-4640 | snp__genome_wide_snp_6__broad_mit_edu__Level_2__no_outlier_copy_number__data | Analyte Replicate Filter | TCGA-CJ-4640-01A-01D-1185-01 | TCGA-CJ-4640-01A-02D-1322-01 |
| TCGA-A3-3313 | snp__genome_wide_snp_6__broad_mit_edu__Level_2__no_outlier_copy_number__data | Analyte Replicate Filter | TCGA-A3-3313-01A-01D-0858-01 | TCGA-A3-3313-01A-02D-1322-01 |
| TCGA-AK-3453 | snp__genome_wide_snp_6__broad_mit_edu__Level_2__no_outlier_copy_number__data | Analyte Replicate Filter | TCGA-AK-3453-01A-01D-0858-01 | TCGA-AK-3453-01A-02D-1274-01 |
| TCGA-CJ-4638 | snp__genome_wide_snp_6__broad_mit_edu__Level_2__no_outlier_copy_number__data | Analyte Replicate Filter | TCGA-CJ-4638-01A-01D-1185-01 | TCGA-CJ-4638-01A-02D-1322-01 |
| TCGA-CJ-4641 | snp__genome_wide_snp_6__broad_mit_edu__Level_2__no_outlier_copy_number__data | Analyte Replicate Filter | TCGA-CJ-4641-01A-01D-1185-01 | TCGA-CJ-4641-01A-02D-1322-01 |
| TCGA-B2-4102 | snp__genome_wide_snp_6__broad_mit_edu__Level_2__no_outlier_copy_number__data | Analyte Replicate Filter | TCGA-B2-4102-01A-01D-1185-01 | TCGA-B2-4102-01A-02D-1322-01 |
| TCGA-CJ-4636 | snp__genome_wide_snp_6__broad_mit_edu__Level_2__no_outlier_copy_number__data | Analyte Replicate Filter | TCGA-CJ-4636-01A-01D-1185-01 | TCGA-CJ-4636-01A-02D-1322-01 |
| TCGA-A3-3308 | snp__genome_wide_snp_6__broad_mit_edu__Level_2__no_outlier_copy_number__data | Analyte Replicate Filter | TCGA-A3-3308-01A-01D-0858-01 | TCGA-A3-3308-01A-02D-1322-01 |
| TCGA-A3-3372 | snp__genome_wide_snp_6__broad_mit_edu__Level_2__no_outlier_copy_number__data | Analyte Replicate Filter | TCGA-A3-3372-01A-01D-0858-01 | TCGA-A3-3372-01A-02D-1322-01 |
| TCGA-AK-3429 | snp__genome_wide_snp_6__broad_mit_edu__Level_2__no_outlier_copy_number__data | Analyte Replicate Filter | TCGA-AK-3429-01A-01D-1185-01 | TCGA-AK-3429-01A-02D-1322-01 |
| TCGA-AK-3444 | snp__genome_wide_snp_6__broad_mit_edu__Level_2__no_outlier_copy_number__data | Analyte Replicate Filter | TCGA-AK-3444-01A-01D-0858-01 | TCGA-AK-3444-01A-02D-1322-01 |
| TCGA-B2-4098 | snp__genome_wide_snp_6__broad_mit_edu__Level_2__no_outlier_copy_number__data | Analyte Replicate Filter | TCGA-B2-4098-01A-01D-1185-01 | TCGA-B2-4098-01A-02D-1322-01 |
| TCGA-CJ-4634 | snp__genome_wide_snp_6__broad_mit_edu__Level_2__no_outlier_copy_number__data | Analyte Replicate Filter | TCGA-CJ-4634-01A-01D-1185-01 | TCGA-CJ-4634-01A-02D-1322-01 |
| TCGA-AK-3443 | snp__genome_wide_snp_6__broad_mit_edu__Level_2__no_outlier_copy_number__data | Analyte Replicate Filter | TCGA-AK-3443-01A-01D-0858-01 | TCGA-AK-3443-01A-02D-1322-01 |
| TCGA-A3-3323 | snp__genome_wide_snp_6__broad_mit_edu__Level_2__no_outlier_copy_number__data | Analyte Replicate Filter | TCGA-A3-3323-01A-01D-0858-01 | TCGA-A3-3323-01A-02D-1322-01 |
| TCGA-B8-4622 | snp__genome_wide_snp_6__broad_mit_edu__Level_2__no_outlier_copy_number__data | Analyte Replicate Filter | TCGA-B8-4622-01A-02D-1274-01 | TCGA-B8-4622-01A-02D-1549-01 |
| TCGA-A3-3374 | snp__genome_wide_snp_6__broad_mit_edu__Level_2__no_outlier_copy_number__data | Analyte Replicate Filter | TCGA-A3-3374-01A-01D-0858-01 | TCGA-A3-3374-01A-02D-1322-01 |
| TCGA-A3-3382 | snp__genome_wide_snp_6__broad_mit_edu__Level_2__no_outlier_copy_number__data | Analyte Replicate Filter | TCGA-A3-3382-01A-01D-0858-01 | TCGA-A3-3382-01A-02D-1322-01 |
| TCGA-A3-3378 | snp__genome_wide_snp_6__broad_mit_edu__Level_2__no_outlier_copy_number__data | Analyte Replicate Filter | TCGA-A3-3378-01A-01D-0858-01 | TCGA-A3-3378-01A-02D-1322-01 |
| TCGA-AK-3453 | snp__genome_wide_snp_6__broad_mit_edu__Level_2__no_outlier_copy_number__data | Analyte Replicate Filter | TCGA-AK-3453-10A-01D-0858-01 | TCGA-AK-3453-10A-01D-1274-01 |
| TCGA-AK-3426 | snp__genome_wide_snp_6__broad_mit_edu__Level_2__no_outlier_copy_number__data | Analyte Replicate Filter | TCGA-AK-3426-01A-01D-1185-01 | TCGA-AK-3426-01A-02D-1322-01 |
| TCGA-B8-4620 | snp__genome_wide_snp_6__broad_mit_edu__Level_2__no_outlier_copy_number__data | Analyte Replicate Filter | TCGA-B8-4620-01A-01D-1185-01,TCGA-B8-4620-01A-02D-1322-01 | TCGA-B8-4620-01A-01D-1549-01 |
| TCGA-A3-3322 | snp__genome_wide_snp_6__broad_mit_edu__Level_2__no_outlier_copy_number__data | Analyte Replicate Filter | TCGA-A3-3322-01A-01D-0858-01 | TCGA-A3-3322-01A-02D-1322-01 |
| TCGA-B2-5633 | methylation__humanmethylation450__jhu_usc_edu__Level_3__within_bioassay_data_set_function__data | Analyte Replicate Filter | TCGA-B2-5633-01A-01D-1536-05 | TCGA-B2-5633-01B-04D-A27A-05 |
| TCGA-B2-5635 | methylation__humanmethylation450__jhu_usc_edu__Level_3__within_bioassay_data_set_function__data | Analyte Replicate Filter | TCGA-B2-5635-01A-01D-1536-05 | TCGA-B2-5635-01B-04D-A27A-05 |
| TCGA-CJ-4639 | snp__genome_wide_snp_6__broad_mit_edu__Level_3__segmented_scna_minus_germline_cnv_hg18__seg | Analyte Replicate Filter | TCGA-CJ-4639-01A-01D-1185-01 | TCGA-CJ-4639-01A-02D-1322-01 |
| TCGA-CJ-4636 | snp__genome_wide_snp_6__broad_mit_edu__Level_3__segmented_scna_minus_germline_cnv_hg18__seg | Analyte Replicate Filter | TCGA-CJ-4636-01A-01D-1185-01 | TCGA-CJ-4636-01A-02D-1322-01 |
| TCGA-A3-3331 | snp__genome_wide_snp_6__broad_mit_edu__Level_3__segmented_scna_minus_germline_cnv_hg18__seg | Analyte Replicate Filter | TCGA-A3-3331-01A-01D-0858-01 | TCGA-A3-3331-01A-02D-1322-01 |
| TCGA-A3-3324 | snp__genome_wide_snp_6__broad_mit_edu__Level_3__segmented_scna_minus_germline_cnv_hg18__seg | Analyte Replicate Filter | TCGA-A3-3324-01A-01D-0858-01 | TCGA-A3-3324-01A-02D-1322-01 |
| TCGA-A3-3351 | snp__genome_wide_snp_6__broad_mit_edu__Level_3__segmented_scna_minus_germline_cnv_hg18__seg | Analyte Replicate Filter | TCGA-A3-3351-01A-01D-1185-01 | TCGA-A3-3351-01A-02D-1322-01 |
| TCGA-BP-4163 | snp__genome_wide_snp_6__broad_mit_edu__Level_3__segmented_scna_minus_germline_cnv_hg18__seg | Analyte Replicate Filter | TCGA-BP-4163-01A-01D-1185-01 | TCGA-BP-4163-01A-02D-1322-01 |
| TCGA-A3-3317 | snp__genome_wide_snp_6__broad_mit_edu__Level_3__segmented_scna_minus_germline_cnv_hg18__seg | Analyte Replicate Filter | TCGA-A3-3317-01A-01D-0858-01 | TCGA-A3-3317-01A-02D-1322-01 |
| TCGA-AK-3465 | snp__genome_wide_snp_6__broad_mit_edu__Level_3__segmented_scna_minus_germline_cnv_hg18__seg | Analyte Replicate Filter | TCGA-AK-3465-01A-01D-0858-01 | TCGA-AK-3465-01A-02D-1322-01 |
| TCGA-AK-3436 | snp__genome_wide_snp_6__broad_mit_edu__Level_3__segmented_scna_minus_germline_cnv_hg18__seg | Analyte Replicate Filter | TCGA-AK-3436-01A-01D-1185-01 | TCGA-AK-3436-01A-02D-1322-01 |
| TCGA-BP-4162 | snp__genome_wide_snp_6__broad_mit_edu__Level_3__segmented_scna_minus_germline_cnv_hg18__seg | Analyte Replicate Filter | TCGA-BP-4162-01A-01D-1185-01 | TCGA-BP-4162-01A-02D-1322-01 |
| TCGA-BP-4167 | snp__genome_wide_snp_6__broad_mit_edu__Level_3__segmented_scna_minus_germline_cnv_hg18__seg | Analyte Replicate Filter | TCGA-BP-4167-01A-01D-1185-01 | TCGA-BP-4167-01A-02D-1322-01 |
| TCGA-B2-3923 | snp__genome_wide_snp_6__broad_mit_edu__Level_3__segmented_scna_minus_germline_cnv_hg18__seg | Analyte Replicate Filter | TCGA-B2-3923-01A-01D-1185-01 | TCGA-B2-3923-01A-02D-1322-01 |
| TCGA-CJ-4638 | snp__genome_wide_snp_6__broad_mit_edu__Level_3__segmented_scna_minus_germline_cnv_hg18__seg | Analyte Replicate Filter | TCGA-CJ-4638-01A-01D-1185-01 | TCGA-CJ-4638-01A-02D-1322-01 |
| TCGA-A3-3347 | snp__genome_wide_snp_6__broad_mit_edu__Level_3__segmented_scna_minus_germline_cnv_hg18__seg | Analyte Replicate Filter | TCGA-A3-3347-01A-01D-1185-01 | TCGA-A3-3347-01A-02D-1322-01 |
| TCGA-AK-3440 | snp__genome_wide_snp_6__broad_mit_edu__Level_3__segmented_scna_minus_germline_cnv_hg18__seg | Analyte Replicate Filter | TCGA-AK-3440-01A-01D-0858-01 | TCGA-AK-3440-01A-02D-1274-01 |
| TCGA-CJ-4644 | snp__genome_wide_snp_6__broad_mit_edu__Level_3__segmented_scna_minus_germline_cnv_hg18__seg | Analyte Replicate Filter | TCGA-CJ-4644-01A-01D-1185-01 | TCGA-CJ-4644-01A-02D-1322-01 |
| TCGA-A3-3319 | snp__genome_wide_snp_6__broad_mit_edu__Level_3__segmented_scna_minus_germline_cnv_hg18__seg | Analyte Replicate Filter | TCGA-A3-3319-01A-01D-0858-01 | TCGA-A3-3319-01A-02D-1322-01 |
| TCGA-CJ-4643 | snp__genome_wide_snp_6__broad_mit_edu__Level_3__segmented_scna_minus_germline_cnv_hg18__seg | Analyte Replicate Filter | TCGA-CJ-4643-01A-01D-1185-01 | TCGA-CJ-4643-01A-02D-1322-01 |
| TCGA-B8-4619 | snp__genome_wide_snp_6__broad_mit_edu__Level_3__segmented_scna_minus_germline_cnv_hg18__seg | Analyte Replicate Filter | TCGA-B8-4619-01A-01D-1185-01,TCGA-B8-4619-01A-02D-1322-01 | TCGA-B8-4619-01A-02D-1549-01 |
| TCGA-A3-3383 | snp__genome_wide_snp_6__broad_mit_edu__Level_3__segmented_scna_minus_germline_cnv_hg18__seg | Analyte Replicate Filter | TCGA-A3-3383-01A-01D-0858-01 | TCGA-A3-3383-01A-02D-1322-01 |
| TCGA-AK-3456 | snp__genome_wide_snp_6__broad_mit_edu__Level_3__segmented_scna_minus_germline_cnv_hg18__seg | Analyte Replicate Filter | TCGA-AK-3456-01A-01D-1185-01 | TCGA-AK-3456-01A-02D-1322-01 |
| TCGA-A3-3311 | snp__genome_wide_snp_6__broad_mit_edu__Level_3__segmented_scna_minus_germline_cnv_hg18__seg | Analyte Replicate Filter | TCGA-A3-3311-01A-01D-0858-01 | TCGA-A3-3311-01A-02D-1322-01 |
| TCGA-A3-3322 | snp__genome_wide_snp_6__broad_mit_edu__Level_3__segmented_scna_minus_germline_cnv_hg18__seg | Analyte Replicate Filter | TCGA-A3-3322-01A-01D-0858-01 | TCGA-A3-3322-01A-02D-1322-01 |
| TCGA-BP-4161 | snp__genome_wide_snp_6__broad_mit_edu__Level_3__segmented_scna_minus_germline_cnv_hg18__seg | Analyte Replicate Filter | TCGA-BP-4161-01A-01D-1185-01 | TCGA-BP-4161-01A-02D-1322-01 |
| TCGA-A3-3320 | snp__genome_wide_snp_6__broad_mit_edu__Level_3__segmented_scna_minus_germline_cnv_hg18__seg | Analyte Replicate Filter | TCGA-A3-3320-01A-01D-0858-01 | TCGA-A3-3320-01A-02D-1322-01 |
| TCGA-CJ-4640 | snp__genome_wide_snp_6__broad_mit_edu__Level_3__segmented_scna_minus_germline_cnv_hg18__seg | Analyte Replicate Filter | TCGA-CJ-4640-01A-01D-1185-01 | TCGA-CJ-4640-01A-02D-1322-01 |
| TCGA-A3-3313 | snp__genome_wide_snp_6__broad_mit_edu__Level_3__segmented_scna_minus_germline_cnv_hg18__seg | Analyte Replicate Filter | TCGA-A3-3313-01A-01D-0858-01 | TCGA-A3-3313-01A-02D-1322-01 |
| TCGA-AK-3453 | snp__genome_wide_snp_6__broad_mit_edu__Level_3__segmented_scna_minus_germline_cnv_hg18__seg | Analyte Replicate Filter | TCGA-AK-3453-01A-01D-0858-01 | TCGA-AK-3453-01A-02D-1274-01 |
| TCGA-CJ-4641 | snp__genome_wide_snp_6__broad_mit_edu__Level_3__segmented_scna_minus_germline_cnv_hg18__seg | Analyte Replicate Filter | TCGA-CJ-4641-01A-01D-1185-01 | TCGA-CJ-4641-01A-02D-1322-01 |
| TCGA-B2-4102 | snp__genome_wide_snp_6__broad_mit_edu__Level_3__segmented_scna_minus_germline_cnv_hg18__seg | Analyte Replicate Filter | TCGA-B2-4102-01A-01D-1185-01 | TCGA-B2-4102-01A-02D-1322-01 |
| TCGA-B8-4148 | snp__genome_wide_snp_6__broad_mit_edu__Level_3__segmented_scna_minus_germline_cnv_hg18__seg | Analyte Replicate Filter | TCGA-B8-4148-01A-01D-1185-01 | TCGA-B8-4148-01A-02D-1322-01 |
| TCGA-A3-3362 | snp__genome_wide_snp_6__broad_mit_edu__Level_3__segmented_scna_minus_germline_cnv_hg18__seg | Analyte Replicate Filter | TCGA-A3-3362-01A-01D-1185-01 | TCGA-A3-3362-01A-02D-1322-01 |
| TCGA-A3-3308 | snp__genome_wide_snp_6__broad_mit_edu__Level_3__segmented_scna_minus_germline_cnv_hg18__seg | Analyte Replicate Filter | TCGA-A3-3308-01A-01D-0858-01 | TCGA-A3-3308-01A-02D-1322-01 |
| TCGA-BP-4164 | snp__genome_wide_snp_6__broad_mit_edu__Level_3__segmented_scna_minus_germline_cnv_hg18__seg | Analyte Replicate Filter | TCGA-BP-4164-01A-01D-1185-01 | TCGA-BP-4164-01A-02D-1322-01 |
| TCGA-A3-3372 | snp__genome_wide_snp_6__broad_mit_edu__Level_3__segmented_scna_minus_germline_cnv_hg18__seg | Analyte Replicate Filter | TCGA-A3-3372-01A-01D-0858-01 | TCGA-A3-3372-01A-02D-1322-01 |
| TCGA-AK-3429 | snp__genome_wide_snp_6__broad_mit_edu__Level_3__segmented_scna_minus_germline_cnv_hg18__seg | Analyte Replicate Filter | TCGA-AK-3429-01A-01D-1185-01 | TCGA-AK-3429-01A-02D-1322-01 |
| TCGA-AK-3444 | snp__genome_wide_snp_6__broad_mit_edu__Level_3__segmented_scna_minus_germline_cnv_hg18__seg | Analyte Replicate Filter | TCGA-AK-3444-01A-01D-0858-01 | TCGA-AK-3444-01A-02D-1322-01 |
| TCGA-CJ-4634 | snp__genome_wide_snp_6__broad_mit_edu__Level_3__segmented_scna_minus_germline_cnv_hg18__seg | Analyte Replicate Filter | TCGA-CJ-4634-01A-01D-1185-01 | TCGA-CJ-4634-01A-02D-1322-01 |
| TCGA-AK-3443 | snp__genome_wide_snp_6__broad_mit_edu__Level_3__segmented_scna_minus_germline_cnv_hg18__seg | Analyte Replicate Filter | TCGA-AK-3443-01A-01D-0858-01 | TCGA-AK-3443-01A-02D-1322-01 |
| TCGA-B8-4622 | snp__genome_wide_snp_6__broad_mit_edu__Level_3__segmented_scna_minus_germline_cnv_hg18__seg | Analyte Replicate Filter | TCGA-B8-4622-01A-02D-1274-01 | TCGA-B8-4622-01A-02D-1549-01 |
| TCGA-A3-3378 | snp__genome_wide_snp_6__broad_mit_edu__Level_3__segmented_scna_minus_germline_cnv_hg18__seg | Analyte Replicate Filter | TCGA-A3-3378-01A-01D-0858-01 | TCGA-A3-3378-01A-02D-1322-01 |
| TCGA-CJ-4637 | snp__genome_wide_snp_6__broad_mit_edu__Level_3__segmented_scna_minus_germline_cnv_hg18__seg | Analyte Replicate Filter | TCGA-CJ-4637-01A-01D-1185-01 | TCGA-CJ-4637-01A-02D-1322-01 |
| TCGA-AK-3453 | snp__genome_wide_snp_6__broad_mit_edu__Level_3__segmented_scna_minus_germline_cnv_hg18__seg | Analyte Replicate Filter | TCGA-AK-3453-10A-01D-0858-01 | TCGA-AK-3453-10A-01D-1274-01 |
| TCGA-AK-3426 | snp__genome_wide_snp_6__broad_mit_edu__Level_3__segmented_scna_minus_germline_cnv_hg18__seg | Analyte Replicate Filter | TCGA-AK-3426-01A-01D-1185-01 | TCGA-AK-3426-01A-02D-1322-01 |
| TCGA-B8-4620 | snp__genome_wide_snp_6__broad_mit_edu__Level_3__segmented_scna_minus_germline_cnv_hg18__seg | Analyte Replicate Filter | TCGA-B8-4620-01A-01D-1185-01,TCGA-B8-4620-01A-02D-1322-01 | TCGA-B8-4620-01A-01D-1549-01 |
| TCGA-CJ-4639 | snp__genome_wide_snp_6__broad_mit_edu__Level_3__segmented_scna_minus_germline_cnv_hg19__seg | Analyte Replicate Filter | TCGA-CJ-4639-01A-01D-1185-01 | TCGA-CJ-4639-01A-02D-1322-01 |
| TCGA-CJ-4636 | snp__genome_wide_snp_6__broad_mit_edu__Level_3__segmented_scna_minus_germline_cnv_hg19__seg | Analyte Replicate Filter | TCGA-CJ-4636-01A-01D-1185-01 | TCGA-CJ-4636-01A-02D-1322-01 |
| TCGA-A3-3331 | snp__genome_wide_snp_6__broad_mit_edu__Level_3__segmented_scna_minus_germline_cnv_hg19__seg | Analyte Replicate Filter | TCGA-A3-3331-01A-01D-0858-01 | TCGA-A3-3331-01A-02D-1322-01 |
| TCGA-A3-3324 | snp__genome_wide_snp_6__broad_mit_edu__Level_3__segmented_scna_minus_germline_cnv_hg19__seg | Analyte Replicate Filter | TCGA-A3-3324-01A-01D-0858-01 | TCGA-A3-3324-01A-02D-1322-01 |
| TCGA-A3-3351 | snp__genome_wide_snp_6__broad_mit_edu__Level_3__segmented_scna_minus_germline_cnv_hg19__seg | Analyte Replicate Filter | TCGA-A3-3351-01A-01D-1185-01 | TCGA-A3-3351-01A-02D-1322-01 |
| TCGA-BP-4163 | snp__genome_wide_snp_6__broad_mit_edu__Level_3__segmented_scna_minus_germline_cnv_hg19__seg | Analyte Replicate Filter | TCGA-BP-4163-01A-01D-1185-01 | TCGA-BP-4163-01A-02D-1322-01 |
| TCGA-A3-3317 | snp__genome_wide_snp_6__broad_mit_edu__Level_3__segmented_scna_minus_germline_cnv_hg19__seg | Analyte Replicate Filter | TCGA-A3-3317-01A-01D-0858-01 | TCGA-A3-3317-01A-02D-1322-01 |
| TCGA-AK-3465 | snp__genome_wide_snp_6__broad_mit_edu__Level_3__segmented_scna_minus_germline_cnv_hg19__seg | Analyte Replicate Filter | TCGA-AK-3465-01A-01D-0858-01 | TCGA-AK-3465-01A-02D-1322-01 |
| TCGA-AK-3436 | snp__genome_wide_snp_6__broad_mit_edu__Level_3__segmented_scna_minus_germline_cnv_hg19__seg | Analyte Replicate Filter | TCGA-AK-3436-01A-01D-1185-01 | TCGA-AK-3436-01A-02D-1322-01 |
| TCGA-BP-4162 | snp__genome_wide_snp_6__broad_mit_edu__Level_3__segmented_scna_minus_germline_cnv_hg19__seg | Analyte Replicate Filter | TCGA-BP-4162-01A-01D-1185-01 | TCGA-BP-4162-01A-02D-1322-01 |
| TCGA-BP-4167 | snp__genome_wide_snp_6__broad_mit_edu__Level_3__segmented_scna_minus_germline_cnv_hg19__seg | Analyte Replicate Filter | TCGA-BP-4167-01A-01D-1185-01 | TCGA-BP-4167-01A-02D-1322-01 |
| TCGA-B2-3923 | snp__genome_wide_snp_6__broad_mit_edu__Level_3__segmented_scna_minus_germline_cnv_hg19__seg | Analyte Replicate Filter | TCGA-B2-3923-01A-01D-1185-01 | TCGA-B2-3923-01A-02D-1322-01 |
| TCGA-CJ-4638 | snp__genome_wide_snp_6__broad_mit_edu__Level_3__segmented_scna_minus_germline_cnv_hg19__seg | Analyte Replicate Filter | TCGA-CJ-4638-01A-01D-1185-01 | TCGA-CJ-4638-01A-02D-1322-01 |
| TCGA-A3-3347 | snp__genome_wide_snp_6__broad_mit_edu__Level_3__segmented_scna_minus_germline_cnv_hg19__seg | Analyte Replicate Filter | TCGA-A3-3347-01A-01D-1185-01 | TCGA-A3-3347-01A-02D-1322-01 |
| TCGA-AK-3440 | snp__genome_wide_snp_6__broad_mit_edu__Level_3__segmented_scna_minus_germline_cnv_hg19__seg | Analyte Replicate Filter | TCGA-AK-3440-01A-01D-0858-01 | TCGA-AK-3440-01A-02D-1274-01 |
| TCGA-CJ-4644 | snp__genome_wide_snp_6__broad_mit_edu__Level_3__segmented_scna_minus_germline_cnv_hg19__seg | Analyte Replicate Filter | TCGA-CJ-4644-01A-01D-1185-01 | TCGA-CJ-4644-01A-02D-1322-01 |
| TCGA-A3-3319 | snp__genome_wide_snp_6__broad_mit_edu__Level_3__segmented_scna_minus_germline_cnv_hg19__seg | Analyte Replicate Filter | TCGA-A3-3319-01A-01D-0858-01 | TCGA-A3-3319-01A-02D-1322-01 |
| TCGA-CJ-4643 | snp__genome_wide_snp_6__broad_mit_edu__Level_3__segmented_scna_minus_germline_cnv_hg19__seg | Analyte Replicate Filter | TCGA-CJ-4643-01A-01D-1185-01 | TCGA-CJ-4643-01A-02D-1322-01 |
| TCGA-B8-4619 | snp__genome_wide_snp_6__broad_mit_edu__Level_3__segmented_scna_minus_germline_cnv_hg19__seg | Analyte Replicate Filter | TCGA-B8-4619-01A-01D-1185-01,TCGA-B8-4619-01A-02D-1322-01 | TCGA-B8-4619-01A-02D-1549-01 |
| TCGA-A3-3383 | snp__genome_wide_snp_6__broad_mit_edu__Level_3__segmented_scna_minus_germline_cnv_hg19__seg | Analyte Replicate Filter | TCGA-A3-3383-01A-01D-0858-01 | TCGA-A3-3383-01A-02D-1322-01 |
| TCGA-AK-3456 | snp__genome_wide_snp_6__broad_mit_edu__Level_3__segmented_scna_minus_germline_cnv_hg19__seg | Analyte Replicate Filter | TCGA-AK-3456-01A-01D-1185-01 | TCGA-AK-3456-01A-02D-1322-01 |
| TCGA-A3-3311 | snp__genome_wide_snp_6__broad_mit_edu__Level_3__segmented_scna_minus_germline_cnv_hg19__seg | Analyte Replicate Filter | TCGA-A3-3311-01A-01D-0858-01 | TCGA-A3-3311-01A-02D-1322-01 |
| TCGA-A3-3322 | snp__genome_wide_snp_6__broad_mit_edu__Level_3__segmented_scna_minus_germline_cnv_hg19__seg | Analyte Replicate Filter | TCGA-A3-3322-01A-01D-0858-01 | TCGA-A3-3322-01A-02D-1322-01 |
| TCGA-BP-4161 | snp__genome_wide_snp_6__broad_mit_edu__Level_3__segmented_scna_minus_germline_cnv_hg19__seg | Analyte Replicate Filter | TCGA-BP-4161-01A-01D-1185-01 | TCGA-BP-4161-01A-02D-1322-01 |
| TCGA-A3-3320 | snp__genome_wide_snp_6__broad_mit_edu__Level_3__segmented_scna_minus_germline_cnv_hg19__seg | Analyte Replicate Filter | TCGA-A3-3320-01A-01D-0858-01 | TCGA-A3-3320-01A-02D-1322-01 |
| TCGA-CJ-4640 | snp__genome_wide_snp_6__broad_mit_edu__Level_3__segmented_scna_minus_germline_cnv_hg19__seg | Analyte Replicate Filter | TCGA-CJ-4640-01A-01D-1185-01 | TCGA-CJ-4640-01A-02D-1322-01 |
| TCGA-A3-3313 | snp__genome_wide_snp_6__broad_mit_edu__Level_3__segmented_scna_minus_germline_cnv_hg19__seg | Analyte Replicate Filter | TCGA-A3-3313-01A-01D-0858-01 | TCGA-A3-3313-01A-02D-1322-01 |
| TCGA-AK-3453 | snp__genome_wide_snp_6__broad_mit_edu__Level_3__segmented_scna_minus_germline_cnv_hg19__seg | Analyte Replicate Filter | TCGA-AK-3453-01A-01D-0858-01 | TCGA-AK-3453-01A-02D-1274-01 |
| TCGA-CJ-4641 | snp__genome_wide_snp_6__broad_mit_edu__Level_3__segmented_scna_minus_germline_cnv_hg19__seg | Analyte Replicate Filter | TCGA-CJ-4641-01A-01D-1185-01 | TCGA-CJ-4641-01A-02D-1322-01 |
| TCGA-B2-4102 | snp__genome_wide_snp_6__broad_mit_edu__Level_3__segmented_scna_minus_germline_cnv_hg19__seg | Analyte Replicate Filter | TCGA-B2-4102-01A-01D-1185-01 | TCGA-B2-4102-01A-02D-1322-01 |
| TCGA-B8-4148 | snp__genome_wide_snp_6__broad_mit_edu__Level_3__segmented_scna_minus_germline_cnv_hg19__seg | Analyte Replicate Filter | TCGA-B8-4148-01A-01D-1185-01 | TCGA-B8-4148-01A-02D-1322-01 |
| TCGA-A3-3362 | snp__genome_wide_snp_6__broad_mit_edu__Level_3__segmented_scna_minus_germline_cnv_hg19__seg | Analyte Replicate Filter | TCGA-A3-3362-01A-01D-1185-01 | TCGA-A3-3362-01A-02D-1322-01 |
| TCGA-A3-3308 | snp__genome_wide_snp_6__broad_mit_edu__Level_3__segmented_scna_minus_germline_cnv_hg19__seg | Analyte Replicate Filter | TCGA-A3-3308-01A-01D-0858-01 | TCGA-A3-3308-01A-02D-1322-01 |
| TCGA-BP-4164 | snp__genome_wide_snp_6__broad_mit_edu__Level_3__segmented_scna_minus_germline_cnv_hg19__seg | Analyte Replicate Filter | TCGA-BP-4164-01A-01D-1185-01 | TCGA-BP-4164-01A-02D-1322-01 |
| TCGA-A3-3372 | snp__genome_wide_snp_6__broad_mit_edu__Level_3__segmented_scna_minus_germline_cnv_hg19__seg | Analyte Replicate Filter | TCGA-A3-3372-01A-01D-0858-01 | TCGA-A3-3372-01A-02D-1322-01 |
| TCGA-AK-3429 | snp__genome_wide_snp_6__broad_mit_edu__Level_3__segmented_scna_minus_germline_cnv_hg19__seg | Analyte Replicate Filter | TCGA-AK-3429-01A-01D-1185-01 | TCGA-AK-3429-01A-02D-1322-01 |
| TCGA-AK-3444 | snp__genome_wide_snp_6__broad_mit_edu__Level_3__segmented_scna_minus_germline_cnv_hg19__seg | Analyte Replicate Filter | TCGA-AK-3444-01A-01D-0858-01 | TCGA-AK-3444-01A-02D-1322-01 |
| TCGA-CJ-4634 | snp__genome_wide_snp_6__broad_mit_edu__Level_3__segmented_scna_minus_germline_cnv_hg19__seg | Analyte Replicate Filter | TCGA-CJ-4634-01A-01D-1185-01 | TCGA-CJ-4634-01A-02D-1322-01 |
| TCGA-AK-3443 | snp__genome_wide_snp_6__broad_mit_edu__Level_3__segmented_scna_minus_germline_cnv_hg19__seg | Analyte Replicate Filter | TCGA-AK-3443-01A-01D-0858-01 | TCGA-AK-3443-01A-02D-1322-01 |
| TCGA-B8-4622 | snp__genome_wide_snp_6__broad_mit_edu__Level_3__segmented_scna_minus_germline_cnv_hg19__seg | Analyte Replicate Filter | TCGA-B8-4622-01A-02D-1274-01 | TCGA-B8-4622-01A-02D-1549-01 |
| TCGA-A3-3378 | snp__genome_wide_snp_6__broad_mit_edu__Level_3__segmented_scna_minus_germline_cnv_hg19__seg | Analyte Replicate Filter | TCGA-A3-3378-01A-01D-0858-01 | TCGA-A3-3378-01A-02D-1322-01 |
| TCGA-CJ-4637 | snp__genome_wide_snp_6__broad_mit_edu__Level_3__segmented_scna_minus_germline_cnv_hg19__seg | Analyte Replicate Filter | TCGA-CJ-4637-01A-01D-1185-01 | TCGA-CJ-4637-01A-02D-1322-01 |
| TCGA-AK-3453 | snp__genome_wide_snp_6__broad_mit_edu__Level_3__segmented_scna_minus_germline_cnv_hg19__seg | Analyte Replicate Filter | TCGA-AK-3453-10A-01D-0858-01 | TCGA-AK-3453-10A-01D-1274-01 |
| TCGA-AK-3426 | snp__genome_wide_snp_6__broad_mit_edu__Level_3__segmented_scna_minus_germline_cnv_hg19__seg | Analyte Replicate Filter | TCGA-AK-3426-01A-01D-1185-01 | TCGA-AK-3426-01A-02D-1322-01 |
| TCGA-B8-4620 | snp__genome_wide_snp_6__broad_mit_edu__Level_3__segmented_scna_minus_germline_cnv_hg19__seg | Analyte Replicate Filter | TCGA-B8-4620-01A-01D-1185-01,TCGA-B8-4620-01A-02D-1322-01 | TCGA-B8-4620-01A-01D-1549-01 |
| TCGA-AK-3444 | mirnaseq__illuminaga_mirnaseq__bcgsc_ca__Level_3__miR_isoform_expression__data | Analyte Replicate Filter | TCGA-AK-3444-01A-01T-0860-13 | TCGA-AK-3444-01A-02R-1324-13 |
| TCGA-A3-3324 | mirnaseq__illuminaga_mirnaseq__bcgsc_ca__Level_3__miR_isoform_expression__data | Analyte Replicate Filter | TCGA-A3-3324-01A-01T-0860-13 | TCGA-A3-3324-01A-02R-1324-13 |
| TCGA-A3-3320 | mirnaseq__illuminaga_mirnaseq__bcgsc_ca__Level_3__miR_isoform_expression__data | Analyte Replicate Filter | TCGA-A3-3320-01A-01T-0860-13 | TCGA-A3-3320-01A-02R-1324-13 |
| TCGA-AK-3443 | mirnaseq__illuminaga_mirnaseq__bcgsc_ca__Level_3__miR_isoform_expression__data | Analyte Replicate Filter | TCGA-AK-3443-01A-01T-0860-13 | TCGA-AK-3443-01A-02R-1324-13 |
| TCGA-A3-3374 | mirnaseq__illuminaga_mirnaseq__bcgsc_ca__Level_3__miR_isoform_expression__data | Analyte Replicate Filter | TCGA-A3-3374-01A-01T-0860-13 | TCGA-A3-3374-01A-02R-1324-13 |
| TCGA-A3-3313 | mirnaseq__illuminaga_mirnaseq__bcgsc_ca__Level_3__miR_isoform_expression__data | Analyte Replicate Filter | TCGA-A3-3313-01A-01T-0860-13 | TCGA-A3-3313-01A-02R-1324-13 |
| TCGA-A3-3382 | mirnaseq__illuminaga_mirnaseq__bcgsc_ca__Level_3__miR_isoform_expression__data | Analyte Replicate Filter | TCGA-A3-3382-01A-01T-0860-13 | TCGA-A3-3382-01A-02R-1324-13 |
| TCGA-AK-3453 | mirnaseq__illuminaga_mirnaseq__bcgsc_ca__Level_3__miR_isoform_expression__data | Analyte Replicate Filter | TCGA-AK-3453-01A-01T-0860-13 | TCGA-AK-3453-01A-02R-1276-13 |
| TCGA-A3-3378 | mirnaseq__illuminaga_mirnaseq__bcgsc_ca__Level_3__miR_isoform_expression__data | Analyte Replicate Filter | TCGA-A3-3378-01A-01T-0860-13 | TCGA-A3-3378-01A-02R-1324-13 |
| TCGA-A3-3319 | mirnaseq__illuminaga_mirnaseq__bcgsc_ca__Level_3__miR_isoform_expression__data | Analyte Replicate Filter | TCGA-A3-3319-01A-01T-0860-13 | TCGA-A3-3319-01A-02R-1324-13 |
| TCGA-A3-3331 | mirnaseq__illuminaga_mirnaseq__bcgsc_ca__Level_3__miR_isoform_expression__data | Analyte Replicate Filter | TCGA-A3-3331-01A-01T-0860-13 | TCGA-A3-3331-01A-02R-1324-13 |
| TCGA-A3-3383 | mirnaseq__illuminaga_mirnaseq__bcgsc_ca__Level_3__miR_isoform_expression__data | Analyte Replicate Filter | TCGA-A3-3383-01A-01T-0860-13 | TCGA-A3-3383-01A-02R-1324-13 |
| TCGA-A3-3308 | mirnaseq__illuminaga_mirnaseq__bcgsc_ca__Level_3__miR_isoform_expression__data | Analyte Replicate Filter | TCGA-A3-3308-01A-01T-0860-13 | TCGA-A3-3308-01A-02R-1324-13 |
| TCGA-A3-3323 | mirnaseq__illuminaga_mirnaseq__bcgsc_ca__Level_3__miR_isoform_expression__data | Analyte Replicate Filter | TCGA-A3-3323-01A-01T-0860-13 | TCGA-A3-3323-01A-02R-1324-13 |
| TCGA-A3-3372 | mirnaseq__illuminaga_mirnaseq__bcgsc_ca__Level_3__miR_isoform_expression__data | Analyte Replicate Filter | TCGA-A3-3372-01A-01T-0860-13 | TCGA-A3-3372-01A-02R-1324-13 |
| TCGA-A3-3311 | mirnaseq__illuminaga_mirnaseq__bcgsc_ca__Level_3__miR_isoform_expression__data | Analyte Replicate Filter | TCGA-A3-3311-01A-01T-0860-13 | TCGA-A3-3311-01A-02R-1324-13 |
| TCGA-A3-3322 | mirnaseq__illuminaga_mirnaseq__bcgsc_ca__Level_3__miR_isoform_expression__data | Analyte Replicate Filter | TCGA-A3-3322-01A-01T-0860-13 | TCGA-A3-3322-01A-02R-1324-13 |
| TCGA-CJ-4639 | snp__genome_wide_snp_6__broad_mit_edu__Level_3__segmented_scna_hg18__seg | Analyte Replicate Filter | TCGA-CJ-4639-01A-01D-1185-01 | TCGA-CJ-4639-01A-02D-1322-01 |
| TCGA-CJ-4636 | snp__genome_wide_snp_6__broad_mit_edu__Level_3__segmented_scna_hg18__seg | Analyte Replicate Filter | TCGA-CJ-4636-01A-01D-1185-01 | TCGA-CJ-4636-01A-02D-1322-01 |
| TCGA-A3-3331 | snp__genome_wide_snp_6__broad_mit_edu__Level_3__segmented_scna_hg18__seg | Analyte Replicate Filter | TCGA-A3-3331-01A-01D-0858-01 | TCGA-A3-3331-01A-02D-1322-01 |
| TCGA-A3-3324 | snp__genome_wide_snp_6__broad_mit_edu__Level_3__segmented_scna_hg18__seg | Analyte Replicate Filter | TCGA-A3-3324-01A-01D-0858-01 | TCGA-A3-3324-01A-02D-1322-01 |
| TCGA-A3-3351 | snp__genome_wide_snp_6__broad_mit_edu__Level_3__segmented_scna_hg18__seg | Analyte Replicate Filter | TCGA-A3-3351-01A-01D-1185-01 | TCGA-A3-3351-01A-02D-1322-01 |
| TCGA-BP-4163 | snp__genome_wide_snp_6__broad_mit_edu__Level_3__segmented_scna_hg18__seg | Analyte Replicate Filter | TCGA-BP-4163-01A-01D-1185-01 | TCGA-BP-4163-01A-02D-1322-01 |
| TCGA-A3-3317 | snp__genome_wide_snp_6__broad_mit_edu__Level_3__segmented_scna_hg18__seg | Analyte Replicate Filter | TCGA-A3-3317-01A-01D-0858-01 | TCGA-A3-3317-01A-02D-1322-01 |
| TCGA-AK-3465 | snp__genome_wide_snp_6__broad_mit_edu__Level_3__segmented_scna_hg18__seg | Analyte Replicate Filter | TCGA-AK-3465-01A-01D-0858-01 | TCGA-AK-3465-01A-02D-1322-01 |
| TCGA-AK-3436 | snp__genome_wide_snp_6__broad_mit_edu__Level_3__segmented_scna_hg18__seg | Analyte Replicate Filter | TCGA-AK-3436-01A-01D-1185-01 | TCGA-AK-3436-01A-02D-1322-01 |
| TCGA-BP-4162 | snp__genome_wide_snp_6__broad_mit_edu__Level_3__segmented_scna_hg18__seg | Analyte Replicate Filter | TCGA-BP-4162-01A-01D-1185-01 | TCGA-BP-4162-01A-02D-1322-01 |
| TCGA-BP-4167 | snp__genome_wide_snp_6__broad_mit_edu__Level_3__segmented_scna_hg18__seg | Analyte Replicate Filter | TCGA-BP-4167-01A-01D-1185-01 | TCGA-BP-4167-01A-02D-1322-01 |
| TCGA-B2-3923 | snp__genome_wide_snp_6__broad_mit_edu__Level_3__segmented_scna_hg18__seg | Analyte Replicate Filter | TCGA-B2-3923-01A-01D-1185-01 | TCGA-B2-3923-01A-02D-1322-01 |
| TCGA-CJ-4638 | snp__genome_wide_snp_6__broad_mit_edu__Level_3__segmented_scna_hg18__seg | Analyte Replicate Filter | TCGA-CJ-4638-01A-01D-1185-01 | TCGA-CJ-4638-01A-02D-1322-01 |
| TCGA-A3-3347 | snp__genome_wide_snp_6__broad_mit_edu__Level_3__segmented_scna_hg18__seg | Analyte Replicate Filter | TCGA-A3-3347-01A-01D-1185-01 | TCGA-A3-3347-01A-02D-1322-01 |
| TCGA-AK-3440 | snp__genome_wide_snp_6__broad_mit_edu__Level_3__segmented_scna_hg18__seg | Analyte Replicate Filter | TCGA-AK-3440-01A-01D-0858-01 | TCGA-AK-3440-01A-02D-1274-01 |
| TCGA-CJ-4644 | snp__genome_wide_snp_6__broad_mit_edu__Level_3__segmented_scna_hg18__seg | Analyte Replicate Filter | TCGA-CJ-4644-01A-01D-1185-01 | TCGA-CJ-4644-01A-02D-1322-01 |
| TCGA-A3-3319 | snp__genome_wide_snp_6__broad_mit_edu__Level_3__segmented_scna_hg18__seg | Analyte Replicate Filter | TCGA-A3-3319-01A-01D-0858-01 | TCGA-A3-3319-01A-02D-1322-01 |
| TCGA-CJ-4643 | snp__genome_wide_snp_6__broad_mit_edu__Level_3__segmented_scna_hg18__seg | Analyte Replicate Filter | TCGA-CJ-4643-01A-01D-1185-01 | TCGA-CJ-4643-01A-02D-1322-01 |
| TCGA-B8-4619 | snp__genome_wide_snp_6__broad_mit_edu__Level_3__segmented_scna_hg18__seg | Analyte Replicate Filter | TCGA-B8-4619-01A-01D-1185-01,TCGA-B8-4619-01A-02D-1322-01 | TCGA-B8-4619-01A-02D-1549-01 |
| TCGA-A3-3383 | snp__genome_wide_snp_6__broad_mit_edu__Level_3__segmented_scna_hg18__seg | Analyte Replicate Filter | TCGA-A3-3383-01A-01D-0858-01 | TCGA-A3-3383-01A-02D-1322-01 |
| TCGA-AK-3456 | snp__genome_wide_snp_6__broad_mit_edu__Level_3__segmented_scna_hg18__seg | Analyte Replicate Filter | TCGA-AK-3456-01A-01D-1185-01 | TCGA-AK-3456-01A-02D-1322-01 |
| TCGA-A3-3311 | snp__genome_wide_snp_6__broad_mit_edu__Level_3__segmented_scna_hg18__seg | Analyte Replicate Filter | TCGA-A3-3311-01A-01D-0858-01 | TCGA-A3-3311-01A-02D-1322-01 |
| TCGA-A3-3322 | snp__genome_wide_snp_6__broad_mit_edu__Level_3__segmented_scna_hg18__seg | Analyte Replicate Filter | TCGA-A3-3322-01A-01D-0858-01 | TCGA-A3-3322-01A-02D-1322-01 |
| TCGA-BP-4161 | snp__genome_wide_snp_6__broad_mit_edu__Level_3__segmented_scna_hg18__seg | Analyte Replicate Filter | TCGA-BP-4161-01A-01D-1185-01 | TCGA-BP-4161-01A-02D-1322-01 |
| TCGA-A3-3320 | snp__genome_wide_snp_6__broad_mit_edu__Level_3__segmented_scna_hg18__seg | Analyte Replicate Filter | TCGA-A3-3320-01A-01D-0858-01 | TCGA-A3-3320-01A-02D-1322-01 |
| TCGA-CJ-4640 | snp__genome_wide_snp_6__broad_mit_edu__Level_3__segmented_scna_hg18__seg | Analyte Replicate Filter | TCGA-CJ-4640-01A-01D-1185-01 | TCGA-CJ-4640-01A-02D-1322-01 |
| TCGA-A3-3313 | snp__genome_wide_snp_6__broad_mit_edu__Level_3__segmented_scna_hg18__seg | Analyte Replicate Filter | TCGA-A3-3313-01A-01D-0858-01 | TCGA-A3-3313-01A-02D-1322-01 |
| TCGA-AK-3453 | snp__genome_wide_snp_6__broad_mit_edu__Level_3__segmented_scna_hg18__seg | Analyte Replicate Filter | TCGA-AK-3453-01A-01D-0858-01 | TCGA-AK-3453-01A-02D-1274-01 |
| TCGA-CJ-4641 | snp__genome_wide_snp_6__broad_mit_edu__Level_3__segmented_scna_hg18__seg | Analyte Replicate Filter | TCGA-CJ-4641-01A-01D-1185-01 | TCGA-CJ-4641-01A-02D-1322-01 |
| TCGA-B2-4102 | snp__genome_wide_snp_6__broad_mit_edu__Level_3__segmented_scna_hg18__seg | Analyte Replicate Filter | TCGA-B2-4102-01A-01D-1185-01 | TCGA-B2-4102-01A-02D-1322-01 |
| TCGA-B8-4148 | snp__genome_wide_snp_6__broad_mit_edu__Level_3__segmented_scna_hg18__seg | Analyte Replicate Filter | TCGA-B8-4148-01A-01D-1185-01 | TCGA-B8-4148-01A-02D-1322-01 |
| TCGA-A3-3362 | snp__genome_wide_snp_6__broad_mit_edu__Level_3__segmented_scna_hg18__seg | Analyte Replicate Filter | TCGA-A3-3362-01A-01D-1185-01 | TCGA-A3-3362-01A-02D-1322-01 |
| TCGA-A3-3308 | snp__genome_wide_snp_6__broad_mit_edu__Level_3__segmented_scna_hg18__seg | Analyte Replicate Filter | TCGA-A3-3308-01A-01D-0858-01 | TCGA-A3-3308-01A-02D-1322-01 |
| TCGA-BP-4164 | snp__genome_wide_snp_6__broad_mit_edu__Level_3__segmented_scna_hg18__seg | Analyte Replicate Filter | TCGA-BP-4164-01A-01D-1185-01 | TCGA-BP-4164-01A-02D-1322-01 |
| TCGA-A3-3372 | snp__genome_wide_snp_6__broad_mit_edu__Level_3__segmented_scna_hg18__seg | Analyte Replicate Filter | TCGA-A3-3372-01A-01D-0858-01 | TCGA-A3-3372-01A-02D-1322-01 |
| TCGA-AK-3429 | snp__genome_wide_snp_6__broad_mit_edu__Level_3__segmented_scna_hg18__seg | Analyte Replicate Filter | TCGA-AK-3429-01A-01D-1185-01 | TCGA-AK-3429-01A-02D-1322-01 |
| TCGA-AK-3444 | snp__genome_wide_snp_6__broad_mit_edu__Level_3__segmented_scna_hg18__seg | Analyte Replicate Filter | TCGA-AK-3444-01A-01D-0858-01 | TCGA-AK-3444-01A-02D-1322-01 |
| TCGA-CJ-4634 | snp__genome_wide_snp_6__broad_mit_edu__Level_3__segmented_scna_hg18__seg | Analyte Replicate Filter | TCGA-CJ-4634-01A-01D-1185-01 | TCGA-CJ-4634-01A-02D-1322-01 |
| TCGA-AK-3443 | snp__genome_wide_snp_6__broad_mit_edu__Level_3__segmented_scna_hg18__seg | Analyte Replicate Filter | TCGA-AK-3443-01A-01D-0858-01 | TCGA-AK-3443-01A-02D-1322-01 |
| TCGA-B8-4622 | snp__genome_wide_snp_6__broad_mit_edu__Level_3__segmented_scna_hg18__seg | Analyte Replicate Filter | TCGA-B8-4622-01A-02D-1274-01 | TCGA-B8-4622-01A-02D-1549-01 |
| TCGA-A3-3378 | snp__genome_wide_snp_6__broad_mit_edu__Level_3__segmented_scna_hg18__seg | Analyte Replicate Filter | TCGA-A3-3378-01A-01D-0858-01 | TCGA-A3-3378-01A-02D-1322-01 |
| TCGA-CJ-4637 | snp__genome_wide_snp_6__broad_mit_edu__Level_3__segmented_scna_hg18__seg | Analyte Replicate Filter | TCGA-CJ-4637-01A-01D-1185-01 | TCGA-CJ-4637-01A-02D-1322-01 |
| TCGA-AK-3453 | snp__genome_wide_snp_6__broad_mit_edu__Level_3__segmented_scna_hg18__seg | Analyte Replicate Filter | TCGA-AK-3453-10A-01D-0858-01 | TCGA-AK-3453-10A-01D-1274-01 |
| TCGA-AK-3426 | snp__genome_wide_snp_6__broad_mit_edu__Level_3__segmented_scna_hg18__seg | Analyte Replicate Filter | TCGA-AK-3426-01A-01D-1185-01 | TCGA-AK-3426-01A-02D-1322-01 |
| TCGA-B8-4620 | snp__genome_wide_snp_6__broad_mit_edu__Level_3__segmented_scna_hg18__seg | Analyte Replicate Filter | TCGA-B8-4620-01A-01D-1185-01,TCGA-B8-4620-01A-02D-1322-01 | TCGA-B8-4620-01A-01D-1549-01 |
| TCGA-CJ-4639 | snp__genome_wide_snp_6__broad_mit_edu__Level_2__tangent_copynumber__data | Analyte Replicate Filter | TCGA-CJ-4639-01A-01D-1185-01 | TCGA-CJ-4639-01A-02D-1322-01 |
| TCGA-CJ-4636 | snp__genome_wide_snp_6__broad_mit_edu__Level_2__tangent_copynumber__data | Analyte Replicate Filter | TCGA-CJ-4636-01A-01D-1185-01 | TCGA-CJ-4636-01A-02D-1322-01 |
| TCGA-A3-3331 | snp__genome_wide_snp_6__broad_mit_edu__Level_2__tangent_copynumber__data | Analyte Replicate Filter | TCGA-A3-3331-01A-01D-0858-01 | TCGA-A3-3331-01A-02D-1322-01 |
| TCGA-A3-3324 | snp__genome_wide_snp_6__broad_mit_edu__Level_2__tangent_copynumber__data | Analyte Replicate Filter | TCGA-A3-3324-01A-01D-0858-01 | TCGA-A3-3324-01A-02D-1322-01 |
| TCGA-A3-3351 | snp__genome_wide_snp_6__broad_mit_edu__Level_2__tangent_copynumber__data | Analyte Replicate Filter | TCGA-A3-3351-01A-01D-1185-01 | TCGA-A3-3351-01A-02D-1322-01 |
| TCGA-BP-4163 | snp__genome_wide_snp_6__broad_mit_edu__Level_2__tangent_copynumber__data | Analyte Replicate Filter | TCGA-BP-4163-01A-01D-1185-01 | TCGA-BP-4163-01A-02D-1322-01 |
| TCGA-A3-3317 | snp__genome_wide_snp_6__broad_mit_edu__Level_2__tangent_copynumber__data | Analyte Replicate Filter | TCGA-A3-3317-01A-01D-0858-01 | TCGA-A3-3317-01A-02D-1322-01 |
| TCGA-AK-3465 | snp__genome_wide_snp_6__broad_mit_edu__Level_2__tangent_copynumber__data | Analyte Replicate Filter | TCGA-AK-3465-01A-01D-0858-01 | TCGA-AK-3465-01A-02D-1322-01 |
| TCGA-AK-3436 | snp__genome_wide_snp_6__broad_mit_edu__Level_2__tangent_copynumber__data | Analyte Replicate Filter | TCGA-AK-3436-01A-01D-1185-01 | TCGA-AK-3436-01A-02D-1322-01 |
| TCGA-BP-4162 | snp__genome_wide_snp_6__broad_mit_edu__Level_2__tangent_copynumber__data | Analyte Replicate Filter | TCGA-BP-4162-01A-01D-1185-01 | TCGA-BP-4162-01A-02D-1322-01 |
| TCGA-BP-4167 | snp__genome_wide_snp_6__broad_mit_edu__Level_2__tangent_copynumber__data | Analyte Replicate Filter | TCGA-BP-4167-01A-01D-1185-01 | TCGA-BP-4167-01A-02D-1322-01 |
| TCGA-B2-3923 | snp__genome_wide_snp_6__broad_mit_edu__Level_2__tangent_copynumber__data | Analyte Replicate Filter | TCGA-B2-3923-01A-01D-1185-01 | TCGA-B2-3923-01A-02D-1322-01 |
| TCGA-CJ-4638 | snp__genome_wide_snp_6__broad_mit_edu__Level_2__tangent_copynumber__data | Analyte Replicate Filter | TCGA-CJ-4638-01A-01D-1185-01 | TCGA-CJ-4638-01A-02D-1322-01 |
| TCGA-A3-3347 | snp__genome_wide_snp_6__broad_mit_edu__Level_2__tangent_copynumber__data | Analyte Replicate Filter | TCGA-A3-3347-01A-01D-1185-01 | TCGA-A3-3347-01A-02D-1322-01 |
| TCGA-AK-3440 | snp__genome_wide_snp_6__broad_mit_edu__Level_2__tangent_copynumber__data | Analyte Replicate Filter | TCGA-AK-3440-01A-01D-0858-01 | TCGA-AK-3440-01A-02D-1274-01 |
| TCGA-CJ-4644 | snp__genome_wide_snp_6__broad_mit_edu__Level_2__tangent_copynumber__data | Analyte Replicate Filter | TCGA-CJ-4644-01A-01D-1185-01 | TCGA-CJ-4644-01A-02D-1322-01 |
| TCGA-A3-3319 | snp__genome_wide_snp_6__broad_mit_edu__Level_2__tangent_copynumber__data | Analyte Replicate Filter | TCGA-A3-3319-01A-01D-0858-01 | TCGA-A3-3319-01A-02D-1322-01 |
| TCGA-CJ-4643 | snp__genome_wide_snp_6__broad_mit_edu__Level_2__tangent_copynumber__data | Analyte Replicate Filter | TCGA-CJ-4643-01A-01D-1185-01 | TCGA-CJ-4643-01A-02D-1322-01 |
| TCGA-B8-4619 | snp__genome_wide_snp_6__broad_mit_edu__Level_2__tangent_copynumber__data | Analyte Replicate Filter | TCGA-B8-4619-01A-01D-1185-01,TCGA-B8-4619-01A-02D-1322-01 | TCGA-B8-4619-01A-02D-1549-01 |
| TCGA-A3-3383 | snp__genome_wide_snp_6__broad_mit_edu__Level_2__tangent_copynumber__data | Analyte Replicate Filter | TCGA-A3-3383-01A-01D-0858-01 | TCGA-A3-3383-01A-02D-1322-01 |
| TCGA-AK-3456 | snp__genome_wide_snp_6__broad_mit_edu__Level_2__tangent_copynumber__data | Analyte Replicate Filter | TCGA-AK-3456-01A-01D-1185-01 | TCGA-AK-3456-01A-02D-1322-01 |
| TCGA-A3-3311 | snp__genome_wide_snp_6__broad_mit_edu__Level_2__tangent_copynumber__data | Analyte Replicate Filter | TCGA-A3-3311-01A-01D-0858-01 | TCGA-A3-3311-01A-02D-1322-01 |
| TCGA-A3-3322 | snp__genome_wide_snp_6__broad_mit_edu__Level_2__tangent_copynumber__data | Analyte Replicate Filter | TCGA-A3-3322-01A-01D-0858-01 | TCGA-A3-3322-01A-02D-1322-01 |
| TCGA-BP-4161 | snp__genome_wide_snp_6__broad_mit_edu__Level_2__tangent_copynumber__data | Analyte Replicate Filter | TCGA-BP-4161-01A-01D-1185-01 | TCGA-BP-4161-01A-02D-1322-01 |
| TCGA-A3-3320 | snp__genome_wide_snp_6__broad_mit_edu__Level_2__tangent_copynumber__data | Analyte Replicate Filter | TCGA-A3-3320-01A-01D-0858-01 | TCGA-A3-3320-01A-02D-1322-01 |
| TCGA-CJ-4640 | snp__genome_wide_snp_6__broad_mit_edu__Level_2__tangent_copynumber__data | Analyte Replicate Filter | TCGA-CJ-4640-01A-01D-1185-01 | TCGA-CJ-4640-01A-02D-1322-01 |
| TCGA-A3-3313 | snp__genome_wide_snp_6__broad_mit_edu__Level_2__tangent_copynumber__data | Analyte Replicate Filter | TCGA-A3-3313-01A-01D-0858-01 | TCGA-A3-3313-01A-02D-1322-01 |
| TCGA-AK-3453 | snp__genome_wide_snp_6__broad_mit_edu__Level_2__tangent_copynumber__data | Analyte Replicate Filter | TCGA-AK-3453-01A-01D-0858-01 | TCGA-AK-3453-01A-02D-1274-01 |
| TCGA-CJ-4641 | snp__genome_wide_snp_6__broad_mit_edu__Level_2__tangent_copynumber__data | Analyte Replicate Filter | TCGA-CJ-4641-01A-01D-1185-01 | TCGA-CJ-4641-01A-02D-1322-01 |
| TCGA-B2-4102 | snp__genome_wide_snp_6__broad_mit_edu__Level_2__tangent_copynumber__data | Analyte Replicate Filter | TCGA-B2-4102-01A-01D-1185-01 | TCGA-B2-4102-01A-02D-1322-01 |
| TCGA-B8-4148 | snp__genome_wide_snp_6__broad_mit_edu__Level_2__tangent_copynumber__data | Analyte Replicate Filter | TCGA-B8-4148-01A-01D-1185-01 | TCGA-B8-4148-01A-02D-1322-01 |
| TCGA-A3-3362 | snp__genome_wide_snp_6__broad_mit_edu__Level_2__tangent_copynumber__data | Analyte Replicate Filter | TCGA-A3-3362-01A-01D-1185-01 | TCGA-A3-3362-01A-02D-1322-01 |
| TCGA-A3-3308 | snp__genome_wide_snp_6__broad_mit_edu__Level_2__tangent_copynumber__data | Analyte Replicate Filter | TCGA-A3-3308-01A-01D-0858-01 | TCGA-A3-3308-01A-02D-1322-01 |
| TCGA-BP-4164 | snp__genome_wide_snp_6__broad_mit_edu__Level_2__tangent_copynumber__data | Analyte Replicate Filter | TCGA-BP-4164-01A-01D-1185-01 | TCGA-BP-4164-01A-02D-1322-01 |
| TCGA-A3-3372 | snp__genome_wide_snp_6__broad_mit_edu__Level_2__tangent_copynumber__data | Analyte Replicate Filter | TCGA-A3-3372-01A-01D-0858-01 | TCGA-A3-3372-01A-02D-1322-01 |
| TCGA-AK-3429 | snp__genome_wide_snp_6__broad_mit_edu__Level_2__tangent_copynumber__data | Analyte Replicate Filter | TCGA-AK-3429-01A-01D-1185-01 | TCGA-AK-3429-01A-02D-1322-01 |
| TCGA-AK-3444 | snp__genome_wide_snp_6__broad_mit_edu__Level_2__tangent_copynumber__data | Analyte Replicate Filter | TCGA-AK-3444-01A-01D-0858-01 | TCGA-AK-3444-01A-02D-1322-01 |
| TCGA-CJ-4634 | snp__genome_wide_snp_6__broad_mit_edu__Level_2__tangent_copynumber__data | Analyte Replicate Filter | TCGA-CJ-4634-01A-01D-1185-01 | TCGA-CJ-4634-01A-02D-1322-01 |
| TCGA-AK-3443 | snp__genome_wide_snp_6__broad_mit_edu__Level_2__tangent_copynumber__data | Analyte Replicate Filter | TCGA-AK-3443-01A-01D-0858-01 | TCGA-AK-3443-01A-02D-1322-01 |
| TCGA-B8-4622 | snp__genome_wide_snp_6__broad_mit_edu__Level_2__tangent_copynumber__data | Analyte Replicate Filter | TCGA-B8-4622-01A-02D-1274-01 | TCGA-B8-4622-01A-02D-1549-01 |
| TCGA-A3-3378 | snp__genome_wide_snp_6__broad_mit_edu__Level_2__tangent_copynumber__data | Analyte Replicate Filter | TCGA-A3-3378-01A-01D-0858-01 | TCGA-A3-3378-01A-02D-1322-01 |
| TCGA-CJ-4637 | snp__genome_wide_snp_6__broad_mit_edu__Level_2__tangent_copynumber__data | Analyte Replicate Filter | TCGA-CJ-4637-01A-01D-1185-01 | TCGA-CJ-4637-01A-02D-1322-01 |
| TCGA-AK-3453 | snp__genome_wide_snp_6__broad_mit_edu__Level_2__tangent_copynumber__data | Analyte Replicate Filter | TCGA-AK-3453-10A-01D-0858-01 | TCGA-AK-3453-10A-01D-1274-01 |
| TCGA-AK-3426 | snp__genome_wide_snp_6__broad_mit_edu__Level_2__tangent_copynumber__data | Analyte Replicate Filter | TCGA-AK-3426-01A-01D-1185-01 | TCGA-AK-3426-01A-02D-1322-01 |
| TCGA-B8-4620 | snp__genome_wide_snp_6__broad_mit_edu__Level_2__tangent_copynumber__data | Analyte Replicate Filter | TCGA-B8-4620-01A-01D-1185-01,TCGA-B8-4620-01A-02D-1322-01 | TCGA-B8-4620-01A-01D-1549-01 |
| TCGA-AK-3444 | mirnaseq__illuminaga_mirnaseq__bcgsc_ca__Level_3__miR_gene_expression__data | Analyte Replicate Filter | TCGA-AK-3444-01A-01T-0860-13 | TCGA-AK-3444-01A-02R-1324-13 |
| TCGA-A3-3324 | mirnaseq__illuminaga_mirnaseq__bcgsc_ca__Level_3__miR_gene_expression__data | Analyte Replicate Filter | TCGA-A3-3324-01A-01T-0860-13 | TCGA-A3-3324-01A-02R-1324-13 |
| TCGA-A3-3320 | mirnaseq__illuminaga_mirnaseq__bcgsc_ca__Level_3__miR_gene_expression__data | Analyte Replicate Filter | TCGA-A3-3320-01A-01T-0860-13 | TCGA-A3-3320-01A-02R-1324-13 |
| TCGA-AK-3443 | mirnaseq__illuminaga_mirnaseq__bcgsc_ca__Level_3__miR_gene_expression__data | Analyte Replicate Filter | TCGA-AK-3443-01A-01T-0860-13 | TCGA-AK-3443-01A-02R-1324-13 |
| TCGA-A3-3374 | mirnaseq__illuminaga_mirnaseq__bcgsc_ca__Level_3__miR_gene_expression__data | Analyte Replicate Filter | TCGA-A3-3374-01A-01T-0860-13 | TCGA-A3-3374-01A-02R-1324-13 |
| TCGA-A3-3313 | mirnaseq__illuminaga_mirnaseq__bcgsc_ca__Level_3__miR_gene_expression__data | Analyte Replicate Filter | TCGA-A3-3313-01A-01T-0860-13 | TCGA-A3-3313-01A-02R-1324-13 |
| TCGA-A3-3382 | mirnaseq__illuminaga_mirnaseq__bcgsc_ca__Level_3__miR_gene_expression__data | Analyte Replicate Filter | TCGA-A3-3382-01A-01T-0860-13 | TCGA-A3-3382-01A-02R-1324-13 |
| TCGA-AK-3453 | mirnaseq__illuminaga_mirnaseq__bcgsc_ca__Level_3__miR_gene_expression__data | Analyte Replicate Filter | TCGA-AK-3453-01A-01T-0860-13 | TCGA-AK-3453-01A-02R-1276-13 |
| TCGA-A3-3378 | mirnaseq__illuminaga_mirnaseq__bcgsc_ca__Level_3__miR_gene_expression__data | Analyte Replicate Filter | TCGA-A3-3378-01A-01T-0860-13 | TCGA-A3-3378-01A-02R-1324-13 |
| TCGA-A3-3319 | mirnaseq__illuminaga_mirnaseq__bcgsc_ca__Level_3__miR_gene_expression__data | Analyte Replicate Filter | TCGA-A3-3319-01A-01T-0860-13 | TCGA-A3-3319-01A-02R-1324-13 |
| TCGA-A3-3331 | mirnaseq__illuminaga_mirnaseq__bcgsc_ca__Level_3__miR_gene_expression__data | Analyte Replicate Filter | TCGA-A3-3331-01A-01T-0860-13 | TCGA-A3-3331-01A-02R-1324-13 |
| TCGA-A3-3383 | mirnaseq__illuminaga_mirnaseq__bcgsc_ca__Level_3__miR_gene_expression__data | Analyte Replicate Filter | TCGA-A3-3383-01A-01T-0860-13 | TCGA-A3-3383-01A-02R-1324-13 |
| TCGA-A3-3308 | mirnaseq__illuminaga_mirnaseq__bcgsc_ca__Level_3__miR_gene_expression__data | Analyte Replicate Filter | TCGA-A3-3308-01A-01T-0860-13 | TCGA-A3-3308-01A-02R-1324-13 |
| TCGA-A3-3323 | mirnaseq__illuminaga_mirnaseq__bcgsc_ca__Level_3__miR_gene_expression__data | Analyte Replicate Filter | TCGA-A3-3323-01A-01T-0860-13 | TCGA-A3-3323-01A-02R-1324-13 |
| TCGA-A3-3372 | mirnaseq__illuminaga_mirnaseq__bcgsc_ca__Level_3__miR_gene_expression__data | Analyte Replicate Filter | TCGA-A3-3372-01A-01T-0860-13 | TCGA-A3-3372-01A-02R-1324-13 |
| TCGA-A3-3311 | mirnaseq__illuminaga_mirnaseq__bcgsc_ca__Level_3__miR_gene_expression__data | Analyte Replicate Filter | TCGA-A3-3311-01A-01T-0860-13 | TCGA-A3-3311-01A-02R-1324-13 |
| TCGA-A3-3322 | mirnaseq__illuminaga_mirnaseq__bcgsc_ca__Level_3__miR_gene_expression__data | Analyte Replicate Filter | TCGA-A3-3322-01A-01T-0860-13 | TCGA-A3-3322-01A-02R-1324-13 |
| TCGA-CJ-4639 | snp__genome_wide_snp_6__broad_mit_edu__Level_2__raw_copynumber__data | Analyte Replicate Filter | TCGA-CJ-4639-01A-01D-1185-01 | TCGA-CJ-4639-01A-02D-1322-01 |
| TCGA-CJ-4636 | snp__genome_wide_snp_6__broad_mit_edu__Level_2__raw_copynumber__data | Analyte Replicate Filter | TCGA-CJ-4636-01A-01D-1185-01 | TCGA-CJ-4636-01A-02D-1322-01 |
| TCGA-A3-3331 | snp__genome_wide_snp_6__broad_mit_edu__Level_2__raw_copynumber__data | Analyte Replicate Filter | TCGA-A3-3331-01A-01D-0858-01 | TCGA-A3-3331-01A-02D-1322-01 |
| TCGA-A3-3324 | snp__genome_wide_snp_6__broad_mit_edu__Level_2__raw_copynumber__data | Analyte Replicate Filter | TCGA-A3-3324-01A-01D-0858-01 | TCGA-A3-3324-01A-02D-1322-01 |
| TCGA-A3-3351 | snp__genome_wide_snp_6__broad_mit_edu__Level_2__raw_copynumber__data | Analyte Replicate Filter | TCGA-A3-3351-01A-01D-1185-01 | TCGA-A3-3351-01A-02D-1322-01 |
| TCGA-BP-4163 | snp__genome_wide_snp_6__broad_mit_edu__Level_2__raw_copynumber__data | Analyte Replicate Filter | TCGA-BP-4163-01A-01D-1185-01 | TCGA-BP-4163-01A-02D-1322-01 |
| TCGA-A3-3317 | snp__genome_wide_snp_6__broad_mit_edu__Level_2__raw_copynumber__data | Analyte Replicate Filter | TCGA-A3-3317-01A-01D-0858-01 | TCGA-A3-3317-01A-02D-1322-01 |
| TCGA-AK-3465 | snp__genome_wide_snp_6__broad_mit_edu__Level_2__raw_copynumber__data | Analyte Replicate Filter | TCGA-AK-3465-01A-01D-0858-01 | TCGA-AK-3465-01A-02D-1322-01 |
| TCGA-AK-3436 | snp__genome_wide_snp_6__broad_mit_edu__Level_2__raw_copynumber__data | Analyte Replicate Filter | TCGA-AK-3436-01A-01D-1185-01 | TCGA-AK-3436-01A-02D-1322-01 |
| TCGA-BP-4162 | snp__genome_wide_snp_6__broad_mit_edu__Level_2__raw_copynumber__data | Analyte Replicate Filter | TCGA-BP-4162-01A-01D-1185-01 | TCGA-BP-4162-01A-02D-1322-01 |
| TCGA-BP-4167 | snp__genome_wide_snp_6__broad_mit_edu__Level_2__raw_copynumber__data | Analyte Replicate Filter | TCGA-BP-4167-01A-01D-1185-01 | TCGA-BP-4167-01A-02D-1322-01 |
| TCGA-B2-3923 | snp__genome_wide_snp_6__broad_mit_edu__Level_2__raw_copynumber__data | Analyte Replicate Filter | TCGA-B2-3923-01A-01D-1185-01 | TCGA-B2-3923-01A-02D-1322-01 |
| TCGA-CJ-4638 | snp__genome_wide_snp_6__broad_mit_edu__Level_2__raw_copynumber__data | Analyte Replicate Filter | TCGA-CJ-4638-01A-01D-1185-01 | TCGA-CJ-4638-01A-02D-1322-01 |
| TCGA-A3-3347 | snp__genome_wide_snp_6__broad_mit_edu__Level_2__raw_copynumber__data | Analyte Replicate Filter | TCGA-A3-3347-01A-01D-1185-01 | TCGA-A3-3347-01A-02D-1322-01 |
| TCGA-AK-3440 | snp__genome_wide_snp_6__broad_mit_edu__Level_2__raw_copynumber__data | Analyte Replicate Filter | TCGA-AK-3440-01A-01D-0858-01 | TCGA-AK-3440-01A-02D-1274-01 |
| TCGA-CJ-4644 | snp__genome_wide_snp_6__broad_mit_edu__Level_2__raw_copynumber__data | Analyte Replicate Filter | TCGA-CJ-4644-01A-01D-1185-01 | TCGA-CJ-4644-01A-02D-1322-01 |
| TCGA-B2-5633 | snp__genome_wide_snp_6__broad_mit_edu__Level_2__raw_copynumber__data | Analyte Replicate Filter | TCGA-B2-5633-01A-01D-1530-01 | TCGA-B2-5633-01B-04D-A274-01 |
| TCGA-A3-3319 | snp__genome_wide_snp_6__broad_mit_edu__Level_2__raw_copynumber__data | Analyte Replicate Filter | TCGA-A3-3319-01A-01D-0858-01 | TCGA-A3-3319-01A-02D-1322-01 |
| TCGA-CJ-4643 | snp__genome_wide_snp_6__broad_mit_edu__Level_2__raw_copynumber__data | Analyte Replicate Filter | TCGA-CJ-4643-01A-01D-1185-01 | TCGA-CJ-4643-01A-02D-1322-01 |
| TCGA-B8-4619 | snp__genome_wide_snp_6__broad_mit_edu__Level_2__raw_copynumber__data | Analyte Replicate Filter | TCGA-B8-4619-01A-01D-1185-01,TCGA-B8-4619-01A-02D-1322-01 | TCGA-B8-4619-01A-02D-1549-01 |
| TCGA-A3-3383 | snp__genome_wide_snp_6__broad_mit_edu__Level_2__raw_copynumber__data | Analyte Replicate Filter | TCGA-A3-3383-01A-01D-0858-01 | TCGA-A3-3383-01A-02D-1322-01 |
| TCGA-AK-3456 | snp__genome_wide_snp_6__broad_mit_edu__Level_2__raw_copynumber__data | Analyte Replicate Filter | TCGA-AK-3456-01A-01D-1185-01 | TCGA-AK-3456-01A-02D-1322-01 |
| TCGA-A3-3311 | snp__genome_wide_snp_6__broad_mit_edu__Level_2__raw_copynumber__data | Analyte Replicate Filter | TCGA-A3-3311-01A-01D-0858-01 | TCGA-A3-3311-01A-02D-1322-01 |
| TCGA-A3-3322 | snp__genome_wide_snp_6__broad_mit_edu__Level_2__raw_copynumber__data | Analyte Replicate Filter | TCGA-A3-3322-01A-01D-0858-01 | TCGA-A3-3322-01A-02D-1322-01 |
| TCGA-BP-4161 | snp__genome_wide_snp_6__broad_mit_edu__Level_2__raw_copynumber__data | Analyte Replicate Filter | TCGA-BP-4161-01A-01D-1185-01 | TCGA-BP-4161-01A-02D-1322-01 |
| TCGA-A3-3320 | snp__genome_wide_snp_6__broad_mit_edu__Level_2__raw_copynumber__data | Analyte Replicate Filter | TCGA-A3-3320-01A-01D-0858-01 | TCGA-A3-3320-01A-02D-1322-01 |
| TCGA-B2-3924 | snp__genome_wide_snp_6__broad_mit_edu__Level_2__raw_copynumber__data | Analyte Replicate Filter | TCGA-B2-3924-01A-01D-1185-01 | TCGA-B2-3924-01B-03D-A274-01 |
| TCGA-CJ-4640 | snp__genome_wide_snp_6__broad_mit_edu__Level_2__raw_copynumber__data | Analyte Replicate Filter | TCGA-CJ-4640-01A-01D-1185-01 | TCGA-CJ-4640-01A-02D-1322-01 |
| TCGA-A3-3313 | snp__genome_wide_snp_6__broad_mit_edu__Level_2__raw_copynumber__data | Analyte Replicate Filter | TCGA-A3-3313-01A-01D-0858-01 | TCGA-A3-3313-01A-02D-1322-01 |
| TCGA-AK-3453 | snp__genome_wide_snp_6__broad_mit_edu__Level_2__raw_copynumber__data | Analyte Replicate Filter | TCGA-AK-3453-01A-01D-0858-01 | TCGA-AK-3453-01A-02D-1274-01 |
| TCGA-CJ-4641 | snp__genome_wide_snp_6__broad_mit_edu__Level_2__raw_copynumber__data | Analyte Replicate Filter | TCGA-CJ-4641-01A-01D-1185-01 | TCGA-CJ-4641-01A-02D-1322-01 |
| TCGA-B2-4102 | snp__genome_wide_snp_6__broad_mit_edu__Level_2__raw_copynumber__data | Analyte Replicate Filter | TCGA-B2-4102-01A-01D-1185-01 | TCGA-B2-4102-01A-02D-1322-01 |
| TCGA-B8-4148 | snp__genome_wide_snp_6__broad_mit_edu__Level_2__raw_copynumber__data | Analyte Replicate Filter | TCGA-B8-4148-01A-01D-1185-01 | TCGA-B8-4148-01A-02D-1322-01 |
| TCGA-A3-3362 | snp__genome_wide_snp_6__broad_mit_edu__Level_2__raw_copynumber__data | Analyte Replicate Filter | TCGA-A3-3362-01A-01D-1185-01 | TCGA-A3-3362-01A-02D-1322-01 |
| TCGA-A3-3308 | snp__genome_wide_snp_6__broad_mit_edu__Level_2__raw_copynumber__data | Analyte Replicate Filter | TCGA-A3-3308-01A-01D-0858-01 | TCGA-A3-3308-01A-02D-1322-01 |
| TCGA-BP-4164 | snp__genome_wide_snp_6__broad_mit_edu__Level_2__raw_copynumber__data | Analyte Replicate Filter | TCGA-BP-4164-01A-01D-1185-01 | TCGA-BP-4164-01A-02D-1322-01 |
| TCGA-A3-3372 | snp__genome_wide_snp_6__broad_mit_edu__Level_2__raw_copynumber__data | Analyte Replicate Filter | TCGA-A3-3372-01A-01D-0858-01 | TCGA-A3-3372-01A-02D-1322-01 |
| TCGA-B2-5635 | snp__genome_wide_snp_6__broad_mit_edu__Level_2__raw_copynumber__data | Analyte Replicate Filter | TCGA-B2-5635-01A-01D-1530-01 | TCGA-B2-5635-01B-04D-A274-01 |
| TCGA-AK-3429 | snp__genome_wide_snp_6__broad_mit_edu__Level_2__raw_copynumber__data | Analyte Replicate Filter | TCGA-AK-3429-01A-01D-1185-01 | TCGA-AK-3429-01A-02D-1322-01 |
| TCGA-AK-3444 | snp__genome_wide_snp_6__broad_mit_edu__Level_2__raw_copynumber__data | Analyte Replicate Filter | TCGA-AK-3444-01A-01D-0858-01 | TCGA-AK-3444-01A-02D-1322-01 |
| TCGA-B2-4098 | snp__genome_wide_snp_6__broad_mit_edu__Level_2__raw_copynumber__data | Analyte Replicate Filter | TCGA-B2-4098-01A-01D-1185-01 | TCGA-B2-4098-01A-02D-1322-01 |
| TCGA-CJ-4634 | snp__genome_wide_snp_6__broad_mit_edu__Level_2__raw_copynumber__data | Analyte Replicate Filter | TCGA-CJ-4634-01A-01D-1185-01 | TCGA-CJ-4634-01A-02D-1322-01 |
| TCGA-AK-3443 | snp__genome_wide_snp_6__broad_mit_edu__Level_2__raw_copynumber__data | Analyte Replicate Filter | TCGA-AK-3443-01A-01D-0858-01 | TCGA-AK-3443-01A-02D-1322-01 |
| TCGA-A3-3323 | snp__genome_wide_snp_6__broad_mit_edu__Level_2__raw_copynumber__data | Analyte Replicate Filter | TCGA-A3-3323-01A-01D-0858-01 | TCGA-A3-3323-01A-02D-1322-01 |
| TCGA-B8-4622 | snp__genome_wide_snp_6__broad_mit_edu__Level_2__raw_copynumber__data | Analyte Replicate Filter | TCGA-B8-4622-01A-02D-1274-01 | TCGA-B8-4622-01A-02D-1549-01 |
| TCGA-A3-3374 | snp__genome_wide_snp_6__broad_mit_edu__Level_2__raw_copynumber__data | Analyte Replicate Filter | TCGA-A3-3374-01A-01D-0858-01 | TCGA-A3-3374-01A-02D-1322-01 |
| TCGA-A3-3382 | snp__genome_wide_snp_6__broad_mit_edu__Level_2__raw_copynumber__data | Analyte Replicate Filter | TCGA-A3-3382-01A-01D-0858-01 | TCGA-A3-3382-01A-02D-1322-01 |
| TCGA-A3-3378 | snp__genome_wide_snp_6__broad_mit_edu__Level_2__raw_copynumber__data | Analyte Replicate Filter | TCGA-A3-3378-01A-01D-0858-01 | TCGA-A3-3378-01A-02D-1322-01 |
| TCGA-CJ-4637 | snp__genome_wide_snp_6__broad_mit_edu__Level_2__raw_copynumber__data | Analyte Replicate Filter | TCGA-CJ-4637-01A-01D-1185-01 | TCGA-CJ-4637-01A-02D-1322-01 |
| TCGA-AK-3453 | snp__genome_wide_snp_6__broad_mit_edu__Level_2__raw_copynumber__data | Analyte Replicate Filter | TCGA-AK-3453-10A-01D-0858-01 | TCGA-AK-3453-10A-01D-1274-01 |
| TCGA-AK-3426 | snp__genome_wide_snp_6__broad_mit_edu__Level_2__raw_copynumber__data | Analyte Replicate Filter | TCGA-AK-3426-01A-01D-1185-01 | TCGA-AK-3426-01A-02D-1322-01 |
| TCGA-B8-4620 | snp__genome_wide_snp_6__broad_mit_edu__Level_2__raw_copynumber__data | Analyte Replicate Filter | TCGA-B8-4620-01A-01D-1185-01,TCGA-B8-4620-01A-02D-1322-01 | TCGA-B8-4620-01A-01D-1549-01 |
| TCGA-CJ-4639 | snp__genome_wide_snp_6__broad_mit_edu__Level_2__after_5NN_copy_number__data | Analyte Replicate Filter | TCGA-CJ-4639-01A-01D-1185-01 | TCGA-CJ-4639-01A-02D-1322-01 |
| TCGA-A3-3324 | snp__genome_wide_snp_6__broad_mit_edu__Level_2__after_5NN_copy_number__data | Analyte Replicate Filter | TCGA-A3-3324-01A-01D-0858-01 | TCGA-A3-3324-01A-02D-1322-01 |
| TCGA-A3-3331 | snp__genome_wide_snp_6__broad_mit_edu__Level_2__after_5NN_copy_number__data | Analyte Replicate Filter | TCGA-A3-3331-01A-01D-0858-01 | TCGA-A3-3331-01A-02D-1322-01 |
| TCGA-CJ-4637 | snp__genome_wide_snp_6__broad_mit_edu__Level_2__after_5NN_copy_number__data | Analyte Replicate Filter | TCGA-CJ-4637-01A-01D-1185-01 | TCGA-CJ-4637-01A-02D-1322-01 |
| TCGA-BP-4161 | snp__genome_wide_snp_6__broad_mit_edu__Level_2__after_5NN_copy_number__data | Analyte Replicate Filter | TCGA-BP-4161-01A-01D-1185-01 | TCGA-BP-4161-01A-02D-1322-01 |
| TCGA-B8-4148 | snp__genome_wide_snp_6__broad_mit_edu__Level_2__after_5NN_copy_number__data | Analyte Replicate Filter | TCGA-B8-4148-01A-01D-1185-01 | TCGA-B8-4148-01A-02D-1322-01 |
| TCGA-A3-3362 | snp__genome_wide_snp_6__broad_mit_edu__Level_2__after_5NN_copy_number__data | Analyte Replicate Filter | TCGA-A3-3362-01A-01D-1185-01 | TCGA-A3-3362-01A-02D-1322-01 |
| TCGA-BP-4163 | snp__genome_wide_snp_6__broad_mit_edu__Level_2__after_5NN_copy_number__data | Analyte Replicate Filter | TCGA-BP-4163-01A-01D-1185-01 | TCGA-BP-4163-01A-02D-1322-01 |
| TCGA-A3-3317 | snp__genome_wide_snp_6__broad_mit_edu__Level_2__after_5NN_copy_number__data | Analyte Replicate Filter | TCGA-A3-3317-01A-01D-0858-01 | TCGA-A3-3317-01A-02D-1322-01 |
| TCGA-AK-3436 | snp__genome_wide_snp_6__broad_mit_edu__Level_2__after_5NN_copy_number__data | Analyte Replicate Filter | TCGA-AK-3436-01A-01D-1185-01 | TCGA-AK-3436-01A-02D-1322-01 |
| TCGA-BP-4162 | snp__genome_wide_snp_6__broad_mit_edu__Level_2__after_5NN_copy_number__data | Analyte Replicate Filter | TCGA-BP-4162-01A-01D-1185-01 | TCGA-BP-4162-01A-02D-1322-01 |
| TCGA-BP-4164 | snp__genome_wide_snp_6__broad_mit_edu__Level_2__after_5NN_copy_number__data | Analyte Replicate Filter | TCGA-BP-4164-01A-01D-1185-01 | TCGA-BP-4164-01A-02D-1322-01 |
| TCGA-B2-3923 | snp__genome_wide_snp_6__broad_mit_edu__Level_2__after_5NN_copy_number__data | Analyte Replicate Filter | TCGA-B2-3923-01A-01D-1185-01 | TCGA-B2-3923-01A-02D-1322-01 |
| TCGA-BP-4167 | snp__genome_wide_snp_6__broad_mit_edu__Level_2__after_5NN_copy_number__data | Analyte Replicate Filter | TCGA-BP-4167-01A-01D-1185-01 | TCGA-BP-4167-01A-02D-1322-01 |
| TCGA-A3-3347 | snp__genome_wide_snp_6__broad_mit_edu__Level_2__after_5NN_copy_number__data | Analyte Replicate Filter | TCGA-A3-3347-01A-01D-1185-01 | TCGA-A3-3347-01A-02D-1322-01 |
| TCGA-AK-3440 | snp__genome_wide_snp_6__broad_mit_edu__Level_2__after_5NN_copy_number__data | Analyte Replicate Filter | TCGA-AK-3440-01A-01D-0858-01 | TCGA-AK-3440-01A-02D-1274-01 |
| TCGA-CJ-4644 | snp__genome_wide_snp_6__broad_mit_edu__Level_2__after_5NN_copy_number__data | Analyte Replicate Filter | TCGA-CJ-4644-01A-01D-1185-01 | TCGA-CJ-4644-01A-02D-1322-01 |
| TCGA-AK-3465 | snp__genome_wide_snp_6__broad_mit_edu__Level_2__after_5NN_copy_number__data | Analyte Replicate Filter | TCGA-AK-3465-01A-01D-0858-01 | TCGA-AK-3465-01A-02D-1322-01 |
| TCGA-A3-3319 | snp__genome_wide_snp_6__broad_mit_edu__Level_2__after_5NN_copy_number__data | Analyte Replicate Filter | TCGA-A3-3319-01A-01D-0858-01 | TCGA-A3-3319-01A-02D-1322-01 |
| TCGA-CJ-4643 | snp__genome_wide_snp_6__broad_mit_edu__Level_2__after_5NN_copy_number__data | Analyte Replicate Filter | TCGA-CJ-4643-01A-01D-1185-01 | TCGA-CJ-4643-01A-02D-1322-01 |
| TCGA-B8-4619 | snp__genome_wide_snp_6__broad_mit_edu__Level_2__after_5NN_copy_number__data | Analyte Replicate Filter | TCGA-B8-4619-01A-01D-1185-01,TCGA-B8-4619-01A-02D-1322-01 | TCGA-B8-4619-01A-02D-1549-01 |
| TCGA-A3-3383 | snp__genome_wide_snp_6__broad_mit_edu__Level_2__after_5NN_copy_number__data | Analyte Replicate Filter | TCGA-A3-3383-01A-01D-0858-01 | TCGA-A3-3383-01A-02D-1322-01 |
| TCGA-AK-3456 | snp__genome_wide_snp_6__broad_mit_edu__Level_2__after_5NN_copy_number__data | Analyte Replicate Filter | TCGA-AK-3456-01A-01D-1185-01 | TCGA-AK-3456-01A-02D-1322-01 |
| TCGA-A3-3311 | snp__genome_wide_snp_6__broad_mit_edu__Level_2__after_5NN_copy_number__data | Analyte Replicate Filter | TCGA-A3-3311-01A-01D-0858-01 | TCGA-A3-3311-01A-02D-1322-01 |
| TCGA-A3-3351 | snp__genome_wide_snp_6__broad_mit_edu__Level_2__after_5NN_copy_number__data | Analyte Replicate Filter | TCGA-A3-3351-01A-01D-1185-01 | TCGA-A3-3351-01A-02D-1322-01 |
| TCGA-A3-3320 | snp__genome_wide_snp_6__broad_mit_edu__Level_2__after_5NN_copy_number__data | Analyte Replicate Filter | TCGA-A3-3320-01A-01D-0858-01 | TCGA-A3-3320-01A-02D-1322-01 |
| TCGA-CJ-4640 | snp__genome_wide_snp_6__broad_mit_edu__Level_2__after_5NN_copy_number__data | Analyte Replicate Filter | TCGA-CJ-4640-01A-01D-1185-01 | TCGA-CJ-4640-01A-02D-1322-01 |
| TCGA-A3-3313 | snp__genome_wide_snp_6__broad_mit_edu__Level_2__after_5NN_copy_number__data | Analyte Replicate Filter | TCGA-A3-3313-01A-01D-0858-01 | TCGA-A3-3313-01A-02D-1322-01 |
| TCGA-AK-3453 | snp__genome_wide_snp_6__broad_mit_edu__Level_2__after_5NN_copy_number__data | Analyte Replicate Filter | TCGA-AK-3453-01A-01D-0858-01 | TCGA-AK-3453-01A-02D-1274-01 |
| TCGA-CJ-4638 | snp__genome_wide_snp_6__broad_mit_edu__Level_2__after_5NN_copy_number__data | Analyte Replicate Filter | TCGA-CJ-4638-01A-01D-1185-01 | TCGA-CJ-4638-01A-02D-1322-01 |
| TCGA-CJ-4641 | snp__genome_wide_snp_6__broad_mit_edu__Level_2__after_5NN_copy_number__data | Analyte Replicate Filter | TCGA-CJ-4641-01A-01D-1185-01 | TCGA-CJ-4641-01A-02D-1322-01 |
| TCGA-B2-4102 | snp__genome_wide_snp_6__broad_mit_edu__Level_2__after_5NN_copy_number__data | Analyte Replicate Filter | TCGA-B2-4102-01A-01D-1185-01 | TCGA-B2-4102-01A-02D-1322-01 |
| TCGA-CJ-4636 | snp__genome_wide_snp_6__broad_mit_edu__Level_2__after_5NN_copy_number__data | Analyte Replicate Filter | TCGA-CJ-4636-01A-01D-1185-01 | TCGA-CJ-4636-01A-02D-1322-01 |
| TCGA-A3-3308 | snp__genome_wide_snp_6__broad_mit_edu__Level_2__after_5NN_copy_number__data | Analyte Replicate Filter | TCGA-A3-3308-01A-01D-0858-01 | TCGA-A3-3308-01A-02D-1322-01 |
| TCGA-A3-3372 | snp__genome_wide_snp_6__broad_mit_edu__Level_2__after_5NN_copy_number__data | Analyte Replicate Filter | TCGA-A3-3372-01A-01D-0858-01 | TCGA-A3-3372-01A-02D-1322-01 |
| TCGA-AK-3429 | snp__genome_wide_snp_6__broad_mit_edu__Level_2__after_5NN_copy_number__data | Analyte Replicate Filter | TCGA-AK-3429-01A-01D-1185-01 | TCGA-AK-3429-01A-02D-1322-01 |
| TCGA-AK-3444 | snp__genome_wide_snp_6__broad_mit_edu__Level_2__after_5NN_copy_number__data | Analyte Replicate Filter | TCGA-AK-3444-01A-01D-0858-01 | TCGA-AK-3444-01A-02D-1322-01 |
| TCGA-CJ-4634 | snp__genome_wide_snp_6__broad_mit_edu__Level_2__after_5NN_copy_number__data | Analyte Replicate Filter | TCGA-CJ-4634-01A-01D-1185-01 | TCGA-CJ-4634-01A-02D-1322-01 |
| TCGA-AK-3443 | snp__genome_wide_snp_6__broad_mit_edu__Level_2__after_5NN_copy_number__data | Analyte Replicate Filter | TCGA-AK-3443-01A-01D-0858-01 | TCGA-AK-3443-01A-02D-1322-01 |
| TCGA-B8-4622 | snp__genome_wide_snp_6__broad_mit_edu__Level_2__after_5NN_copy_number__data | Analyte Replicate Filter | TCGA-B8-4622-01A-02D-1274-01 | TCGA-B8-4622-01A-02D-1549-01 |
| TCGA-A3-3378 | snp__genome_wide_snp_6__broad_mit_edu__Level_2__after_5NN_copy_number__data | Analyte Replicate Filter | TCGA-A3-3378-01A-01D-0858-01 | TCGA-A3-3378-01A-02D-1322-01 |
| TCGA-AK-3453 | snp__genome_wide_snp_6__broad_mit_edu__Level_2__after_5NN_copy_number__data | Analyte Replicate Filter | TCGA-AK-3453-10A-01D-0858-01 | TCGA-AK-3453-10A-01D-1274-01 |
| TCGA-AK-3426 | snp__genome_wide_snp_6__broad_mit_edu__Level_2__after_5NN_copy_number__data | Analyte Replicate Filter | TCGA-AK-3426-01A-01D-1185-01 | TCGA-AK-3426-01A-02D-1322-01 |
| TCGA-B8-4620 | snp__genome_wide_snp_6__broad_mit_edu__Level_2__after_5NN_copy_number__data | Analyte Replicate Filter | TCGA-B8-4620-01A-01D-1185-01,TCGA-B8-4620-01A-02D-1322-01 | TCGA-B8-4620-01A-01D-1549-01 |
| TCGA-A3-3322 | snp__genome_wide_snp_6__broad_mit_edu__Level_2__after_5NN_copy_number__data | Analyte Replicate Filter | TCGA-A3-3322-01A-01D-0858-01 | TCGA-A3-3322-01A-02D-1322-01 |
| TCGA-CJ-4639 | snp__genome_wide_snp_6__broad_mit_edu__Level_2__invariantset_medianpolish__data | Analyte Replicate Filter | TCGA-CJ-4639-01A-01D-1185-01 | TCGA-CJ-4639-01A-02D-1322-01 |
| TCGA-CJ-4636 | snp__genome_wide_snp_6__broad_mit_edu__Level_2__invariantset_medianpolish__data | Analyte Replicate Filter | TCGA-CJ-4636-01A-01D-1185-01 | TCGA-CJ-4636-01A-02D-1322-01 |
| TCGA-A3-3331 | snp__genome_wide_snp_6__broad_mit_edu__Level_2__invariantset_medianpolish__data | Analyte Replicate Filter | TCGA-A3-3331-01A-01D-0858-01 | TCGA-A3-3331-01A-02D-1322-01 |
| TCGA-AK-3440 | snp__genome_wide_snp_6__broad_mit_edu__Level_2__invariantset_medianpolish__data | Analyte Replicate Filter | TCGA-AK-3440-10A-01D-0858-01 | TCGA-AK-3440-10A-01D-1274-01 |
| TCGA-A3-3324 | snp__genome_wide_snp_6__broad_mit_edu__Level_2__invariantset_medianpolish__data | Analyte Replicate Filter | TCGA-A3-3324-01A-01D-0858-01 | TCGA-A3-3324-01A-02D-1322-01 |
| TCGA-A3-3351 | snp__genome_wide_snp_6__broad_mit_edu__Level_2__invariantset_medianpolish__data | Analyte Replicate Filter | TCGA-A3-3351-01A-01D-1185-01 | TCGA-A3-3351-01A-02D-1322-01 |
| TCGA-BP-4163 | snp__genome_wide_snp_6__broad_mit_edu__Level_2__invariantset_medianpolish__data | Analyte Replicate Filter | TCGA-BP-4163-01A-01D-1185-01 | TCGA-BP-4163-01A-02D-1322-01 |
| TCGA-A3-3317 | snp__genome_wide_snp_6__broad_mit_edu__Level_2__invariantset_medianpolish__data | Analyte Replicate Filter | TCGA-A3-3317-01A-01D-0858-01 | TCGA-A3-3317-01A-02D-1322-01 |
| TCGA-AK-3465 | snp__genome_wide_snp_6__broad_mit_edu__Level_2__invariantset_medianpolish__data | Analyte Replicate Filter | TCGA-AK-3465-01A-01D-0858-01 | TCGA-AK-3465-01A-02D-1322-01 |
| TCGA-AK-3436 | snp__genome_wide_snp_6__broad_mit_edu__Level_2__invariantset_medianpolish__data | Analyte Replicate Filter | TCGA-AK-3436-01A-01D-1185-01 | TCGA-AK-3436-01A-02D-1322-01 |
| TCGA-BP-4162 | snp__genome_wide_snp_6__broad_mit_edu__Level_2__invariantset_medianpolish__data | Analyte Replicate Filter | TCGA-BP-4162-01A-01D-1185-01 | TCGA-BP-4162-01A-02D-1322-01 |
| TCGA-BP-4167 | snp__genome_wide_snp_6__broad_mit_edu__Level_2__invariantset_medianpolish__data | Analyte Replicate Filter | TCGA-BP-4167-01A-01D-1185-01 | TCGA-BP-4167-01A-02D-1322-01 |
| TCGA-B2-3923 | snp__genome_wide_snp_6__broad_mit_edu__Level_2__invariantset_medianpolish__data | Analyte Replicate Filter | TCGA-B2-3923-01A-01D-1185-01 | TCGA-B2-3923-01A-02D-1322-01 |
| TCGA-CJ-4638 | snp__genome_wide_snp_6__broad_mit_edu__Level_2__invariantset_medianpolish__data | Analyte Replicate Filter | TCGA-CJ-4638-01A-01D-1185-01 | TCGA-CJ-4638-01A-02D-1322-01 |
| TCGA-A3-3347 | snp__genome_wide_snp_6__broad_mit_edu__Level_2__invariantset_medianpolish__data | Analyte Replicate Filter | TCGA-A3-3347-01A-01D-1185-01 | TCGA-A3-3347-01A-02D-1322-01 |
| TCGA-AK-3440 | snp__genome_wide_snp_6__broad_mit_edu__Level_2__invariantset_medianpolish__data | Analyte Replicate Filter | TCGA-AK-3440-01A-01D-0858-01 | TCGA-AK-3440-01A-02D-1274-01 |
| TCGA-CJ-4644 | snp__genome_wide_snp_6__broad_mit_edu__Level_2__invariantset_medianpolish__data | Analyte Replicate Filter | TCGA-CJ-4644-01A-01D-1185-01 | TCGA-CJ-4644-01A-02D-1322-01 |
| TCGA-B2-5633 | snp__genome_wide_snp_6__broad_mit_edu__Level_2__invariantset_medianpolish__data | Analyte Replicate Filter | TCGA-B2-5633-01A-01D-1530-01 | TCGA-B2-5633-01B-04D-A274-01 |
| TCGA-A3-3319 | snp__genome_wide_snp_6__broad_mit_edu__Level_2__invariantset_medianpolish__data | Analyte Replicate Filter | TCGA-A3-3319-01A-01D-0858-01 | TCGA-A3-3319-01A-02D-1322-01 |
| TCGA-CJ-4643 | snp__genome_wide_snp_6__broad_mit_edu__Level_2__invariantset_medianpolish__data | Analyte Replicate Filter | TCGA-CJ-4643-01A-01D-1185-01 | TCGA-CJ-4643-01A-02D-1322-01 |
| TCGA-B8-4619 | snp__genome_wide_snp_6__broad_mit_edu__Level_2__invariantset_medianpolish__data | Analyte Replicate Filter | TCGA-B8-4619-01A-01D-1185-01,TCGA-B8-4619-01A-02D-1322-01 | TCGA-B8-4619-01A-02D-1549-01 |
| TCGA-A3-3383 | snp__genome_wide_snp_6__broad_mit_edu__Level_2__invariantset_medianpolish__data | Analyte Replicate Filter | TCGA-A3-3383-01A-01D-0858-01 | TCGA-A3-3383-01A-02D-1322-01 |
| TCGA-AK-3456 | snp__genome_wide_snp_6__broad_mit_edu__Level_2__invariantset_medianpolish__data | Analyte Replicate Filter | TCGA-AK-3456-01A-01D-1185-01 | TCGA-AK-3456-01A-02D-1322-01 |
| TCGA-A3-3311 | snp__genome_wide_snp_6__broad_mit_edu__Level_2__invariantset_medianpolish__data | Analyte Replicate Filter | TCGA-A3-3311-01A-01D-0858-01 | TCGA-A3-3311-01A-02D-1322-01 |
| TCGA-A3-3322 | snp__genome_wide_snp_6__broad_mit_edu__Level_2__invariantset_medianpolish__data | Analyte Replicate Filter | TCGA-A3-3322-01A-01D-0858-01 | TCGA-A3-3322-01A-02D-1322-01 |
| TCGA-BP-4161 | snp__genome_wide_snp_6__broad_mit_edu__Level_2__invariantset_medianpolish__data | Analyte Replicate Filter | TCGA-BP-4161-01A-01D-1185-01 | TCGA-BP-4161-01A-02D-1322-01 |
| TCGA-A3-3320 | snp__genome_wide_snp_6__broad_mit_edu__Level_2__invariantset_medianpolish__data | Analyte Replicate Filter | TCGA-A3-3320-01A-01D-0858-01 | TCGA-A3-3320-01A-02D-1322-01 |
| TCGA-B2-3924 | snp__genome_wide_snp_6__broad_mit_edu__Level_2__invariantset_medianpolish__data | Analyte Replicate Filter | TCGA-B2-3924-01A-01D-1185-01 | TCGA-B2-3924-01B-03D-A274-01 |
| TCGA-CJ-4640 | snp__genome_wide_snp_6__broad_mit_edu__Level_2__invariantset_medianpolish__data | Analyte Replicate Filter | TCGA-CJ-4640-01A-01D-1185-01 | TCGA-CJ-4640-01A-02D-1322-01 |
| TCGA-A3-3313 | snp__genome_wide_snp_6__broad_mit_edu__Level_2__invariantset_medianpolish__data | Analyte Replicate Filter | TCGA-A3-3313-01A-01D-0858-01 | TCGA-A3-3313-01A-02D-1322-01 |
| TCGA-AK-3453 | snp__genome_wide_snp_6__broad_mit_edu__Level_2__invariantset_medianpolish__data | Analyte Replicate Filter | TCGA-AK-3453-01A-01D-0858-01 | TCGA-AK-3453-01A-02D-1274-01 |
| TCGA-CJ-4641 | snp__genome_wide_snp_6__broad_mit_edu__Level_2__invariantset_medianpolish__data | Analyte Replicate Filter | TCGA-CJ-4641-01A-01D-1185-01 | TCGA-CJ-4641-01A-02D-1322-01 |
| TCGA-B2-4102 | snp__genome_wide_snp_6__broad_mit_edu__Level_2__invariantset_medianpolish__data | Analyte Replicate Filter | TCGA-B2-4102-01A-01D-1185-01 | TCGA-B2-4102-01A-02D-1322-01 |
| TCGA-B8-4148 | snp__genome_wide_snp_6__broad_mit_edu__Level_2__invariantset_medianpolish__data | Analyte Replicate Filter | TCGA-B8-4148-01A-01D-1185-01 | TCGA-B8-4148-01A-02D-1322-01 |
| TCGA-A3-3362 | snp__genome_wide_snp_6__broad_mit_edu__Level_2__invariantset_medianpolish__data | Analyte Replicate Filter | TCGA-A3-3362-01A-01D-1185-01 | TCGA-A3-3362-01A-02D-1322-01 |
| TCGA-A3-3308 | snp__genome_wide_snp_6__broad_mit_edu__Level_2__invariantset_medianpolish__data | Analyte Replicate Filter | TCGA-A3-3308-01A-01D-0858-01 | TCGA-A3-3308-01A-02D-1322-01 |
| TCGA-BP-4164 | snp__genome_wide_snp_6__broad_mit_edu__Level_2__invariantset_medianpolish__data | Analyte Replicate Filter | TCGA-BP-4164-01A-01D-1185-01 | TCGA-BP-4164-01A-02D-1322-01 |
| TCGA-A3-3372 | snp__genome_wide_snp_6__broad_mit_edu__Level_2__invariantset_medianpolish__data | Analyte Replicate Filter | TCGA-A3-3372-01A-01D-0858-01 | TCGA-A3-3372-01A-02D-1322-01 |
| TCGA-B2-5635 | snp__genome_wide_snp_6__broad_mit_edu__Level_2__invariantset_medianpolish__data | Analyte Replicate Filter | TCGA-B2-5635-01A-01D-1530-01 | TCGA-B2-5635-01B-04D-A274-01 |
| TCGA-AK-3429 | snp__genome_wide_snp_6__broad_mit_edu__Level_2__invariantset_medianpolish__data | Analyte Replicate Filter | TCGA-AK-3429-01A-01D-1185-01 | TCGA-AK-3429-01A-02D-1322-01 |
| TCGA-AK-3444 | snp__genome_wide_snp_6__broad_mit_edu__Level_2__invariantset_medianpolish__data | Analyte Replicate Filter | TCGA-AK-3444-01A-01D-0858-01 | TCGA-AK-3444-01A-02D-1322-01 |
| TCGA-B2-4098 | snp__genome_wide_snp_6__broad_mit_edu__Level_2__invariantset_medianpolish__data | Analyte Replicate Filter | TCGA-B2-4098-01A-01D-1185-01 | TCGA-B2-4098-01A-02D-1322-01 |
| TCGA-CJ-4634 | snp__genome_wide_snp_6__broad_mit_edu__Level_2__invariantset_medianpolish__data | Analyte Replicate Filter | TCGA-CJ-4634-01A-01D-1185-01 | TCGA-CJ-4634-01A-02D-1322-01 |
| TCGA-AK-3443 | snp__genome_wide_snp_6__broad_mit_edu__Level_2__invariantset_medianpolish__data | Analyte Replicate Filter | TCGA-AK-3443-01A-01D-0858-01 | TCGA-AK-3443-01A-02D-1322-01 |
| TCGA-A3-3323 | snp__genome_wide_snp_6__broad_mit_edu__Level_2__invariantset_medianpolish__data | Analyte Replicate Filter | TCGA-A3-3323-01A-01D-0858-01 | TCGA-A3-3323-01A-02D-1322-01 |
| TCGA-B8-4622 | snp__genome_wide_snp_6__broad_mit_edu__Level_2__invariantset_medianpolish__data | Analyte Replicate Filter | TCGA-B8-4622-01A-02D-1274-01 | TCGA-B8-4622-01A-02D-1549-01 |
| TCGA-A3-3374 | snp__genome_wide_snp_6__broad_mit_edu__Level_2__invariantset_medianpolish__data | Analyte Replicate Filter | TCGA-A3-3374-01A-01D-0858-01 | TCGA-A3-3374-01A-02D-1322-01 |
| TCGA-A3-3382 | snp__genome_wide_snp_6__broad_mit_edu__Level_2__invariantset_medianpolish__data | Analyte Replicate Filter | TCGA-A3-3382-01A-01D-0858-01 | TCGA-A3-3382-01A-02D-1322-01 |
| TCGA-A3-3378 | snp__genome_wide_snp_6__broad_mit_edu__Level_2__invariantset_medianpolish__data | Analyte Replicate Filter | TCGA-A3-3378-01A-01D-0858-01 | TCGA-A3-3378-01A-02D-1322-01 |
| TCGA-CJ-4637 | snp__genome_wide_snp_6__broad_mit_edu__Level_2__invariantset_medianpolish__data | Analyte Replicate Filter | TCGA-CJ-4637-01A-01D-1185-01 | TCGA-CJ-4637-01A-02D-1322-01 |
| TCGA-AK-3453 | snp__genome_wide_snp_6__broad_mit_edu__Level_2__invariantset_medianpolish__data | Analyte Replicate Filter | TCGA-AK-3453-10A-01D-0858-01 | TCGA-AK-3453-10A-01D-1274-01 |
| TCGA-AK-3426 | snp__genome_wide_snp_6__broad_mit_edu__Level_2__invariantset_medianpolish__data | Analyte Replicate Filter | TCGA-AK-3426-01A-01D-1185-01 | TCGA-AK-3426-01A-02D-1322-01 |
| TCGA-B8-4620 | snp__genome_wide_snp_6__broad_mit_edu__Level_2__invariantset_medianpolish__data | Analyte Replicate Filter | TCGA-B8-4620-01A-01D-1185-01,TCGA-B8-4620-01A-02D-1322-01 | TCGA-B8-4620-01A-01D-1549-01 |
| TCGA-CJ-4639 | snp__genome_wide_snp_6__broad_mit_edu__Level_2__birdseed_genotype__birdseed | Analyte Replicate Filter | TCGA-CJ-4639-01A-01D-1185-01 | TCGA-CJ-4639-01A-02D-1322-01 |
| TCGA-CJ-4636 | snp__genome_wide_snp_6__broad_mit_edu__Level_2__birdseed_genotype__birdseed | Analyte Replicate Filter | TCGA-CJ-4636-01A-01D-1185-01 | TCGA-CJ-4636-01A-02D-1322-01 |
| TCGA-A3-3331 | snp__genome_wide_snp_6__broad_mit_edu__Level_2__birdseed_genotype__birdseed | Analyte Replicate Filter | TCGA-A3-3331-01A-01D-0858-01 | TCGA-A3-3331-01A-02D-1322-01 |
| TCGA-A3-3324 | snp__genome_wide_snp_6__broad_mit_edu__Level_2__birdseed_genotype__birdseed | Analyte Replicate Filter | TCGA-A3-3324-01A-01D-0858-01 | TCGA-A3-3324-01A-02D-1322-01 |
| TCGA-A3-3351 | snp__genome_wide_snp_6__broad_mit_edu__Level_2__birdseed_genotype__birdseed | Analyte Replicate Filter | TCGA-A3-3351-01A-01D-1185-01 | TCGA-A3-3351-01A-02D-1322-01 |
| TCGA-BP-4163 | snp__genome_wide_snp_6__broad_mit_edu__Level_2__birdseed_genotype__birdseed | Analyte Replicate Filter | TCGA-BP-4163-01A-01D-1185-01 | TCGA-BP-4163-01A-02D-1322-01 |
| TCGA-A3-3317 | snp__genome_wide_snp_6__broad_mit_edu__Level_2__birdseed_genotype__birdseed | Analyte Replicate Filter | TCGA-A3-3317-01A-01D-0858-01 | TCGA-A3-3317-01A-02D-1322-01 |
| TCGA-AK-3465 | snp__genome_wide_snp_6__broad_mit_edu__Level_2__birdseed_genotype__birdseed | Analyte Replicate Filter | TCGA-AK-3465-01A-01D-0858-01 | TCGA-AK-3465-01A-02D-1322-01 |
| TCGA-AK-3436 | snp__genome_wide_snp_6__broad_mit_edu__Level_2__birdseed_genotype__birdseed | Analyte Replicate Filter | TCGA-AK-3436-01A-01D-1185-01 | TCGA-AK-3436-01A-02D-1322-01 |
| TCGA-BP-4162 | snp__genome_wide_snp_6__broad_mit_edu__Level_2__birdseed_genotype__birdseed | Analyte Replicate Filter | TCGA-BP-4162-01A-01D-1185-01 | TCGA-BP-4162-01A-02D-1322-01 |
| TCGA-BP-4167 | snp__genome_wide_snp_6__broad_mit_edu__Level_2__birdseed_genotype__birdseed | Analyte Replicate Filter | TCGA-BP-4167-01A-01D-1185-01 | TCGA-BP-4167-01A-02D-1322-01 |
| TCGA-B2-3923 | snp__genome_wide_snp_6__broad_mit_edu__Level_2__birdseed_genotype__birdseed | Analyte Replicate Filter | TCGA-B2-3923-01A-01D-1185-01 | TCGA-B2-3923-01A-02D-1322-01 |
| TCGA-CJ-4638 | snp__genome_wide_snp_6__broad_mit_edu__Level_2__birdseed_genotype__birdseed | Analyte Replicate Filter | TCGA-CJ-4638-01A-01D-1185-01 | TCGA-CJ-4638-01A-02D-1322-01 |
| TCGA-A3-3347 | snp__genome_wide_snp_6__broad_mit_edu__Level_2__birdseed_genotype__birdseed | Analyte Replicate Filter | TCGA-A3-3347-01A-01D-1185-01 | TCGA-A3-3347-01A-02D-1322-01 |
| TCGA-AK-3440 | snp__genome_wide_snp_6__broad_mit_edu__Level_2__birdseed_genotype__birdseed | Analyte Replicate Filter | TCGA-AK-3440-01A-01D-0858-01 | TCGA-AK-3440-01A-02D-1274-01 |
| TCGA-CJ-4644 | snp__genome_wide_snp_6__broad_mit_edu__Level_2__birdseed_genotype__birdseed | Analyte Replicate Filter | TCGA-CJ-4644-01A-01D-1185-01 | TCGA-CJ-4644-01A-02D-1322-01 |
| TCGA-B2-5633 | snp__genome_wide_snp_6__broad_mit_edu__Level_2__birdseed_genotype__birdseed | Analyte Replicate Filter | TCGA-B2-5633-01A-01D-1530-01 | TCGA-B2-5633-01B-04D-A274-01 |
| TCGA-A3-3319 | snp__genome_wide_snp_6__broad_mit_edu__Level_2__birdseed_genotype__birdseed | Analyte Replicate Filter | TCGA-A3-3319-01A-01D-0858-01 | TCGA-A3-3319-01A-02D-1322-01 |
| TCGA-CJ-4643 | snp__genome_wide_snp_6__broad_mit_edu__Level_2__birdseed_genotype__birdseed | Analyte Replicate Filter | TCGA-CJ-4643-01A-01D-1185-01 | TCGA-CJ-4643-01A-02D-1322-01 |
| TCGA-B8-4619 | snp__genome_wide_snp_6__broad_mit_edu__Level_2__birdseed_genotype__birdseed | Analyte Replicate Filter | TCGA-B8-4619-01A-01D-1185-01,TCGA-B8-4619-01A-02D-1322-01 | TCGA-B8-4619-01A-02D-1549-01 |
| TCGA-A3-3383 | snp__genome_wide_snp_6__broad_mit_edu__Level_2__birdseed_genotype__birdseed | Analyte Replicate Filter | TCGA-A3-3383-01A-01D-0858-01 | TCGA-A3-3383-01A-02D-1322-01 |
| TCGA-AK-3456 | snp__genome_wide_snp_6__broad_mit_edu__Level_2__birdseed_genotype__birdseed | Analyte Replicate Filter | TCGA-AK-3456-01A-01D-1185-01 | TCGA-AK-3456-01A-02D-1322-01 |
| TCGA-A3-3311 | snp__genome_wide_snp_6__broad_mit_edu__Level_2__birdseed_genotype__birdseed | Analyte Replicate Filter | TCGA-A3-3311-01A-01D-0858-01 | TCGA-A3-3311-01A-02D-1322-01 |
| TCGA-A3-3322 | snp__genome_wide_snp_6__broad_mit_edu__Level_2__birdseed_genotype__birdseed | Analyte Replicate Filter | TCGA-A3-3322-01A-01D-0858-01 | TCGA-A3-3322-01A-02D-1322-01 |
| TCGA-BP-4161 | snp__genome_wide_snp_6__broad_mit_edu__Level_2__birdseed_genotype__birdseed | Analyte Replicate Filter | TCGA-BP-4161-01A-01D-1185-01 | TCGA-BP-4161-01A-02D-1322-01 |
| TCGA-A3-3320 | snp__genome_wide_snp_6__broad_mit_edu__Level_2__birdseed_genotype__birdseed | Analyte Replicate Filter | TCGA-A3-3320-01A-01D-0858-01 | TCGA-A3-3320-01A-02D-1322-01 |
| TCGA-B2-3924 | snp__genome_wide_snp_6__broad_mit_edu__Level_2__birdseed_genotype__birdseed | Analyte Replicate Filter | TCGA-B2-3924-01A-01D-1185-01 | TCGA-B2-3924-01B-03D-A274-01 |
| TCGA-CJ-4640 | snp__genome_wide_snp_6__broad_mit_edu__Level_2__birdseed_genotype__birdseed | Analyte Replicate Filter | TCGA-CJ-4640-01A-01D-1185-01 | TCGA-CJ-4640-01A-02D-1322-01 |
| TCGA-A3-3313 | snp__genome_wide_snp_6__broad_mit_edu__Level_2__birdseed_genotype__birdseed | Analyte Replicate Filter | TCGA-A3-3313-01A-01D-0858-01 | TCGA-A3-3313-01A-02D-1322-01 |
| TCGA-AK-3453 | snp__genome_wide_snp_6__broad_mit_edu__Level_2__birdseed_genotype__birdseed | Analyte Replicate Filter | TCGA-AK-3453-01A-01D-0858-01 | TCGA-AK-3453-01A-02D-1274-01 |
| TCGA-CJ-4641 | snp__genome_wide_snp_6__broad_mit_edu__Level_2__birdseed_genotype__birdseed | Analyte Replicate Filter | TCGA-CJ-4641-01A-01D-1185-01 | TCGA-CJ-4641-01A-02D-1322-01 |
| TCGA-B2-4102 | snp__genome_wide_snp_6__broad_mit_edu__Level_2__birdseed_genotype__birdseed | Analyte Replicate Filter | TCGA-B2-4102-01A-01D-1185-01 | TCGA-B2-4102-01A-02D-1322-01 |
| TCGA-B8-4148 | snp__genome_wide_snp_6__broad_mit_edu__Level_2__birdseed_genotype__birdseed | Analyte Replicate Filter | TCGA-B8-4148-01A-01D-1185-01 | TCGA-B8-4148-01A-02D-1322-01 |
| TCGA-A3-3362 | snp__genome_wide_snp_6__broad_mit_edu__Level_2__birdseed_genotype__birdseed | Analyte Replicate Filter | TCGA-A3-3362-01A-01D-1185-01 | TCGA-A3-3362-01A-02D-1322-01 |
| TCGA-A3-3308 | snp__genome_wide_snp_6__broad_mit_edu__Level_2__birdseed_genotype__birdseed | Analyte Replicate Filter | TCGA-A3-3308-01A-01D-0858-01 | TCGA-A3-3308-01A-02D-1322-01 |
| TCGA-BP-4164 | snp__genome_wide_snp_6__broad_mit_edu__Level_2__birdseed_genotype__birdseed | Analyte Replicate Filter | TCGA-BP-4164-01A-01D-1185-01 | TCGA-BP-4164-01A-02D-1322-01 |
| TCGA-A3-3372 | snp__genome_wide_snp_6__broad_mit_edu__Level_2__birdseed_genotype__birdseed | Analyte Replicate Filter | TCGA-A3-3372-01A-01D-0858-01 | TCGA-A3-3372-01A-02D-1322-01 |
| TCGA-B2-5635 | snp__genome_wide_snp_6__broad_mit_edu__Level_2__birdseed_genotype__birdseed | Analyte Replicate Filter | TCGA-B2-5635-01A-01D-1530-01 | TCGA-B2-5635-01B-04D-A274-01 |
| TCGA-AK-3429 | snp__genome_wide_snp_6__broad_mit_edu__Level_2__birdseed_genotype__birdseed | Analyte Replicate Filter | TCGA-AK-3429-01A-01D-1185-01 | TCGA-AK-3429-01A-02D-1322-01 |
| TCGA-AK-3444 | snp__genome_wide_snp_6__broad_mit_edu__Level_2__birdseed_genotype__birdseed | Analyte Replicate Filter | TCGA-AK-3444-01A-01D-0858-01 | TCGA-AK-3444-01A-02D-1322-01 |
| TCGA-B2-4098 | snp__genome_wide_snp_6__broad_mit_edu__Level_2__birdseed_genotype__birdseed | Analyte Replicate Filter | TCGA-B2-4098-01A-01D-1185-01 | TCGA-B2-4098-01A-02D-1322-01 |
| TCGA-CJ-4634 | snp__genome_wide_snp_6__broad_mit_edu__Level_2__birdseed_genotype__birdseed | Analyte Replicate Filter | TCGA-CJ-4634-01A-01D-1185-01 | TCGA-CJ-4634-01A-02D-1322-01 |
| TCGA-AK-3443 | snp__genome_wide_snp_6__broad_mit_edu__Level_2__birdseed_genotype__birdseed | Analyte Replicate Filter | TCGA-AK-3443-01A-01D-0858-01 | TCGA-AK-3443-01A-02D-1322-01 |
| TCGA-A3-3323 | snp__genome_wide_snp_6__broad_mit_edu__Level_2__birdseed_genotype__birdseed | Analyte Replicate Filter | TCGA-A3-3323-01A-01D-0858-01 | TCGA-A3-3323-01A-02D-1322-01 |
| TCGA-B8-4622 | snp__genome_wide_snp_6__broad_mit_edu__Level_2__birdseed_genotype__birdseed | Analyte Replicate Filter | TCGA-B8-4622-01A-02D-1274-01 | TCGA-B8-4622-01A-02D-1549-01 |
| TCGA-A3-3374 | snp__genome_wide_snp_6__broad_mit_edu__Level_2__birdseed_genotype__birdseed | Analyte Replicate Filter | TCGA-A3-3374-01A-01D-0858-01 | TCGA-A3-3374-01A-02D-1322-01 |
| TCGA-A3-3382 | snp__genome_wide_snp_6__broad_mit_edu__Level_2__birdseed_genotype__birdseed | Analyte Replicate Filter | TCGA-A3-3382-01A-01D-0858-01 | TCGA-A3-3382-01A-02D-1322-01 |
| TCGA-A3-3378 | snp__genome_wide_snp_6__broad_mit_edu__Level_2__birdseed_genotype__birdseed | Analyte Replicate Filter | TCGA-A3-3378-01A-01D-0858-01 | TCGA-A3-3378-01A-02D-1322-01 |
| TCGA-CJ-4637 | snp__genome_wide_snp_6__broad_mit_edu__Level_2__birdseed_genotype__birdseed | Analyte Replicate Filter | TCGA-CJ-4637-01A-01D-1185-01 | TCGA-CJ-4637-01A-02D-1322-01 |
| TCGA-AK-3453 | snp__genome_wide_snp_6__broad_mit_edu__Level_2__birdseed_genotype__birdseed | Analyte Replicate Filter | TCGA-AK-3453-10A-01D-0858-01 | TCGA-AK-3453-10A-01D-1274-01 |
| TCGA-AK-3426 | snp__genome_wide_snp_6__broad_mit_edu__Level_2__birdseed_genotype__birdseed | Analyte Replicate Filter | TCGA-AK-3426-01A-01D-1185-01 | TCGA-AK-3426-01A-02D-1322-01 |
| TCGA-B8-4620 | snp__genome_wide_snp_6__broad_mit_edu__Level_2__birdseed_genotype__birdseed | Analyte Replicate Filter | TCGA-B8-4620-01A-01D-1185-01,TCGA-B8-4620-01A-02D-1322-01 | TCGA-B8-4620-01A-01D-1549-01 |
| TCGA-CJ-4639 | snp__genome_wide_snp_6__broad_mit_edu__Level_2__byallele_copynumber__data | Analyte Replicate Filter | TCGA-CJ-4639-01A-01D-1185-01 | TCGA-CJ-4639-01A-02D-1322-01 |
| TCGA-CJ-4636 | snp__genome_wide_snp_6__broad_mit_edu__Level_2__byallele_copynumber__data | Analyte Replicate Filter | TCGA-CJ-4636-01A-01D-1185-01 | TCGA-CJ-4636-01A-02D-1322-01 |
| TCGA-A3-3331 | snp__genome_wide_snp_6__broad_mit_edu__Level_2__byallele_copynumber__data | Analyte Replicate Filter | TCGA-A3-3331-01A-01D-0858-01 | TCGA-A3-3331-01A-02D-1322-01 |
| TCGA-A3-3324 | snp__genome_wide_snp_6__broad_mit_edu__Level_2__byallele_copynumber__data | Analyte Replicate Filter | TCGA-A3-3324-01A-01D-0858-01 | TCGA-A3-3324-01A-02D-1322-01 |
| TCGA-A3-3351 | snp__genome_wide_snp_6__broad_mit_edu__Level_2__byallele_copynumber__data | Analyte Replicate Filter | TCGA-A3-3351-01A-01D-1185-01 | TCGA-A3-3351-01A-02D-1322-01 |
| TCGA-BP-4163 | snp__genome_wide_snp_6__broad_mit_edu__Level_2__byallele_copynumber__data | Analyte Replicate Filter | TCGA-BP-4163-01A-01D-1185-01 | TCGA-BP-4163-01A-02D-1322-01 |
| TCGA-A3-3317 | snp__genome_wide_snp_6__broad_mit_edu__Level_2__byallele_copynumber__data | Analyte Replicate Filter | TCGA-A3-3317-01A-01D-0858-01 | TCGA-A3-3317-01A-02D-1322-01 |
| TCGA-AK-3465 | snp__genome_wide_snp_6__broad_mit_edu__Level_2__byallele_copynumber__data | Analyte Replicate Filter | TCGA-AK-3465-01A-01D-0858-01 | TCGA-AK-3465-01A-02D-1322-01 |
| TCGA-AK-3436 | snp__genome_wide_snp_6__broad_mit_edu__Level_2__byallele_copynumber__data | Analyte Replicate Filter | TCGA-AK-3436-01A-01D-1185-01 | TCGA-AK-3436-01A-02D-1322-01 |
| TCGA-BP-4162 | snp__genome_wide_snp_6__broad_mit_edu__Level_2__byallele_copynumber__data | Analyte Replicate Filter | TCGA-BP-4162-01A-01D-1185-01 | TCGA-BP-4162-01A-02D-1322-01 |
| TCGA-BP-4167 | snp__genome_wide_snp_6__broad_mit_edu__Level_2__byallele_copynumber__data | Analyte Replicate Filter | TCGA-BP-4167-01A-01D-1185-01 | TCGA-BP-4167-01A-02D-1322-01 |
| TCGA-B2-3923 | snp__genome_wide_snp_6__broad_mit_edu__Level_2__byallele_copynumber__data | Analyte Replicate Filter | TCGA-B2-3923-01A-01D-1185-01 | TCGA-B2-3923-01A-02D-1322-01 |
| TCGA-CJ-4638 | snp__genome_wide_snp_6__broad_mit_edu__Level_2__byallele_copynumber__data | Analyte Replicate Filter | TCGA-CJ-4638-01A-01D-1185-01 | TCGA-CJ-4638-01A-02D-1322-01 |
| TCGA-A3-3347 | snp__genome_wide_snp_6__broad_mit_edu__Level_2__byallele_copynumber__data | Analyte Replicate Filter | TCGA-A3-3347-01A-01D-1185-01 | TCGA-A3-3347-01A-02D-1322-01 |
| TCGA-AK-3440 | snp__genome_wide_snp_6__broad_mit_edu__Level_2__byallele_copynumber__data | Analyte Replicate Filter | TCGA-AK-3440-01A-01D-0858-01 | TCGA-AK-3440-01A-02D-1274-01 |
| TCGA-CJ-4644 | snp__genome_wide_snp_6__broad_mit_edu__Level_2__byallele_copynumber__data | Analyte Replicate Filter | TCGA-CJ-4644-01A-01D-1185-01 | TCGA-CJ-4644-01A-02D-1322-01 |
| TCGA-B2-5633 | snp__genome_wide_snp_6__broad_mit_edu__Level_2__byallele_copynumber__data | Analyte Replicate Filter | TCGA-B2-5633-01A-01D-1530-01 | TCGA-B2-5633-01B-04D-A274-01 |
| TCGA-A3-3319 | snp__genome_wide_snp_6__broad_mit_edu__Level_2__byallele_copynumber__data | Analyte Replicate Filter | TCGA-A3-3319-01A-01D-0858-01 | TCGA-A3-3319-01A-02D-1322-01 |
| TCGA-CJ-4643 | snp__genome_wide_snp_6__broad_mit_edu__Level_2__byallele_copynumber__data | Analyte Replicate Filter | TCGA-CJ-4643-01A-01D-1185-01 | TCGA-CJ-4643-01A-02D-1322-01 |
| TCGA-B8-4619 | snp__genome_wide_snp_6__broad_mit_edu__Level_2__byallele_copynumber__data | Analyte Replicate Filter | TCGA-B8-4619-01A-01D-1185-01,TCGA-B8-4619-01A-02D-1322-01 | TCGA-B8-4619-01A-02D-1549-01 |
| TCGA-A3-3383 | snp__genome_wide_snp_6__broad_mit_edu__Level_2__byallele_copynumber__data | Analyte Replicate Filter | TCGA-A3-3383-01A-01D-0858-01 | TCGA-A3-3383-01A-02D-1322-01 |
| TCGA-AK-3456 | snp__genome_wide_snp_6__broad_mit_edu__Level_2__byallele_copynumber__data | Analyte Replicate Filter | TCGA-AK-3456-01A-01D-1185-01 | TCGA-AK-3456-01A-02D-1322-01 |
| TCGA-A3-3311 | snp__genome_wide_snp_6__broad_mit_edu__Level_2__byallele_copynumber__data | Analyte Replicate Filter | TCGA-A3-3311-01A-01D-0858-01 | TCGA-A3-3311-01A-02D-1322-01 |
| TCGA-A3-3322 | snp__genome_wide_snp_6__broad_mit_edu__Level_2__byallele_copynumber__data | Analyte Replicate Filter | TCGA-A3-3322-01A-01D-0858-01 | TCGA-A3-3322-01A-02D-1322-01 |
| TCGA-BP-4161 | snp__genome_wide_snp_6__broad_mit_edu__Level_2__byallele_copynumber__data | Analyte Replicate Filter | TCGA-BP-4161-01A-01D-1185-01 | TCGA-BP-4161-01A-02D-1322-01 |
| TCGA-A3-3320 | snp__genome_wide_snp_6__broad_mit_edu__Level_2__byallele_copynumber__data | Analyte Replicate Filter | TCGA-A3-3320-01A-01D-0858-01 | TCGA-A3-3320-01A-02D-1322-01 |
| TCGA-B2-3924 | snp__genome_wide_snp_6__broad_mit_edu__Level_2__byallele_copynumber__data | Analyte Replicate Filter | TCGA-B2-3924-01A-01D-1185-01 | TCGA-B2-3924-01B-03D-A274-01 |
| TCGA-CJ-4640 | snp__genome_wide_snp_6__broad_mit_edu__Level_2__byallele_copynumber__data | Analyte Replicate Filter | TCGA-CJ-4640-01A-01D-1185-01 | TCGA-CJ-4640-01A-02D-1322-01 |
| TCGA-A3-3313 | snp__genome_wide_snp_6__broad_mit_edu__Level_2__byallele_copynumber__data | Analyte Replicate Filter | TCGA-A3-3313-01A-01D-0858-01 | TCGA-A3-3313-01A-02D-1322-01 |
| TCGA-AK-3453 | snp__genome_wide_snp_6__broad_mit_edu__Level_2__byallele_copynumber__data | Analyte Replicate Filter | TCGA-AK-3453-01A-01D-0858-01 | TCGA-AK-3453-01A-02D-1274-01 |
| TCGA-CJ-4641 | snp__genome_wide_snp_6__broad_mit_edu__Level_2__byallele_copynumber__data | Analyte Replicate Filter | TCGA-CJ-4641-01A-01D-1185-01 | TCGA-CJ-4641-01A-02D-1322-01 |
| TCGA-B2-4102 | snp__genome_wide_snp_6__broad_mit_edu__Level_2__byallele_copynumber__data | Analyte Replicate Filter | TCGA-B2-4102-01A-01D-1185-01 | TCGA-B2-4102-01A-02D-1322-01 |
| TCGA-B8-4148 | snp__genome_wide_snp_6__broad_mit_edu__Level_2__byallele_copynumber__data | Analyte Replicate Filter | TCGA-B8-4148-01A-01D-1185-01 | TCGA-B8-4148-01A-02D-1322-01 |
| TCGA-A3-3362 | snp__genome_wide_snp_6__broad_mit_edu__Level_2__byallele_copynumber__data | Analyte Replicate Filter | TCGA-A3-3362-01A-01D-1185-01 | TCGA-A3-3362-01A-02D-1322-01 |
| TCGA-A3-3308 | snp__genome_wide_snp_6__broad_mit_edu__Level_2__byallele_copynumber__data | Analyte Replicate Filter | TCGA-A3-3308-01A-01D-0858-01 | TCGA-A3-3308-01A-02D-1322-01 |
| TCGA-BP-4164 | snp__genome_wide_snp_6__broad_mit_edu__Level_2__byallele_copynumber__data | Analyte Replicate Filter | TCGA-BP-4164-01A-01D-1185-01 | TCGA-BP-4164-01A-02D-1322-01 |
| TCGA-A3-3372 | snp__genome_wide_snp_6__broad_mit_edu__Level_2__byallele_copynumber__data | Analyte Replicate Filter | TCGA-A3-3372-01A-01D-0858-01 | TCGA-A3-3372-01A-02D-1322-01 |
| TCGA-B2-5635 | snp__genome_wide_snp_6__broad_mit_edu__Level_2__byallele_copynumber__data | Analyte Replicate Filter | TCGA-B2-5635-01A-01D-1530-01 | TCGA-B2-5635-01B-04D-A274-01 |
| TCGA-AK-3429 | snp__genome_wide_snp_6__broad_mit_edu__Level_2__byallele_copynumber__data | Analyte Replicate Filter | TCGA-AK-3429-01A-01D-1185-01 | TCGA-AK-3429-01A-02D-1322-01 |
| TCGA-AK-3444 | snp__genome_wide_snp_6__broad_mit_edu__Level_2__byallele_copynumber__data | Analyte Replicate Filter | TCGA-AK-3444-01A-01D-0858-01 | TCGA-AK-3444-01A-02D-1322-01 |
| TCGA-B2-4098 | snp__genome_wide_snp_6__broad_mit_edu__Level_2__byallele_copynumber__data | Analyte Replicate Filter | TCGA-B2-4098-01A-01D-1185-01 | TCGA-B2-4098-01A-02D-1322-01 |
| TCGA-CJ-4634 | snp__genome_wide_snp_6__broad_mit_edu__Level_2__byallele_copynumber__data | Analyte Replicate Filter | TCGA-CJ-4634-01A-01D-1185-01 | TCGA-CJ-4634-01A-02D-1322-01 |
| TCGA-AK-3443 | snp__genome_wide_snp_6__broad_mit_edu__Level_2__byallele_copynumber__data | Analyte Replicate Filter | TCGA-AK-3443-01A-01D-0858-01 | TCGA-AK-3443-01A-02D-1322-01 |
| TCGA-A3-3323 | snp__genome_wide_snp_6__broad_mit_edu__Level_2__byallele_copynumber__data | Analyte Replicate Filter | TCGA-A3-3323-01A-01D-0858-01 | TCGA-A3-3323-01A-02D-1322-01 |
| TCGA-B8-4622 | snp__genome_wide_snp_6__broad_mit_edu__Level_2__byallele_copynumber__data | Analyte Replicate Filter | TCGA-B8-4622-01A-02D-1274-01 | TCGA-B8-4622-01A-02D-1549-01 |
| TCGA-A3-3374 | snp__genome_wide_snp_6__broad_mit_edu__Level_2__byallele_copynumber__data | Analyte Replicate Filter | TCGA-A3-3374-01A-01D-0858-01 | TCGA-A3-3374-01A-02D-1322-01 |
| TCGA-A3-3382 | snp__genome_wide_snp_6__broad_mit_edu__Level_2__byallele_copynumber__data | Analyte Replicate Filter | TCGA-A3-3382-01A-01D-0858-01 | TCGA-A3-3382-01A-02D-1322-01 |
| TCGA-A3-3378 | snp__genome_wide_snp_6__broad_mit_edu__Level_2__byallele_copynumber__data | Analyte Replicate Filter | TCGA-A3-3378-01A-01D-0858-01 | TCGA-A3-3378-01A-02D-1322-01 |
| TCGA-CJ-4637 | snp__genome_wide_snp_6__broad_mit_edu__Level_2__byallele_copynumber__data | Analyte Replicate Filter | TCGA-CJ-4637-01A-01D-1185-01 | TCGA-CJ-4637-01A-02D-1322-01 |
| TCGA-AK-3453 | snp__genome_wide_snp_6__broad_mit_edu__Level_2__byallele_copynumber__data | Analyte Replicate Filter | TCGA-AK-3453-10A-01D-0858-01 | TCGA-AK-3453-10A-01D-1274-01 |
| TCGA-AK-3426 | snp__genome_wide_snp_6__broad_mit_edu__Level_2__byallele_copynumber__data | Analyte Replicate Filter | TCGA-AK-3426-01A-01D-1185-01 | TCGA-AK-3426-01A-02D-1322-01 |
| TCGA-B8-4620 | snp__genome_wide_snp_6__broad_mit_edu__Level_2__byallele_copynumber__data | Analyte Replicate Filter | TCGA-B8-4620-01A-01D-1185-01,TCGA-B8-4620-01A-02D-1322-01 | TCGA-B8-4620-01A-01D-1549-01 |
| TCGA-CJ-4639 | snp__genome_wide_snp_6__broad_mit_edu__Level_2__copynumber_byallele__data | Analyte Replicate Filter | TCGA-CJ-4639-01A-01D-1185-01 | TCGA-CJ-4639-01A-02D-1322-01 |
| TCGA-A3-3324 | snp__genome_wide_snp_6__broad_mit_edu__Level_2__copynumber_byallele__data | Analyte Replicate Filter | TCGA-A3-3324-01A-01D-0858-01 | TCGA-A3-3324-01A-02D-1322-01 |
| TCGA-A3-3331 | snp__genome_wide_snp_6__broad_mit_edu__Level_2__copynumber_byallele__data | Analyte Replicate Filter | TCGA-A3-3331-01A-01D-0858-01 | TCGA-A3-3331-01A-02D-1322-01 |
| TCGA-CJ-4637 | snp__genome_wide_snp_6__broad_mit_edu__Level_2__copynumber_byallele__data | Analyte Replicate Filter | TCGA-CJ-4637-01A-01D-1185-01 | TCGA-CJ-4637-01A-02D-1322-01 |
| TCGA-BP-4161 | snp__genome_wide_snp_6__broad_mit_edu__Level_2__copynumber_byallele__data | Analyte Replicate Filter | TCGA-BP-4161-01A-01D-1185-01 | TCGA-BP-4161-01A-02D-1322-01 |
| TCGA-B8-4148 | snp__genome_wide_snp_6__broad_mit_edu__Level_2__copynumber_byallele__data | Analyte Replicate Filter | TCGA-B8-4148-01A-01D-1185-01 | TCGA-B8-4148-01A-02D-1322-01 |
| TCGA-A3-3362 | snp__genome_wide_snp_6__broad_mit_edu__Level_2__copynumber_byallele__data | Analyte Replicate Filter | TCGA-A3-3362-01A-01D-1185-01 | TCGA-A3-3362-01A-02D-1322-01 |
| TCGA-BP-4163 | snp__genome_wide_snp_6__broad_mit_edu__Level_2__copynumber_byallele__data | Analyte Replicate Filter | TCGA-BP-4163-01A-01D-1185-01 | TCGA-BP-4163-01A-02D-1322-01 |
| TCGA-A3-3317 | snp__genome_wide_snp_6__broad_mit_edu__Level_2__copynumber_byallele__data | Analyte Replicate Filter | TCGA-A3-3317-01A-01D-0858-01 | TCGA-A3-3317-01A-02D-1322-01 |
| TCGA-AK-3436 | snp__genome_wide_snp_6__broad_mit_edu__Level_2__copynumber_byallele__data | Analyte Replicate Filter | TCGA-AK-3436-01A-01D-1185-01 | TCGA-AK-3436-01A-02D-1322-01 |
| TCGA-BP-4162 | snp__genome_wide_snp_6__broad_mit_edu__Level_2__copynumber_byallele__data | Analyte Replicate Filter | TCGA-BP-4162-01A-01D-1185-01 | TCGA-BP-4162-01A-02D-1322-01 |
| TCGA-BP-4164 | snp__genome_wide_snp_6__broad_mit_edu__Level_2__copynumber_byallele__data | Analyte Replicate Filter | TCGA-BP-4164-01A-01D-1185-01 | TCGA-BP-4164-01A-02D-1322-01 |
| TCGA-B2-3923 | snp__genome_wide_snp_6__broad_mit_edu__Level_2__copynumber_byallele__data | Analyte Replicate Filter | TCGA-B2-3923-01A-01D-1185-01 | TCGA-B2-3923-01A-02D-1322-01 |
| TCGA-BP-4167 | snp__genome_wide_snp_6__broad_mit_edu__Level_2__copynumber_byallele__data | Analyte Replicate Filter | TCGA-BP-4167-01A-01D-1185-01 | TCGA-BP-4167-01A-02D-1322-01 |
| TCGA-A3-3347 | snp__genome_wide_snp_6__broad_mit_edu__Level_2__copynumber_byallele__data | Analyte Replicate Filter | TCGA-A3-3347-01A-01D-1185-01 | TCGA-A3-3347-01A-02D-1322-01 |
| TCGA-AK-3440 | snp__genome_wide_snp_6__broad_mit_edu__Level_2__copynumber_byallele__data | Analyte Replicate Filter | TCGA-AK-3440-01A-01D-0858-01 | TCGA-AK-3440-01A-02D-1274-01 |
| TCGA-CJ-4644 | snp__genome_wide_snp_6__broad_mit_edu__Level_2__copynumber_byallele__data | Analyte Replicate Filter | TCGA-CJ-4644-01A-01D-1185-01 | TCGA-CJ-4644-01A-02D-1322-01 |
| TCGA-AK-3465 | snp__genome_wide_snp_6__broad_mit_edu__Level_2__copynumber_byallele__data | Analyte Replicate Filter | TCGA-AK-3465-01A-01D-0858-01 | TCGA-AK-3465-01A-02D-1322-01 |
| TCGA-A3-3319 | snp__genome_wide_snp_6__broad_mit_edu__Level_2__copynumber_byallele__data | Analyte Replicate Filter | TCGA-A3-3319-01A-01D-0858-01 | TCGA-A3-3319-01A-02D-1322-01 |
| TCGA-CJ-4643 | snp__genome_wide_snp_6__broad_mit_edu__Level_2__copynumber_byallele__data | Analyte Replicate Filter | TCGA-CJ-4643-01A-01D-1185-01 | TCGA-CJ-4643-01A-02D-1322-01 |
| TCGA-B8-4619 | snp__genome_wide_snp_6__broad_mit_edu__Level_2__copynumber_byallele__data | Analyte Replicate Filter | TCGA-B8-4619-01A-01D-1185-01,TCGA-B8-4619-01A-02D-1322-01 | TCGA-B8-4619-01A-02D-1549-01 |
| TCGA-A3-3383 | snp__genome_wide_snp_6__broad_mit_edu__Level_2__copynumber_byallele__data | Analyte Replicate Filter | TCGA-A3-3383-01A-01D-0858-01 | TCGA-A3-3383-01A-02D-1322-01 |
| TCGA-AK-3456 | snp__genome_wide_snp_6__broad_mit_edu__Level_2__copynumber_byallele__data | Analyte Replicate Filter | TCGA-AK-3456-01A-01D-1185-01 | TCGA-AK-3456-01A-02D-1322-01 |
| TCGA-A3-3311 | snp__genome_wide_snp_6__broad_mit_edu__Level_2__copynumber_byallele__data | Analyte Replicate Filter | TCGA-A3-3311-01A-01D-0858-01 | TCGA-A3-3311-01A-02D-1322-01 |
| TCGA-A3-3351 | snp__genome_wide_snp_6__broad_mit_edu__Level_2__copynumber_byallele__data | Analyte Replicate Filter | TCGA-A3-3351-01A-01D-1185-01 | TCGA-A3-3351-01A-02D-1322-01 |
| TCGA-A3-3320 | snp__genome_wide_snp_6__broad_mit_edu__Level_2__copynumber_byallele__data | Analyte Replicate Filter | TCGA-A3-3320-01A-01D-0858-01 | TCGA-A3-3320-01A-02D-1322-01 |
| TCGA-CJ-4640 | snp__genome_wide_snp_6__broad_mit_edu__Level_2__copynumber_byallele__data | Analyte Replicate Filter | TCGA-CJ-4640-01A-01D-1185-01 | TCGA-CJ-4640-01A-02D-1322-01 |
| TCGA-A3-3313 | snp__genome_wide_snp_6__broad_mit_edu__Level_2__copynumber_byallele__data | Analyte Replicate Filter | TCGA-A3-3313-01A-01D-0858-01 | TCGA-A3-3313-01A-02D-1322-01 |
| TCGA-AK-3453 | snp__genome_wide_snp_6__broad_mit_edu__Level_2__copynumber_byallele__data | Analyte Replicate Filter | TCGA-AK-3453-01A-01D-0858-01 | TCGA-AK-3453-01A-02D-1274-01 |
| TCGA-CJ-4638 | snp__genome_wide_snp_6__broad_mit_edu__Level_2__copynumber_byallele__data | Analyte Replicate Filter | TCGA-CJ-4638-01A-01D-1185-01 | TCGA-CJ-4638-01A-02D-1322-01 |
| TCGA-CJ-4641 | snp__genome_wide_snp_6__broad_mit_edu__Level_2__copynumber_byallele__data | Analyte Replicate Filter | TCGA-CJ-4641-01A-01D-1185-01 | TCGA-CJ-4641-01A-02D-1322-01 |
| TCGA-B2-4102 | snp__genome_wide_snp_6__broad_mit_edu__Level_2__copynumber_byallele__data | Analyte Replicate Filter | TCGA-B2-4102-01A-01D-1185-01 | TCGA-B2-4102-01A-02D-1322-01 |
| TCGA-CJ-4636 | snp__genome_wide_snp_6__broad_mit_edu__Level_2__copynumber_byallele__data | Analyte Replicate Filter | TCGA-CJ-4636-01A-01D-1185-01 | TCGA-CJ-4636-01A-02D-1322-01 |
| TCGA-A3-3308 | snp__genome_wide_snp_6__broad_mit_edu__Level_2__copynumber_byallele__data | Analyte Replicate Filter | TCGA-A3-3308-01A-01D-0858-01 | TCGA-A3-3308-01A-02D-1322-01 |
| TCGA-A3-3372 | snp__genome_wide_snp_6__broad_mit_edu__Level_2__copynumber_byallele__data | Analyte Replicate Filter | TCGA-A3-3372-01A-01D-0858-01 | TCGA-A3-3372-01A-02D-1322-01 |
| TCGA-AK-3429 | snp__genome_wide_snp_6__broad_mit_edu__Level_2__copynumber_byallele__data | Analyte Replicate Filter | TCGA-AK-3429-01A-01D-1185-01 | TCGA-AK-3429-01A-02D-1322-01 |
| TCGA-AK-3444 | snp__genome_wide_snp_6__broad_mit_edu__Level_2__copynumber_byallele__data | Analyte Replicate Filter | TCGA-AK-3444-01A-01D-0858-01 | TCGA-AK-3444-01A-02D-1322-01 |
| TCGA-B2-4098 | snp__genome_wide_snp_6__broad_mit_edu__Level_2__copynumber_byallele__data | Analyte Replicate Filter | TCGA-B2-4098-01A-01D-1185-01 | TCGA-B2-4098-01A-02D-1322-01 |
| TCGA-CJ-4634 | snp__genome_wide_snp_6__broad_mit_edu__Level_2__copynumber_byallele__data | Analyte Replicate Filter | TCGA-CJ-4634-01A-01D-1185-01 | TCGA-CJ-4634-01A-02D-1322-01 |
| TCGA-AK-3443 | snp__genome_wide_snp_6__broad_mit_edu__Level_2__copynumber_byallele__data | Analyte Replicate Filter | TCGA-AK-3443-01A-01D-0858-01 | TCGA-AK-3443-01A-02D-1322-01 |
| TCGA-A3-3323 | snp__genome_wide_snp_6__broad_mit_edu__Level_2__copynumber_byallele__data | Analyte Replicate Filter | TCGA-A3-3323-01A-01D-0858-01 | TCGA-A3-3323-01A-02D-1322-01 |
| TCGA-B8-4622 | snp__genome_wide_snp_6__broad_mit_edu__Level_2__copynumber_byallele__data | Analyte Replicate Filter | TCGA-B8-4622-01A-02D-1274-01 | TCGA-B8-4622-01A-02D-1549-01 |
| TCGA-A3-3374 | snp__genome_wide_snp_6__broad_mit_edu__Level_2__copynumber_byallele__data | Analyte Replicate Filter | TCGA-A3-3374-01A-01D-0858-01 | TCGA-A3-3374-01A-02D-1322-01 |
| TCGA-A3-3382 | snp__genome_wide_snp_6__broad_mit_edu__Level_2__copynumber_byallele__data | Analyte Replicate Filter | TCGA-A3-3382-01A-01D-0858-01 | TCGA-A3-3382-01A-02D-1322-01 |
| TCGA-A3-3378 | snp__genome_wide_snp_6__broad_mit_edu__Level_2__copynumber_byallele__data | Analyte Replicate Filter | TCGA-A3-3378-01A-01D-0858-01 | TCGA-A3-3378-01A-02D-1322-01 |
| TCGA-AK-3453 | snp__genome_wide_snp_6__broad_mit_edu__Level_2__copynumber_byallele__data | Analyte Replicate Filter | TCGA-AK-3453-10A-01D-0858-01 | TCGA-AK-3453-10A-01D-1274-01 |
| TCGA-AK-3426 | snp__genome_wide_snp_6__broad_mit_edu__Level_2__copynumber_byallele__data | Analyte Replicate Filter | TCGA-AK-3426-01A-01D-1185-01 | TCGA-AK-3426-01A-02D-1322-01 |
| TCGA-B8-4620 | snp__genome_wide_snp_6__broad_mit_edu__Level_2__copynumber_byallele__data | Analyte Replicate Filter | TCGA-B8-4620-01A-01D-1185-01,TCGA-B8-4620-01A-02D-1322-01 | TCGA-B8-4620-01A-01D-1549-01 |
| TCGA-A3-3322 | snp__genome_wide_snp_6__broad_mit_edu__Level_2__copynumber_byallele__data | Analyte Replicate Filter | TCGA-A3-3322-01A-01D-0858-01 | TCGA-A3-3322-01A-02D-1322-01 |
| TCGA-CJ-4639 | snp__genome_wide_snp_6__broad_mit_edu__Level_1__image_acquisition__data | Analyte Replicate Filter | TCGA-CJ-4639-01A-01D-1185-01 | TCGA-CJ-4639-01A-02D-1322-01 |
| TCGA-A3-3324 | snp__genome_wide_snp_6__broad_mit_edu__Level_1__image_acquisition__data | Analyte Replicate Filter | TCGA-A3-3324-01A-01D-0858-01 | TCGA-A3-3324-01A-02D-1322-01 |
| TCGA-A3-3331 | snp__genome_wide_snp_6__broad_mit_edu__Level_1__image_acquisition__data | Analyte Replicate Filter | TCGA-A3-3331-01A-01D-0858-01 | TCGA-A3-3331-01A-02D-1322-01 |
| TCGA-CJ-4637 | snp__genome_wide_snp_6__broad_mit_edu__Level_1__image_acquisition__data | Analyte Replicate Filter | TCGA-CJ-4637-01A-01D-1185-01 | TCGA-CJ-4637-01A-02D-1322-01 |
| TCGA-BP-4161 | snp__genome_wide_snp_6__broad_mit_edu__Level_1__image_acquisition__data | Analyte Replicate Filter | TCGA-BP-4161-01A-01D-1185-01 | TCGA-BP-4161-01A-02D-1322-01 |
| TCGA-B8-4148 | snp__genome_wide_snp_6__broad_mit_edu__Level_1__image_acquisition__data | Analyte Replicate Filter | TCGA-B8-4148-01A-01D-1185-01 | TCGA-B8-4148-01A-02D-1322-01 |
| TCGA-A3-3362 | snp__genome_wide_snp_6__broad_mit_edu__Level_1__image_acquisition__data | Analyte Replicate Filter | TCGA-A3-3362-01A-01D-1185-01 | TCGA-A3-3362-01A-02D-1322-01 |
| TCGA-BP-4163 | snp__genome_wide_snp_6__broad_mit_edu__Level_1__image_acquisition__data | Analyte Replicate Filter | TCGA-BP-4163-01A-01D-1185-01 | TCGA-BP-4163-01A-02D-1322-01 |
| TCGA-A3-3317 | snp__genome_wide_snp_6__broad_mit_edu__Level_1__image_acquisition__data | Analyte Replicate Filter | TCGA-A3-3317-01A-01D-0858-01 | TCGA-A3-3317-01A-02D-1322-01 |
| TCGA-AK-3436 | snp__genome_wide_snp_6__broad_mit_edu__Level_1__image_acquisition__data | Analyte Replicate Filter | TCGA-AK-3436-01A-01D-1185-01 | TCGA-AK-3436-01A-02D-1322-01 |
| TCGA-BP-4162 | snp__genome_wide_snp_6__broad_mit_edu__Level_1__image_acquisition__data | Analyte Replicate Filter | TCGA-BP-4162-01A-01D-1185-01 | TCGA-BP-4162-01A-02D-1322-01 |
| TCGA-BP-4164 | snp__genome_wide_snp_6__broad_mit_edu__Level_1__image_acquisition__data | Analyte Replicate Filter | TCGA-BP-4164-01A-01D-1185-01 | TCGA-BP-4164-01A-02D-1322-01 |
| TCGA-B2-3923 | snp__genome_wide_snp_6__broad_mit_edu__Level_1__image_acquisition__data | Analyte Replicate Filter | TCGA-B2-3923-01A-01D-1185-01 | TCGA-B2-3923-01A-02D-1322-01 |
| TCGA-BP-4167 | snp__genome_wide_snp_6__broad_mit_edu__Level_1__image_acquisition__data | Analyte Replicate Filter | TCGA-BP-4167-01A-01D-1185-01 | TCGA-BP-4167-01A-02D-1322-01 |
| TCGA-A3-3347 | snp__genome_wide_snp_6__broad_mit_edu__Level_1__image_acquisition__data | Analyte Replicate Filter | TCGA-A3-3347-01A-01D-1185-01 | TCGA-A3-3347-01A-02D-1322-01 |
| TCGA-AK-3440 | snp__genome_wide_snp_6__broad_mit_edu__Level_1__image_acquisition__data | Analyte Replicate Filter | TCGA-AK-3440-01A-01D-0858-01 | TCGA-AK-3440-01A-02D-1274-01 |
| TCGA-CJ-4644 | snp__genome_wide_snp_6__broad_mit_edu__Level_1__image_acquisition__data | Analyte Replicate Filter | TCGA-CJ-4644-01A-01D-1185-01 | TCGA-CJ-4644-01A-02D-1322-01 |
| TCGA-AK-3465 | snp__genome_wide_snp_6__broad_mit_edu__Level_1__image_acquisition__data | Analyte Replicate Filter | TCGA-AK-3465-01A-01D-0858-01 | TCGA-AK-3465-01A-02D-1322-01 |
| TCGA-A3-3319 | snp__genome_wide_snp_6__broad_mit_edu__Level_1__image_acquisition__data | Analyte Replicate Filter | TCGA-A3-3319-01A-01D-0858-01 | TCGA-A3-3319-01A-02D-1322-01 |
| TCGA-CJ-4643 | snp__genome_wide_snp_6__broad_mit_edu__Level_1__image_acquisition__data | Analyte Replicate Filter | TCGA-CJ-4643-01A-01D-1185-01 | TCGA-CJ-4643-01A-02D-1322-01 |
| TCGA-B8-4619 | snp__genome_wide_snp_6__broad_mit_edu__Level_1__image_acquisition__data | Analyte Replicate Filter | TCGA-B8-4619-01A-01D-1185-01,TCGA-B8-4619-01A-02D-1322-01 | TCGA-B8-4619-01A-02D-1549-01 |
| TCGA-A3-3383 | snp__genome_wide_snp_6__broad_mit_edu__Level_1__image_acquisition__data | Analyte Replicate Filter | TCGA-A3-3383-01A-01D-0858-01 | TCGA-A3-3383-01A-02D-1322-01 |
| TCGA-AK-3456 | snp__genome_wide_snp_6__broad_mit_edu__Level_1__image_acquisition__data | Analyte Replicate Filter | TCGA-AK-3456-01A-01D-1185-01 | TCGA-AK-3456-01A-02D-1322-01 |
| TCGA-A3-3311 | snp__genome_wide_snp_6__broad_mit_edu__Level_1__image_acquisition__data | Analyte Replicate Filter | TCGA-A3-3311-01A-01D-0858-01 | TCGA-A3-3311-01A-02D-1322-01 |
| TCGA-A3-3351 | snp__genome_wide_snp_6__broad_mit_edu__Level_1__image_acquisition__data | Analyte Replicate Filter | TCGA-A3-3351-01A-01D-1185-01 | TCGA-A3-3351-01A-02D-1322-01 |
| TCGA-A3-3320 | snp__genome_wide_snp_6__broad_mit_edu__Level_1__image_acquisition__data | Analyte Replicate Filter | TCGA-A3-3320-01A-01D-0858-01 | TCGA-A3-3320-01A-02D-1322-01 |
| TCGA-CJ-4640 | snp__genome_wide_snp_6__broad_mit_edu__Level_1__image_acquisition__data | Analyte Replicate Filter | TCGA-CJ-4640-01A-01D-1185-01 | TCGA-CJ-4640-01A-02D-1322-01 |
| TCGA-A3-3313 | snp__genome_wide_snp_6__broad_mit_edu__Level_1__image_acquisition__data | Analyte Replicate Filter | TCGA-A3-3313-01A-01D-0858-01 | TCGA-A3-3313-01A-02D-1322-01 |
| TCGA-AK-3453 | snp__genome_wide_snp_6__broad_mit_edu__Level_1__image_acquisition__data | Analyte Replicate Filter | TCGA-AK-3453-01A-01D-0858-01 | TCGA-AK-3453-01A-02D-1274-01 |
| TCGA-CJ-4638 | snp__genome_wide_snp_6__broad_mit_edu__Level_1__image_acquisition__data | Analyte Replicate Filter | TCGA-CJ-4638-01A-01D-1185-01 | TCGA-CJ-4638-01A-02D-1322-01 |
| TCGA-CJ-4641 | snp__genome_wide_snp_6__broad_mit_edu__Level_1__image_acquisition__data | Analyte Replicate Filter | TCGA-CJ-4641-01A-01D-1185-01 | TCGA-CJ-4641-01A-02D-1322-01 |
| TCGA-B2-4102 | snp__genome_wide_snp_6__broad_mit_edu__Level_1__image_acquisition__data | Analyte Replicate Filter | TCGA-B2-4102-01A-01D-1185-01 | TCGA-B2-4102-01A-02D-1322-01 |
| TCGA-CJ-4636 | snp__genome_wide_snp_6__broad_mit_edu__Level_1__image_acquisition__data | Analyte Replicate Filter | TCGA-CJ-4636-01A-01D-1185-01 | TCGA-CJ-4636-01A-02D-1322-01 |
| TCGA-A3-3308 | snp__genome_wide_snp_6__broad_mit_edu__Level_1__image_acquisition__data | Analyte Replicate Filter | TCGA-A3-3308-01A-01D-0858-01 | TCGA-A3-3308-01A-02D-1322-01 |
| TCGA-A3-3372 | snp__genome_wide_snp_6__broad_mit_edu__Level_1__image_acquisition__data | Analyte Replicate Filter | TCGA-A3-3372-01A-01D-0858-01 | TCGA-A3-3372-01A-02D-1322-01 |
| TCGA-AK-3429 | snp__genome_wide_snp_6__broad_mit_edu__Level_1__image_acquisition__data | Analyte Replicate Filter | TCGA-AK-3429-01A-01D-1185-01 | TCGA-AK-3429-01A-02D-1322-01 |
| TCGA-AK-3444 | snp__genome_wide_snp_6__broad_mit_edu__Level_1__image_acquisition__data | Analyte Replicate Filter | TCGA-AK-3444-01A-01D-0858-01 | TCGA-AK-3444-01A-02D-1322-01 |
| TCGA-B2-4098 | snp__genome_wide_snp_6__broad_mit_edu__Level_1__image_acquisition__data | Analyte Replicate Filter | TCGA-B2-4098-01A-01D-1185-01 | TCGA-B2-4098-01A-02D-1322-01 |
| TCGA-CJ-4634 | snp__genome_wide_snp_6__broad_mit_edu__Level_1__image_acquisition__data | Analyte Replicate Filter | TCGA-CJ-4634-01A-01D-1185-01 | TCGA-CJ-4634-01A-02D-1322-01 |
| TCGA-AK-3443 | snp__genome_wide_snp_6__broad_mit_edu__Level_1__image_acquisition__data | Analyte Replicate Filter | TCGA-AK-3443-01A-01D-0858-01 | TCGA-AK-3443-01A-02D-1322-01 |
| TCGA-A3-3323 | snp__genome_wide_snp_6__broad_mit_edu__Level_1__image_acquisition__data | Analyte Replicate Filter | TCGA-A3-3323-01A-01D-0858-01 | TCGA-A3-3323-01A-02D-1322-01 |
| TCGA-B8-4622 | snp__genome_wide_snp_6__broad_mit_edu__Level_1__image_acquisition__data | Analyte Replicate Filter | TCGA-B8-4622-01A-02D-1274-01 | TCGA-B8-4622-01A-02D-1549-01 |
| TCGA-A3-3374 | snp__genome_wide_snp_6__broad_mit_edu__Level_1__image_acquisition__data | Analyte Replicate Filter | TCGA-A3-3374-01A-01D-0858-01 | TCGA-A3-3374-01A-02D-1322-01 |
| TCGA-A3-3382 | snp__genome_wide_snp_6__broad_mit_edu__Level_1__image_acquisition__data | Analyte Replicate Filter | TCGA-A3-3382-01A-01D-0858-01 | TCGA-A3-3382-01A-02D-1322-01 |
| TCGA-A3-3378 | snp__genome_wide_snp_6__broad_mit_edu__Level_1__image_acquisition__data | Analyte Replicate Filter | TCGA-A3-3378-01A-01D-0858-01 | TCGA-A3-3378-01A-02D-1322-01 |
| TCGA-AK-3453 | snp__genome_wide_snp_6__broad_mit_edu__Level_1__image_acquisition__data | Analyte Replicate Filter | TCGA-AK-3453-10A-01D-0858-01 | TCGA-AK-3453-10A-01D-1274-01 |
| TCGA-AK-3426 | snp__genome_wide_snp_6__broad_mit_edu__Level_1__image_acquisition__data | Analyte Replicate Filter | TCGA-AK-3426-01A-01D-1185-01 | TCGA-AK-3426-01A-02D-1322-01 |
| TCGA-B8-4620 | snp__genome_wide_snp_6__broad_mit_edu__Level_1__image_acquisition__data | Analyte Replicate Filter | TCGA-B8-4620-01A-01D-1185-01,TCGA-B8-4620-01A-02D-1322-01 | TCGA-B8-4620-01A-01D-1549-01 |
| TCGA-A3-3322 | snp__genome_wide_snp_6__broad_mit_edu__Level_1__image_acquisition__data | Analyte Replicate Filter | TCGA-A3-3322-01A-01D-0858-01 | TCGA-A3-3322-01A-02D-1322-01 |
Table S8.
| Participant Id | DataType__Platform__Center__DataLevel__ProtocolName_Extension | Filter Reason | Removed Sample(s) | Chosen Sample |
|---|---|---|---|---|
| TCGA-B3-3926 | snp__genome_wide_snp_6__broad_mit_edu__Level_3__segmented_scna_minus_germline_cnv_hg19__seg | Analyte Replicate Filter | TCGA-B3-3926-01A-01D-1190-01 | TCGA-B3-3926-01A-02D-1348-01 |
| TCGA-B9-4117 | snp__genome_wide_snp_6__broad_mit_edu__Level_3__segmented_scna_minus_germline_cnv_hg19__seg | Analyte Replicate Filter | TCGA-B9-4117-01A-01D-1190-01 | TCGA-B9-4117-01A-02D-1348-01 |
| TCGA-AL-3468 | snp__genome_wide_snp_6__broad_mit_edu__Level_3__segmented_scna_minus_germline_cnv_hg19__seg | Analyte Replicate Filter | TCGA-AL-3468-01A-01D-1190-01 | TCGA-AL-3468-01A-02D-1348-01 |
| TCGA-B9-4116 | snp__genome_wide_snp_6__broad_mit_edu__Level_3__segmented_scna_minus_germline_cnv_hg19__seg | Analyte Replicate Filter | TCGA-B9-4116-01A-01D-1190-01 | TCGA-B9-4116-01A-02D-1348-01 |
| TCGA-B3-3925 | snp__genome_wide_snp_6__broad_mit_edu__Level_3__segmented_scna_minus_germline_cnv_hg19__seg | Analyte Replicate Filter | TCGA-B3-3925-01A-01D-1190-01 | TCGA-B3-3925-01A-02D-1348-01 |
| TCGA-AL-3471 | snp__genome_wide_snp_6__broad_mit_edu__Level_3__segmented_scna_minus_germline_cnv_hg19__seg | Analyte Replicate Filter | TCGA-AL-3471-01A-01D-1190-01 | TCGA-AL-3471-01A-02D-1348-01 |
| TCGA-B3-4104 | snp__genome_wide_snp_6__broad_mit_edu__Level_3__segmented_scna_minus_germline_cnv_hg19__seg | Analyte Replicate Filter | TCGA-B3-4104-01A-01D-1190-01 | TCGA-B3-4104-01A-02D-1348-01 |
| TCGA-B3-4103 | snp__genome_wide_snp_6__broad_mit_edu__Level_3__segmented_scna_minus_germline_cnv_hg19__seg | Analyte Replicate Filter | TCGA-B3-4103-01A-01D-1190-01 | TCGA-B3-4103-01A-02D-1348-01 |
| TCGA-AL-3467 | snp__genome_wide_snp_6__broad_mit_edu__Level_3__segmented_scna_minus_germline_cnv_hg19__seg | Analyte Replicate Filter | TCGA-AL-3467-01A-01D-1190-01 | TCGA-AL-3467-01A-02D-1348-01 |
| TCGA-B9-4115 | snp__genome_wide_snp_6__broad_mit_edu__Level_3__segmented_scna_minus_germline_cnv_hg19__seg | Analyte Replicate Filter | TCGA-B9-4115-01A-01D-1190-01 | TCGA-B9-4115-01A-01D-1549-01 |
| TCGA-B3-3926 | snp__genome_wide_snp_6__broad_mit_edu__Level_2__tangent_copynumber__data | Analyte Replicate Filter | TCGA-B3-3926-01A-01D-1190-01 | TCGA-B3-3926-01A-02D-1348-01 |
| TCGA-B9-4117 | snp__genome_wide_snp_6__broad_mit_edu__Level_2__tangent_copynumber__data | Analyte Replicate Filter | TCGA-B9-4117-01A-01D-1190-01 | TCGA-B9-4117-01A-02D-1348-01 |
| TCGA-AL-3468 | snp__genome_wide_snp_6__broad_mit_edu__Level_2__tangent_copynumber__data | Analyte Replicate Filter | TCGA-AL-3468-01A-01D-1190-01 | TCGA-AL-3468-01A-02D-1348-01 |
| TCGA-B9-4116 | snp__genome_wide_snp_6__broad_mit_edu__Level_2__tangent_copynumber__data | Analyte Replicate Filter | TCGA-B9-4116-01A-01D-1190-01 | TCGA-B9-4116-01A-02D-1348-01 |
| TCGA-B3-3925 | snp__genome_wide_snp_6__broad_mit_edu__Level_2__tangent_copynumber__data | Analyte Replicate Filter | TCGA-B3-3925-01A-01D-1190-01 | TCGA-B3-3925-01A-02D-1348-01 |
| TCGA-AL-3471 | snp__genome_wide_snp_6__broad_mit_edu__Level_2__tangent_copynumber__data | Analyte Replicate Filter | TCGA-AL-3471-01A-01D-1190-01 | TCGA-AL-3471-01A-02D-1348-01 |
| TCGA-B3-4104 | snp__genome_wide_snp_6__broad_mit_edu__Level_2__tangent_copynumber__data | Analyte Replicate Filter | TCGA-B3-4104-01A-01D-1190-01 | TCGA-B3-4104-01A-02D-1348-01 |
| TCGA-B3-4103 | snp__genome_wide_snp_6__broad_mit_edu__Level_2__tangent_copynumber__data | Analyte Replicate Filter | TCGA-B3-4103-01A-01D-1190-01 | TCGA-B3-4103-01A-02D-1348-01 |
| TCGA-AL-3467 | snp__genome_wide_snp_6__broad_mit_edu__Level_2__tangent_copynumber__data | Analyte Replicate Filter | TCGA-AL-3467-01A-01D-1190-01 | TCGA-AL-3467-01A-02D-1348-01 |
| TCGA-B9-4115 | snp__genome_wide_snp_6__broad_mit_edu__Level_2__tangent_copynumber__data | Analyte Replicate Filter | TCGA-B9-4115-01A-01D-1190-01 | TCGA-B9-4115-01A-01D-1549-01 |
| TCGA-B3-4103 | snp__genome_wide_snp_6__broad_mit_edu__Level_1__image_acquisition__data | Analyte Replicate Filter | TCGA-B3-4103-01A-01D-1190-01 | TCGA-B3-4103-01A-02D-1348-01 |
| TCGA-B3-3925 | snp__genome_wide_snp_6__broad_mit_edu__Level_1__image_acquisition__data | Analyte Replicate Filter | TCGA-B3-3925-01A-01D-1190-01 | TCGA-B3-3925-01A-02D-1348-01 |
| TCGA-B9-4117 | snp__genome_wide_snp_6__broad_mit_edu__Level_1__image_acquisition__data | Analyte Replicate Filter | TCGA-B9-4117-01A-01D-1190-01 | TCGA-B9-4117-01A-02D-1348-01 |
| TCGA-AL-3468 | snp__genome_wide_snp_6__broad_mit_edu__Level_1__image_acquisition__data | Analyte Replicate Filter | TCGA-AL-3468-01A-01D-1190-01 | TCGA-AL-3468-01A-02D-1348-01 |
| TCGA-AL-3466 | snp__genome_wide_snp_6__broad_mit_edu__Level_1__image_acquisition__data | Analyte Replicate Filter | TCGA-AL-3466-01A-01D-1190-01 | TCGA-AL-3466-01A-02D-1348-01 |
| TCGA-B9-4116 | snp__genome_wide_snp_6__broad_mit_edu__Level_1__image_acquisition__data | Analyte Replicate Filter | TCGA-B9-4116-01A-01D-1190-01 | TCGA-B9-4116-01A-02D-1348-01 |
| TCGA-B3-3926 | snp__genome_wide_snp_6__broad_mit_edu__Level_1__image_acquisition__data | Analyte Replicate Filter | TCGA-B3-3926-01A-01D-1190-01 | TCGA-B3-3926-01A-02D-1348-01 |
| TCGA-AL-3471 | snp__genome_wide_snp_6__broad_mit_edu__Level_1__image_acquisition__data | Analyte Replicate Filter | TCGA-AL-3471-01A-01D-1190-01 | TCGA-AL-3471-01A-02D-1348-01 |
| TCGA-B3-4104 | snp__genome_wide_snp_6__broad_mit_edu__Level_1__image_acquisition__data | Analyte Replicate Filter | TCGA-B3-4104-01A-01D-1190-01 | TCGA-B3-4104-01A-02D-1348-01 |
| TCGA-B9-4115 | snp__genome_wide_snp_6__broad_mit_edu__Level_1__image_acquisition__data | Analyte Replicate Filter | TCGA-B9-4115-01A-01D-1190-01 | TCGA-B9-4115-01A-01D-1549-01 |
| TCGA-B3-3926 | snp__genome_wide_snp_6__broad_mit_edu__Level_3__segmented_scna_minus_germline_cnv_hg18__seg | Analyte Replicate Filter | TCGA-B3-3926-01A-01D-1190-01 | TCGA-B3-3926-01A-02D-1348-01 |
| TCGA-B9-4117 | snp__genome_wide_snp_6__broad_mit_edu__Level_3__segmented_scna_minus_germline_cnv_hg18__seg | Analyte Replicate Filter | TCGA-B9-4117-01A-01D-1190-01 | TCGA-B9-4117-01A-02D-1348-01 |
| TCGA-AL-3468 | snp__genome_wide_snp_6__broad_mit_edu__Level_3__segmented_scna_minus_germline_cnv_hg18__seg | Analyte Replicate Filter | TCGA-AL-3468-01A-01D-1190-01 | TCGA-AL-3468-01A-02D-1348-01 |
| TCGA-B9-4116 | snp__genome_wide_snp_6__broad_mit_edu__Level_3__segmented_scna_minus_germline_cnv_hg18__seg | Analyte Replicate Filter | TCGA-B9-4116-01A-01D-1190-01 | TCGA-B9-4116-01A-02D-1348-01 |
| TCGA-B3-3925 | snp__genome_wide_snp_6__broad_mit_edu__Level_3__segmented_scna_minus_germline_cnv_hg18__seg | Analyte Replicate Filter | TCGA-B3-3925-01A-01D-1190-01 | TCGA-B3-3925-01A-02D-1348-01 |
| TCGA-AL-3471 | snp__genome_wide_snp_6__broad_mit_edu__Level_3__segmented_scna_minus_germline_cnv_hg18__seg | Analyte Replicate Filter | TCGA-AL-3471-01A-01D-1190-01 | TCGA-AL-3471-01A-02D-1348-01 |
| TCGA-B3-4104 | snp__genome_wide_snp_6__broad_mit_edu__Level_3__segmented_scna_minus_germline_cnv_hg18__seg | Analyte Replicate Filter | TCGA-B3-4104-01A-01D-1190-01 | TCGA-B3-4104-01A-02D-1348-01 |
| TCGA-B3-4103 | snp__genome_wide_snp_6__broad_mit_edu__Level_3__segmented_scna_minus_germline_cnv_hg18__seg | Analyte Replicate Filter | TCGA-B3-4103-01A-01D-1190-01 | TCGA-B3-4103-01A-02D-1348-01 |
| TCGA-AL-3467 | snp__genome_wide_snp_6__broad_mit_edu__Level_3__segmented_scna_minus_germline_cnv_hg18__seg | Analyte Replicate Filter | TCGA-AL-3467-01A-01D-1190-01 | TCGA-AL-3467-01A-02D-1348-01 |
| TCGA-B9-4115 | snp__genome_wide_snp_6__broad_mit_edu__Level_3__segmented_scna_minus_germline_cnv_hg18__seg | Analyte Replicate Filter | TCGA-B9-4115-01A-01D-1190-01 | TCGA-B9-4115-01A-01D-1549-01 |
| TCGA-B3-3926 | snp__genome_wide_snp_6__broad_mit_edu__Level_2__birdseed_genotype__birdseed | Analyte Replicate Filter | TCGA-B3-3926-01A-01D-1190-01 | TCGA-B3-3926-01A-02D-1348-01 |
| TCGA-B9-4117 | snp__genome_wide_snp_6__broad_mit_edu__Level_2__birdseed_genotype__birdseed | Analyte Replicate Filter | TCGA-B9-4117-01A-01D-1190-01 | TCGA-B9-4117-01A-02D-1348-01 |
| TCGA-AL-3468 | snp__genome_wide_snp_6__broad_mit_edu__Level_2__birdseed_genotype__birdseed | Analyte Replicate Filter | TCGA-AL-3468-01A-01D-1190-01 | TCGA-AL-3468-01A-02D-1348-01 |
| TCGA-AL-3466 | snp__genome_wide_snp_6__broad_mit_edu__Level_2__birdseed_genotype__birdseed | Analyte Replicate Filter | TCGA-AL-3466-01A-01D-1190-01 | TCGA-AL-3466-01A-02D-1348-01 |
| TCGA-B9-4116 | snp__genome_wide_snp_6__broad_mit_edu__Level_2__birdseed_genotype__birdseed | Analyte Replicate Filter | TCGA-B9-4116-01A-01D-1190-01 | TCGA-B9-4116-01A-02D-1348-01 |
| TCGA-B3-3925 | snp__genome_wide_snp_6__broad_mit_edu__Level_2__birdseed_genotype__birdseed | Analyte Replicate Filter | TCGA-B3-3925-01A-01D-1190-01 | TCGA-B3-3925-01A-02D-1348-01 |
| TCGA-AL-3471 | snp__genome_wide_snp_6__broad_mit_edu__Level_2__birdseed_genotype__birdseed | Analyte Replicate Filter | TCGA-AL-3471-01A-01D-1190-01 | TCGA-AL-3471-01A-02D-1348-01 |
| TCGA-B3-4104 | snp__genome_wide_snp_6__broad_mit_edu__Level_2__birdseed_genotype__birdseed | Analyte Replicate Filter | TCGA-B3-4104-01A-01D-1190-01 | TCGA-B3-4104-01A-02D-1348-01 |
| TCGA-B3-4103 | snp__genome_wide_snp_6__broad_mit_edu__Level_2__birdseed_genotype__birdseed | Analyte Replicate Filter | TCGA-B3-4103-01A-01D-1190-01 | TCGA-B3-4103-01A-02D-1348-01 |
| TCGA-AL-3467 | snp__genome_wide_snp_6__broad_mit_edu__Level_2__birdseed_genotype__birdseed | Analyte Replicate Filter | TCGA-AL-3467-01A-01D-1190-01 | TCGA-AL-3467-01A-02D-1348-01 |
| TCGA-B9-4115 | snp__genome_wide_snp_6__broad_mit_edu__Level_2__birdseed_genotype__birdseed | Analyte Replicate Filter | TCGA-B9-4115-01A-01D-1190-01 | TCGA-B9-4115-01A-01D-1549-01 |
| TCGA-B3-3926 | snp__genome_wide_snp_6__broad_mit_edu__Level_3__segmented_scna_hg19__seg | Analyte Replicate Filter | TCGA-B3-3926-01A-01D-1190-01 | TCGA-B3-3926-01A-02D-1348-01 |
| TCGA-B9-4117 | snp__genome_wide_snp_6__broad_mit_edu__Level_3__segmented_scna_hg19__seg | Analyte Replicate Filter | TCGA-B9-4117-01A-01D-1190-01 | TCGA-B9-4117-01A-02D-1348-01 |
| TCGA-AL-3468 | snp__genome_wide_snp_6__broad_mit_edu__Level_3__segmented_scna_hg19__seg | Analyte Replicate Filter | TCGA-AL-3468-01A-01D-1190-01 | TCGA-AL-3468-01A-02D-1348-01 |
| TCGA-B9-4116 | snp__genome_wide_snp_6__broad_mit_edu__Level_3__segmented_scna_hg19__seg | Analyte Replicate Filter | TCGA-B9-4116-01A-01D-1190-01 | TCGA-B9-4116-01A-02D-1348-01 |
| TCGA-B3-3925 | snp__genome_wide_snp_6__broad_mit_edu__Level_3__segmented_scna_hg19__seg | Analyte Replicate Filter | TCGA-B3-3925-01A-01D-1190-01 | TCGA-B3-3925-01A-02D-1348-01 |
| TCGA-AL-3471 | snp__genome_wide_snp_6__broad_mit_edu__Level_3__segmented_scna_hg19__seg | Analyte Replicate Filter | TCGA-AL-3471-01A-01D-1190-01 | TCGA-AL-3471-01A-02D-1348-01 |
| TCGA-B3-4104 | snp__genome_wide_snp_6__broad_mit_edu__Level_3__segmented_scna_hg19__seg | Analyte Replicate Filter | TCGA-B3-4104-01A-01D-1190-01 | TCGA-B3-4104-01A-02D-1348-01 |
| TCGA-B3-4103 | snp__genome_wide_snp_6__broad_mit_edu__Level_3__segmented_scna_hg19__seg | Analyte Replicate Filter | TCGA-B3-4103-01A-01D-1190-01 | TCGA-B3-4103-01A-02D-1348-01 |
| TCGA-AL-3467 | snp__genome_wide_snp_6__broad_mit_edu__Level_3__segmented_scna_hg19__seg | Analyte Replicate Filter | TCGA-AL-3467-01A-01D-1190-01 | TCGA-AL-3467-01A-02D-1348-01 |
| TCGA-B9-4115 | snp__genome_wide_snp_6__broad_mit_edu__Level_3__segmented_scna_hg19__seg | Analyte Replicate Filter | TCGA-B9-4115-01A-01D-1190-01 | TCGA-B9-4115-01A-01D-1549-01 |
| TCGA-B3-4103 | snp__genome_wide_snp_6__broad_mit_edu__Level_2__after_5NN_copy_number__data | Analyte Replicate Filter | TCGA-B3-4103-01A-01D-1190-01 | TCGA-B3-4103-01A-02D-1348-01 |
| TCGA-B3-3925 | snp__genome_wide_snp_6__broad_mit_edu__Level_2__after_5NN_copy_number__data | Analyte Replicate Filter | TCGA-B3-3925-01A-01D-1190-01 | TCGA-B3-3925-01A-02D-1348-01 |
| TCGA-B9-4117 | snp__genome_wide_snp_6__broad_mit_edu__Level_2__after_5NN_copy_number__data | Analyte Replicate Filter | TCGA-B9-4117-01A-01D-1190-01 | TCGA-B9-4117-01A-02D-1348-01 |
| TCGA-AL-3468 | snp__genome_wide_snp_6__broad_mit_edu__Level_2__after_5NN_copy_number__data | Analyte Replicate Filter | TCGA-AL-3468-01A-01D-1190-01 | TCGA-AL-3468-01A-02D-1348-01 |
| TCGA-B9-4116 | snp__genome_wide_snp_6__broad_mit_edu__Level_2__after_5NN_copy_number__data | Analyte Replicate Filter | TCGA-B9-4116-01A-01D-1190-01 | TCGA-B9-4116-01A-02D-1348-01 |
| TCGA-B3-3926 | snp__genome_wide_snp_6__broad_mit_edu__Level_2__after_5NN_copy_number__data | Analyte Replicate Filter | TCGA-B3-3926-01A-01D-1190-01 | TCGA-B3-3926-01A-02D-1348-01 |
| TCGA-AL-3471 | snp__genome_wide_snp_6__broad_mit_edu__Level_2__after_5NN_copy_number__data | Analyte Replicate Filter | TCGA-AL-3471-01A-01D-1190-01 | TCGA-AL-3471-01A-02D-1348-01 |
| TCGA-B3-4104 | snp__genome_wide_snp_6__broad_mit_edu__Level_2__after_5NN_copy_number__data | Analyte Replicate Filter | TCGA-B3-4104-01A-01D-1190-01 | TCGA-B3-4104-01A-02D-1348-01 |
| TCGA-B9-4115 | snp__genome_wide_snp_6__broad_mit_edu__Level_2__after_5NN_copy_number__data | Analyte Replicate Filter | TCGA-B9-4115-01A-01D-1190-01 | TCGA-B9-4115-01A-01D-1549-01 |
| TCGA-B3-3926 | snp__genome_wide_snp_6__broad_mit_edu__Level_2__byallele_copynumber__data | Analyte Replicate Filter | TCGA-B3-3926-01A-01D-1190-01 | TCGA-B3-3926-01A-02D-1348-01 |
| TCGA-B9-4117 | snp__genome_wide_snp_6__broad_mit_edu__Level_2__byallele_copynumber__data | Analyte Replicate Filter | TCGA-B9-4117-01A-01D-1190-01 | TCGA-B9-4117-01A-02D-1348-01 |
| TCGA-AL-3468 | snp__genome_wide_snp_6__broad_mit_edu__Level_2__byallele_copynumber__data | Analyte Replicate Filter | TCGA-AL-3468-01A-01D-1190-01 | TCGA-AL-3468-01A-02D-1348-01 |
| TCGA-AL-3466 | snp__genome_wide_snp_6__broad_mit_edu__Level_2__byallele_copynumber__data | Analyte Replicate Filter | TCGA-AL-3466-01A-01D-1190-01 | TCGA-AL-3466-01A-02D-1348-01 |
| TCGA-B9-4116 | snp__genome_wide_snp_6__broad_mit_edu__Level_2__byallele_copynumber__data | Analyte Replicate Filter | TCGA-B9-4116-01A-01D-1190-01 | TCGA-B9-4116-01A-02D-1348-01 |
| TCGA-B3-3925 | snp__genome_wide_snp_6__broad_mit_edu__Level_2__byallele_copynumber__data | Analyte Replicate Filter | TCGA-B3-3925-01A-01D-1190-01 | TCGA-B3-3925-01A-02D-1348-01 |
| TCGA-AL-3471 | snp__genome_wide_snp_6__broad_mit_edu__Level_2__byallele_copynumber__data | Analyte Replicate Filter | TCGA-AL-3471-01A-01D-1190-01 | TCGA-AL-3471-01A-02D-1348-01 |
| TCGA-B3-4104 | snp__genome_wide_snp_6__broad_mit_edu__Level_2__byallele_copynumber__data | Analyte Replicate Filter | TCGA-B3-4104-01A-01D-1190-01 | TCGA-B3-4104-01A-02D-1348-01 |
| TCGA-B3-4103 | snp__genome_wide_snp_6__broad_mit_edu__Level_2__byallele_copynumber__data | Analyte Replicate Filter | TCGA-B3-4103-01A-01D-1190-01 | TCGA-B3-4103-01A-02D-1348-01 |
| TCGA-AL-3467 | snp__genome_wide_snp_6__broad_mit_edu__Level_2__byallele_copynumber__data | Analyte Replicate Filter | TCGA-AL-3467-01A-01D-1190-01 | TCGA-AL-3467-01A-02D-1348-01 |
| TCGA-B9-4115 | snp__genome_wide_snp_6__broad_mit_edu__Level_2__byallele_copynumber__data | Analyte Replicate Filter | TCGA-B9-4115-01A-01D-1190-01 | TCGA-B9-4115-01A-01D-1549-01 |
| TCGA-B3-4103 | snp__genome_wide_snp_6__broad_mit_edu__Level_2__copynumber_byallele__data | Analyte Replicate Filter | TCGA-B3-4103-01A-01D-1190-01 | TCGA-B3-4103-01A-02D-1348-01 |
| TCGA-B3-3925 | snp__genome_wide_snp_6__broad_mit_edu__Level_2__copynumber_byallele__data | Analyte Replicate Filter | TCGA-B3-3925-01A-01D-1190-01 | TCGA-B3-3925-01A-02D-1348-01 |
| TCGA-B9-4117 | snp__genome_wide_snp_6__broad_mit_edu__Level_2__copynumber_byallele__data | Analyte Replicate Filter | TCGA-B9-4117-01A-01D-1190-01 | TCGA-B9-4117-01A-02D-1348-01 |
| TCGA-AL-3468 | snp__genome_wide_snp_6__broad_mit_edu__Level_2__copynumber_byallele__data | Analyte Replicate Filter | TCGA-AL-3468-01A-01D-1190-01 | TCGA-AL-3468-01A-02D-1348-01 |
| TCGA-AL-3466 | snp__genome_wide_snp_6__broad_mit_edu__Level_2__copynumber_byallele__data | Analyte Replicate Filter | TCGA-AL-3466-01A-01D-1190-01 | TCGA-AL-3466-01A-02D-1348-01 |
| TCGA-B9-4116 | snp__genome_wide_snp_6__broad_mit_edu__Level_2__copynumber_byallele__data | Analyte Replicate Filter | TCGA-B9-4116-01A-01D-1190-01 | TCGA-B9-4116-01A-02D-1348-01 |
| TCGA-B3-3926 | snp__genome_wide_snp_6__broad_mit_edu__Level_2__copynumber_byallele__data | Analyte Replicate Filter | TCGA-B3-3926-01A-01D-1190-01 | TCGA-B3-3926-01A-02D-1348-01 |
| TCGA-AL-3471 | snp__genome_wide_snp_6__broad_mit_edu__Level_2__copynumber_byallele__data | Analyte Replicate Filter | TCGA-AL-3471-01A-01D-1190-01 | TCGA-AL-3471-01A-02D-1348-01 |
| TCGA-B3-4104 | snp__genome_wide_snp_6__broad_mit_edu__Level_2__copynumber_byallele__data | Analyte Replicate Filter | TCGA-B3-4104-01A-01D-1190-01 | TCGA-B3-4104-01A-02D-1348-01 |
| TCGA-B9-4115 | snp__genome_wide_snp_6__broad_mit_edu__Level_2__copynumber_byallele__data | Analyte Replicate Filter | TCGA-B9-4115-01A-01D-1190-01 | TCGA-B9-4115-01A-01D-1549-01 |
| TCGA-B3-3926 | snp__genome_wide_snp_6__broad_mit_edu__Level_3__segmented_scna_hg18__seg | Analyte Replicate Filter | TCGA-B3-3926-01A-01D-1190-01 | TCGA-B3-3926-01A-02D-1348-01 |
| TCGA-B9-4117 | snp__genome_wide_snp_6__broad_mit_edu__Level_3__segmented_scna_hg18__seg | Analyte Replicate Filter | TCGA-B9-4117-01A-01D-1190-01 | TCGA-B9-4117-01A-02D-1348-01 |
| TCGA-AL-3468 | snp__genome_wide_snp_6__broad_mit_edu__Level_3__segmented_scna_hg18__seg | Analyte Replicate Filter | TCGA-AL-3468-01A-01D-1190-01 | TCGA-AL-3468-01A-02D-1348-01 |
| TCGA-B9-4116 | snp__genome_wide_snp_6__broad_mit_edu__Level_3__segmented_scna_hg18__seg | Analyte Replicate Filter | TCGA-B9-4116-01A-01D-1190-01 | TCGA-B9-4116-01A-02D-1348-01 |
| TCGA-B3-3925 | snp__genome_wide_snp_6__broad_mit_edu__Level_3__segmented_scna_hg18__seg | Analyte Replicate Filter | TCGA-B3-3925-01A-01D-1190-01 | TCGA-B3-3925-01A-02D-1348-01 |
| TCGA-AL-3471 | snp__genome_wide_snp_6__broad_mit_edu__Level_3__segmented_scna_hg18__seg | Analyte Replicate Filter | TCGA-AL-3471-01A-01D-1190-01 | TCGA-AL-3471-01A-02D-1348-01 |
| TCGA-B3-4104 | snp__genome_wide_snp_6__broad_mit_edu__Level_3__segmented_scna_hg18__seg | Analyte Replicate Filter | TCGA-B3-4104-01A-01D-1190-01 | TCGA-B3-4104-01A-02D-1348-01 |
| TCGA-B3-4103 | snp__genome_wide_snp_6__broad_mit_edu__Level_3__segmented_scna_hg18__seg | Analyte Replicate Filter | TCGA-B3-4103-01A-01D-1190-01 | TCGA-B3-4103-01A-02D-1348-01 |
| TCGA-AL-3467 | snp__genome_wide_snp_6__broad_mit_edu__Level_3__segmented_scna_hg18__seg | Analyte Replicate Filter | TCGA-AL-3467-01A-01D-1190-01 | TCGA-AL-3467-01A-02D-1348-01 |
| TCGA-B9-4115 | snp__genome_wide_snp_6__broad_mit_edu__Level_3__segmented_scna_hg18__seg | Analyte Replicate Filter | TCGA-B9-4115-01A-01D-1190-01 | TCGA-B9-4115-01A-01D-1549-01 |
| TCGA-B3-3926 | snp__genome_wide_snp_6__broad_mit_edu__Level_2__invariantset_medianpolish__data | Analyte Replicate Filter | TCGA-B3-3926-01A-01D-1190-01 | TCGA-B3-3926-01A-02D-1348-01 |
| TCGA-B3-4103 | snp__genome_wide_snp_6__broad_mit_edu__Level_2__invariantset_medianpolish__data | Analyte Replicate Filter | TCGA-B3-4103-01A-01D-1190-01 | TCGA-B3-4103-01A-02D-1348-01 |
| TCGA-B3-3925 | snp__genome_wide_snp_6__broad_mit_edu__Level_2__invariantset_medianpolish__data | Analyte Replicate Filter | TCGA-B3-3925-01A-01D-1190-01 | TCGA-B3-3925-01A-02D-1348-01 |
| TCGA-B9-4117 | snp__genome_wide_snp_6__broad_mit_edu__Level_2__invariantset_medianpolish__data | Analyte Replicate Filter | TCGA-B9-4117-01A-01D-1190-01 | TCGA-B9-4117-01A-02D-1348-01 |
| TCGA-AL-3468 | snp__genome_wide_snp_6__broad_mit_edu__Level_2__invariantset_medianpolish__data | Analyte Replicate Filter | TCGA-AL-3468-01A-01D-1190-01 | TCGA-AL-3468-01A-02D-1348-01 |
| TCGA-B9-4116 | snp__genome_wide_snp_6__broad_mit_edu__Level_2__invariantset_medianpolish__data | Analyte Replicate Filter | TCGA-B9-4116-01A-01D-1190-01 | TCGA-B9-4116-01A-02D-1348-01 |
| TCGA-AL-3466 | snp__genome_wide_snp_6__broad_mit_edu__Level_2__invariantset_medianpolish__data | Analyte Replicate Filter | TCGA-AL-3466-01A-01D-1190-01 | TCGA-AL-3466-01A-02D-1348-01 |
| TCGA-AL-3471 | snp__genome_wide_snp_6__broad_mit_edu__Level_2__invariantset_medianpolish__data | Analyte Replicate Filter | TCGA-AL-3471-01A-01D-1190-01 | TCGA-AL-3471-01A-02D-1348-01 |
| TCGA-B3-4104 | snp__genome_wide_snp_6__broad_mit_edu__Level_2__invariantset_medianpolish__data | Analyte Replicate Filter | TCGA-B3-4104-01A-01D-1190-01 | TCGA-B3-4104-01A-02D-1348-01 |
| TCGA-AL-3467 | snp__genome_wide_snp_6__broad_mit_edu__Level_2__invariantset_medianpolish__data | Analyte Replicate Filter | TCGA-AL-3467-01A-01D-1190-01 | TCGA-AL-3467-01A-02D-1348-01 |
| TCGA-B9-4115 | snp__genome_wide_snp_6__broad_mit_edu__Level_2__invariantset_medianpolish__data | Analyte Replicate Filter | TCGA-B9-4115-01A-01D-1190-01 | TCGA-B9-4115-01A-01D-1549-01 |
| TCGA-B3-4103 | snp__genome_wide_snp_6__broad_mit_edu__Level_2__copy_number__data | Analyte Replicate Filter | TCGA-B3-4103-01A-01D-1190-01 | TCGA-B3-4103-01A-02D-1348-01 |
| TCGA-B3-3925 | snp__genome_wide_snp_6__broad_mit_edu__Level_2__copy_number__data | Analyte Replicate Filter | TCGA-B3-3925-01A-01D-1190-01 | TCGA-B3-3925-01A-02D-1348-01 |
| TCGA-B9-4117 | snp__genome_wide_snp_6__broad_mit_edu__Level_2__copy_number__data | Analyte Replicate Filter | TCGA-B9-4117-01A-01D-1190-01 | TCGA-B9-4117-01A-02D-1348-01 |
| TCGA-AL-3468 | snp__genome_wide_snp_6__broad_mit_edu__Level_2__copy_number__data | Analyte Replicate Filter | TCGA-AL-3468-01A-01D-1190-01 | TCGA-AL-3468-01A-02D-1348-01 |
| TCGA-AL-3466 | snp__genome_wide_snp_6__broad_mit_edu__Level_2__copy_number__data | Analyte Replicate Filter | TCGA-AL-3466-01A-01D-1190-01 | TCGA-AL-3466-01A-02D-1348-01 |
| TCGA-B9-4116 | snp__genome_wide_snp_6__broad_mit_edu__Level_2__copy_number__data | Analyte Replicate Filter | TCGA-B9-4116-01A-01D-1190-01 | TCGA-B9-4116-01A-02D-1348-01 |
| TCGA-B3-3926 | snp__genome_wide_snp_6__broad_mit_edu__Level_2__copy_number__data | Analyte Replicate Filter | TCGA-B3-3926-01A-01D-1190-01 | TCGA-B3-3926-01A-02D-1348-01 |
| TCGA-AL-3471 | snp__genome_wide_snp_6__broad_mit_edu__Level_2__copy_number__data | Analyte Replicate Filter | TCGA-AL-3471-01A-01D-1190-01 | TCGA-AL-3471-01A-02D-1348-01 |
| TCGA-B3-4104 | snp__genome_wide_snp_6__broad_mit_edu__Level_2__copy_number__data | Analyte Replicate Filter | TCGA-B3-4104-01A-01D-1190-01 | TCGA-B3-4104-01A-02D-1348-01 |
| TCGA-B9-4115 | snp__genome_wide_snp_6__broad_mit_edu__Level_2__copy_number__data | Analyte Replicate Filter | TCGA-B9-4115-01A-01D-1190-01 | TCGA-B9-4115-01A-01D-1549-01 |
| TCGA-B3-3926 | snp__genome_wide_snp_6__broad_mit_edu__Level_2__raw_copynumber__data | Analyte Replicate Filter | TCGA-B3-3926-01A-01D-1190-01 | TCGA-B3-3926-01A-02D-1348-01 |
| TCGA-B9-4117 | snp__genome_wide_snp_6__broad_mit_edu__Level_2__raw_copynumber__data | Analyte Replicate Filter | TCGA-B9-4117-01A-01D-1190-01 | TCGA-B9-4117-01A-02D-1348-01 |
| TCGA-AL-3468 | snp__genome_wide_snp_6__broad_mit_edu__Level_2__raw_copynumber__data | Analyte Replicate Filter | TCGA-AL-3468-01A-01D-1190-01 | TCGA-AL-3468-01A-02D-1348-01 |
| TCGA-AL-3466 | snp__genome_wide_snp_6__broad_mit_edu__Level_2__raw_copynumber__data | Analyte Replicate Filter | TCGA-AL-3466-01A-01D-1190-01 | TCGA-AL-3466-01A-02D-1348-01 |
| TCGA-B9-4116 | snp__genome_wide_snp_6__broad_mit_edu__Level_2__raw_copynumber__data | Analyte Replicate Filter | TCGA-B9-4116-01A-01D-1190-01 | TCGA-B9-4116-01A-02D-1348-01 |
| TCGA-B3-3925 | snp__genome_wide_snp_6__broad_mit_edu__Level_2__raw_copynumber__data | Analyte Replicate Filter | TCGA-B3-3925-01A-01D-1190-01 | TCGA-B3-3925-01A-02D-1348-01 |
| TCGA-AL-3471 | snp__genome_wide_snp_6__broad_mit_edu__Level_2__raw_copynumber__data | Analyte Replicate Filter | TCGA-AL-3471-01A-01D-1190-01 | TCGA-AL-3471-01A-02D-1348-01 |
| TCGA-B3-4104 | snp__genome_wide_snp_6__broad_mit_edu__Level_2__raw_copynumber__data | Analyte Replicate Filter | TCGA-B3-4104-01A-01D-1190-01 | TCGA-B3-4104-01A-02D-1348-01 |
| TCGA-B3-4103 | snp__genome_wide_snp_6__broad_mit_edu__Level_2__raw_copynumber__data | Analyte Replicate Filter | TCGA-B3-4103-01A-01D-1190-01 | TCGA-B3-4103-01A-02D-1348-01 |
| TCGA-AL-3467 | snp__genome_wide_snp_6__broad_mit_edu__Level_2__raw_copynumber__data | Analyte Replicate Filter | TCGA-AL-3467-01A-01D-1190-01 | TCGA-AL-3467-01A-02D-1348-01 |
| TCGA-B9-4115 | snp__genome_wide_snp_6__broad_mit_edu__Level_2__raw_copynumber__data | Analyte Replicate Filter | TCGA-B9-4115-01A-01D-1190-01 | TCGA-B9-4115-01A-01D-1549-01 |
Table S9.
| Participant Id | DataType__Platform__Center__DataLevel__ProtocolName_Extension | Filter Reason | Removed Sample(s) | Chosen Sample |
|---|---|---|---|---|
| TCGA-FG-5965 | mirnaseq__illuminahiseq_mirnaseq__bcgsc_ca__Level_3__miR_gene_expression__data | Sort Replicate Filter | TCGA-FG-5965-02A-11R-A29V-13 | TCGA-FG-5965-02B-11R-A29V-13 |
| TCGA-FG-5965 | rnaseqv2__illuminahiseq_rnaseqv2__unc_edu__Level_3__RSEM_genes__data | Sort Replicate Filter | TCGA-FG-5965-02A-11R-A29R-07 | TCGA-FG-5965-02B-11R-A29R-07 |
| TCGA-FG-5965 | rnaseqv2__illuminahiseq_rnaseqv2__unc_edu__Level_3__RSEM_isoforms_normalized__data | Sort Replicate Filter | TCGA-FG-5965-02A-11R-A29R-07 | TCGA-FG-5965-02B-11R-A29R-07 |
| TCGA-FG-5965 | rnaseqv2__illuminahiseq_rnaseqv2__unc_edu__Level_3__junction_quantification__data | Sort Replicate Filter | TCGA-FG-5965-02A-11R-A29R-07 | TCGA-FG-5965-02B-11R-A29R-07 |
| TCGA-FG-5965 | mirnaseq__illuminahiseq_mirnaseq__bcgsc_ca__Level_3__miR_isoform_expression__data | Sort Replicate Filter | TCGA-FG-5965-02A-11R-A29V-13 | TCGA-FG-5965-02B-11R-A29V-13 |
| TCGA-FG-5965 | methylation__humanmethylation450__jhu_usc_edu__Level_3__within_bioassay_data_set_function__data | Sort Replicate Filter | TCGA-FG-5965-02A-11D-A29T-05 | TCGA-FG-5965-02B-11D-A29T-05 |
| TCGA-FG-5965 | rnaseqv2__illuminahiseq_rnaseqv2__unc_edu__Level_3__RSEM_genes_normalized__data | Sort Replicate Filter | TCGA-FG-5965-02A-11R-A29R-07 | TCGA-FG-5965-02B-11R-A29R-07 |
| TCGA-FG-5965 | rnaseqv2__illuminahiseq_rnaseqv2__unc_edu__Level_3__exon_quantification__data | Sort Replicate Filter | TCGA-FG-5965-02A-11R-A29R-07 | TCGA-FG-5965-02B-11R-A29R-07 |
Table S10.
| Participant Id | DataType__Platform__Center__DataLevel__ProtocolName_Extension | Filter Reason | Removed Sample(s) | Chosen Sample |
|---|---|---|---|---|
| TCGA-44-5645 | methylation__humanmethylation450__jhu_usc_edu__Level_3__within_bioassay_data_set_function__data | Analyte Replicate Filter | TCGA-44-5645-01A-01D-1626-05 | TCGA-44-5645-01B-04D-A276-05 |
| TCGA-44-6147 | methylation__humanmethylation450__jhu_usc_edu__Level_3__within_bioassay_data_set_function__data | Analyte Replicate Filter | TCGA-44-6147-01A-11D-1756-05 | TCGA-44-6147-01B-06D-A276-05 |
| TCGA-44-6775 | methylation__humanmethylation450__jhu_usc_edu__Level_3__within_bioassay_data_set_function__data | Analyte Replicate Filter | TCGA-44-6775-01A-11D-1856-05 | TCGA-44-6775-01C-02D-A276-05 |
| TCGA-44-6146 | methylation__humanmethylation450__jhu_usc_edu__Level_3__within_bioassay_data_set_function__data | Analyte Replicate Filter | TCGA-44-6146-01A-11D-1756-05 | TCGA-44-6146-01B-04D-A276-05 |
| TCGA-44-2668 | snp__genome_wide_snp_6__broad_mit_edu__Level_2__tangent_copynumber__data | Analyte Replicate Filter | TCGA-44-2668-01A-01D-0944-01 | TCGA-44-2668-01A-01D-1549-01 |
| TCGA-44-2661 | snp__genome_wide_snp_6__broad_mit_edu__Level_2__tangent_copynumber__data | Analyte Replicate Filter | TCGA-44-2661-11A-01D-1549-01 | TCGA-44-2661-11A-01D-1877-01 |
| TCGA-44-4112 | snp__genome_wide_snp_6__broad_mit_edu__Level_2__tangent_copynumber__data | Analyte Replicate Filter | TCGA-44-4112-10A-01D-1450-01 | TCGA-44-4112-10A-01D-1877-01 |
| TCGA-44-3398 | snp__genome_wide_snp_6__broad_mit_edu__Level_2__tangent_copynumber__data | Analyte Replicate Filter | TCGA-44-3398-01A-01D-1549-01 | TCGA-44-3398-01A-01D-1877-01 |
| TCGA-44-3398 | snp__genome_wide_snp_6__broad_mit_edu__Level_2__tangent_copynumber__data | Analyte Replicate Filter | TCGA-44-3398-11B-01D-1549-01 | TCGA-44-3398-11B-01D-1877-01 |
| TCGA-44-2657 | snp__genome_wide_snp_6__broad_mit_edu__Level_2__tangent_copynumber__data | Analyte Replicate Filter | TCGA-44-2657-01A-01D-1549-01 | TCGA-44-2657-01A-01D-1877-01 |
| TCGA-38-4627 | snp__genome_wide_snp_6__broad_mit_edu__Level_2__tangent_copynumber__data | Analyte Replicate Filter | TCGA-38-4627-01A-01D-1204-01 | TCGA-38-4627-01A-01D-1549-01 |
| TCGA-44-2668 | snp__genome_wide_snp_6__broad_mit_edu__Level_2__invariantset_medianpolish__data | Analyte Replicate Filter | TCGA-44-2668-01A-01D-0944-01 | TCGA-44-2668-01A-01D-1549-01 |
| TCGA-44-2661 | snp__genome_wide_snp_6__broad_mit_edu__Level_2__invariantset_medianpolish__data | Analyte Replicate Filter | TCGA-44-2661-11A-01D-1549-01 | TCGA-44-2661-11A-01D-1877-01 |
| TCGA-44-2659 | snp__genome_wide_snp_6__broad_mit_edu__Level_2__invariantset_medianpolish__data | Analyte Replicate Filter | TCGA-44-2659-01A-01D-0944-01 | TCGA-44-2659-01A-01D-1549-01 |
| TCGA-44-4112 | snp__genome_wide_snp_6__broad_mit_edu__Level_2__invariantset_medianpolish__data | Analyte Replicate Filter | TCGA-44-4112-10A-01D-1450-01 | TCGA-44-4112-10A-01D-1877-01 |
| TCGA-44-2657 | snp__genome_wide_snp_6__broad_mit_edu__Level_2__invariantset_medianpolish__data | Analyte Replicate Filter | TCGA-44-2657-11A-01D-1549-01 | TCGA-44-2657-11A-01D-1877-01 |
| TCGA-38-4625 | snp__genome_wide_snp_6__broad_mit_edu__Level_2__invariantset_medianpolish__data | Analyte Replicate Filter | TCGA-38-4625-01A-01D-1204-01 | TCGA-38-4625-01A-01D-1549-01 |
| TCGA-44-3398 | snp__genome_wide_snp_6__broad_mit_edu__Level_2__invariantset_medianpolish__data | Analyte Replicate Filter | TCGA-44-3398-01A-01D-1549-01 | TCGA-44-3398-01A-01D-1877-01 |
| TCGA-44-3398 | snp__genome_wide_snp_6__broad_mit_edu__Level_2__invariantset_medianpolish__data | Analyte Replicate Filter | TCGA-44-3398-11B-01D-1549-01 | TCGA-44-3398-11B-01D-1877-01 |
| TCGA-44-2657 | snp__genome_wide_snp_6__broad_mit_edu__Level_2__invariantset_medianpolish__data | Analyte Replicate Filter | TCGA-44-2657-01A-01D-1549-01 | TCGA-44-2657-01A-01D-1877-01 |
| TCGA-38-4627 | snp__genome_wide_snp_6__broad_mit_edu__Level_2__invariantset_medianpolish__data | Analyte Replicate Filter | TCGA-38-4627-01A-01D-1204-01 | TCGA-38-4627-01A-01D-1549-01 |
| TCGA-44-2661 | snp__genome_wide_snp_6__broad_mit_edu__Level_2__invariantset_medianpolish__data | Analyte Replicate Filter | TCGA-44-2661-01A-01D-1549-01 | TCGA-44-2661-01A-01D-1877-01 |
| TCGA-44-3919 | snp__genome_wide_snp_6__broad_mit_edu__Level_2__invariantset_medianpolish__data | Analyte Replicate Filter | TCGA-44-3919-10A-01D-1450-01 | TCGA-44-3919-10A-01D-1877-01 |
| TCGA-44-6146 | mirnaseq__illuminahiseq_mirnaseq__bcgsc_ca__Level_3__miR_isoform_expression__data | Analyte Replicate Filter | TCGA-44-6146-01B-04R-A27D-13 | TCGA-44-6146-01A-11H-1754-13 |
| TCGA-44-6147 | mirnaseq__illuminahiseq_mirnaseq__bcgsc_ca__Level_3__miR_isoform_expression__data | Analyte Replicate Filter | TCGA-44-6147-01B-06R-A27D-13 | TCGA-44-6147-01A-11H-1754-13 |
| TCGA-44-6775 | mirnaseq__illuminahiseq_mirnaseq__bcgsc_ca__Level_3__miR_isoform_expression__data | Analyte Replicate Filter | TCGA-44-6775-01C-02R-A27D-13 | TCGA-44-6775-01A-11H-1857-13 |
| TCGA-44-2668 | snp__genome_wide_snp_6__broad_mit_edu__Level_2__copy_number__data | Analyte Replicate Filter | TCGA-44-2668-01A-01D-0944-01 | TCGA-44-2668-01A-01D-1549-01 |
| TCGA-44-2661 | snp__genome_wide_snp_6__broad_mit_edu__Level_2__copy_number__data | Analyte Replicate Filter | TCGA-44-2661-11A-01D-1549-01 | TCGA-44-2661-11A-01D-1877-01 |
| TCGA-44-2659 | snp__genome_wide_snp_6__broad_mit_edu__Level_2__copy_number__data | Analyte Replicate Filter | TCGA-44-2659-01A-01D-0944-01 | TCGA-44-2659-01A-01D-1549-01 |
| TCGA-38-4625 | snp__genome_wide_snp_6__broad_mit_edu__Level_2__copy_number__data | Analyte Replicate Filter | TCGA-38-4625-01A-01D-1204-01 | TCGA-38-4625-01A-01D-1549-01 |
| TCGA-38-4627 | snp__genome_wide_snp_6__broad_mit_edu__Level_2__copy_number__data | Analyte Replicate Filter | TCGA-38-4627-01A-01D-1204-01 | TCGA-38-4627-01A-01D-1549-01 |
| TCGA-44-2657 | snp__genome_wide_snp_6__broad_mit_edu__Level_2__copy_number__data | Analyte Replicate Filter | TCGA-44-2657-01A-01D-1549-01 | TCGA-44-2657-01A-01D-1877-01 |
| TCGA-44-3398 | snp__genome_wide_snp_6__broad_mit_edu__Level_2__copy_number__data | Analyte Replicate Filter | TCGA-44-3398-01A-01D-1549-01 | TCGA-44-3398-01A-01D-1877-01 |
| TCGA-44-2661 | snp__genome_wide_snp_6__broad_mit_edu__Level_2__copy_number__data | Analyte Replicate Filter | TCGA-44-2661-01A-01D-1549-01 | TCGA-44-2661-01A-01D-1877-01 |
| TCGA-44-3398 | snp__genome_wide_snp_6__broad_mit_edu__Level_2__copy_number__data | Analyte Replicate Filter | TCGA-44-3398-11B-01D-1549-01 | TCGA-44-3398-11B-01D-1877-01 |
| TCGA-44-4112 | snp__genome_wide_snp_6__broad_mit_edu__Level_2__copy_number__data | Analyte Replicate Filter | TCGA-44-4112-10A-01D-1450-01 | TCGA-44-4112-10A-01D-1877-01 |
| TCGA-44-2668 | snp__genome_wide_snp_6__broad_mit_edu__Level_2__birdseed_genotype__birdseed | Analyte Replicate Filter | TCGA-44-2668-01A-01D-0944-01 | TCGA-44-2668-01A-01D-1549-01 |
| TCGA-44-2661 | snp__genome_wide_snp_6__broad_mit_edu__Level_2__birdseed_genotype__birdseed | Analyte Replicate Filter | TCGA-44-2661-11A-01D-1549-01 | TCGA-44-2661-11A-01D-1877-01 |
| TCGA-44-2659 | snp__genome_wide_snp_6__broad_mit_edu__Level_2__birdseed_genotype__birdseed | Analyte Replicate Filter | TCGA-44-2659-01A-01D-0944-01 | TCGA-44-2659-01A-01D-1549-01 |
| TCGA-44-4112 | snp__genome_wide_snp_6__broad_mit_edu__Level_2__birdseed_genotype__birdseed | Analyte Replicate Filter | TCGA-44-4112-10A-01D-1450-01 | TCGA-44-4112-10A-01D-1877-01 |
| TCGA-38-4625 | snp__genome_wide_snp_6__broad_mit_edu__Level_2__birdseed_genotype__birdseed | Analyte Replicate Filter | TCGA-38-4625-01A-01D-1204-01 | TCGA-38-4625-01A-01D-1549-01 |
| TCGA-44-3398 | snp__genome_wide_snp_6__broad_mit_edu__Level_2__birdseed_genotype__birdseed | Analyte Replicate Filter | TCGA-44-3398-01A-01D-1549-01 | TCGA-44-3398-01A-01D-1877-01 |
| TCGA-44-3398 | snp__genome_wide_snp_6__broad_mit_edu__Level_2__birdseed_genotype__birdseed | Analyte Replicate Filter | TCGA-44-3398-11B-01D-1549-01 | TCGA-44-3398-11B-01D-1877-01 |
| TCGA-44-2657 | snp__genome_wide_snp_6__broad_mit_edu__Level_2__birdseed_genotype__birdseed | Analyte Replicate Filter | TCGA-44-2657-01A-01D-1549-01 | TCGA-44-2657-01A-01D-1877-01 |
| TCGA-38-4627 | snp__genome_wide_snp_6__broad_mit_edu__Level_2__birdseed_genotype__birdseed | Analyte Replicate Filter | TCGA-38-4627-01A-01D-1204-01 | TCGA-38-4627-01A-01D-1549-01 |
| TCGA-44-2661 | snp__genome_wide_snp_6__broad_mit_edu__Level_2__birdseed_genotype__birdseed | Analyte Replicate Filter | TCGA-44-2661-01A-01D-1549-01 | TCGA-44-2661-01A-01D-1877-01 |
| TCGA-44-2668 | snp__genome_wide_snp_6__broad_mit_edu__Level_3__segmented_scna_minus_germline_cnv_hg18__seg | Analyte Replicate Filter | TCGA-44-2668-01A-01D-0944-01 | TCGA-44-2668-01A-01D-1549-01 |
| TCGA-44-2661 | snp__genome_wide_snp_6__broad_mit_edu__Level_3__segmented_scna_minus_germline_cnv_hg18__seg | Analyte Replicate Filter | TCGA-44-2661-11A-01D-1549-01 | TCGA-44-2661-11A-01D-1877-01 |
| TCGA-44-4112 | snp__genome_wide_snp_6__broad_mit_edu__Level_3__segmented_scna_minus_germline_cnv_hg18__seg | Analyte Replicate Filter | TCGA-44-4112-10A-01D-1450-01 | TCGA-44-4112-10A-01D-1877-01 |
| TCGA-44-3398 | snp__genome_wide_snp_6__broad_mit_edu__Level_3__segmented_scna_minus_germline_cnv_hg18__seg | Analyte Replicate Filter | TCGA-44-3398-01A-01D-1549-01 | TCGA-44-3398-01A-01D-1877-01 |
| TCGA-44-3398 | snp__genome_wide_snp_6__broad_mit_edu__Level_3__segmented_scna_minus_germline_cnv_hg18__seg | Analyte Replicate Filter | TCGA-44-3398-11B-01D-1549-01 | TCGA-44-3398-11B-01D-1877-01 |
| TCGA-44-2657 | snp__genome_wide_snp_6__broad_mit_edu__Level_3__segmented_scna_minus_germline_cnv_hg18__seg | Analyte Replicate Filter | TCGA-44-2657-01A-01D-1549-01 | TCGA-44-2657-01A-01D-1877-01 |
| TCGA-38-4627 | snp__genome_wide_snp_6__broad_mit_edu__Level_3__segmented_scna_minus_germline_cnv_hg18__seg | Analyte Replicate Filter | TCGA-38-4627-01A-01D-1204-01 | TCGA-38-4627-01A-01D-1549-01 |
| TCGA-44-2668 | snp__genome_wide_snp_6__broad_mit_edu__Level_2__after_5NN_copy_number__data | Analyte Replicate Filter | TCGA-44-2668-01A-01D-0944-01 | TCGA-44-2668-01A-01D-1549-01 |
| TCGA-44-2661 | snp__genome_wide_snp_6__broad_mit_edu__Level_2__after_5NN_copy_number__data | Analyte Replicate Filter | TCGA-44-2661-11A-01D-1549-01 | TCGA-44-2661-11A-01D-1877-01 |
| TCGA-38-4627 | snp__genome_wide_snp_6__broad_mit_edu__Level_2__after_5NN_copy_number__data | Analyte Replicate Filter | TCGA-38-4627-01A-01D-1204-01 | TCGA-38-4627-01A-01D-1549-01 |
| TCGA-44-2657 | snp__genome_wide_snp_6__broad_mit_edu__Level_2__after_5NN_copy_number__data | Analyte Replicate Filter | TCGA-44-2657-01A-01D-1549-01 | TCGA-44-2657-01A-01D-1877-01 |
| TCGA-44-3398 | snp__genome_wide_snp_6__broad_mit_edu__Level_2__after_5NN_copy_number__data | Analyte Replicate Filter | TCGA-44-3398-01A-01D-1549-01 | TCGA-44-3398-01A-01D-1877-01 |
| TCGA-44-3398 | snp__genome_wide_snp_6__broad_mit_edu__Level_2__after_5NN_copy_number__data | Analyte Replicate Filter | TCGA-44-3398-11B-01D-1549-01 | TCGA-44-3398-11B-01D-1877-01 |
| TCGA-44-4112 | snp__genome_wide_snp_6__broad_mit_edu__Level_2__after_5NN_copy_number__data | Analyte Replicate Filter | TCGA-44-4112-10A-01D-1450-01 | TCGA-44-4112-10A-01D-1877-01 |
| TCGA-44-2668 | snp__genome_wide_snp_6__broad_mit_edu__Level_2__no_outlier_copy_number__data | Analyte Replicate Filter | TCGA-44-2668-01A-01D-0944-01 | TCGA-44-2668-01A-01D-1549-01 |
| TCGA-44-2661 | snp__genome_wide_snp_6__broad_mit_edu__Level_2__no_outlier_copy_number__data | Analyte Replicate Filter | TCGA-44-2661-11A-01D-1549-01 | TCGA-44-2661-11A-01D-1877-01 |
| TCGA-44-2659 | snp__genome_wide_snp_6__broad_mit_edu__Level_2__no_outlier_copy_number__data | Analyte Replicate Filter | TCGA-44-2659-01A-01D-0944-01 | TCGA-44-2659-01A-01D-1549-01 |
| TCGA-38-4625 | snp__genome_wide_snp_6__broad_mit_edu__Level_2__no_outlier_copy_number__data | Analyte Replicate Filter | TCGA-38-4625-01A-01D-1204-01 | TCGA-38-4625-01A-01D-1549-01 |
| TCGA-38-4627 | snp__genome_wide_snp_6__broad_mit_edu__Level_2__no_outlier_copy_number__data | Analyte Replicate Filter | TCGA-38-4627-01A-01D-1204-01 | TCGA-38-4627-01A-01D-1549-01 |
| TCGA-44-2657 | snp__genome_wide_snp_6__broad_mit_edu__Level_2__no_outlier_copy_number__data | Analyte Replicate Filter | TCGA-44-2657-01A-01D-1549-01 | TCGA-44-2657-01A-01D-1877-01 |
| TCGA-44-3398 | snp__genome_wide_snp_6__broad_mit_edu__Level_2__no_outlier_copy_number__data | Analyte Replicate Filter | TCGA-44-3398-01A-01D-1549-01 | TCGA-44-3398-01A-01D-1877-01 |
| TCGA-44-2661 | snp__genome_wide_snp_6__broad_mit_edu__Level_2__no_outlier_copy_number__data | Analyte Replicate Filter | TCGA-44-2661-01A-01D-1549-01 | TCGA-44-2661-01A-01D-1877-01 |
| TCGA-44-3398 | snp__genome_wide_snp_6__broad_mit_edu__Level_2__no_outlier_copy_number__data | Analyte Replicate Filter | TCGA-44-3398-11B-01D-1549-01 | TCGA-44-3398-11B-01D-1877-01 |
| TCGA-44-4112 | snp__genome_wide_snp_6__broad_mit_edu__Level_2__no_outlier_copy_number__data | Analyte Replicate Filter | TCGA-44-4112-10A-01D-1450-01 | TCGA-44-4112-10A-01D-1877-01 |
| TCGA-44-2668 | snp__genome_wide_snp_6__broad_mit_edu__Level_3__segmented_scna_hg19__seg | Analyte Replicate Filter | TCGA-44-2668-01A-01D-0944-01 | TCGA-44-2668-01A-01D-1549-01 |
| TCGA-44-2661 | snp__genome_wide_snp_6__broad_mit_edu__Level_3__segmented_scna_hg19__seg | Analyte Replicate Filter | TCGA-44-2661-11A-01D-1549-01 | TCGA-44-2661-11A-01D-1877-01 |
| TCGA-44-4112 | snp__genome_wide_snp_6__broad_mit_edu__Level_3__segmented_scna_hg19__seg | Analyte Replicate Filter | TCGA-44-4112-10A-01D-1450-01 | TCGA-44-4112-10A-01D-1877-01 |
| TCGA-44-3398 | snp__genome_wide_snp_6__broad_mit_edu__Level_3__segmented_scna_hg19__seg | Analyte Replicate Filter | TCGA-44-3398-01A-01D-1549-01 | TCGA-44-3398-01A-01D-1877-01 |
| TCGA-44-3398 | snp__genome_wide_snp_6__broad_mit_edu__Level_3__segmented_scna_hg19__seg | Analyte Replicate Filter | TCGA-44-3398-11B-01D-1549-01 | TCGA-44-3398-11B-01D-1877-01 |
| TCGA-44-2657 | snp__genome_wide_snp_6__broad_mit_edu__Level_3__segmented_scna_hg19__seg | Analyte Replicate Filter | TCGA-44-2657-01A-01D-1549-01 | TCGA-44-2657-01A-01D-1877-01 |
| TCGA-38-4627 | snp__genome_wide_snp_6__broad_mit_edu__Level_3__segmented_scna_hg19__seg | Analyte Replicate Filter | TCGA-38-4627-01A-01D-1204-01 | TCGA-38-4627-01A-01D-1549-01 |
| TCGA-44-2668 | snp__genome_wide_snp_6__broad_mit_edu__Level_2__copynumber_byallele__data | Analyte Replicate Filter | TCGA-44-2668-01A-01D-0944-01 | TCGA-44-2668-01A-01D-1549-01 |
| TCGA-44-2661 | snp__genome_wide_snp_6__broad_mit_edu__Level_2__copynumber_byallele__data | Analyte Replicate Filter | TCGA-44-2661-11A-01D-1549-01 | TCGA-44-2661-11A-01D-1877-01 |
| TCGA-44-2659 | snp__genome_wide_snp_6__broad_mit_edu__Level_2__copynumber_byallele__data | Analyte Replicate Filter | TCGA-44-2659-01A-01D-0944-01 | TCGA-44-2659-01A-01D-1549-01 |
| TCGA-38-4625 | snp__genome_wide_snp_6__broad_mit_edu__Level_2__copynumber_byallele__data | Analyte Replicate Filter | TCGA-38-4625-01A-01D-1204-01 | TCGA-38-4625-01A-01D-1549-01 |
| TCGA-38-4627 | snp__genome_wide_snp_6__broad_mit_edu__Level_2__copynumber_byallele__data | Analyte Replicate Filter | TCGA-38-4627-01A-01D-1204-01 | TCGA-38-4627-01A-01D-1549-01 |
| TCGA-44-2657 | snp__genome_wide_snp_6__broad_mit_edu__Level_2__copynumber_byallele__data | Analyte Replicate Filter | TCGA-44-2657-01A-01D-1549-01 | TCGA-44-2657-01A-01D-1877-01 |
| TCGA-44-3398 | snp__genome_wide_snp_6__broad_mit_edu__Level_2__copynumber_byallele__data | Analyte Replicate Filter | TCGA-44-3398-01A-01D-1549-01 | TCGA-44-3398-01A-01D-1877-01 |
| TCGA-44-2661 | snp__genome_wide_snp_6__broad_mit_edu__Level_2__copynumber_byallele__data | Analyte Replicate Filter | TCGA-44-2661-01A-01D-1549-01 | TCGA-44-2661-01A-01D-1877-01 |
| TCGA-44-3398 | snp__genome_wide_snp_6__broad_mit_edu__Level_2__copynumber_byallele__data | Analyte Replicate Filter | TCGA-44-3398-11B-01D-1549-01 | TCGA-44-3398-11B-01D-1877-01 |
| TCGA-44-4112 | snp__genome_wide_snp_6__broad_mit_edu__Level_2__copynumber_byallele__data | Analyte Replicate Filter | TCGA-44-4112-10A-01D-1450-01 | TCGA-44-4112-10A-01D-1877-01 |
| TCGA-44-2668 | snp__genome_wide_snp_6__broad_mit_edu__Level_2__byallele_copynumber__data | Analyte Replicate Filter | TCGA-44-2668-01A-01D-0944-01 | TCGA-44-2668-01A-01D-1549-01 |
| TCGA-44-2661 | snp__genome_wide_snp_6__broad_mit_edu__Level_2__byallele_copynumber__data | Analyte Replicate Filter | TCGA-44-2661-11A-01D-1549-01 | TCGA-44-2661-11A-01D-1877-01 |
| TCGA-44-2659 | snp__genome_wide_snp_6__broad_mit_edu__Level_2__byallele_copynumber__data | Analyte Replicate Filter | TCGA-44-2659-01A-01D-0944-01 | TCGA-44-2659-01A-01D-1549-01 |
| TCGA-44-4112 | snp__genome_wide_snp_6__broad_mit_edu__Level_2__byallele_copynumber__data | Analyte Replicate Filter | TCGA-44-4112-10A-01D-1450-01 | TCGA-44-4112-10A-01D-1877-01 |
| TCGA-38-4625 | snp__genome_wide_snp_6__broad_mit_edu__Level_2__byallele_copynumber__data | Analyte Replicate Filter | TCGA-38-4625-01A-01D-1204-01 | TCGA-38-4625-01A-01D-1549-01 |
| TCGA-44-3398 | snp__genome_wide_snp_6__broad_mit_edu__Level_2__byallele_copynumber__data | Analyte Replicate Filter | TCGA-44-3398-01A-01D-1549-01 | TCGA-44-3398-01A-01D-1877-01 |
| TCGA-44-3398 | snp__genome_wide_snp_6__broad_mit_edu__Level_2__byallele_copynumber__data | Analyte Replicate Filter | TCGA-44-3398-11B-01D-1549-01 | TCGA-44-3398-11B-01D-1877-01 |
| TCGA-44-2657 | snp__genome_wide_snp_6__broad_mit_edu__Level_2__byallele_copynumber__data | Analyte Replicate Filter | TCGA-44-2657-01A-01D-1549-01 | TCGA-44-2657-01A-01D-1877-01 |
| TCGA-38-4627 | snp__genome_wide_snp_6__broad_mit_edu__Level_2__byallele_copynumber__data | Analyte Replicate Filter | TCGA-38-4627-01A-01D-1204-01 | TCGA-38-4627-01A-01D-1549-01 |
| TCGA-44-2661 | snp__genome_wide_snp_6__broad_mit_edu__Level_2__byallele_copynumber__data | Analyte Replicate Filter | TCGA-44-2661-01A-01D-1549-01 | TCGA-44-2661-01A-01D-1877-01 |
| TCGA-44-6146 | mirnaseq__illuminahiseq_mirnaseq__bcgsc_ca__Level_3__miR_gene_expression__data | Analyte Replicate Filter | TCGA-44-6146-01B-04R-A27D-13 | TCGA-44-6146-01A-11H-1754-13 |
| TCGA-44-6147 | mirnaseq__illuminahiseq_mirnaseq__bcgsc_ca__Level_3__miR_gene_expression__data | Analyte Replicate Filter | TCGA-44-6147-01B-06R-A27D-13 | TCGA-44-6147-01A-11H-1754-13 |
| TCGA-44-6775 | mirnaseq__illuminahiseq_mirnaseq__bcgsc_ca__Level_3__miR_gene_expression__data | Analyte Replicate Filter | TCGA-44-6775-01C-02R-A27D-13 | TCGA-44-6775-01A-11H-1857-13 |
| TCGA-44-2668 | snp__genome_wide_snp_6__broad_mit_edu__Level_3__segmented_scna_hg18__seg | Analyte Replicate Filter | TCGA-44-2668-01A-01D-0944-01 | TCGA-44-2668-01A-01D-1549-01 |
| TCGA-44-2661 | snp__genome_wide_snp_6__broad_mit_edu__Level_3__segmented_scna_hg18__seg | Analyte Replicate Filter | TCGA-44-2661-11A-01D-1549-01 | TCGA-44-2661-11A-01D-1877-01 |
| TCGA-44-4112 | snp__genome_wide_snp_6__broad_mit_edu__Level_3__segmented_scna_hg18__seg | Analyte Replicate Filter | TCGA-44-4112-10A-01D-1450-01 | TCGA-44-4112-10A-01D-1877-01 |
| TCGA-44-3398 | snp__genome_wide_snp_6__broad_mit_edu__Level_3__segmented_scna_hg18__seg | Analyte Replicate Filter | TCGA-44-3398-01A-01D-1549-01 | TCGA-44-3398-01A-01D-1877-01 |
| TCGA-44-3398 | snp__genome_wide_snp_6__broad_mit_edu__Level_3__segmented_scna_hg18__seg | Analyte Replicate Filter | TCGA-44-3398-11B-01D-1549-01 | TCGA-44-3398-11B-01D-1877-01 |
| TCGA-44-2657 | snp__genome_wide_snp_6__broad_mit_edu__Level_3__segmented_scna_hg18__seg | Analyte Replicate Filter | TCGA-44-2657-01A-01D-1549-01 | TCGA-44-2657-01A-01D-1877-01 |
| TCGA-38-4627 | snp__genome_wide_snp_6__broad_mit_edu__Level_3__segmented_scna_hg18__seg | Analyte Replicate Filter | TCGA-38-4627-01A-01D-1204-01 | TCGA-38-4627-01A-01D-1549-01 |
| TCGA-44-2668 | snp__genome_wide_snp_6__broad_mit_edu__Level_3__segmented_scna_minus_germline_cnv_hg19__seg | Analyte Replicate Filter | TCGA-44-2668-01A-01D-0944-01 | TCGA-44-2668-01A-01D-1549-01 |
| TCGA-44-2661 | snp__genome_wide_snp_6__broad_mit_edu__Level_3__segmented_scna_minus_germline_cnv_hg19__seg | Analyte Replicate Filter | TCGA-44-2661-11A-01D-1549-01 | TCGA-44-2661-11A-01D-1877-01 |
| TCGA-44-4112 | snp__genome_wide_snp_6__broad_mit_edu__Level_3__segmented_scna_minus_germline_cnv_hg19__seg | Analyte Replicate Filter | TCGA-44-4112-10A-01D-1450-01 | TCGA-44-4112-10A-01D-1877-01 |
| TCGA-44-3398 | snp__genome_wide_snp_6__broad_mit_edu__Level_3__segmented_scna_minus_germline_cnv_hg19__seg | Analyte Replicate Filter | TCGA-44-3398-01A-01D-1549-01 | TCGA-44-3398-01A-01D-1877-01 |
| TCGA-44-3398 | snp__genome_wide_snp_6__broad_mit_edu__Level_3__segmented_scna_minus_germline_cnv_hg19__seg | Analyte Replicate Filter | TCGA-44-3398-11B-01D-1549-01 | TCGA-44-3398-11B-01D-1877-01 |
| TCGA-44-2657 | snp__genome_wide_snp_6__broad_mit_edu__Level_3__segmented_scna_minus_germline_cnv_hg19__seg | Analyte Replicate Filter | TCGA-44-2657-01A-01D-1549-01 | TCGA-44-2657-01A-01D-1877-01 |
| TCGA-38-4627 | snp__genome_wide_snp_6__broad_mit_edu__Level_3__segmented_scna_minus_germline_cnv_hg19__seg | Analyte Replicate Filter | TCGA-38-4627-01A-01D-1204-01 | TCGA-38-4627-01A-01D-1549-01 |
| TCGA-44-2668 | snp__genome_wide_snp_6__broad_mit_edu__Level_2__raw_copynumber__data | Analyte Replicate Filter | TCGA-44-2668-01A-01D-0944-01 | TCGA-44-2668-01A-01D-1549-01 |
| TCGA-44-2661 | snp__genome_wide_snp_6__broad_mit_edu__Level_2__raw_copynumber__data | Analyte Replicate Filter | TCGA-44-2661-11A-01D-1549-01 | TCGA-44-2661-11A-01D-1877-01 |
| TCGA-44-2659 | snp__genome_wide_snp_6__broad_mit_edu__Level_2__raw_copynumber__data | Analyte Replicate Filter | TCGA-44-2659-01A-01D-0944-01 | TCGA-44-2659-01A-01D-1549-01 |
| TCGA-44-4112 | snp__genome_wide_snp_6__broad_mit_edu__Level_2__raw_copynumber__data | Analyte Replicate Filter | TCGA-44-4112-10A-01D-1450-01 | TCGA-44-4112-10A-01D-1877-01 |
| TCGA-38-4625 | snp__genome_wide_snp_6__broad_mit_edu__Level_2__raw_copynumber__data | Analyte Replicate Filter | TCGA-38-4625-01A-01D-1204-01 | TCGA-38-4625-01A-01D-1549-01 |
| TCGA-44-3398 | snp__genome_wide_snp_6__broad_mit_edu__Level_2__raw_copynumber__data | Analyte Replicate Filter | TCGA-44-3398-01A-01D-1549-01 | TCGA-44-3398-01A-01D-1877-01 |
| TCGA-44-3398 | snp__genome_wide_snp_6__broad_mit_edu__Level_2__raw_copynumber__data | Analyte Replicate Filter | TCGA-44-3398-11B-01D-1549-01 | TCGA-44-3398-11B-01D-1877-01 |
| TCGA-44-2657 | snp__genome_wide_snp_6__broad_mit_edu__Level_2__raw_copynumber__data | Analyte Replicate Filter | TCGA-44-2657-01A-01D-1549-01 | TCGA-44-2657-01A-01D-1877-01 |
| TCGA-38-4627 | snp__genome_wide_snp_6__broad_mit_edu__Level_2__raw_copynumber__data | Analyte Replicate Filter | TCGA-38-4627-01A-01D-1204-01 | TCGA-38-4627-01A-01D-1549-01 |
| TCGA-44-2661 | snp__genome_wide_snp_6__broad_mit_edu__Level_2__raw_copynumber__data | Analyte Replicate Filter | TCGA-44-2661-01A-01D-1549-01 | TCGA-44-2661-01A-01D-1877-01 |
| TCGA-44-2668 | snp__genome_wide_snp_6__broad_mit_edu__Level_1__image_acquisition__data | Analyte Replicate Filter | TCGA-44-2668-01A-01D-0944-01 | TCGA-44-2668-01A-01D-1549-01 |
| TCGA-44-2661 | snp__genome_wide_snp_6__broad_mit_edu__Level_1__image_acquisition__data | Analyte Replicate Filter | TCGA-44-2661-11A-01D-1549-01 | TCGA-44-2661-11A-01D-1877-01 |
| TCGA-44-2659 | snp__genome_wide_snp_6__broad_mit_edu__Level_1__image_acquisition__data | Analyte Replicate Filter | TCGA-44-2659-01A-01D-0944-01 | TCGA-44-2659-01A-01D-1549-01 |
| TCGA-44-2657 | snp__genome_wide_snp_6__broad_mit_edu__Level_1__image_acquisition__data | Analyte Replicate Filter | TCGA-44-2657-11A-01D-1549-01 | TCGA-44-2657-11A-01D-1877-01 |
| TCGA-38-4625 | snp__genome_wide_snp_6__broad_mit_edu__Level_1__image_acquisition__data | Analyte Replicate Filter | TCGA-38-4625-01A-01D-1204-01 | TCGA-38-4625-01A-01D-1549-01 |
| TCGA-38-4627 | snp__genome_wide_snp_6__broad_mit_edu__Level_1__image_acquisition__data | Analyte Replicate Filter | TCGA-38-4627-01A-01D-1204-01 | TCGA-38-4627-01A-01D-1549-01 |
| TCGA-44-2657 | snp__genome_wide_snp_6__broad_mit_edu__Level_1__image_acquisition__data | Analyte Replicate Filter | TCGA-44-2657-01A-01D-1549-01 | TCGA-44-2657-01A-01D-1877-01 |
| TCGA-44-3398 | snp__genome_wide_snp_6__broad_mit_edu__Level_1__image_acquisition__data | Analyte Replicate Filter | TCGA-44-3398-01A-01D-1549-01 | TCGA-44-3398-01A-01D-1877-01 |
| TCGA-44-2661 | snp__genome_wide_snp_6__broad_mit_edu__Level_1__image_acquisition__data | Analyte Replicate Filter | TCGA-44-2661-01A-01D-1549-01 | TCGA-44-2661-01A-01D-1877-01 |
| TCGA-44-3398 | snp__genome_wide_snp_6__broad_mit_edu__Level_1__image_acquisition__data | Analyte Replicate Filter | TCGA-44-3398-11B-01D-1549-01 | TCGA-44-3398-11B-01D-1877-01 |
| TCGA-44-3919 | snp__genome_wide_snp_6__broad_mit_edu__Level_1__image_acquisition__data | Analyte Replicate Filter | TCGA-44-3919-10A-01D-1450-01 | TCGA-44-3919-10A-01D-1877-01 |
| TCGA-44-4112 | snp__genome_wide_snp_6__broad_mit_edu__Level_1__image_acquisition__data | Analyte Replicate Filter | TCGA-44-4112-10A-01D-1450-01 | TCGA-44-4112-10A-01D-1877-01 |
Table S11.
| Participant Id | DataType__Platform__Center__DataLevel__ProtocolName_Extension | Filter Reason | Removed Sample(s) | Chosen Sample |
|---|---|---|---|---|
| TCGA-43-3394 | snp__genome_wide_snp_6__broad_mit_edu__Level_2__copynumber_byallele__data | Analyte Replicate Filter | TCGA-43-3394-01A-01D-0978-01 | TCGA-43-3394-01A-01D-1549-01 |
| TCGA-43-3920 | snp__genome_wide_snp_6__broad_mit_edu__Level_2__copynumber_byallele__data | Analyte Replicate Filter | TCGA-43-3920-01A-01D-0978-01 | TCGA-43-3920-01A-01D-1549-01 |
| TCGA-37-4135 | snp__genome_wide_snp_6__broad_mit_edu__Level_2__byallele_copynumber__data | Analyte Replicate Filter | TCGA-37-4135-01A-01D-1097-01 | TCGA-37-4135-01A-01D-1969-01 |
| TCGA-37-4130 | snp__genome_wide_snp_6__broad_mit_edu__Level_2__byallele_copynumber__data | Analyte Replicate Filter | TCGA-37-4130-01A-01D-1097-01 | TCGA-37-4130-01A-01D-1969-01 |
| TCGA-37-4132 | snp__genome_wide_snp_6__broad_mit_edu__Level_2__byallele_copynumber__data | Analyte Replicate Filter | TCGA-37-4132-01A-01D-1097-01 | TCGA-37-4132-01A-01D-1969-01 |
| TCGA-18-3407 | snp__genome_wide_snp_6__broad_mit_edu__Level_2__byallele_copynumber__data | Analyte Replicate Filter | TCGA-18-3407-01A-01D-0978-01 | TCGA-18-3407-01A-01D-1969-01 |
| TCGA-66-2759 | snp__genome_wide_snp_6__broad_mit_edu__Level_2__byallele_copynumber__data | Analyte Replicate Filter | TCGA-66-2759-01A-01D-0844-01 | TCGA-66-2759-01A-01D-1969-01 |
| TCGA-37-4141 | snp__genome_wide_snp_6__broad_mit_edu__Level_2__byallele_copynumber__data | Analyte Replicate Filter | TCGA-37-4141-01A-02D-1097-01 | TCGA-37-4141-01A-02D-1969-01 |
| TCGA-22-4601 | snp__genome_wide_snp_6__broad_mit_edu__Level_2__byallele_copynumber__data | Analyte Replicate Filter | TCGA-22-4601-01A-01D-1439-01 | TCGA-22-4601-01A-01D-1969-01 |
| TCGA-37-4129 | snp__genome_wide_snp_6__broad_mit_edu__Level_2__byallele_copynumber__data | Analyte Replicate Filter | TCGA-37-4129-01A-01D-1097-01 | TCGA-37-4129-01A-01D-1969-01 |
| TCGA-66-2758 | snp__genome_wide_snp_6__broad_mit_edu__Level_2__byallele_copynumber__data | Analyte Replicate Filter | TCGA-66-2758-01A-02D-0844-01 | TCGA-66-2758-01A-02D-1969-01 |
| TCGA-18-3410 | snp__genome_wide_snp_6__broad_mit_edu__Level_2__byallele_copynumber__data | Analyte Replicate Filter | TCGA-18-3410-01A-01D-0978-01 | TCGA-18-3410-01A-01D-1969-01 |
| TCGA-60-2720 | snp__genome_wide_snp_6__broad_mit_edu__Level_2__byallele_copynumber__data | Analyte Replicate Filter | TCGA-60-2720-01A-01D-0844-01 | TCGA-60-2720-01A-01D-1969-01 |
| TCGA-51-4080 | snp__genome_wide_snp_6__broad_mit_edu__Level_2__byallele_copynumber__data | Analyte Replicate Filter | TCGA-51-4080-01A-01D-1097-01 | TCGA-51-4080-01A-01D-1969-01 |
| TCGA-43-2578 | snp__genome_wide_snp_6__broad_mit_edu__Level_2__byallele_copynumber__data | Analyte Replicate Filter | TCGA-43-2578-01A-01D-0844-01 | TCGA-43-2578-01A-01D-1969-01 |
| TCGA-43-3394 | snp__genome_wide_snp_6__broad_mit_edu__Level_2__byallele_copynumber__data | Analyte Replicate Filter | TCGA-43-3394-01A-01D-0978-01 | TCGA-43-3394-01A-01D-1549-01 |
| TCGA-60-2710 | snp__genome_wide_snp_6__broad_mit_edu__Level_2__byallele_copynumber__data | Analyte Replicate Filter | TCGA-60-2710-01A-01D-0844-01 | TCGA-60-2710-01A-01D-1969-01 |
| TCGA-43-3920 | snp__genome_wide_snp_6__broad_mit_edu__Level_2__byallele_copynumber__data | Analyte Replicate Filter | TCGA-43-3920-01A-01D-0978-01 | TCGA-43-3920-01A-01D-1549-01 |
| TCGA-18-3411 | snp__genome_wide_snp_6__broad_mit_edu__Level_2__byallele_copynumber__data | Analyte Replicate Filter | TCGA-18-3411-01A-01D-0978-01 | TCGA-18-3411-01A-01D-1969-01 |
| TCGA-37-3792 | snp__genome_wide_snp_6__broad_mit_edu__Level_2__byallele_copynumber__data | Analyte Replicate Filter | TCGA-37-3792-01A-01D-0978-01 | TCGA-37-3792-01A-01D-1969-01 |
| TCGA-66-2791 | snp__genome_wide_snp_6__broad_mit_edu__Level_2__byallele_copynumber__data | Analyte Replicate Filter | TCGA-66-2791-01A-01D-0978-01 | TCGA-66-2791-01A-01D-1969-01 |
| TCGA-66-2744 | snp__genome_wide_snp_6__broad_mit_edu__Level_2__byallele_copynumber__data | Analyte Replicate Filter | TCGA-66-2744-01A-01D-0978-01 | TCGA-66-2744-01A-01D-1969-01 |
| TCGA-37-4135 | snp__genome_wide_snp_6__broad_mit_edu__Level_3__segmented_scna_minus_germline_cnv_hg19__seg | Analyte Replicate Filter | TCGA-37-4135-01A-01D-1097-01 | TCGA-37-4135-01A-01D-1969-01 |
| TCGA-37-4130 | snp__genome_wide_snp_6__broad_mit_edu__Level_3__segmented_scna_minus_germline_cnv_hg19__seg | Analyte Replicate Filter | TCGA-37-4130-01A-01D-1097-01 | TCGA-37-4130-01A-01D-1969-01 |
| TCGA-37-4132 | snp__genome_wide_snp_6__broad_mit_edu__Level_3__segmented_scna_minus_germline_cnv_hg19__seg | Analyte Replicate Filter | TCGA-37-4132-01A-01D-1097-01 | TCGA-37-4132-01A-01D-1969-01 |
| TCGA-18-3407 | snp__genome_wide_snp_6__broad_mit_edu__Level_3__segmented_scna_minus_germline_cnv_hg19__seg | Analyte Replicate Filter | TCGA-18-3407-01A-01D-0978-01 | TCGA-18-3407-01A-01D-1969-01 |
| TCGA-37-4141 | snp__genome_wide_snp_6__broad_mit_edu__Level_3__segmented_scna_minus_germline_cnv_hg19__seg | Analyte Replicate Filter | TCGA-37-4141-01A-02D-1097-01 | TCGA-37-4141-01A-02D-1969-01 |
| TCGA-22-4601 | snp__genome_wide_snp_6__broad_mit_edu__Level_3__segmented_scna_minus_germline_cnv_hg19__seg | Analyte Replicate Filter | TCGA-22-4601-01A-01D-1439-01 | TCGA-22-4601-01A-01D-1969-01 |
| TCGA-37-4129 | snp__genome_wide_snp_6__broad_mit_edu__Level_3__segmented_scna_minus_germline_cnv_hg19__seg | Analyte Replicate Filter | TCGA-37-4129-01A-01D-1097-01 | TCGA-37-4129-01A-01D-1969-01 |
| TCGA-18-3410 | snp__genome_wide_snp_6__broad_mit_edu__Level_3__segmented_scna_minus_germline_cnv_hg19__seg | Analyte Replicate Filter | TCGA-18-3410-01A-01D-0978-01 | TCGA-18-3410-01A-01D-1969-01 |
| TCGA-51-4080 | snp__genome_wide_snp_6__broad_mit_edu__Level_3__segmented_scna_minus_germline_cnv_hg19__seg | Analyte Replicate Filter | TCGA-51-4080-01A-01D-1097-01 | TCGA-51-4080-01A-01D-1969-01 |
| TCGA-43-2578 | snp__genome_wide_snp_6__broad_mit_edu__Level_3__segmented_scna_minus_germline_cnv_hg19__seg | Analyte Replicate Filter | TCGA-43-2578-01A-01D-0844-01 | TCGA-43-2578-01A-01D-1969-01 |
| TCGA-43-3394 | snp__genome_wide_snp_6__broad_mit_edu__Level_3__segmented_scna_minus_germline_cnv_hg19__seg | Analyte Replicate Filter | TCGA-43-3394-01A-01D-0978-01 | TCGA-43-3394-01A-01D-1549-01 |
| TCGA-43-3920 | snp__genome_wide_snp_6__broad_mit_edu__Level_3__segmented_scna_minus_germline_cnv_hg19__seg | Analyte Replicate Filter | TCGA-43-3920-01A-01D-0978-01 | TCGA-43-3920-01A-01D-1549-01 |
| TCGA-18-3411 | snp__genome_wide_snp_6__broad_mit_edu__Level_3__segmented_scna_minus_germline_cnv_hg19__seg | Analyte Replicate Filter | TCGA-18-3411-01A-01D-0978-01 | TCGA-18-3411-01A-01D-1969-01 |
| TCGA-37-3792 | snp__genome_wide_snp_6__broad_mit_edu__Level_3__segmented_scna_minus_germline_cnv_hg19__seg | Analyte Replicate Filter | TCGA-37-3792-01A-01D-0978-01 | TCGA-37-3792-01A-01D-1969-01 |
| TCGA-66-2791 | snp__genome_wide_snp_6__broad_mit_edu__Level_3__segmented_scna_minus_germline_cnv_hg19__seg | Analyte Replicate Filter | TCGA-66-2791-01A-01D-0978-01 | TCGA-66-2791-01A-01D-1969-01 |
| TCGA-37-4135 | snp__genome_wide_snp_6__broad_mit_edu__Level_2__tangent_copynumber__data | Analyte Replicate Filter | TCGA-37-4135-01A-01D-1097-01 | TCGA-37-4135-01A-01D-1969-01 |
| TCGA-37-4130 | snp__genome_wide_snp_6__broad_mit_edu__Level_2__tangent_copynumber__data | Analyte Replicate Filter | TCGA-37-4130-01A-01D-1097-01 | TCGA-37-4130-01A-01D-1969-01 |
| TCGA-37-4132 | snp__genome_wide_snp_6__broad_mit_edu__Level_2__tangent_copynumber__data | Analyte Replicate Filter | TCGA-37-4132-01A-01D-1097-01 | TCGA-37-4132-01A-01D-1969-01 |
| TCGA-18-3407 | snp__genome_wide_snp_6__broad_mit_edu__Level_2__tangent_copynumber__data | Analyte Replicate Filter | TCGA-18-3407-01A-01D-0978-01 | TCGA-18-3407-01A-01D-1969-01 |
| TCGA-37-4141 | snp__genome_wide_snp_6__broad_mit_edu__Level_2__tangent_copynumber__data | Analyte Replicate Filter | TCGA-37-4141-01A-02D-1097-01 | TCGA-37-4141-01A-02D-1969-01 |
| TCGA-22-4601 | snp__genome_wide_snp_6__broad_mit_edu__Level_2__tangent_copynumber__data | Analyte Replicate Filter | TCGA-22-4601-01A-01D-1439-01 | TCGA-22-4601-01A-01D-1969-01 |
| TCGA-37-4129 | snp__genome_wide_snp_6__broad_mit_edu__Level_2__tangent_copynumber__data | Analyte Replicate Filter | TCGA-37-4129-01A-01D-1097-01 | TCGA-37-4129-01A-01D-1969-01 |
| TCGA-18-3410 | snp__genome_wide_snp_6__broad_mit_edu__Level_2__tangent_copynumber__data | Analyte Replicate Filter | TCGA-18-3410-01A-01D-0978-01 | TCGA-18-3410-01A-01D-1969-01 |
| TCGA-51-4080 | snp__genome_wide_snp_6__broad_mit_edu__Level_2__tangent_copynumber__data | Analyte Replicate Filter | TCGA-51-4080-01A-01D-1097-01 | TCGA-51-4080-01A-01D-1969-01 |
| TCGA-43-2578 | snp__genome_wide_snp_6__broad_mit_edu__Level_2__tangent_copynumber__data | Analyte Replicate Filter | TCGA-43-2578-01A-01D-0844-01 | TCGA-43-2578-01A-01D-1969-01 |
| TCGA-43-3394 | snp__genome_wide_snp_6__broad_mit_edu__Level_2__tangent_copynumber__data | Analyte Replicate Filter | TCGA-43-3394-01A-01D-0978-01 | TCGA-43-3394-01A-01D-1549-01 |
| TCGA-43-3920 | snp__genome_wide_snp_6__broad_mit_edu__Level_2__tangent_copynumber__data | Analyte Replicate Filter | TCGA-43-3920-01A-01D-0978-01 | TCGA-43-3920-01A-01D-1549-01 |
| TCGA-18-3411 | snp__genome_wide_snp_6__broad_mit_edu__Level_2__tangent_copynumber__data | Analyte Replicate Filter | TCGA-18-3411-01A-01D-0978-01 | TCGA-18-3411-01A-01D-1969-01 |
| TCGA-37-3792 | snp__genome_wide_snp_6__broad_mit_edu__Level_2__tangent_copynumber__data | Analyte Replicate Filter | TCGA-37-3792-01A-01D-0978-01 | TCGA-37-3792-01A-01D-1969-01 |
| TCGA-66-2791 | snp__genome_wide_snp_6__broad_mit_edu__Level_2__tangent_copynumber__data | Analyte Replicate Filter | TCGA-66-2791-01A-01D-0978-01 | TCGA-66-2791-01A-01D-1969-01 |
| TCGA-37-4135 | snp__genome_wide_snp_6__broad_mit_edu__Level_3__segmented_scna_minus_germline_cnv_hg18__seg | Analyte Replicate Filter | TCGA-37-4135-01A-01D-1097-01 | TCGA-37-4135-01A-01D-1969-01 |
| TCGA-37-4130 | snp__genome_wide_snp_6__broad_mit_edu__Level_3__segmented_scna_minus_germline_cnv_hg18__seg | Analyte Replicate Filter | TCGA-37-4130-01A-01D-1097-01 | TCGA-37-4130-01A-01D-1969-01 |
| TCGA-37-4132 | snp__genome_wide_snp_6__broad_mit_edu__Level_3__segmented_scna_minus_germline_cnv_hg18__seg | Analyte Replicate Filter | TCGA-37-4132-01A-01D-1097-01 | TCGA-37-4132-01A-01D-1969-01 |
| TCGA-18-3407 | snp__genome_wide_snp_6__broad_mit_edu__Level_3__segmented_scna_minus_germline_cnv_hg18__seg | Analyte Replicate Filter | TCGA-18-3407-01A-01D-0978-01 | TCGA-18-3407-01A-01D-1969-01 |
| TCGA-37-4141 | snp__genome_wide_snp_6__broad_mit_edu__Level_3__segmented_scna_minus_germline_cnv_hg18__seg | Analyte Replicate Filter | TCGA-37-4141-01A-02D-1097-01 | TCGA-37-4141-01A-02D-1969-01 |
| TCGA-22-4601 | snp__genome_wide_snp_6__broad_mit_edu__Level_3__segmented_scna_minus_germline_cnv_hg18__seg | Analyte Replicate Filter | TCGA-22-4601-01A-01D-1439-01 | TCGA-22-4601-01A-01D-1969-01 |
| TCGA-37-4129 | snp__genome_wide_snp_6__broad_mit_edu__Level_3__segmented_scna_minus_germline_cnv_hg18__seg | Analyte Replicate Filter | TCGA-37-4129-01A-01D-1097-01 | TCGA-37-4129-01A-01D-1969-01 |
| TCGA-18-3410 | snp__genome_wide_snp_6__broad_mit_edu__Level_3__segmented_scna_minus_germline_cnv_hg18__seg | Analyte Replicate Filter | TCGA-18-3410-01A-01D-0978-01 | TCGA-18-3410-01A-01D-1969-01 |
| TCGA-51-4080 | snp__genome_wide_snp_6__broad_mit_edu__Level_3__segmented_scna_minus_germline_cnv_hg18__seg | Analyte Replicate Filter | TCGA-51-4080-01A-01D-1097-01 | TCGA-51-4080-01A-01D-1969-01 |
| TCGA-43-2578 | snp__genome_wide_snp_6__broad_mit_edu__Level_3__segmented_scna_minus_germline_cnv_hg18__seg | Analyte Replicate Filter | TCGA-43-2578-01A-01D-0844-01 | TCGA-43-2578-01A-01D-1969-01 |
| TCGA-43-3394 | snp__genome_wide_snp_6__broad_mit_edu__Level_3__segmented_scna_minus_germline_cnv_hg18__seg | Analyte Replicate Filter | TCGA-43-3394-01A-01D-0978-01 | TCGA-43-3394-01A-01D-1549-01 |
| TCGA-43-3920 | snp__genome_wide_snp_6__broad_mit_edu__Level_3__segmented_scna_minus_germline_cnv_hg18__seg | Analyte Replicate Filter | TCGA-43-3920-01A-01D-0978-01 | TCGA-43-3920-01A-01D-1549-01 |
| TCGA-18-3411 | snp__genome_wide_snp_6__broad_mit_edu__Level_3__segmented_scna_minus_germline_cnv_hg18__seg | Analyte Replicate Filter | TCGA-18-3411-01A-01D-0978-01 | TCGA-18-3411-01A-01D-1969-01 |
| TCGA-37-3792 | snp__genome_wide_snp_6__broad_mit_edu__Level_3__segmented_scna_minus_germline_cnv_hg18__seg | Analyte Replicate Filter | TCGA-37-3792-01A-01D-0978-01 | TCGA-37-3792-01A-01D-1969-01 |
| TCGA-66-2791 | snp__genome_wide_snp_6__broad_mit_edu__Level_3__segmented_scna_minus_germline_cnv_hg18__seg | Analyte Replicate Filter | TCGA-66-2791-01A-01D-0978-01 | TCGA-66-2791-01A-01D-1969-01 |
| TCGA-43-3394 | snp__genome_wide_snp_6__broad_mit_edu__Level_2__birdseed_genotype__data | Analyte Replicate Filter | TCGA-43-3394-01A-01D-0978-01 | TCGA-43-3394-01A-01D-1549-01 |
| TCGA-43-3920 | snp__genome_wide_snp_6__broad_mit_edu__Level_2__birdseed_genotype__data | Analyte Replicate Filter | TCGA-43-3920-01A-01D-0978-01 | TCGA-43-3920-01A-01D-1549-01 |
| TCGA-37-4135 | snp__genome_wide_snp_6__broad_mit_edu__Level_2__raw_copynumber__data | Analyte Replicate Filter | TCGA-37-4135-01A-01D-1097-01 | TCGA-37-4135-01A-01D-1969-01 |
| TCGA-37-4130 | snp__genome_wide_snp_6__broad_mit_edu__Level_2__raw_copynumber__data | Analyte Replicate Filter | TCGA-37-4130-01A-01D-1097-01 | TCGA-37-4130-01A-01D-1969-01 |
| TCGA-37-4132 | snp__genome_wide_snp_6__broad_mit_edu__Level_2__raw_copynumber__data | Analyte Replicate Filter | TCGA-37-4132-01A-01D-1097-01 | TCGA-37-4132-01A-01D-1969-01 |
| TCGA-18-3407 | snp__genome_wide_snp_6__broad_mit_edu__Level_2__raw_copynumber__data | Analyte Replicate Filter | TCGA-18-3407-01A-01D-0978-01 | TCGA-18-3407-01A-01D-1969-01 |
| TCGA-66-2759 | snp__genome_wide_snp_6__broad_mit_edu__Level_2__raw_copynumber__data | Analyte Replicate Filter | TCGA-66-2759-01A-01D-0844-01 | TCGA-66-2759-01A-01D-1969-01 |
| TCGA-37-4141 | snp__genome_wide_snp_6__broad_mit_edu__Level_2__raw_copynumber__data | Analyte Replicate Filter | TCGA-37-4141-01A-02D-1097-01 | TCGA-37-4141-01A-02D-1969-01 |
| TCGA-22-4601 | snp__genome_wide_snp_6__broad_mit_edu__Level_2__raw_copynumber__data | Analyte Replicate Filter | TCGA-22-4601-01A-01D-1439-01 | TCGA-22-4601-01A-01D-1969-01 |
| TCGA-37-4129 | snp__genome_wide_snp_6__broad_mit_edu__Level_2__raw_copynumber__data | Analyte Replicate Filter | TCGA-37-4129-01A-01D-1097-01 | TCGA-37-4129-01A-01D-1969-01 |
| TCGA-66-2758 | snp__genome_wide_snp_6__broad_mit_edu__Level_2__raw_copynumber__data | Analyte Replicate Filter | TCGA-66-2758-01A-02D-0844-01 | TCGA-66-2758-01A-02D-1969-01 |
| TCGA-18-3410 | snp__genome_wide_snp_6__broad_mit_edu__Level_2__raw_copynumber__data | Analyte Replicate Filter | TCGA-18-3410-01A-01D-0978-01 | TCGA-18-3410-01A-01D-1969-01 |
| TCGA-60-2720 | snp__genome_wide_snp_6__broad_mit_edu__Level_2__raw_copynumber__data | Analyte Replicate Filter | TCGA-60-2720-01A-01D-0844-01 | TCGA-60-2720-01A-01D-1969-01 |
| TCGA-51-4080 | snp__genome_wide_snp_6__broad_mit_edu__Level_2__raw_copynumber__data | Analyte Replicate Filter | TCGA-51-4080-01A-01D-1097-01 | TCGA-51-4080-01A-01D-1969-01 |
| TCGA-43-2578 | snp__genome_wide_snp_6__broad_mit_edu__Level_2__raw_copynumber__data | Analyte Replicate Filter | TCGA-43-2578-01A-01D-0844-01 | TCGA-43-2578-01A-01D-1969-01 |
| TCGA-43-3394 | snp__genome_wide_snp_6__broad_mit_edu__Level_2__raw_copynumber__data | Analyte Replicate Filter | TCGA-43-3394-01A-01D-0978-01 | TCGA-43-3394-01A-01D-1549-01 |
| TCGA-60-2710 | snp__genome_wide_snp_6__broad_mit_edu__Level_2__raw_copynumber__data | Analyte Replicate Filter | TCGA-60-2710-01A-01D-0844-01 | TCGA-60-2710-01A-01D-1969-01 |
| TCGA-43-3920 | snp__genome_wide_snp_6__broad_mit_edu__Level_2__raw_copynumber__data | Analyte Replicate Filter | TCGA-43-3920-01A-01D-0978-01 | TCGA-43-3920-01A-01D-1549-01 |
| TCGA-18-3411 | snp__genome_wide_snp_6__broad_mit_edu__Level_2__raw_copynumber__data | Analyte Replicate Filter | TCGA-18-3411-01A-01D-0978-01 | TCGA-18-3411-01A-01D-1969-01 |
| TCGA-37-3792 | snp__genome_wide_snp_6__broad_mit_edu__Level_2__raw_copynumber__data | Analyte Replicate Filter | TCGA-37-3792-01A-01D-0978-01 | TCGA-37-3792-01A-01D-1969-01 |
| TCGA-66-2791 | snp__genome_wide_snp_6__broad_mit_edu__Level_2__raw_copynumber__data | Analyte Replicate Filter | TCGA-66-2791-01A-01D-0978-01 | TCGA-66-2791-01A-01D-1969-01 |
| TCGA-66-2744 | snp__genome_wide_snp_6__broad_mit_edu__Level_2__raw_copynumber__data | Analyte Replicate Filter | TCGA-66-2744-01A-01D-0978-01 | TCGA-66-2744-01A-01D-1969-01 |
| TCGA-37-4135 | snp__genome_wide_snp_6__broad_mit_edu__Level_3__segmented_scna_hg18__seg | Analyte Replicate Filter | TCGA-37-4135-01A-01D-1097-01 | TCGA-37-4135-01A-01D-1969-01 |
| TCGA-37-4130 | snp__genome_wide_snp_6__broad_mit_edu__Level_3__segmented_scna_hg18__seg | Analyte Replicate Filter | TCGA-37-4130-01A-01D-1097-01 | TCGA-37-4130-01A-01D-1969-01 |
| TCGA-37-4132 | snp__genome_wide_snp_6__broad_mit_edu__Level_3__segmented_scna_hg18__seg | Analyte Replicate Filter | TCGA-37-4132-01A-01D-1097-01 | TCGA-37-4132-01A-01D-1969-01 |
| TCGA-18-3407 | snp__genome_wide_snp_6__broad_mit_edu__Level_3__segmented_scna_hg18__seg | Analyte Replicate Filter | TCGA-18-3407-01A-01D-0978-01 | TCGA-18-3407-01A-01D-1969-01 |
| TCGA-37-4141 | snp__genome_wide_snp_6__broad_mit_edu__Level_3__segmented_scna_hg18__seg | Analyte Replicate Filter | TCGA-37-4141-01A-02D-1097-01 | TCGA-37-4141-01A-02D-1969-01 |
| TCGA-22-4601 | snp__genome_wide_snp_6__broad_mit_edu__Level_3__segmented_scna_hg18__seg | Analyte Replicate Filter | TCGA-22-4601-01A-01D-1439-01 | TCGA-22-4601-01A-01D-1969-01 |
| TCGA-37-4129 | snp__genome_wide_snp_6__broad_mit_edu__Level_3__segmented_scna_hg18__seg | Analyte Replicate Filter | TCGA-37-4129-01A-01D-1097-01 | TCGA-37-4129-01A-01D-1969-01 |
| TCGA-18-3410 | snp__genome_wide_snp_6__broad_mit_edu__Level_3__segmented_scna_hg18__seg | Analyte Replicate Filter | TCGA-18-3410-01A-01D-0978-01 | TCGA-18-3410-01A-01D-1969-01 |
| TCGA-51-4080 | snp__genome_wide_snp_6__broad_mit_edu__Level_3__segmented_scna_hg18__seg | Analyte Replicate Filter | TCGA-51-4080-01A-01D-1097-01 | TCGA-51-4080-01A-01D-1969-01 |
| TCGA-43-2578 | snp__genome_wide_snp_6__broad_mit_edu__Level_3__segmented_scna_hg18__seg | Analyte Replicate Filter | TCGA-43-2578-01A-01D-0844-01 | TCGA-43-2578-01A-01D-1969-01 |
| TCGA-43-3394 | snp__genome_wide_snp_6__broad_mit_edu__Level_3__segmented_scna_hg18__seg | Analyte Replicate Filter | TCGA-43-3394-01A-01D-0978-01 | TCGA-43-3394-01A-01D-1549-01 |
| TCGA-43-3920 | snp__genome_wide_snp_6__broad_mit_edu__Level_3__segmented_scna_hg18__seg | Analyte Replicate Filter | TCGA-43-3920-01A-01D-0978-01 | TCGA-43-3920-01A-01D-1549-01 |
| TCGA-18-3411 | snp__genome_wide_snp_6__broad_mit_edu__Level_3__segmented_scna_hg18__seg | Analyte Replicate Filter | TCGA-18-3411-01A-01D-0978-01 | TCGA-18-3411-01A-01D-1969-01 |
| TCGA-37-3792 | snp__genome_wide_snp_6__broad_mit_edu__Level_3__segmented_scna_hg18__seg | Analyte Replicate Filter | TCGA-37-3792-01A-01D-0978-01 | TCGA-37-3792-01A-01D-1969-01 |
| TCGA-66-2791 | snp__genome_wide_snp_6__broad_mit_edu__Level_3__segmented_scna_hg18__seg | Analyte Replicate Filter | TCGA-66-2791-01A-01D-0978-01 | TCGA-66-2791-01A-01D-1969-01 |
| TCGA-43-3394 | snp__genome_wide_snp_6__broad_mit_edu__Level_2__after_5NN_copy_number__data | Analyte Replicate Filter | TCGA-43-3394-01A-01D-0978-01 | TCGA-43-3394-01A-01D-1549-01 |
| TCGA-43-3920 | snp__genome_wide_snp_6__broad_mit_edu__Level_2__after_5NN_copy_number__data | Analyte Replicate Filter | TCGA-43-3920-01A-01D-0978-01 | TCGA-43-3920-01A-01D-1549-01 |
| TCGA-37-4135 | snp__genome_wide_snp_6__broad_mit_edu__Level_2__birdseed_genotype__birdseed | Analyte Replicate Filter | TCGA-37-4135-01A-01D-1097-01 | TCGA-37-4135-01A-01D-1969-01 |
| TCGA-37-4130 | snp__genome_wide_snp_6__broad_mit_edu__Level_2__birdseed_genotype__birdseed | Analyte Replicate Filter | TCGA-37-4130-01A-01D-1097-01 | TCGA-37-4130-01A-01D-1969-01 |
| TCGA-37-4132 | snp__genome_wide_snp_6__broad_mit_edu__Level_2__birdseed_genotype__birdseed | Analyte Replicate Filter | TCGA-37-4132-01A-01D-1097-01 | TCGA-37-4132-01A-01D-1969-01 |
| TCGA-18-3407 | snp__genome_wide_snp_6__broad_mit_edu__Level_2__birdseed_genotype__birdseed | Analyte Replicate Filter | TCGA-18-3407-01A-01D-0978-01 | TCGA-18-3407-01A-01D-1969-01 |
| TCGA-66-2759 | snp__genome_wide_snp_6__broad_mit_edu__Level_2__birdseed_genotype__birdseed | Analyte Replicate Filter | TCGA-66-2759-01A-01D-0844-01 | TCGA-66-2759-01A-01D-1969-01 |
| TCGA-37-4141 | snp__genome_wide_snp_6__broad_mit_edu__Level_2__birdseed_genotype__birdseed | Analyte Replicate Filter | TCGA-37-4141-01A-02D-1097-01 | TCGA-37-4141-01A-02D-1969-01 |
| TCGA-22-4601 | snp__genome_wide_snp_6__broad_mit_edu__Level_2__birdseed_genotype__birdseed | Analyte Replicate Filter | TCGA-22-4601-01A-01D-1439-01 | TCGA-22-4601-01A-01D-1969-01 |
| TCGA-37-4129 | snp__genome_wide_snp_6__broad_mit_edu__Level_2__birdseed_genotype__birdseed | Analyte Replicate Filter | TCGA-37-4129-01A-01D-1097-01 | TCGA-37-4129-01A-01D-1969-01 |
| TCGA-66-2758 | snp__genome_wide_snp_6__broad_mit_edu__Level_2__birdseed_genotype__birdseed | Analyte Replicate Filter | TCGA-66-2758-01A-02D-0844-01 | TCGA-66-2758-01A-02D-1969-01 |
| TCGA-18-3410 | snp__genome_wide_snp_6__broad_mit_edu__Level_2__birdseed_genotype__birdseed | Analyte Replicate Filter | TCGA-18-3410-01A-01D-0978-01 | TCGA-18-3410-01A-01D-1969-01 |
| TCGA-60-2720 | snp__genome_wide_snp_6__broad_mit_edu__Level_2__birdseed_genotype__birdseed | Analyte Replicate Filter | TCGA-60-2720-01A-01D-0844-01 | TCGA-60-2720-01A-01D-1969-01 |
| TCGA-51-4080 | snp__genome_wide_snp_6__broad_mit_edu__Level_2__birdseed_genotype__birdseed | Analyte Replicate Filter | TCGA-51-4080-01A-01D-1097-01 | TCGA-51-4080-01A-01D-1969-01 |
| TCGA-43-2578 | snp__genome_wide_snp_6__broad_mit_edu__Level_2__birdseed_genotype__birdseed | Analyte Replicate Filter | TCGA-43-2578-01A-01D-0844-01 | TCGA-43-2578-01A-01D-1969-01 |
| TCGA-43-3394 | snp__genome_wide_snp_6__broad_mit_edu__Level_2__birdseed_genotype__birdseed | Analyte Replicate Filter | TCGA-43-3394-01A-01D-0978-01 | TCGA-43-3394-01A-01D-1549-01 |
| TCGA-60-2710 | snp__genome_wide_snp_6__broad_mit_edu__Level_2__birdseed_genotype__birdseed | Analyte Replicate Filter | TCGA-60-2710-01A-01D-0844-01 | TCGA-60-2710-01A-01D-1969-01 |
| TCGA-43-3920 | snp__genome_wide_snp_6__broad_mit_edu__Level_2__birdseed_genotype__birdseed | Analyte Replicate Filter | TCGA-43-3920-01A-01D-0978-01 | TCGA-43-3920-01A-01D-1549-01 |
| TCGA-18-3411 | snp__genome_wide_snp_6__broad_mit_edu__Level_2__birdseed_genotype__birdseed | Analyte Replicate Filter | TCGA-18-3411-01A-01D-0978-01 | TCGA-18-3411-01A-01D-1969-01 |
| TCGA-37-3792 | snp__genome_wide_snp_6__broad_mit_edu__Level_2__birdseed_genotype__birdseed | Analyte Replicate Filter | TCGA-37-3792-01A-01D-0978-01 | TCGA-37-3792-01A-01D-1969-01 |
| TCGA-66-2791 | snp__genome_wide_snp_6__broad_mit_edu__Level_2__birdseed_genotype__birdseed | Analyte Replicate Filter | TCGA-66-2791-01A-01D-0978-01 | TCGA-66-2791-01A-01D-1969-01 |
| TCGA-66-2744 | snp__genome_wide_snp_6__broad_mit_edu__Level_2__birdseed_genotype__birdseed | Analyte Replicate Filter | TCGA-66-2744-01A-01D-0978-01 | TCGA-66-2744-01A-01D-1969-01 |
| TCGA-37-4135 | snp__genome_wide_snp_6__broad_mit_edu__Level_3__segmented_scna_hg19__seg | Analyte Replicate Filter | TCGA-37-4135-01A-01D-1097-01 | TCGA-37-4135-01A-01D-1969-01 |
| TCGA-37-4130 | snp__genome_wide_snp_6__broad_mit_edu__Level_3__segmented_scna_hg19__seg | Analyte Replicate Filter | TCGA-37-4130-01A-01D-1097-01 | TCGA-37-4130-01A-01D-1969-01 |
| TCGA-37-4132 | snp__genome_wide_snp_6__broad_mit_edu__Level_3__segmented_scna_hg19__seg | Analyte Replicate Filter | TCGA-37-4132-01A-01D-1097-01 | TCGA-37-4132-01A-01D-1969-01 |
| TCGA-18-3407 | snp__genome_wide_snp_6__broad_mit_edu__Level_3__segmented_scna_hg19__seg | Analyte Replicate Filter | TCGA-18-3407-01A-01D-0978-01 | TCGA-18-3407-01A-01D-1969-01 |
| TCGA-37-4141 | snp__genome_wide_snp_6__broad_mit_edu__Level_3__segmented_scna_hg19__seg | Analyte Replicate Filter | TCGA-37-4141-01A-02D-1097-01 | TCGA-37-4141-01A-02D-1969-01 |
| TCGA-22-4601 | snp__genome_wide_snp_6__broad_mit_edu__Level_3__segmented_scna_hg19__seg | Analyte Replicate Filter | TCGA-22-4601-01A-01D-1439-01 | TCGA-22-4601-01A-01D-1969-01 |
| TCGA-37-4129 | snp__genome_wide_snp_6__broad_mit_edu__Level_3__segmented_scna_hg19__seg | Analyte Replicate Filter | TCGA-37-4129-01A-01D-1097-01 | TCGA-37-4129-01A-01D-1969-01 |
| TCGA-18-3410 | snp__genome_wide_snp_6__broad_mit_edu__Level_3__segmented_scna_hg19__seg | Analyte Replicate Filter | TCGA-18-3410-01A-01D-0978-01 | TCGA-18-3410-01A-01D-1969-01 |
| TCGA-51-4080 | snp__genome_wide_snp_6__broad_mit_edu__Level_3__segmented_scna_hg19__seg | Analyte Replicate Filter | TCGA-51-4080-01A-01D-1097-01 | TCGA-51-4080-01A-01D-1969-01 |
| TCGA-43-2578 | snp__genome_wide_snp_6__broad_mit_edu__Level_3__segmented_scna_hg19__seg | Analyte Replicate Filter | TCGA-43-2578-01A-01D-0844-01 | TCGA-43-2578-01A-01D-1969-01 |
| TCGA-43-3394 | snp__genome_wide_snp_6__broad_mit_edu__Level_3__segmented_scna_hg19__seg | Analyte Replicate Filter | TCGA-43-3394-01A-01D-0978-01 | TCGA-43-3394-01A-01D-1549-01 |
| TCGA-43-3920 | snp__genome_wide_snp_6__broad_mit_edu__Level_3__segmented_scna_hg19__seg | Analyte Replicate Filter | TCGA-43-3920-01A-01D-0978-01 | TCGA-43-3920-01A-01D-1549-01 |
| TCGA-18-3411 | snp__genome_wide_snp_6__broad_mit_edu__Level_3__segmented_scna_hg19__seg | Analyte Replicate Filter | TCGA-18-3411-01A-01D-0978-01 | TCGA-18-3411-01A-01D-1969-01 |
| TCGA-37-3792 | snp__genome_wide_snp_6__broad_mit_edu__Level_3__segmented_scna_hg19__seg | Analyte Replicate Filter | TCGA-37-3792-01A-01D-0978-01 | TCGA-37-3792-01A-01D-1969-01 |
| TCGA-66-2791 | snp__genome_wide_snp_6__broad_mit_edu__Level_3__segmented_scna_hg19__seg | Analyte Replicate Filter | TCGA-66-2791-01A-01D-0978-01 | TCGA-66-2791-01A-01D-1969-01 |
| TCGA-43-3394 | snp__genome_wide_snp_6__broad_mit_edu__Level_1__image_acquisition__data | Analyte Replicate Filter | TCGA-43-3394-01A-01D-0978-01 | TCGA-43-3394-01A-01D-1549-01 |
| TCGA-43-3920 | snp__genome_wide_snp_6__broad_mit_edu__Level_1__image_acquisition__data | Analyte Replicate Filter | TCGA-43-3920-01A-01D-0978-01 | TCGA-43-3920-01A-01D-1549-01 |
| TCGA-37-4135 | snp__genome_wide_snp_6__broad_mit_edu__Level_2__invariantset_medianpolish__data | Analyte Replicate Filter | TCGA-37-4135-01A-01D-1097-01 | TCGA-37-4135-01A-01D-1969-01 |
| TCGA-37-4130 | snp__genome_wide_snp_6__broad_mit_edu__Level_2__invariantset_medianpolish__data | Analyte Replicate Filter | TCGA-37-4130-01A-01D-1097-01 | TCGA-37-4130-01A-01D-1969-01 |
| TCGA-37-4132 | snp__genome_wide_snp_6__broad_mit_edu__Level_2__invariantset_medianpolish__data | Analyte Replicate Filter | TCGA-37-4132-01A-01D-1097-01 | TCGA-37-4132-01A-01D-1969-01 |
| TCGA-18-3407 | snp__genome_wide_snp_6__broad_mit_edu__Level_2__invariantset_medianpolish__data | Analyte Replicate Filter | TCGA-18-3407-01A-01D-0978-01 | TCGA-18-3407-01A-01D-1969-01 |
| TCGA-37-4141 | snp__genome_wide_snp_6__broad_mit_edu__Level_2__invariantset_medianpolish__data | Analyte Replicate Filter | TCGA-37-4141-01A-02D-1097-01 | TCGA-37-4141-01A-02D-1969-01 |
| TCGA-22-4601 | snp__genome_wide_snp_6__broad_mit_edu__Level_2__invariantset_medianpolish__data | Analyte Replicate Filter | TCGA-22-4601-01A-01D-1439-01 | TCGA-22-4601-01A-01D-1969-01 |
| TCGA-37-4129 | snp__genome_wide_snp_6__broad_mit_edu__Level_2__invariantset_medianpolish__data | Analyte Replicate Filter | TCGA-37-4129-01A-01D-1097-01 | TCGA-37-4129-01A-01D-1969-01 |
| TCGA-66-2759 | snp__genome_wide_snp_6__broad_mit_edu__Level_2__invariantset_medianpolish__data | Analyte Replicate Filter | TCGA-66-2759-01A-01D-0844-01 | TCGA-66-2759-01A-01D-1969-01 |
| TCGA-66-2758 | snp__genome_wide_snp_6__broad_mit_edu__Level_2__invariantset_medianpolish__data | Analyte Replicate Filter | TCGA-66-2758-01A-02D-0844-01 | TCGA-66-2758-01A-02D-1969-01 |
| TCGA-18-3410 | snp__genome_wide_snp_6__broad_mit_edu__Level_2__invariantset_medianpolish__data | Analyte Replicate Filter | TCGA-18-3410-01A-01D-0978-01 | TCGA-18-3410-01A-01D-1969-01 |
| TCGA-60-2720 | snp__genome_wide_snp_6__broad_mit_edu__Level_2__invariantset_medianpolish__data | Analyte Replicate Filter | TCGA-60-2720-01A-01D-0844-01 | TCGA-60-2720-01A-01D-1969-01 |
| TCGA-43-3394 | snp__genome_wide_snp_6__broad_mit_edu__Level_2__invariantset_medianpolish__data | Analyte Replicate Filter | TCGA-43-3394-01A-01D-0978-01 | TCGA-43-3394-01A-01D-1549-01 |
| TCGA-51-4080 | snp__genome_wide_snp_6__broad_mit_edu__Level_2__invariantset_medianpolish__data | Analyte Replicate Filter | TCGA-51-4080-01A-01D-1097-01 | TCGA-51-4080-01A-01D-1969-01 |
| TCGA-43-2578 | snp__genome_wide_snp_6__broad_mit_edu__Level_2__invariantset_medianpolish__data | Analyte Replicate Filter | TCGA-43-2578-01A-01D-0844-01 | TCGA-43-2578-01A-01D-1969-01 |
| TCGA-60-2710 | snp__genome_wide_snp_6__broad_mit_edu__Level_2__invariantset_medianpolish__data | Analyte Replicate Filter | TCGA-60-2710-01A-01D-0844-01 | TCGA-60-2710-01A-01D-1969-01 |
| TCGA-43-3920 | snp__genome_wide_snp_6__broad_mit_edu__Level_2__invariantset_medianpolish__data | Analyte Replicate Filter | TCGA-43-3920-01A-01D-0978-01 | TCGA-43-3920-01A-01D-1549-01 |
| TCGA-18-3411 | snp__genome_wide_snp_6__broad_mit_edu__Level_2__invariantset_medianpolish__data | Analyte Replicate Filter | TCGA-18-3411-01A-01D-0978-01 | TCGA-18-3411-01A-01D-1969-01 |
| TCGA-37-3792 | snp__genome_wide_snp_6__broad_mit_edu__Level_2__invariantset_medianpolish__data | Analyte Replicate Filter | TCGA-37-3792-01A-01D-0978-01 | TCGA-37-3792-01A-01D-1969-01 |
| TCGA-66-2791 | snp__genome_wide_snp_6__broad_mit_edu__Level_2__invariantset_medianpolish__data | Analyte Replicate Filter | TCGA-66-2791-01A-01D-0978-01 | TCGA-66-2791-01A-01D-1969-01 |
| TCGA-66-2744 | snp__genome_wide_snp_6__broad_mit_edu__Level_2__invariantset_medianpolish__data | Analyte Replicate Filter | TCGA-66-2744-01A-01D-0978-01 | TCGA-66-2744-01A-01D-1969-01 |
| TCGA-43-3394 | snp__genome_wide_snp_6__broad_mit_edu__Level_2__copy_number__data | Analyte Replicate Filter | TCGA-43-3394-01A-01D-0978-01 | TCGA-43-3394-01A-01D-1549-01 |
| TCGA-43-3920 | snp__genome_wide_snp_6__broad_mit_edu__Level_2__copy_number__data | Analyte Replicate Filter | TCGA-43-3920-01A-01D-0978-01 | TCGA-43-3920-01A-01D-1549-01 |
Table S12.
| Participant Id | DataType__Platform__Center__DataLevel__ProtocolName_Extension | Filter Reason | Removed Sample(s) | Chosen Sample |
|---|---|---|---|---|
| TCGA-72-4236 | snp__genome_wide_snp_6__broad_mit_edu__Level_3__segmented_scna_minus_germline_cnv_hg19__seg | Analyte Replicate Filter | TCGA-72-4236-01A-01D-1014-08 | TCGA-72-4236-01A-01D-1017-01 |
| TCGA-72-4237 | snp__genome_wide_snp_6__broad_mit_edu__Level_3__segmented_scna_minus_germline_cnv_hg19__seg | Analyte Replicate Filter | TCGA-72-4237-01A-01D-1014-08 | TCGA-72-4237-01A-01D-1017-01 |
| TCGA-72-4232 | snp__genome_wide_snp_6__broad_mit_edu__Level_3__segmented_scna_minus_germline_cnv_hg19__seg | Analyte Replicate Filter | TCGA-72-4232-01A-01D-1014-08 | TCGA-72-4232-01A-01D-1017-01 |
| TCGA-29-1692 | snp__genome_wide_snp_6__broad_mit_edu__Level_3__segmented_scna_minus_germline_cnv_hg19__seg | Analyte Replicate Filter | TCGA-29-1692-01B-01D-0803-01 | TCGA-29-1692-01B-01D-2069-01 |
| TCGA-72-4241 | snp__genome_wide_snp_6__broad_mit_edu__Level_3__segmented_scna_minus_germline_cnv_hg19__seg | Analyte Replicate Filter | TCGA-72-4241-01A-01D-1014-08 | TCGA-72-4241-01A-01D-1017-01 |
| TCGA-29-1704 | snp__genome_wide_snp_6__broad_mit_edu__Level_3__segmented_scna_minus_germline_cnv_hg19__seg | Analyte Replicate Filter | TCGA-29-1704-02A-01D-0803-01 | TCGA-29-1704-02A-01D-2069-01 |
| TCGA-72-4233 | snp__genome_wide_snp_6__broad_mit_edu__Level_3__segmented_scna_minus_germline_cnv_hg19__seg | Analyte Replicate Filter | TCGA-72-4233-01A-01D-1014-08 | TCGA-72-4233-01A-01D-1017-01 |
| TCGA-72-4231 | snp__genome_wide_snp_6__broad_mit_edu__Level_3__segmented_scna_minus_germline_cnv_hg19__seg | Analyte Replicate Filter | TCGA-72-4231-01A-01D-1014-08 | TCGA-72-4231-01A-01D-1017-01 |
| TCGA-29-2414 | snp__genome_wide_snp_6__broad_mit_edu__Level_3__segmented_scna_minus_germline_cnv_hg19__seg | Analyte Replicate Filter | TCGA-29-2414-01A-02D-0704-01 | TCGA-29-2414-01A-02D-2069-01 |
| TCGA-72-4235 | snp__genome_wide_snp_6__broad_mit_edu__Level_3__segmented_scna_minus_germline_cnv_hg19__seg | Analyte Replicate Filter | TCGA-72-4235-01A-01D-1014-08 | TCGA-72-4235-01A-01D-1017-01 |
| TCGA-72-4240 | snp__genome_wide_snp_6__broad_mit_edu__Level_3__segmented_scna_minus_germline_cnv_hg19__seg | Analyte Replicate Filter | TCGA-72-4240-01A-01D-1014-08 | TCGA-72-4240-01A-01D-1017-01 |
| TCGA-72-4234 | snp__genome_wide_snp_6__broad_mit_edu__Level_3__segmented_scna_minus_germline_cnv_hg19__seg | Analyte Replicate Filter | TCGA-72-4234-01A-01D-1014-08 | TCGA-72-4234-01A-01D-1017-01 |
| TCGA-29-1705 | snp__genome_wide_snp_6__broad_mit_edu__Level_3__segmented_scna_minus_germline_cnv_hg19__seg | Analyte Replicate Filter | TCGA-29-1705-02A-01D-0803-01 | TCGA-29-1705-02A-01D-2069-01 |
| TCGA-13-0791 | snp__genome_wide_snp_6__broad_mit_edu__Level_3__segmented_scna_minus_germline_cnv_hg19__seg | Analyte Replicate Filter | TCGA-13-0791-02A-01D-0803-01 | TCGA-13-0791-02A-01D-2069-01 |
| TCGA-13-1819 | snp__genome_wide_snp_6__broad_mit_edu__Level_3__segmented_scna_minus_germline_cnv_hg19__seg | Analyte Replicate Filter | TCGA-13-1819-01A-01D-0803-01 | TCGA-13-1819-01A-01D-2069-01 |
| TCGA-72-4238 | snp__genome_wide_snp_6__broad_mit_edu__Level_3__segmented_scna_minus_germline_cnv_hg19__seg | Analyte Replicate Filter | TCGA-72-4238-01A-01D-1014-08 | TCGA-72-4238-01A-01D-1017-01 |
| TCGA-72-4236 | snp__genome_wide_snp_6__broad_mit_edu__Level_2__birdseed_genotype__birdseed | Analyte Replicate Filter | TCGA-72-4236-01A-01D-1014-08 | TCGA-72-4236-01A-01D-1017-01 |
| TCGA-72-4237 | snp__genome_wide_snp_6__broad_mit_edu__Level_2__birdseed_genotype__birdseed | Analyte Replicate Filter | TCGA-72-4237-01A-01D-1014-08 | TCGA-72-4237-01A-01D-1017-01 |
| TCGA-13-1817 | snp__genome_wide_snp_6__broad_mit_edu__Level_2__birdseed_genotype__birdseed | Analyte Replicate Filter | TCGA-13-1817-01A-01D-0803-01 | TCGA-13-1817-01A-01D-2069-01 |
| TCGA-13-1817 | snp__genome_wide_snp_6__broad_mit_edu__Level_2__birdseed_genotype__birdseed | Analyte Replicate Filter | TCGA-13-1817-02A-01D-0803-01 | TCGA-13-1817-02A-01D-2069-01 |
| TCGA-72-4232 | snp__genome_wide_snp_6__broad_mit_edu__Level_2__birdseed_genotype__birdseed | Analyte Replicate Filter | TCGA-72-4232-01A-01D-1014-08 | TCGA-72-4232-01A-01D-1017-01 |
| TCGA-29-1692 | snp__genome_wide_snp_6__broad_mit_edu__Level_2__birdseed_genotype__birdseed | Analyte Replicate Filter | TCGA-29-1692-01B-01D-0803-01 | TCGA-29-1692-01B-01D-2069-01 |
| TCGA-29-1692 | snp__genome_wide_snp_6__broad_mit_edu__Level_2__birdseed_genotype__birdseed | Analyte Replicate Filter | TCGA-29-1692-02A-01D-0803-01 | TCGA-29-1692-02A-01D-2069-01 |
| TCGA-29-1770 | snp__genome_wide_snp_6__broad_mit_edu__Level_2__birdseed_genotype__birdseed | Analyte Replicate Filter | TCGA-29-1770-02A-01D-0803-01 | TCGA-29-1770-02A-01D-2069-01 |
| TCGA-13-1489 | snp__genome_wide_snp_6__broad_mit_edu__Level_2__birdseed_genotype__birdseed | Analyte Replicate Filter | TCGA-13-1489-02A-01D-0803-01 | TCGA-13-1489-02A-01D-2069-01 |
| TCGA-61-2008 | snp__genome_wide_snp_6__broad_mit_edu__Level_2__birdseed_genotype__birdseed | Analyte Replicate Filter | TCGA-61-2008-02A-01D-0803-01 | TCGA-61-2008-02A-01D-2069-01 |
| TCGA-72-4241 | snp__genome_wide_snp_6__broad_mit_edu__Level_2__birdseed_genotype__birdseed | Analyte Replicate Filter | TCGA-72-4241-01A-01D-1014-08 | TCGA-72-4241-01A-01D-1017-01 |
| TCGA-29-1704 | snp__genome_wide_snp_6__broad_mit_edu__Level_2__birdseed_genotype__birdseed | Analyte Replicate Filter | TCGA-29-1704-02A-01D-0803-01 | TCGA-29-1704-02A-01D-2069-01 |
| TCGA-72-4233 | snp__genome_wide_snp_6__broad_mit_edu__Level_2__birdseed_genotype__birdseed | Analyte Replicate Filter | TCGA-72-4233-01A-01D-1014-08 | TCGA-72-4233-01A-01D-1017-01 |
| TCGA-72-4231 | snp__genome_wide_snp_6__broad_mit_edu__Level_2__birdseed_genotype__birdseed | Analyte Replicate Filter | TCGA-72-4231-01A-01D-1014-08 | TCGA-72-4231-01A-01D-1017-01 |
| TCGA-29-2414 | snp__genome_wide_snp_6__broad_mit_edu__Level_2__birdseed_genotype__birdseed | Analyte Replicate Filter | TCGA-29-2414-01A-02D-0704-01 | TCGA-29-2414-01A-02D-2069-01 |
| TCGA-72-4235 | snp__genome_wide_snp_6__broad_mit_edu__Level_2__birdseed_genotype__birdseed | Analyte Replicate Filter | TCGA-72-4235-01A-01D-1014-08 | TCGA-72-4235-01A-01D-1017-01 |
| TCGA-72-4240 | snp__genome_wide_snp_6__broad_mit_edu__Level_2__birdseed_genotype__birdseed | Analyte Replicate Filter | TCGA-72-4240-01A-01D-1014-08 | TCGA-72-4240-01A-01D-1017-01 |
| TCGA-72-4234 | snp__genome_wide_snp_6__broad_mit_edu__Level_2__birdseed_genotype__birdseed | Analyte Replicate Filter | TCGA-72-4234-01A-01D-1014-08 | TCGA-72-4234-01A-01D-1017-01 |
| TCGA-29-1705 | snp__genome_wide_snp_6__broad_mit_edu__Level_2__birdseed_genotype__birdseed | Analyte Replicate Filter | TCGA-29-1705-02A-01D-0803-01 | TCGA-29-1705-02A-01D-2069-01 |
| TCGA-13-0791 | snp__genome_wide_snp_6__broad_mit_edu__Level_2__birdseed_genotype__birdseed | Analyte Replicate Filter | TCGA-13-0791-02A-01D-0803-01 | TCGA-13-0791-02A-01D-2069-01 |
| TCGA-13-1819 | snp__genome_wide_snp_6__broad_mit_edu__Level_2__birdseed_genotype__birdseed | Analyte Replicate Filter | TCGA-13-1819-02A-01D-0803-01 | TCGA-13-1819-02A-01D-2069-01 |
| TCGA-13-1819 | snp__genome_wide_snp_6__broad_mit_edu__Level_2__birdseed_genotype__birdseed | Analyte Replicate Filter | TCGA-13-1819-01A-01D-0803-01 | TCGA-13-1819-01A-01D-2069-01 |
| TCGA-72-4238 | snp__genome_wide_snp_6__broad_mit_edu__Level_2__birdseed_genotype__birdseed | Analyte Replicate Filter | TCGA-72-4238-01A-01D-1014-08 | TCGA-72-4238-01A-01D-1017-01 |
| TCGA-72-4236 | snp__genome_wide_snp_6__broad_mit_edu__Level_3__segmented_scna_minus_germline_cnv_hg18__seg | Analyte Replicate Filter | TCGA-72-4236-01A-01D-1014-08 | TCGA-72-4236-01A-01D-1017-01 |
| TCGA-72-4237 | snp__genome_wide_snp_6__broad_mit_edu__Level_3__segmented_scna_minus_germline_cnv_hg18__seg | Analyte Replicate Filter | TCGA-72-4237-01A-01D-1014-08 | TCGA-72-4237-01A-01D-1017-01 |
| TCGA-72-4232 | snp__genome_wide_snp_6__broad_mit_edu__Level_3__segmented_scna_minus_germline_cnv_hg18__seg | Analyte Replicate Filter | TCGA-72-4232-01A-01D-1014-08 | TCGA-72-4232-01A-01D-1017-01 |
| TCGA-29-1692 | snp__genome_wide_snp_6__broad_mit_edu__Level_3__segmented_scna_minus_germline_cnv_hg18__seg | Analyte Replicate Filter | TCGA-29-1692-01B-01D-0803-01 | TCGA-29-1692-01B-01D-2069-01 |
| TCGA-72-4241 | snp__genome_wide_snp_6__broad_mit_edu__Level_3__segmented_scna_minus_germline_cnv_hg18__seg | Analyte Replicate Filter | TCGA-72-4241-01A-01D-1014-08 | TCGA-72-4241-01A-01D-1017-01 |
| TCGA-29-1704 | snp__genome_wide_snp_6__broad_mit_edu__Level_3__segmented_scna_minus_germline_cnv_hg18__seg | Analyte Replicate Filter | TCGA-29-1704-02A-01D-0803-01 | TCGA-29-1704-02A-01D-2069-01 |
| TCGA-72-4233 | snp__genome_wide_snp_6__broad_mit_edu__Level_3__segmented_scna_minus_germline_cnv_hg18__seg | Analyte Replicate Filter | TCGA-72-4233-01A-01D-1014-08 | TCGA-72-4233-01A-01D-1017-01 |
| TCGA-72-4231 | snp__genome_wide_snp_6__broad_mit_edu__Level_3__segmented_scna_minus_germline_cnv_hg18__seg | Analyte Replicate Filter | TCGA-72-4231-01A-01D-1014-08 | TCGA-72-4231-01A-01D-1017-01 |
| TCGA-29-2414 | snp__genome_wide_snp_6__broad_mit_edu__Level_3__segmented_scna_minus_germline_cnv_hg18__seg | Analyte Replicate Filter | TCGA-29-2414-01A-02D-0704-01 | TCGA-29-2414-01A-02D-2069-01 |
| TCGA-72-4235 | snp__genome_wide_snp_6__broad_mit_edu__Level_3__segmented_scna_minus_germline_cnv_hg18__seg | Analyte Replicate Filter | TCGA-72-4235-01A-01D-1014-08 | TCGA-72-4235-01A-01D-1017-01 |
| TCGA-72-4240 | snp__genome_wide_snp_6__broad_mit_edu__Level_3__segmented_scna_minus_germline_cnv_hg18__seg | Analyte Replicate Filter | TCGA-72-4240-01A-01D-1014-08 | TCGA-72-4240-01A-01D-1017-01 |
| TCGA-72-4234 | snp__genome_wide_snp_6__broad_mit_edu__Level_3__segmented_scna_minus_germline_cnv_hg18__seg | Analyte Replicate Filter | TCGA-72-4234-01A-01D-1014-08 | TCGA-72-4234-01A-01D-1017-01 |
| TCGA-29-1705 | snp__genome_wide_snp_6__broad_mit_edu__Level_3__segmented_scna_minus_germline_cnv_hg18__seg | Analyte Replicate Filter | TCGA-29-1705-02A-01D-0803-01 | TCGA-29-1705-02A-01D-2069-01 |
| TCGA-13-0791 | snp__genome_wide_snp_6__broad_mit_edu__Level_3__segmented_scna_minus_germline_cnv_hg18__seg | Analyte Replicate Filter | TCGA-13-0791-02A-01D-0803-01 | TCGA-13-0791-02A-01D-2069-01 |
| TCGA-13-1819 | snp__genome_wide_snp_6__broad_mit_edu__Level_3__segmented_scna_minus_germline_cnv_hg18__seg | Analyte Replicate Filter | TCGA-13-1819-01A-01D-0803-01 | TCGA-13-1819-01A-01D-2069-01 |
| TCGA-72-4238 | snp__genome_wide_snp_6__broad_mit_edu__Level_3__segmented_scna_minus_germline_cnv_hg18__seg | Analyte Replicate Filter | TCGA-72-4238-01A-01D-1014-08 | TCGA-72-4238-01A-01D-1017-01 |
| TCGA-72-4236 | snp__genome_wide_snp_6__broad_mit_edu__Level_2__tangent_copynumber__data | Analyte Replicate Filter | TCGA-72-4236-01A-01D-1014-08 | TCGA-72-4236-01A-01D-1017-01 |
| TCGA-72-4237 | snp__genome_wide_snp_6__broad_mit_edu__Level_2__tangent_copynumber__data | Analyte Replicate Filter | TCGA-72-4237-01A-01D-1014-08 | TCGA-72-4237-01A-01D-1017-01 |
| TCGA-72-4232 | snp__genome_wide_snp_6__broad_mit_edu__Level_2__tangent_copynumber__data | Analyte Replicate Filter | TCGA-72-4232-01A-01D-1014-08 | TCGA-72-4232-01A-01D-1017-01 |
| TCGA-29-1692 | snp__genome_wide_snp_6__broad_mit_edu__Level_2__tangent_copynumber__data | Analyte Replicate Filter | TCGA-29-1692-01B-01D-0803-01 | TCGA-29-1692-01B-01D-2069-01 |
| TCGA-72-4241 | snp__genome_wide_snp_6__broad_mit_edu__Level_2__tangent_copynumber__data | Analyte Replicate Filter | TCGA-72-4241-01A-01D-1014-08 | TCGA-72-4241-01A-01D-1017-01 |
| TCGA-29-1704 | snp__genome_wide_snp_6__broad_mit_edu__Level_2__tangent_copynumber__data | Analyte Replicate Filter | TCGA-29-1704-02A-01D-0803-01 | TCGA-29-1704-02A-01D-2069-01 |
| TCGA-72-4233 | snp__genome_wide_snp_6__broad_mit_edu__Level_2__tangent_copynumber__data | Analyte Replicate Filter | TCGA-72-4233-01A-01D-1014-08 | TCGA-72-4233-01A-01D-1017-01 |
| TCGA-72-4231 | snp__genome_wide_snp_6__broad_mit_edu__Level_2__tangent_copynumber__data | Analyte Replicate Filter | TCGA-72-4231-01A-01D-1014-08 | TCGA-72-4231-01A-01D-1017-01 |
| TCGA-29-2414 | snp__genome_wide_snp_6__broad_mit_edu__Level_2__tangent_copynumber__data | Analyte Replicate Filter | TCGA-29-2414-01A-02D-0704-01 | TCGA-29-2414-01A-02D-2069-01 |
| TCGA-72-4235 | snp__genome_wide_snp_6__broad_mit_edu__Level_2__tangent_copynumber__data | Analyte Replicate Filter | TCGA-72-4235-01A-01D-1014-08 | TCGA-72-4235-01A-01D-1017-01 |
| TCGA-72-4240 | snp__genome_wide_snp_6__broad_mit_edu__Level_2__tangent_copynumber__data | Analyte Replicate Filter | TCGA-72-4240-01A-01D-1014-08 | TCGA-72-4240-01A-01D-1017-01 |
| TCGA-72-4234 | snp__genome_wide_snp_6__broad_mit_edu__Level_2__tangent_copynumber__data | Analyte Replicate Filter | TCGA-72-4234-01A-01D-1014-08 | TCGA-72-4234-01A-01D-1017-01 |
| TCGA-29-1705 | snp__genome_wide_snp_6__broad_mit_edu__Level_2__tangent_copynumber__data | Analyte Replicate Filter | TCGA-29-1705-02A-01D-0803-01 | TCGA-29-1705-02A-01D-2069-01 |
| TCGA-13-0791 | snp__genome_wide_snp_6__broad_mit_edu__Level_2__tangent_copynumber__data | Analyte Replicate Filter | TCGA-13-0791-02A-01D-0803-01 | TCGA-13-0791-02A-01D-2069-01 |
| TCGA-13-1819 | snp__genome_wide_snp_6__broad_mit_edu__Level_2__tangent_copynumber__data | Analyte Replicate Filter | TCGA-13-1819-01A-01D-0803-01 | TCGA-13-1819-01A-01D-2069-01 |
| TCGA-72-4238 | snp__genome_wide_snp_6__broad_mit_edu__Level_2__tangent_copynumber__data | Analyte Replicate Filter | TCGA-72-4238-01A-01D-1014-08 | TCGA-72-4238-01A-01D-1017-01 |
| TCGA-72-4236 | snp__genome_wide_snp_6__broad_mit_edu__Level_2__raw_copynumber__data | Analyte Replicate Filter | TCGA-72-4236-01A-01D-1014-08 | TCGA-72-4236-01A-01D-1017-01 |
| TCGA-72-4237 | snp__genome_wide_snp_6__broad_mit_edu__Level_2__raw_copynumber__data | Analyte Replicate Filter | TCGA-72-4237-01A-01D-1014-08 | TCGA-72-4237-01A-01D-1017-01 |
| TCGA-13-1817 | snp__genome_wide_snp_6__broad_mit_edu__Level_2__raw_copynumber__data | Analyte Replicate Filter | TCGA-13-1817-01A-01D-0803-01 | TCGA-13-1817-01A-01D-2069-01 |
| TCGA-13-1817 | snp__genome_wide_snp_6__broad_mit_edu__Level_2__raw_copynumber__data | Analyte Replicate Filter | TCGA-13-1817-02A-01D-0803-01 | TCGA-13-1817-02A-01D-2069-01 |
| TCGA-72-4232 | snp__genome_wide_snp_6__broad_mit_edu__Level_2__raw_copynumber__data | Analyte Replicate Filter | TCGA-72-4232-01A-01D-1014-08 | TCGA-72-4232-01A-01D-1017-01 |
| TCGA-29-1692 | snp__genome_wide_snp_6__broad_mit_edu__Level_2__raw_copynumber__data | Analyte Replicate Filter | TCGA-29-1692-01B-01D-0803-01 | TCGA-29-1692-01B-01D-2069-01 |
| TCGA-29-1692 | snp__genome_wide_snp_6__broad_mit_edu__Level_2__raw_copynumber__data | Analyte Replicate Filter | TCGA-29-1692-02A-01D-0803-01 | TCGA-29-1692-02A-01D-2069-01 |
| TCGA-29-1770 | snp__genome_wide_snp_6__broad_mit_edu__Level_2__raw_copynumber__data | Analyte Replicate Filter | TCGA-29-1770-02A-01D-0803-01 | TCGA-29-1770-02A-01D-2069-01 |
| TCGA-13-1489 | snp__genome_wide_snp_6__broad_mit_edu__Level_2__raw_copynumber__data | Analyte Replicate Filter | TCGA-13-1489-02A-01D-0803-01 | TCGA-13-1489-02A-01D-2069-01 |
| TCGA-61-2008 | snp__genome_wide_snp_6__broad_mit_edu__Level_2__raw_copynumber__data | Analyte Replicate Filter | TCGA-61-2008-02A-01D-0803-01 | TCGA-61-2008-02A-01D-2069-01 |
| TCGA-72-4241 | snp__genome_wide_snp_6__broad_mit_edu__Level_2__raw_copynumber__data | Analyte Replicate Filter | TCGA-72-4241-01A-01D-1014-08 | TCGA-72-4241-01A-01D-1017-01 |
| TCGA-29-1704 | snp__genome_wide_snp_6__broad_mit_edu__Level_2__raw_copynumber__data | Analyte Replicate Filter | TCGA-29-1704-02A-01D-0803-01 | TCGA-29-1704-02A-01D-2069-01 |
| TCGA-72-4233 | snp__genome_wide_snp_6__broad_mit_edu__Level_2__raw_copynumber__data | Analyte Replicate Filter | TCGA-72-4233-01A-01D-1014-08 | TCGA-72-4233-01A-01D-1017-01 |
| TCGA-72-4231 | snp__genome_wide_snp_6__broad_mit_edu__Level_2__raw_copynumber__data | Analyte Replicate Filter | TCGA-72-4231-01A-01D-1014-08 | TCGA-72-4231-01A-01D-1017-01 |
| TCGA-29-2414 | snp__genome_wide_snp_6__broad_mit_edu__Level_2__raw_copynumber__data | Analyte Replicate Filter | TCGA-29-2414-01A-02D-0704-01 | TCGA-29-2414-01A-02D-2069-01 |
| TCGA-72-4235 | snp__genome_wide_snp_6__broad_mit_edu__Level_2__raw_copynumber__data | Analyte Replicate Filter | TCGA-72-4235-01A-01D-1014-08 | TCGA-72-4235-01A-01D-1017-01 |
| TCGA-72-4240 | snp__genome_wide_snp_6__broad_mit_edu__Level_2__raw_copynumber__data | Analyte Replicate Filter | TCGA-72-4240-01A-01D-1014-08 | TCGA-72-4240-01A-01D-1017-01 |
| TCGA-72-4234 | snp__genome_wide_snp_6__broad_mit_edu__Level_2__raw_copynumber__data | Analyte Replicate Filter | TCGA-72-4234-01A-01D-1014-08 | TCGA-72-4234-01A-01D-1017-01 |
| TCGA-29-1705 | snp__genome_wide_snp_6__broad_mit_edu__Level_2__raw_copynumber__data | Analyte Replicate Filter | TCGA-29-1705-02A-01D-0803-01 | TCGA-29-1705-02A-01D-2069-01 |
| TCGA-13-0791 | snp__genome_wide_snp_6__broad_mit_edu__Level_2__raw_copynumber__data | Analyte Replicate Filter | TCGA-13-0791-02A-01D-0803-01 | TCGA-13-0791-02A-01D-2069-01 |
| TCGA-13-1819 | snp__genome_wide_snp_6__broad_mit_edu__Level_2__raw_copynumber__data | Analyte Replicate Filter | TCGA-13-1819-02A-01D-0803-01 | TCGA-13-1819-02A-01D-2069-01 |
| TCGA-13-1819 | snp__genome_wide_snp_6__broad_mit_edu__Level_2__raw_copynumber__data | Analyte Replicate Filter | TCGA-13-1819-01A-01D-0803-01 | TCGA-13-1819-01A-01D-2069-01 |
| TCGA-72-4238 | snp__genome_wide_snp_6__broad_mit_edu__Level_2__raw_copynumber__data | Analyte Replicate Filter | TCGA-72-4238-01A-01D-1014-08 | TCGA-72-4238-01A-01D-1017-01 |
| TCGA-72-4236 | snp__genome_wide_snp_6__broad_mit_edu__Level_3__segmented_scna_hg18__seg | Analyte Replicate Filter | TCGA-72-4236-01A-01D-1014-08 | TCGA-72-4236-01A-01D-1017-01 |
| TCGA-72-4237 | snp__genome_wide_snp_6__broad_mit_edu__Level_3__segmented_scna_hg18__seg | Analyte Replicate Filter | TCGA-72-4237-01A-01D-1014-08 | TCGA-72-4237-01A-01D-1017-01 |
| TCGA-72-4232 | snp__genome_wide_snp_6__broad_mit_edu__Level_3__segmented_scna_hg18__seg | Analyte Replicate Filter | TCGA-72-4232-01A-01D-1014-08 | TCGA-72-4232-01A-01D-1017-01 |
| TCGA-29-1692 | snp__genome_wide_snp_6__broad_mit_edu__Level_3__segmented_scna_hg18__seg | Analyte Replicate Filter | TCGA-29-1692-01B-01D-0803-01 | TCGA-29-1692-01B-01D-2069-01 |
| TCGA-72-4241 | snp__genome_wide_snp_6__broad_mit_edu__Level_3__segmented_scna_hg18__seg | Analyte Replicate Filter | TCGA-72-4241-01A-01D-1014-08 | TCGA-72-4241-01A-01D-1017-01 |
| TCGA-29-1704 | snp__genome_wide_snp_6__broad_mit_edu__Level_3__segmented_scna_hg18__seg | Analyte Replicate Filter | TCGA-29-1704-02A-01D-0803-01 | TCGA-29-1704-02A-01D-2069-01 |
| TCGA-72-4233 | snp__genome_wide_snp_6__broad_mit_edu__Level_3__segmented_scna_hg18__seg | Analyte Replicate Filter | TCGA-72-4233-01A-01D-1014-08 | TCGA-72-4233-01A-01D-1017-01 |
| TCGA-72-4231 | snp__genome_wide_snp_6__broad_mit_edu__Level_3__segmented_scna_hg18__seg | Analyte Replicate Filter | TCGA-72-4231-01A-01D-1014-08 | TCGA-72-4231-01A-01D-1017-01 |
| TCGA-29-2414 | snp__genome_wide_snp_6__broad_mit_edu__Level_3__segmented_scna_hg18__seg | Analyte Replicate Filter | TCGA-29-2414-01A-02D-0704-01 | TCGA-29-2414-01A-02D-2069-01 |
| TCGA-72-4235 | snp__genome_wide_snp_6__broad_mit_edu__Level_3__segmented_scna_hg18__seg | Analyte Replicate Filter | TCGA-72-4235-01A-01D-1014-08 | TCGA-72-4235-01A-01D-1017-01 |
| TCGA-72-4240 | snp__genome_wide_snp_6__broad_mit_edu__Level_3__segmented_scna_hg18__seg | Analyte Replicate Filter | TCGA-72-4240-01A-01D-1014-08 | TCGA-72-4240-01A-01D-1017-01 |
| TCGA-72-4234 | snp__genome_wide_snp_6__broad_mit_edu__Level_3__segmented_scna_hg18__seg | Analyte Replicate Filter | TCGA-72-4234-01A-01D-1014-08 | TCGA-72-4234-01A-01D-1017-01 |
| TCGA-29-1705 | snp__genome_wide_snp_6__broad_mit_edu__Level_3__segmented_scna_hg18__seg | Analyte Replicate Filter | TCGA-29-1705-02A-01D-0803-01 | TCGA-29-1705-02A-01D-2069-01 |
| TCGA-13-0791 | snp__genome_wide_snp_6__broad_mit_edu__Level_3__segmented_scna_hg18__seg | Analyte Replicate Filter | TCGA-13-0791-02A-01D-0803-01 | TCGA-13-0791-02A-01D-2069-01 |
| TCGA-13-1819 | snp__genome_wide_snp_6__broad_mit_edu__Level_3__segmented_scna_hg18__seg | Analyte Replicate Filter | TCGA-13-1819-01A-01D-0803-01 | TCGA-13-1819-01A-01D-2069-01 |
| TCGA-72-4238 | snp__genome_wide_snp_6__broad_mit_edu__Level_3__segmented_scna_hg18__seg | Analyte Replicate Filter | TCGA-72-4238-01A-01D-1014-08 | TCGA-72-4238-01A-01D-1017-01 |
| TCGA-72-4236 | snp__genome_wide_snp_6__broad_mit_edu__Level_2__byallele_copynumber__data | Analyte Replicate Filter | TCGA-72-4236-01A-01D-1014-08 | TCGA-72-4236-01A-01D-1017-01 |
| TCGA-72-4237 | snp__genome_wide_snp_6__broad_mit_edu__Level_2__byallele_copynumber__data | Analyte Replicate Filter | TCGA-72-4237-01A-01D-1014-08 | TCGA-72-4237-01A-01D-1017-01 |
| TCGA-13-1817 | snp__genome_wide_snp_6__broad_mit_edu__Level_2__byallele_copynumber__data | Analyte Replicate Filter | TCGA-13-1817-01A-01D-0803-01 | TCGA-13-1817-01A-01D-2069-01 |
| TCGA-13-1817 | snp__genome_wide_snp_6__broad_mit_edu__Level_2__byallele_copynumber__data | Analyte Replicate Filter | TCGA-13-1817-02A-01D-0803-01 | TCGA-13-1817-02A-01D-2069-01 |
| TCGA-72-4232 | snp__genome_wide_snp_6__broad_mit_edu__Level_2__byallele_copynumber__data | Analyte Replicate Filter | TCGA-72-4232-01A-01D-1014-08 | TCGA-72-4232-01A-01D-1017-01 |
| TCGA-29-1692 | snp__genome_wide_snp_6__broad_mit_edu__Level_2__byallele_copynumber__data | Analyte Replicate Filter | TCGA-29-1692-01B-01D-0803-01 | TCGA-29-1692-01B-01D-2069-01 |
| TCGA-29-1692 | snp__genome_wide_snp_6__broad_mit_edu__Level_2__byallele_copynumber__data | Analyte Replicate Filter | TCGA-29-1692-02A-01D-0803-01 | TCGA-29-1692-02A-01D-2069-01 |
| TCGA-29-1770 | snp__genome_wide_snp_6__broad_mit_edu__Level_2__byallele_copynumber__data | Analyte Replicate Filter | TCGA-29-1770-02A-01D-0803-01 | TCGA-29-1770-02A-01D-2069-01 |
| TCGA-13-1489 | snp__genome_wide_snp_6__broad_mit_edu__Level_2__byallele_copynumber__data | Analyte Replicate Filter | TCGA-13-1489-02A-01D-0803-01 | TCGA-13-1489-02A-01D-2069-01 |
| TCGA-61-2008 | snp__genome_wide_snp_6__broad_mit_edu__Level_2__byallele_copynumber__data | Analyte Replicate Filter | TCGA-61-2008-02A-01D-0803-01 | TCGA-61-2008-02A-01D-2069-01 |
| TCGA-72-4241 | snp__genome_wide_snp_6__broad_mit_edu__Level_2__byallele_copynumber__data | Analyte Replicate Filter | TCGA-72-4241-01A-01D-1014-08 | TCGA-72-4241-01A-01D-1017-01 |
| TCGA-29-1704 | snp__genome_wide_snp_6__broad_mit_edu__Level_2__byallele_copynumber__data | Analyte Replicate Filter | TCGA-29-1704-02A-01D-0803-01 | TCGA-29-1704-02A-01D-2069-01 |
| TCGA-72-4233 | snp__genome_wide_snp_6__broad_mit_edu__Level_2__byallele_copynumber__data | Analyte Replicate Filter | TCGA-72-4233-01A-01D-1014-08 | TCGA-72-4233-01A-01D-1017-01 |
| TCGA-72-4231 | snp__genome_wide_snp_6__broad_mit_edu__Level_2__byallele_copynumber__data | Analyte Replicate Filter | TCGA-72-4231-01A-01D-1014-08 | TCGA-72-4231-01A-01D-1017-01 |
| TCGA-29-2414 | snp__genome_wide_snp_6__broad_mit_edu__Level_2__byallele_copynumber__data | Analyte Replicate Filter | TCGA-29-2414-01A-02D-0704-01 | TCGA-29-2414-01A-02D-2069-01 |
| TCGA-72-4235 | snp__genome_wide_snp_6__broad_mit_edu__Level_2__byallele_copynumber__data | Analyte Replicate Filter | TCGA-72-4235-01A-01D-1014-08 | TCGA-72-4235-01A-01D-1017-01 |
| TCGA-72-4240 | snp__genome_wide_snp_6__broad_mit_edu__Level_2__byallele_copynumber__data | Analyte Replicate Filter | TCGA-72-4240-01A-01D-1014-08 | TCGA-72-4240-01A-01D-1017-01 |
| TCGA-72-4234 | snp__genome_wide_snp_6__broad_mit_edu__Level_2__byallele_copynumber__data | Analyte Replicate Filter | TCGA-72-4234-01A-01D-1014-08 | TCGA-72-4234-01A-01D-1017-01 |
| TCGA-29-1705 | snp__genome_wide_snp_6__broad_mit_edu__Level_2__byallele_copynumber__data | Analyte Replicate Filter | TCGA-29-1705-02A-01D-0803-01 | TCGA-29-1705-02A-01D-2069-01 |
| TCGA-13-0791 | snp__genome_wide_snp_6__broad_mit_edu__Level_2__byallele_copynumber__data | Analyte Replicate Filter | TCGA-13-0791-02A-01D-0803-01 | TCGA-13-0791-02A-01D-2069-01 |
| TCGA-13-1819 | snp__genome_wide_snp_6__broad_mit_edu__Level_2__byallele_copynumber__data | Analyte Replicate Filter | TCGA-13-1819-02A-01D-0803-01 | TCGA-13-1819-02A-01D-2069-01 |
| TCGA-13-1819 | snp__genome_wide_snp_6__broad_mit_edu__Level_2__byallele_copynumber__data | Analyte Replicate Filter | TCGA-13-1819-01A-01D-0803-01 | TCGA-13-1819-01A-01D-2069-01 |
| TCGA-72-4238 | snp__genome_wide_snp_6__broad_mit_edu__Level_2__byallele_copynumber__data | Analyte Replicate Filter | TCGA-72-4238-01A-01D-1014-08 | TCGA-72-4238-01A-01D-1017-01 |
| TCGA-72-4236 | snp__genome_wide_snp_6__broad_mit_edu__Level_2__invariantset_medianpolish__data | Analyte Replicate Filter | TCGA-72-4236-01A-01D-1014-08 | TCGA-72-4236-01A-01D-1017-01 |
| TCGA-72-4237 | snp__genome_wide_snp_6__broad_mit_edu__Level_2__invariantset_medianpolish__data | Analyte Replicate Filter | TCGA-72-4237-01A-01D-1014-08 | TCGA-72-4237-01A-01D-1017-01 |
| TCGA-13-1817 | snp__genome_wide_snp_6__broad_mit_edu__Level_2__invariantset_medianpolish__data | Analyte Replicate Filter | TCGA-13-1817-01A-01D-0803-01 | TCGA-13-1817-01A-01D-2069-01 |
| TCGA-13-1817 | snp__genome_wide_snp_6__broad_mit_edu__Level_2__invariantset_medianpolish__data | Analyte Replicate Filter | TCGA-13-1817-02A-01D-0803-01 | TCGA-13-1817-02A-01D-2069-01 |
| TCGA-72-4232 | snp__genome_wide_snp_6__broad_mit_edu__Level_2__invariantset_medianpolish__data | Analyte Replicate Filter | TCGA-72-4232-01A-01D-1014-08 | TCGA-72-4232-01A-01D-1017-01 |
| TCGA-29-1692 | snp__genome_wide_snp_6__broad_mit_edu__Level_2__invariantset_medianpolish__data | Analyte Replicate Filter | TCGA-29-1692-01B-01D-0803-01 | TCGA-29-1692-01B-01D-2069-01 |
| TCGA-29-1692 | snp__genome_wide_snp_6__broad_mit_edu__Level_2__invariantset_medianpolish__data | Analyte Replicate Filter | TCGA-29-1692-02A-01D-0803-01 | TCGA-29-1692-02A-01D-2069-01 |
| TCGA-29-1770 | snp__genome_wide_snp_6__broad_mit_edu__Level_2__invariantset_medianpolish__data | Analyte Replicate Filter | TCGA-29-1770-02A-01D-0803-01 | TCGA-29-1770-02A-01D-2069-01 |
| TCGA-13-1489 | snp__genome_wide_snp_6__broad_mit_edu__Level_2__invariantset_medianpolish__data | Analyte Replicate Filter | TCGA-13-1489-02A-01D-0803-01 | TCGA-13-1489-02A-01D-2069-01 |
| TCGA-61-2008 | snp__genome_wide_snp_6__broad_mit_edu__Level_2__invariantset_medianpolish__data | Analyte Replicate Filter | TCGA-61-2008-02A-01D-0803-01 | TCGA-61-2008-02A-01D-2069-01 |
| TCGA-72-4241 | snp__genome_wide_snp_6__broad_mit_edu__Level_2__invariantset_medianpolish__data | Analyte Replicate Filter | TCGA-72-4241-01A-01D-1014-08 | TCGA-72-4241-01A-01D-1017-01 |
| TCGA-29-1704 | snp__genome_wide_snp_6__broad_mit_edu__Level_2__invariantset_medianpolish__data | Analyte Replicate Filter | TCGA-29-1704-02A-01D-0803-01 | TCGA-29-1704-02A-01D-2069-01 |
| TCGA-72-4233 | snp__genome_wide_snp_6__broad_mit_edu__Level_2__invariantset_medianpolish__data | Analyte Replicate Filter | TCGA-72-4233-01A-01D-1014-08 | TCGA-72-4233-01A-01D-1017-01 |
| TCGA-72-4231 | snp__genome_wide_snp_6__broad_mit_edu__Level_2__invariantset_medianpolish__data | Analyte Replicate Filter | TCGA-72-4231-01A-01D-1014-08 | TCGA-72-4231-01A-01D-1017-01 |
| TCGA-29-2414 | snp__genome_wide_snp_6__broad_mit_edu__Level_2__invariantset_medianpolish__data | Analyte Replicate Filter | TCGA-29-2414-01A-02D-0704-01 | TCGA-29-2414-01A-02D-2069-01 |
| TCGA-72-4235 | snp__genome_wide_snp_6__broad_mit_edu__Level_2__invariantset_medianpolish__data | Analyte Replicate Filter | TCGA-72-4235-01A-01D-1014-08 | TCGA-72-4235-01A-01D-1017-01 |
| TCGA-72-4240 | snp__genome_wide_snp_6__broad_mit_edu__Level_2__invariantset_medianpolish__data | Analyte Replicate Filter | TCGA-72-4240-01A-01D-1014-08 | TCGA-72-4240-01A-01D-1017-01 |
| TCGA-72-4234 | snp__genome_wide_snp_6__broad_mit_edu__Level_2__invariantset_medianpolish__data | Analyte Replicate Filter | TCGA-72-4234-01A-01D-1014-08 | TCGA-72-4234-01A-01D-1017-01 |
| TCGA-29-1705 | snp__genome_wide_snp_6__broad_mit_edu__Level_2__invariantset_medianpolish__data | Analyte Replicate Filter | TCGA-29-1705-02A-01D-0803-01 | TCGA-29-1705-02A-01D-2069-01 |
| TCGA-13-0791 | snp__genome_wide_snp_6__broad_mit_edu__Level_2__invariantset_medianpolish__data | Analyte Replicate Filter | TCGA-13-0791-02A-01D-0803-01 | TCGA-13-0791-02A-01D-2069-01 |
| TCGA-13-1819 | snp__genome_wide_snp_6__broad_mit_edu__Level_2__invariantset_medianpolish__data | Analyte Replicate Filter | TCGA-13-1819-02A-01D-0803-01 | TCGA-13-1819-02A-01D-2069-01 |
| TCGA-13-1819 | snp__genome_wide_snp_6__broad_mit_edu__Level_2__invariantset_medianpolish__data | Analyte Replicate Filter | TCGA-13-1819-01A-01D-0803-01 | TCGA-13-1819-01A-01D-2069-01 |
| TCGA-72-4238 | snp__genome_wide_snp_6__broad_mit_edu__Level_2__invariantset_medianpolish__data | Analyte Replicate Filter | TCGA-72-4238-01A-01D-1014-08 | TCGA-72-4238-01A-01D-1017-01 |
| TCGA-72-4236 | snp__genome_wide_snp_6__broad_mit_edu__Level_3__segmented_scna_hg19__seg | Analyte Replicate Filter | TCGA-72-4236-01A-01D-1014-08 | TCGA-72-4236-01A-01D-1017-01 |
| TCGA-72-4237 | snp__genome_wide_snp_6__broad_mit_edu__Level_3__segmented_scna_hg19__seg | Analyte Replicate Filter | TCGA-72-4237-01A-01D-1014-08 | TCGA-72-4237-01A-01D-1017-01 |
| TCGA-72-4232 | snp__genome_wide_snp_6__broad_mit_edu__Level_3__segmented_scna_hg19__seg | Analyte Replicate Filter | TCGA-72-4232-01A-01D-1014-08 | TCGA-72-4232-01A-01D-1017-01 |
| TCGA-29-1692 | snp__genome_wide_snp_6__broad_mit_edu__Level_3__segmented_scna_hg19__seg | Analyte Replicate Filter | TCGA-29-1692-01B-01D-0803-01 | TCGA-29-1692-01B-01D-2069-01 |
| TCGA-72-4241 | snp__genome_wide_snp_6__broad_mit_edu__Level_3__segmented_scna_hg19__seg | Analyte Replicate Filter | TCGA-72-4241-01A-01D-1014-08 | TCGA-72-4241-01A-01D-1017-01 |
| TCGA-29-1704 | snp__genome_wide_snp_6__broad_mit_edu__Level_3__segmented_scna_hg19__seg | Analyte Replicate Filter | TCGA-29-1704-02A-01D-0803-01 | TCGA-29-1704-02A-01D-2069-01 |
| TCGA-72-4233 | snp__genome_wide_snp_6__broad_mit_edu__Level_3__segmented_scna_hg19__seg | Analyte Replicate Filter | TCGA-72-4233-01A-01D-1014-08 | TCGA-72-4233-01A-01D-1017-01 |
| TCGA-72-4231 | snp__genome_wide_snp_6__broad_mit_edu__Level_3__segmented_scna_hg19__seg | Analyte Replicate Filter | TCGA-72-4231-01A-01D-1014-08 | TCGA-72-4231-01A-01D-1017-01 |
| TCGA-29-2414 | snp__genome_wide_snp_6__broad_mit_edu__Level_3__segmented_scna_hg19__seg | Analyte Replicate Filter | TCGA-29-2414-01A-02D-0704-01 | TCGA-29-2414-01A-02D-2069-01 |
| TCGA-72-4235 | snp__genome_wide_snp_6__broad_mit_edu__Level_3__segmented_scna_hg19__seg | Analyte Replicate Filter | TCGA-72-4235-01A-01D-1014-08 | TCGA-72-4235-01A-01D-1017-01 |
| TCGA-72-4240 | snp__genome_wide_snp_6__broad_mit_edu__Level_3__segmented_scna_hg19__seg | Analyte Replicate Filter | TCGA-72-4240-01A-01D-1014-08 | TCGA-72-4240-01A-01D-1017-01 |
| TCGA-72-4234 | snp__genome_wide_snp_6__broad_mit_edu__Level_3__segmented_scna_hg19__seg | Analyte Replicate Filter | TCGA-72-4234-01A-01D-1014-08 | TCGA-72-4234-01A-01D-1017-01 |
| TCGA-29-1705 | snp__genome_wide_snp_6__broad_mit_edu__Level_3__segmented_scna_hg19__seg | Analyte Replicate Filter | TCGA-29-1705-02A-01D-0803-01 | TCGA-29-1705-02A-01D-2069-01 |
| TCGA-13-0791 | snp__genome_wide_snp_6__broad_mit_edu__Level_3__segmented_scna_hg19__seg | Analyte Replicate Filter | TCGA-13-0791-02A-01D-0803-01 | TCGA-13-0791-02A-01D-2069-01 |
| TCGA-13-1819 | snp__genome_wide_snp_6__broad_mit_edu__Level_3__segmented_scna_hg19__seg | Analyte Replicate Filter | TCGA-13-1819-01A-01D-0803-01 | TCGA-13-1819-01A-01D-2069-01 |
| TCGA-72-4238 | snp__genome_wide_snp_6__broad_mit_edu__Level_3__segmented_scna_hg19__seg | Analyte Replicate Filter | TCGA-72-4238-01A-01D-1014-08 | TCGA-72-4238-01A-01D-1017-01 |
Table S13.
| Participant Id | DataType__Platform__Center__DataLevel__ProtocolName_Extension | Filter Reason | Removed Sample(s) | Chosen Sample |
|---|---|---|---|---|
| TCGA-AF-3400 | snp__genome_wide_snp_6__broad_mit_edu__Level_3__segmented_scna_minus_germline_cnv_hg18__seg | Analyte Replicate Filter | TCGA-AF-3400-01A-01D-0819-01 | TCGA-AF-3400-01A-01D-1549-01 |
| TCGA-AF-2689 | snp__genome_wide_snp_6__broad_mit_edu__Level_3__segmented_scna_minus_germline_cnv_hg18__seg | Analyte Replicate Filter | TCGA-AF-2689-01A-01D-0819-01 | TCGA-AF-2689-01A-01D-1549-01 |
| TCGA-AF-2691 | snp__genome_wide_snp_6__broad_mit_edu__Level_3__segmented_scna_minus_germline_cnv_hg18__seg | Analyte Replicate Filter | TCGA-AF-2691-01A-01D-0819-01 | TCGA-AF-2691-01A-01D-1549-01 |
| TCGA-AG-A026 | snp__genome_wide_snp_6__broad_mit_edu__Level_3__segmented_scna_minus_germline_cnv_hg18__seg | Analyte Replicate Filter | TCGA-AG-A026-01A-01D-A008-01 | TCGA-AG-A026-01A-32D-A080-01 |
| TCGA-AF-3400 | snp__genome_wide_snp_6__broad_mit_edu__Level_3__segmented_scna_hg19__seg | Analyte Replicate Filter | TCGA-AF-3400-01A-01D-0819-01 | TCGA-AF-3400-01A-01D-1549-01 |
| TCGA-AF-2689 | snp__genome_wide_snp_6__broad_mit_edu__Level_3__segmented_scna_hg19__seg | Analyte Replicate Filter | TCGA-AF-2689-01A-01D-0819-01 | TCGA-AF-2689-01A-01D-1549-01 |
| TCGA-AF-2691 | snp__genome_wide_snp_6__broad_mit_edu__Level_3__segmented_scna_hg19__seg | Analyte Replicate Filter | TCGA-AF-2691-01A-01D-0819-01 | TCGA-AF-2691-01A-01D-1549-01 |
| TCGA-AG-A026 | snp__genome_wide_snp_6__broad_mit_edu__Level_3__segmented_scna_hg19__seg | Analyte Replicate Filter | TCGA-AG-A026-01A-01D-A008-01 | TCGA-AG-A026-01A-32D-A080-01 |
| TCGA-AF-3400 | snp__genome_wide_snp_6__broad_mit_edu__Level_1__image_acquisition__data | Analyte Replicate Filter | TCGA-AF-3400-01A-01D-0819-01 | TCGA-AF-3400-01A-01D-1549-01 |
| TCGA-AG-A026 | snp__genome_wide_snp_6__broad_mit_edu__Level_1__image_acquisition__data | Analyte Replicate Filter | TCGA-AG-A026-10A-01D-A008-01 | TCGA-AG-A026-10A-01D-A080-01 |
| TCGA-AF-2689 | snp__genome_wide_snp_6__broad_mit_edu__Level_1__image_acquisition__data | Analyte Replicate Filter | TCGA-AF-2689-01A-01D-0819-01 | TCGA-AF-2689-01A-01D-1549-01 |
| TCGA-AF-2691 | snp__genome_wide_snp_6__broad_mit_edu__Level_1__image_acquisition__data | Analyte Replicate Filter | TCGA-AF-2691-01A-01D-0819-01 | TCGA-AF-2691-01A-01D-1549-01 |
| TCGA-AG-A026 | snp__genome_wide_snp_6__broad_mit_edu__Level_1__image_acquisition__data | Analyte Replicate Filter | TCGA-AG-A026-01A-01D-A008-01 | TCGA-AG-A026-01A-32D-A080-01 |
| TCGA-AF-3400 | snp__genome_wide_snp_6__broad_mit_edu__Level_3__segmented_scna_minus_germline_cnv_hg19__seg | Analyte Replicate Filter | TCGA-AF-3400-01A-01D-0819-01 | TCGA-AF-3400-01A-01D-1549-01 |
| TCGA-AF-2689 | snp__genome_wide_snp_6__broad_mit_edu__Level_3__segmented_scna_minus_germline_cnv_hg19__seg | Analyte Replicate Filter | TCGA-AF-2689-01A-01D-0819-01 | TCGA-AF-2689-01A-01D-1549-01 |
| TCGA-AF-2691 | snp__genome_wide_snp_6__broad_mit_edu__Level_3__segmented_scna_minus_germline_cnv_hg19__seg | Analyte Replicate Filter | TCGA-AF-2691-01A-01D-0819-01 | TCGA-AF-2691-01A-01D-1549-01 |
| TCGA-AG-A026 | snp__genome_wide_snp_6__broad_mit_edu__Level_3__segmented_scna_minus_germline_cnv_hg19__seg | Analyte Replicate Filter | TCGA-AG-A026-01A-01D-A008-01 | TCGA-AG-A026-01A-32D-A080-01 |
| TCGA-AG-A026 | snp__genome_wide_snp_6__broad_mit_edu__Level_2__copy_number__data | Analyte Replicate Filter | TCGA-AG-A026-01A-01D-A008-01 | TCGA-AG-A026-01A-32D-A080-01 |
| TCGA-AF-3400 | snp__genome_wide_snp_6__broad_mit_edu__Level_2__copy_number__data | Analyte Replicate Filter | TCGA-AF-3400-01A-01D-0819-01 | TCGA-AF-3400-01A-01D-1549-01 |
| TCGA-AF-2689 | snp__genome_wide_snp_6__broad_mit_edu__Level_2__copy_number__data | Analyte Replicate Filter | TCGA-AF-2689-01A-01D-0819-01 | TCGA-AF-2689-01A-01D-1549-01 |
| TCGA-AF-2691 | snp__genome_wide_snp_6__broad_mit_edu__Level_2__copy_number__data | Analyte Replicate Filter | TCGA-AF-2691-01A-01D-0819-01 | TCGA-AF-2691-01A-01D-1549-01 |
| TCGA-AG-A026 | snp__genome_wide_snp_6__broad_mit_edu__Level_2__copynumber_byallele__data | Analyte Replicate Filter | TCGA-AG-A026-01A-01D-A008-01 | TCGA-AG-A026-01A-32D-A080-01 |
| TCGA-AF-3400 | snp__genome_wide_snp_6__broad_mit_edu__Level_2__copynumber_byallele__data | Analyte Replicate Filter | TCGA-AF-3400-01A-01D-0819-01 | TCGA-AF-3400-01A-01D-1549-01 |
| TCGA-AF-2689 | snp__genome_wide_snp_6__broad_mit_edu__Level_2__copynumber_byallele__data | Analyte Replicate Filter | TCGA-AF-2689-01A-01D-0819-01 | TCGA-AF-2689-01A-01D-1549-01 |
| TCGA-AF-2691 | snp__genome_wide_snp_6__broad_mit_edu__Level_2__copynumber_byallele__data | Analyte Replicate Filter | TCGA-AF-2691-01A-01D-0819-01 | TCGA-AF-2691-01A-01D-1549-01 |
| TCGA-AF-3400 | snp__genome_wide_snp_6__broad_mit_edu__Level_2__byallele_copynumber__data | Analyte Replicate Filter | TCGA-AF-3400-01A-01D-0819-01 | TCGA-AF-3400-01A-01D-1549-01 |
| TCGA-AF-2689 | snp__genome_wide_snp_6__broad_mit_edu__Level_2__byallele_copynumber__data | Analyte Replicate Filter | TCGA-AF-2689-01A-01D-0819-01 | TCGA-AF-2689-01A-01D-1549-01 |
| TCGA-AF-2691 | snp__genome_wide_snp_6__broad_mit_edu__Level_2__byallele_copynumber__data | Analyte Replicate Filter | TCGA-AF-2691-01A-01D-0819-01 | TCGA-AF-2691-01A-01D-1549-01 |
| TCGA-AG-A026 | snp__genome_wide_snp_6__broad_mit_edu__Level_2__byallele_copynumber__data | Analyte Replicate Filter | TCGA-AG-A026-01A-01D-A008-01 | TCGA-AG-A026-01A-32D-A080-01 |
| TCGA-AF-3400 | snp__genome_wide_snp_6__broad_mit_edu__Level_3__segmented_scna_hg18__seg | Analyte Replicate Filter | TCGA-AF-3400-01A-01D-0819-01 | TCGA-AF-3400-01A-01D-1549-01 |
| TCGA-AF-2689 | snp__genome_wide_snp_6__broad_mit_edu__Level_3__segmented_scna_hg18__seg | Analyte Replicate Filter | TCGA-AF-2689-01A-01D-0819-01 | TCGA-AF-2689-01A-01D-1549-01 |
| TCGA-AF-2691 | snp__genome_wide_snp_6__broad_mit_edu__Level_3__segmented_scna_hg18__seg | Analyte Replicate Filter | TCGA-AF-2691-01A-01D-0819-01 | TCGA-AF-2691-01A-01D-1549-01 |
| TCGA-AG-A026 | snp__genome_wide_snp_6__broad_mit_edu__Level_3__segmented_scna_hg18__seg | Analyte Replicate Filter | TCGA-AG-A026-01A-01D-A008-01 | TCGA-AG-A026-01A-32D-A080-01 |
| TCGA-AF-3400 | snp__genome_wide_snp_6__broad_mit_edu__Level_2__invariantset_medianpolish__data | Analyte Replicate Filter | TCGA-AF-3400-01A-01D-0819-01 | TCGA-AF-3400-01A-01D-1549-01 |
| TCGA-AF-2689 | snp__genome_wide_snp_6__broad_mit_edu__Level_2__invariantset_medianpolish__data | Analyte Replicate Filter | TCGA-AF-2689-01A-01D-0819-01 | TCGA-AF-2689-01A-01D-1549-01 |
| TCGA-AF-2691 | snp__genome_wide_snp_6__broad_mit_edu__Level_2__invariantset_medianpolish__data | Analyte Replicate Filter | TCGA-AF-2691-01A-01D-0819-01 | TCGA-AF-2691-01A-01D-1549-01 |
| TCGA-AG-A026 | snp__genome_wide_snp_6__broad_mit_edu__Level_2__invariantset_medianpolish__data | Analyte Replicate Filter | TCGA-AG-A026-10A-01D-A008-01 | TCGA-AG-A026-10A-01D-A080-01 |
| TCGA-AG-A026 | snp__genome_wide_snp_6__broad_mit_edu__Level_2__invariantset_medianpolish__data | Analyte Replicate Filter | TCGA-AG-A026-01A-01D-A008-01 | TCGA-AG-A026-01A-32D-A080-01 |
| TCGA-AG-A026 | snp__genome_wide_snp_6__broad_mit_edu__Level_2__no_outlier_copy_number__data | Analyte Replicate Filter | TCGA-AG-A026-01A-01D-A008-01 | TCGA-AG-A026-01A-32D-A080-01 |
| TCGA-AF-3400 | snp__genome_wide_snp_6__broad_mit_edu__Level_2__no_outlier_copy_number__data | Analyte Replicate Filter | TCGA-AF-3400-01A-01D-0819-01 | TCGA-AF-3400-01A-01D-1549-01 |
| TCGA-AF-2689 | snp__genome_wide_snp_6__broad_mit_edu__Level_2__no_outlier_copy_number__data | Analyte Replicate Filter | TCGA-AF-2689-01A-01D-0819-01 | TCGA-AF-2689-01A-01D-1549-01 |
| TCGA-AF-2691 | snp__genome_wide_snp_6__broad_mit_edu__Level_2__no_outlier_copy_number__data | Analyte Replicate Filter | TCGA-AF-2691-01A-01D-0819-01 | TCGA-AF-2691-01A-01D-1549-01 |
| TCGA-AF-3400 | snp__genome_wide_snp_6__broad_mit_edu__Level_2__tangent_copynumber__data | Analyte Replicate Filter | TCGA-AF-3400-01A-01D-0819-01 | TCGA-AF-3400-01A-01D-1549-01 |
| TCGA-AF-2689 | snp__genome_wide_snp_6__broad_mit_edu__Level_2__tangent_copynumber__data | Analyte Replicate Filter | TCGA-AF-2689-01A-01D-0819-01 | TCGA-AF-2689-01A-01D-1549-01 |
| TCGA-AF-2691 | snp__genome_wide_snp_6__broad_mit_edu__Level_2__tangent_copynumber__data | Analyte Replicate Filter | TCGA-AF-2691-01A-01D-0819-01 | TCGA-AF-2691-01A-01D-1549-01 |
| TCGA-AG-A026 | snp__genome_wide_snp_6__broad_mit_edu__Level_2__tangent_copynumber__data | Analyte Replicate Filter | TCGA-AG-A026-01A-01D-A008-01 | TCGA-AG-A026-01A-32D-A080-01 |
| TCGA-AF-3400 | snp__genome_wide_snp_6__broad_mit_edu__Level_2__raw_copynumber__data | Analyte Replicate Filter | TCGA-AF-3400-01A-01D-0819-01 | TCGA-AF-3400-01A-01D-1549-01 |
| TCGA-AF-2689 | snp__genome_wide_snp_6__broad_mit_edu__Level_2__raw_copynumber__data | Analyte Replicate Filter | TCGA-AF-2689-01A-01D-0819-01 | TCGA-AF-2689-01A-01D-1549-01 |
| TCGA-AF-2691 | snp__genome_wide_snp_6__broad_mit_edu__Level_2__raw_copynumber__data | Analyte Replicate Filter | TCGA-AF-2691-01A-01D-0819-01 | TCGA-AF-2691-01A-01D-1549-01 |
| TCGA-AG-A026 | snp__genome_wide_snp_6__broad_mit_edu__Level_2__raw_copynumber__data | Analyte Replicate Filter | TCGA-AG-A026-01A-01D-A008-01 | TCGA-AG-A026-01A-32D-A080-01 |
| TCGA-AG-A026 | snp__genome_wide_snp_6__broad_mit_edu__Level_2__after_5NN_copy_number__data | Analyte Replicate Filter | TCGA-AG-A026-01A-01D-A008-01 | TCGA-AG-A026-01A-32D-A080-01 |
| TCGA-AF-3400 | snp__genome_wide_snp_6__broad_mit_edu__Level_2__after_5NN_copy_number__data | Analyte Replicate Filter | TCGA-AF-3400-01A-01D-0819-01 | TCGA-AF-3400-01A-01D-1549-01 |
| TCGA-AF-2689 | snp__genome_wide_snp_6__broad_mit_edu__Level_2__after_5NN_copy_number__data | Analyte Replicate Filter | TCGA-AF-2689-01A-01D-0819-01 | TCGA-AF-2689-01A-01D-1549-01 |
| TCGA-AF-2691 | snp__genome_wide_snp_6__broad_mit_edu__Level_2__after_5NN_copy_number__data | Analyte Replicate Filter | TCGA-AF-2691-01A-01D-0819-01 | TCGA-AF-2691-01A-01D-1549-01 |
| TCGA-AF-3400 | snp__genome_wide_snp_6__broad_mit_edu__Level_2__birdseed_genotype__birdseed | Analyte Replicate Filter | TCGA-AF-3400-01A-01D-0819-01 | TCGA-AF-3400-01A-01D-1549-01 |
| TCGA-AF-2689 | snp__genome_wide_snp_6__broad_mit_edu__Level_2__birdseed_genotype__birdseed | Analyte Replicate Filter | TCGA-AF-2689-01A-01D-0819-01 | TCGA-AF-2689-01A-01D-1549-01 |
| TCGA-AF-2691 | snp__genome_wide_snp_6__broad_mit_edu__Level_2__birdseed_genotype__birdseed | Analyte Replicate Filter | TCGA-AF-2691-01A-01D-0819-01 | TCGA-AF-2691-01A-01D-1549-01 |
| TCGA-AG-A026 | snp__genome_wide_snp_6__broad_mit_edu__Level_2__birdseed_genotype__birdseed | Analyte Replicate Filter | TCGA-AG-A026-01A-01D-A008-01 | TCGA-AG-A026-01A-32D-A080-01 |
Table S14.
| Participant Id | DataType__Platform__Center__DataLevel__ProtocolName_Extension | Filter Reason | Removed Sample(s) | Chosen Sample |
|---|---|---|---|---|
| TCGA-BK-A26L | mirnaseq__illuminahiseq_mirnaseq__bcgsc_ca__Level_3__miR_gene_expression__data | Analyte Replicate Filter | TCGA-BK-A26L-01A-11R-A16E-13 | TCGA-BK-A26L-01C-04R-A27D-13 |
| TCGA-BK-A0CA | mirnaseq__illuminahiseq_mirnaseq__bcgsc_ca__Level_3__miR_gene_expression__data | Analyte Replicate Filter | TCGA-BK-A0CA-01A-21R-A119-13 | TCGA-BK-A0CA-01B-02R-A27D-13 |
| TCGA-BK-A26L | snp__genome_wide_snp_6__broad_mit_edu__Level_2__byallele_copynumber__data | Analyte Replicate Filter | TCGA-BK-A26L-01A-11D-A16C-01 | TCGA-BK-A26L-01C-04D-A275-01 |
| TCGA-BK-A0CC | snp__genome_wide_snp_6__broad_mit_edu__Level_2__byallele_copynumber__data | Analyte Replicate Filter | TCGA-BK-A0CC-01A-21D-A00X-01 | TCGA-BK-A0CC-01B-04D-A275-01 |
| TCGA-BK-A139 | snp__genome_wide_snp_6__broad_mit_edu__Level_2__byallele_copynumber__data | Analyte Replicate Filter | TCGA-BK-A139-01A-11D-A120-01 | TCGA-BK-A139-01C-08D-A275-01 |
| TCGA-BK-A0CA | snp__genome_wide_snp_6__broad_mit_edu__Level_2__byallele_copynumber__data | Analyte Replicate Filter | TCGA-BK-A0CA-01A-21D-A120-01 | TCGA-BK-A0CA-01B-02D-A275-01 |
| TCGA-BK-A26L | snp__genome_wide_snp_6__broad_mit_edu__Level_2__invariantset_medianpolish__data | Analyte Replicate Filter | TCGA-BK-A26L-01A-11D-A16C-01 | TCGA-BK-A26L-01C-04D-A275-01 |
| TCGA-BK-A0CC | snp__genome_wide_snp_6__broad_mit_edu__Level_2__invariantset_medianpolish__data | Analyte Replicate Filter | TCGA-BK-A0CC-01A-21D-A00X-01 | TCGA-BK-A0CC-01B-04D-A275-01 |
| TCGA-BK-A139 | snp__genome_wide_snp_6__broad_mit_edu__Level_2__invariantset_medianpolish__data | Analyte Replicate Filter | TCGA-BK-A139-01A-11D-A120-01 | TCGA-BK-A139-01C-08D-A275-01 |
| TCGA-BK-A0CA | snp__genome_wide_snp_6__broad_mit_edu__Level_2__invariantset_medianpolish__data | Analyte Replicate Filter | TCGA-BK-A0CA-01A-21D-A120-01 | TCGA-BK-A0CA-01B-02D-A275-01 |
| TCGA-BK-A26L | snp__genome_wide_snp_6__broad_mit_edu__Level_2__birdseed_genotype__birdseed | Analyte Replicate Filter | TCGA-BK-A26L-01A-11D-A16C-01 | TCGA-BK-A26L-01C-04D-A275-01 |
| TCGA-BK-A0CC | snp__genome_wide_snp_6__broad_mit_edu__Level_2__birdseed_genotype__birdseed | Analyte Replicate Filter | TCGA-BK-A0CC-01A-21D-A00X-01 | TCGA-BK-A0CC-01B-04D-A275-01 |
| TCGA-BK-A139 | snp__genome_wide_snp_6__broad_mit_edu__Level_2__birdseed_genotype__birdseed | Analyte Replicate Filter | TCGA-BK-A139-01A-11D-A120-01 | TCGA-BK-A139-01C-08D-A275-01 |
| TCGA-BK-A0CA | snp__genome_wide_snp_6__broad_mit_edu__Level_2__birdseed_genotype__birdseed | Analyte Replicate Filter | TCGA-BK-A0CA-01A-21D-A120-01 | TCGA-BK-A0CA-01B-02D-A275-01 |
| TCGA-BK-A26L | snp__genome_wide_snp_6__broad_mit_edu__Level_2__raw_copynumber__data | Analyte Replicate Filter | TCGA-BK-A26L-01A-11D-A16C-01 | TCGA-BK-A26L-01C-04D-A275-01 |
| TCGA-BK-A0CC | snp__genome_wide_snp_6__broad_mit_edu__Level_2__raw_copynumber__data | Analyte Replicate Filter | TCGA-BK-A0CC-01A-21D-A00X-01 | TCGA-BK-A0CC-01B-04D-A275-01 |
| TCGA-BK-A139 | snp__genome_wide_snp_6__broad_mit_edu__Level_2__raw_copynumber__data | Analyte Replicate Filter | TCGA-BK-A139-01A-11D-A120-01 | TCGA-BK-A139-01C-08D-A275-01 |
| TCGA-BK-A0CA | snp__genome_wide_snp_6__broad_mit_edu__Level_2__raw_copynumber__data | Analyte Replicate Filter | TCGA-BK-A0CA-01A-21D-A120-01 | TCGA-BK-A0CA-01B-02D-A275-01 |
| TCGA-BK-A26L | methylation__humanmethylation450__jhu_usc_edu__Level_3__within_bioassay_data_set_function__data | Analyte Replicate Filter | TCGA-BK-A26L-01A-11D-A16G-05 | TCGA-BK-A26L-01C-04D-A27B-05 |
| TCGA-BK-A139 | methylation__humanmethylation450__jhu_usc_edu__Level_3__within_bioassay_data_set_function__data | Analyte Replicate Filter | TCGA-BK-A139-01A-11D-A123-05 | TCGA-BK-A139-01C-08D-A27B-05 |
| TCGA-BK-A0CA | methylation__humanmethylation450__jhu_usc_edu__Level_3__within_bioassay_data_set_function__data | Analyte Replicate Filter | TCGA-BK-A0CA-01A-21D-A123-05 | TCGA-BK-A0CA-01B-02D-A27B-05 |
| TCGA-BK-A26L | mirnaseq__illuminahiseq_mirnaseq__bcgsc_ca__Level_3__miR_isoform_expression__data | Analyte Replicate Filter | TCGA-BK-A26L-01A-11R-A16E-13 | TCGA-BK-A26L-01C-04R-A27D-13 |
| TCGA-BK-A0CA | mirnaseq__illuminahiseq_mirnaseq__bcgsc_ca__Level_3__miR_isoform_expression__data | Analyte Replicate Filter | TCGA-BK-A0CA-01A-21R-A119-13 | TCGA-BK-A0CA-01B-02R-A27D-13 |
In certain circumstances, replicate filtering may choose the less favorable among two or more aliquots. For instance, an analyst may manually review two aliquots for a given individual and determine that one is superior. If the replicate filtering would choose the inferior sample, then the inferior sample can be added to this blacklist. This would result in the desired sample being chosen. This table lists those blacklisted samples and a reason for their being blacklisted.
Table 4. Get Full Table These samples were blacklisted and removed from the run.
| TCGA.ID | Tumor.Type | Blacklist.Reason |
|---|---|---|
| TCGA-38-4626-01A-01D-1549-01 | LUAD | Andrew Cherniack determined the earlier sample is better than this later one. |
| TCGA-44-2655-01A-01D-1549-01 | LUAD | Andrew Cherniack determined the earlier sample is better than this later one. |
| TCGA-44-2656-01A-02D-1549-01 | LUAD | Andrew Cherniack determined the earlier sample is better than this later one. |
| TCGA-44-2662-01A-01D-1549-01 | LUAD | Andrew Cherniack determined the earlier sample is better than this later one. |
| TCGA-44-2665-01A-01D-1549-01 | LUAD | Andrew Cherniack determined the earlier sample is better than this later one. |
| TCGA-44-3396-01A-01D-1549-01 | LUAD | Andrew Cherniack determined the earlier sample is better than this later one. |
| TCGA-AR-A0U1-01A-11R-A115-07 | BRCA | Katherine Hoadley identified this sample as having a low read count or no confirmed SNP comparison. |
| TCGA-A7-A0DC-01A-11R-A00Z-07 | BRCA | Katherine Hoadley identified this sample as having a low read count or no confirmed SNP comparison. |
| TCGA-BH-A0B2-11A-11R-A10J-07 | BRCA | Katherine Hoadley identified this sample as having a low read count or no confirmed SNP comparison. |
| TCGA-BH-A0B2-01A-11R-A10J-07 | BRCA | Katherine Hoadley identified this sample as having a low read count or no confirmed SNP comparison. |
| TCGA-A7-A0DC-11A-41R-A089-07 | BRCA | Katherine Hoadley identified this sample as having a low read count or no confirmed SNP comparison. |
| TCGA-E2-A1IP-01A-11R-A14D-07 | BRCA | Katherine Hoadley identified this sample as having a low read count or no confirmed SNP comparison. |
| TCGA-AA-3695-01A-01R-0905-07 | BRCA | Katherine Hoadley identified this sample as having a low read count or no confirmed SNP comparison. |
| TCGA-A6-2670-01A-02R-0821-07 | BRCA | Katherine Hoadley identified this sample as having a low read count or no confirmed SNP comparison. |
| TCGA-14-0871-01A-01R-1849-01 | BRCA | Katherine Hoadley identified this sample as having a low read count or no confirmed SNP comparison. |
| TCGA-33-4579-01A-01R-1443-07 | BRCA | Katherine Hoadley identified this sample as having a low read count or no confirmed SNP comparison. |
| TCGA-31-1950-01A-01R-1568-13 | BRCA | Katherine Hoadley identified this sample as having a low read count or no confirmed SNP comparison. |
| TCGA-BJ-A0ZF | THCA | Per Lisa Iype, pathology reports indicated that this sample was a follicular carcinoma and not a papillary thyroid carcinoma. |
| TCGA-EM-A2CM | THCA | Per Lisa Iype, pathology reports indicated that this sample was a poorly differentiated oncocytic carcinoma and not a papillary thyroid carcinoma |
| TCGA-DJ-A3V6 | THCA | Per Lisa Iype, pathology reports indicated that this patient has a pretreatment |
| TCGA-DJ-A3UV | THCA | Per Lisa Iype, pathology reports indicated that this patient has a pretreatment |
| TCGA-BR-4376 | STAD | Henry Song, Chris Bristow, and Sahil Seth at Harvard GCC uncovered a sample swap for this sample. |
| TCGA-BR-4363 | STAD | Henry Song, Chris Bristow, and Sahil Seth at Harvard GCC uncovered a sample swap for this sample. |
Redaction data was taken from the TCGA Data Portal using the query string:
https://tcga-data.nci.nih.gov/annotations/resources/searchannotations/json?categoryId=CATEGORY_ID
for the following CATEGORY_ID values:
-
1 = Tumor tissue origin incorrect
-
2 = Tumor type incorrect
-
3 = Genotype mismatch
-
5 = Subject identity unknown
-
27 = Duplicate case
-
37 = Administrative Compliance
The mRNA preprocess median module chooses the matrix for the platform(Affymetrix HG U133, Affymetrix Exon Array and Agilent Gene Expression) with the largest number of samples.
The mRNAseq preprocessor picks the "scaled_estimate" (RSEM) value from Illumina HiSeq/GA2 mRNAseq level_3 (v2) data set and makes the mRNAseq matrix with log2 transformed for the downstream analysis. If there are overlap samples between two different platforms, samples from illumina hiseq will be selected. The pipeline also creates the matrix with RPKM and log2 transform from HiSeq/GA2 mRNAseq level 3 (v1) data set.
The miRseq preprocessor picks the "RPM" (reads per million miRNA precursor reads) from the Illumina HiSeq/GA miRseq Level_3 data set and makes the matrix with log2 transformed values.
The methylation preprocessor filters methylation data for use in downstream pipelines. To learn more about this preprocessor, please visit the documentation.