The Broad GDAC mirrors data from the DCC on a daily basis. Although all data is mirrored, not every sample is ingested into Firehose. There are three main mechanisms that filter samples to ensure that only the most scientifically relevant samples make it into our standard data and analyses runs. These three mechanisms are redactions, replicate filtering, and blacklisting. This report summarizes the data that is ingested into Firehose, describes the three filtering mechanisms, lists those samples that are removed, and gives all available annotations from the DCC's Annotation Manager.
There were 159 redactions, 3166 replicate aliquots, 23 blacklisted aliquots, and 685 FFPE aliquots. The table below represents the sample counts for those samples that were ingested into firehose after filtering out redactions, replicates, and blacklisted data, and segregating FFPEs.
Table 1. Get Full Table Summary of TCGA Tumor Data. Click on a tumor type to display a tumor type specific Samples Report.
| Cohort | BCR | Clinical | CN | LowP | Methylation | mRNA | mRNASeq | miR | miRSeq | RPPA | MAF | rawMAF |
|---|---|---|---|---|---|---|---|---|---|---|---|---|
| ACC | 92 | 92 | 90 | 0 | 80 | 0 | 79 | 0 | 80 | 46 | 90 | 0 |
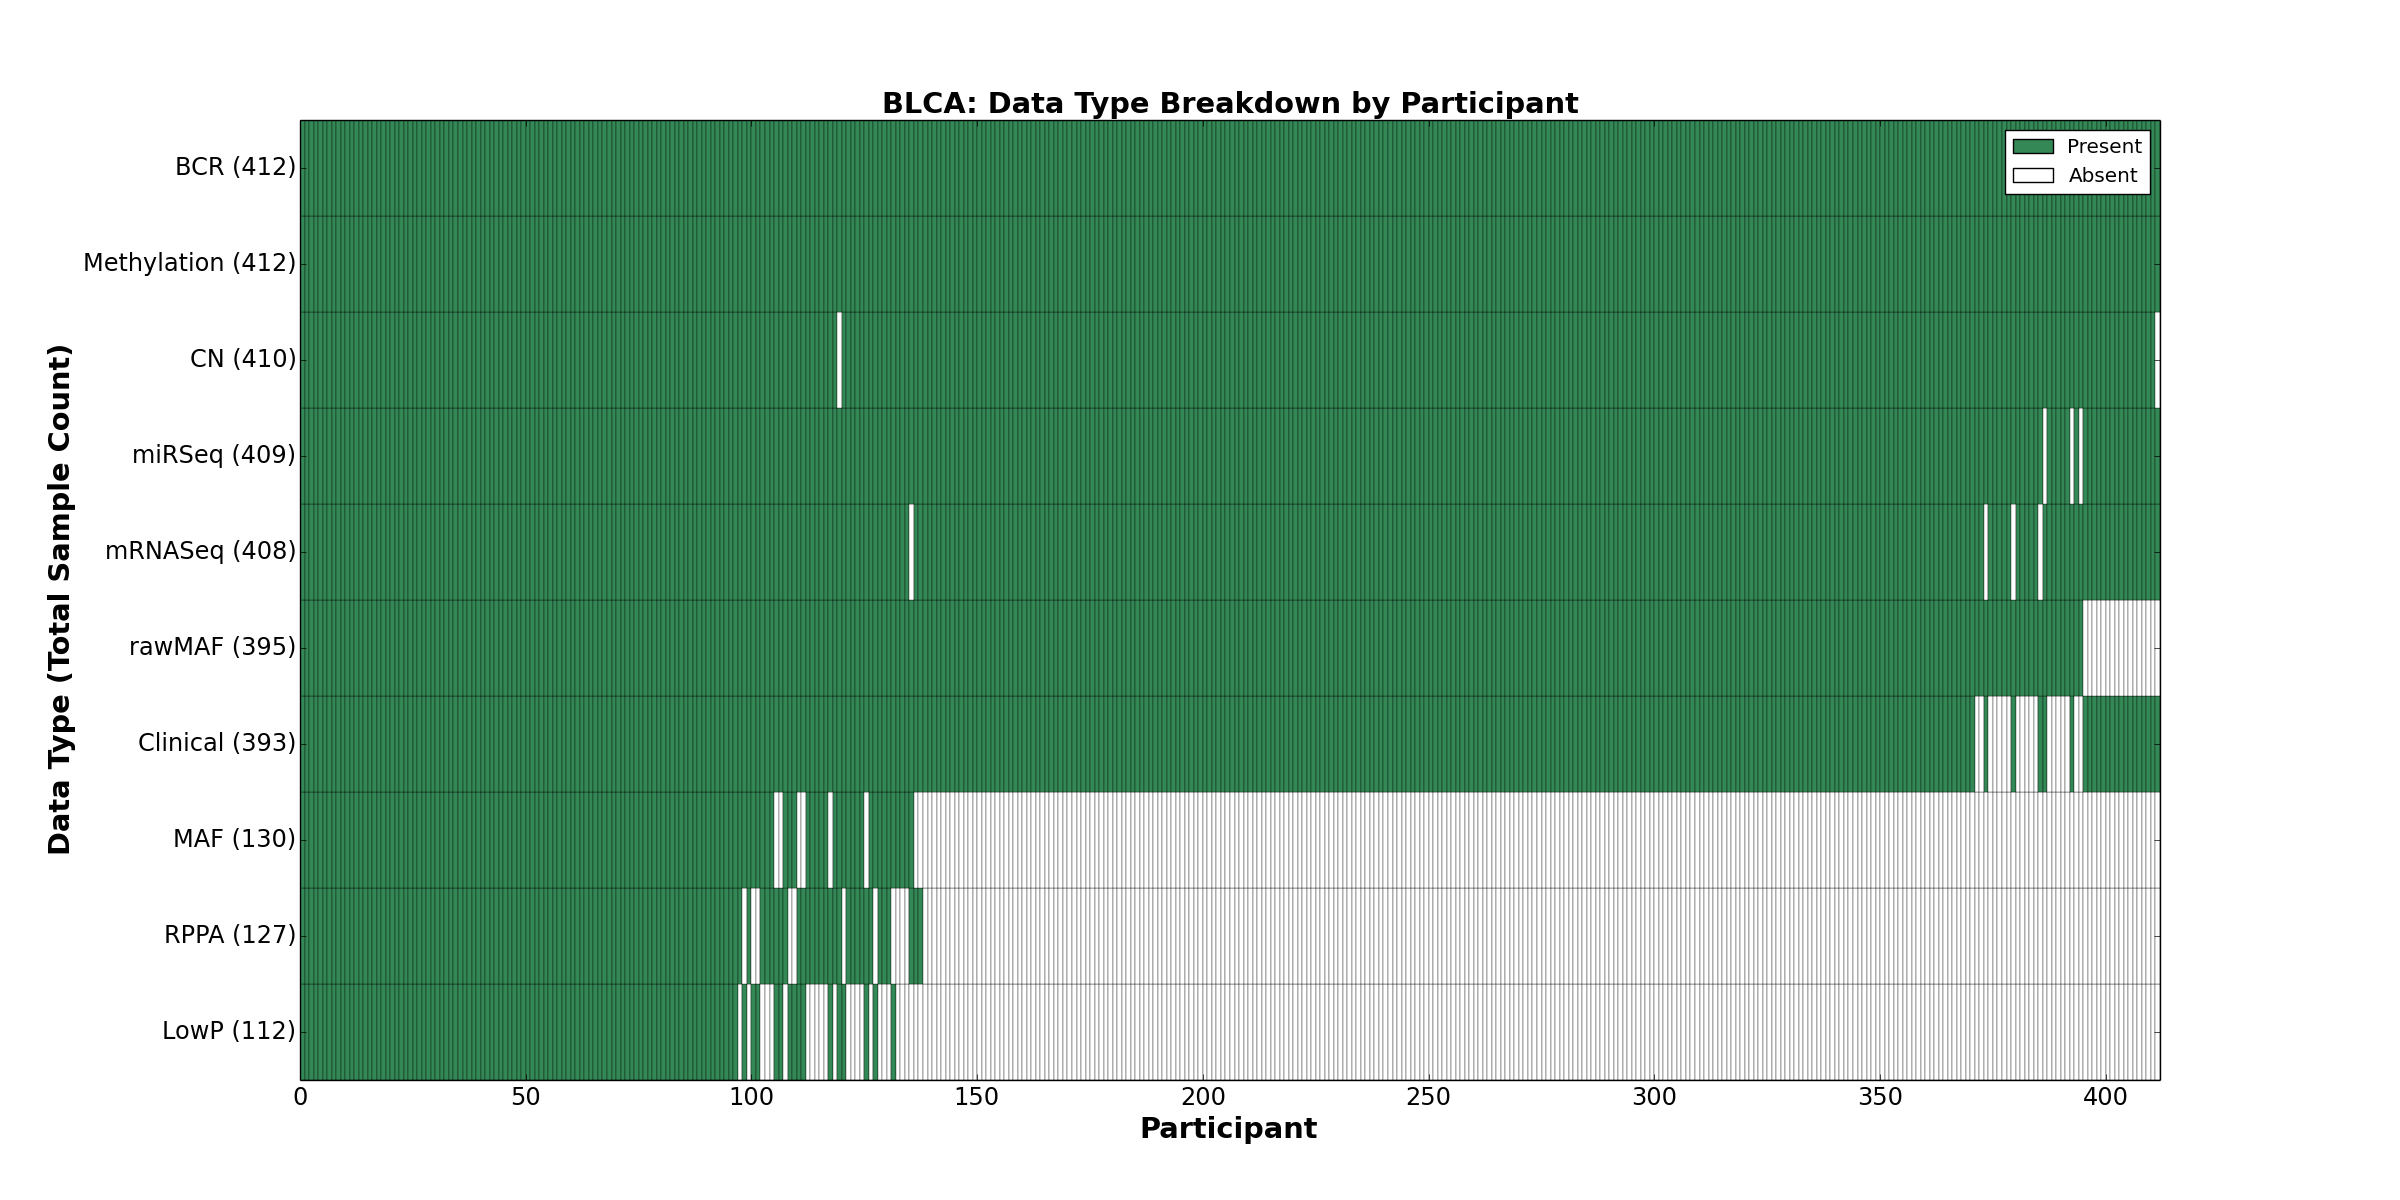
| BLCA | 412 | 393 | 410 | 112 | 412 | 0 | 408 | 0 | 409 | 127 | 130 | 395 |
| BRCA | 1098 | 1080 | 1089 | 19 | 1081 | 526 | 1093 | 0 | 1078 | 410 | 977 | 0 |
| CESC | 307 | 304 | 295 | 0 | 307 | 0 | 304 | 0 | 307 | 173 | 194 | 0 |
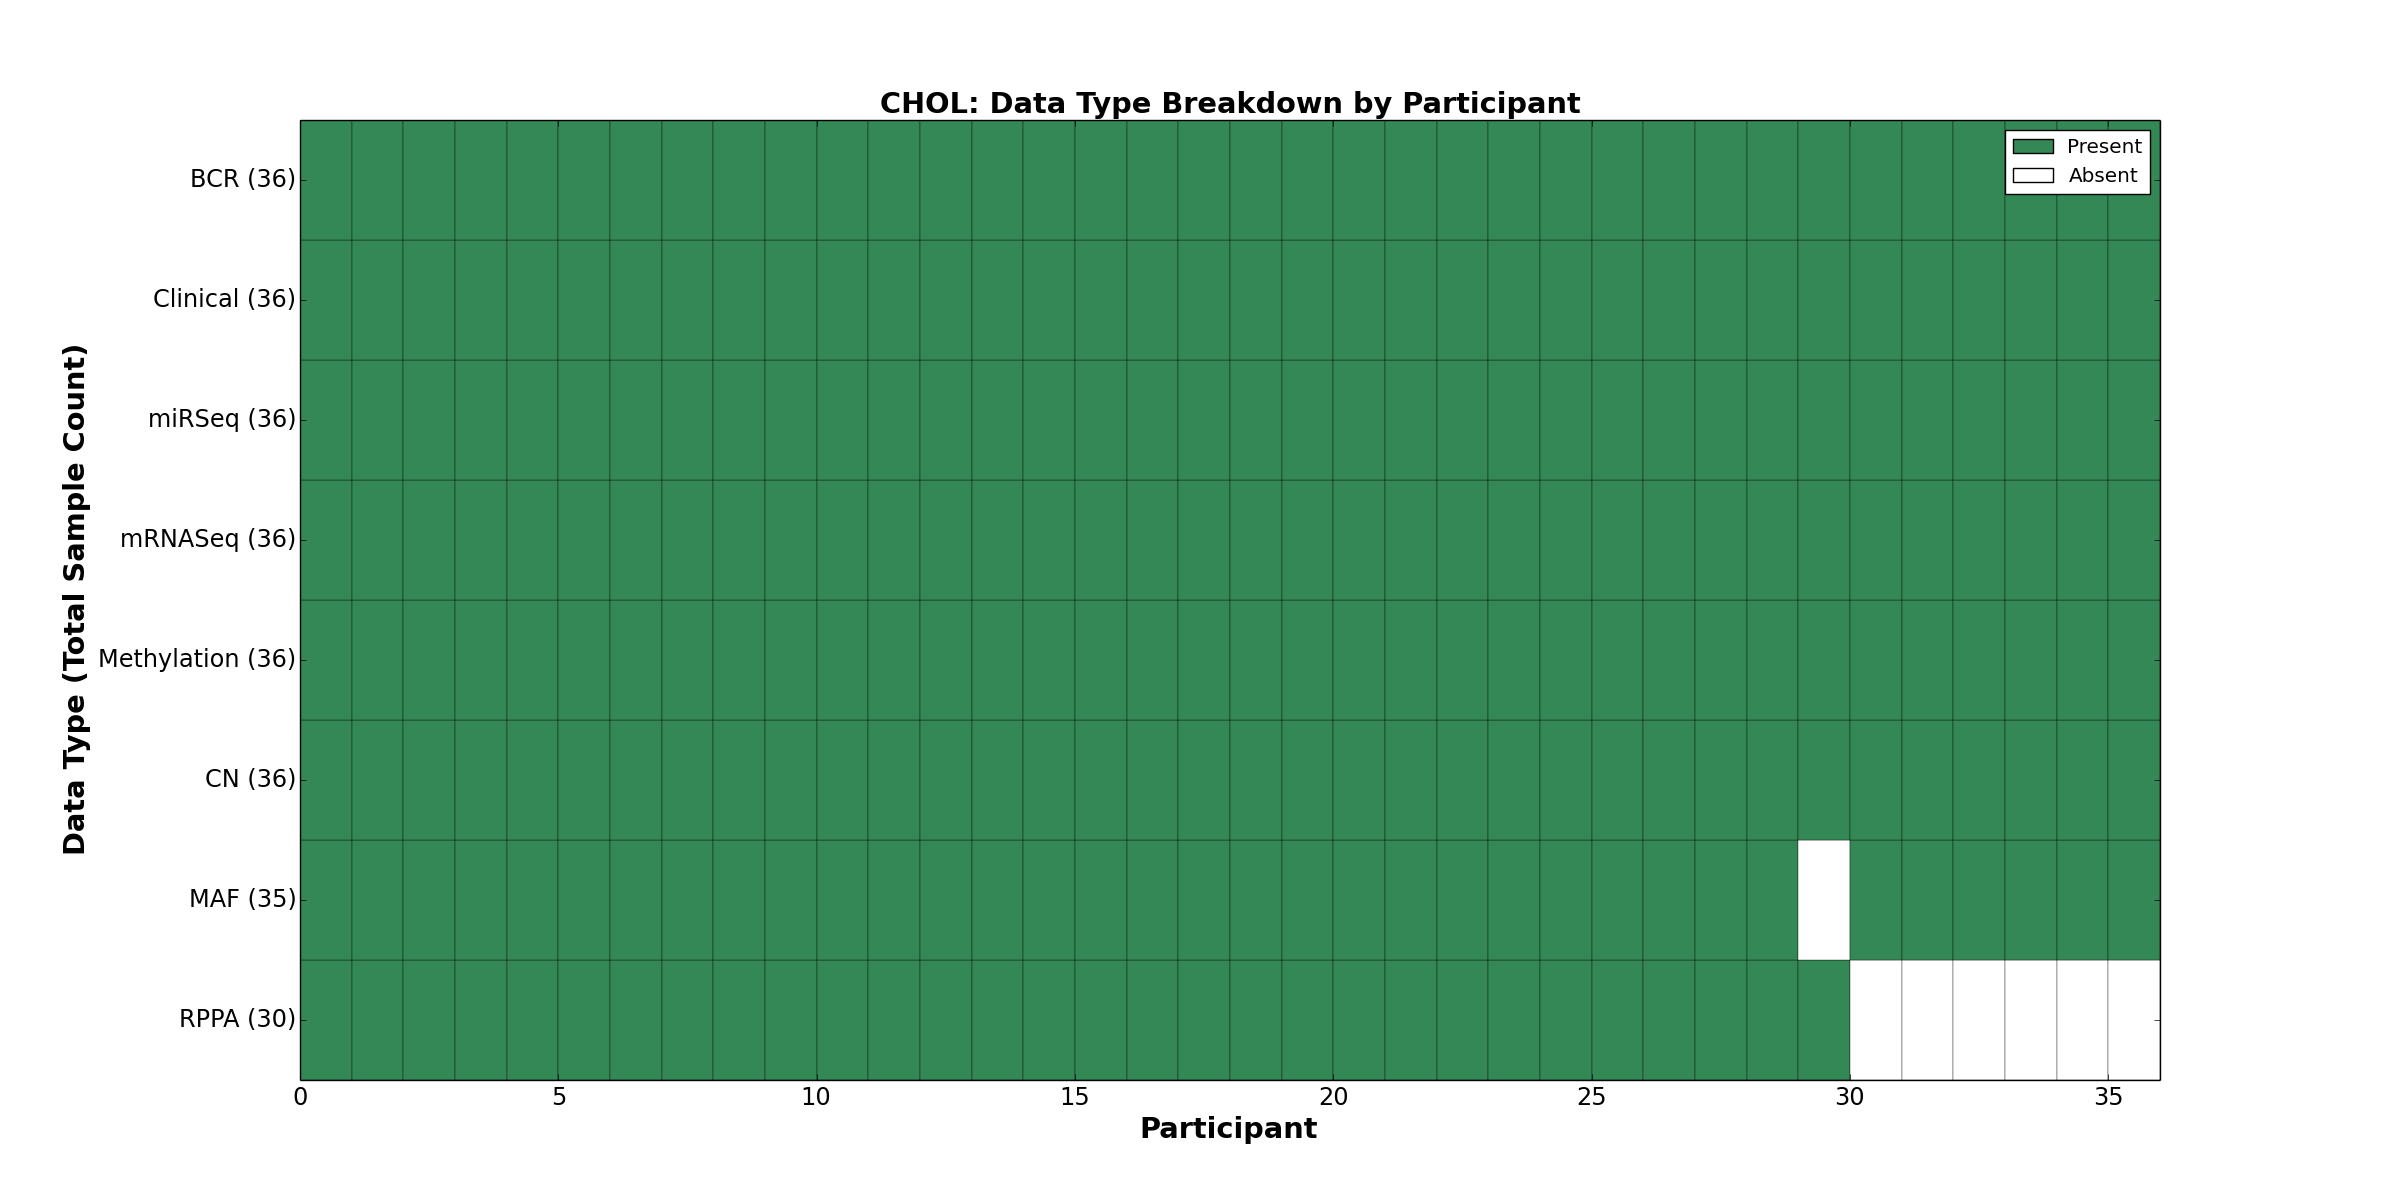
| CHOL | 36 | 36 | 36 | 0 | 36 | 0 | 36 | 0 | 36 | 30 | 35 | 0 |
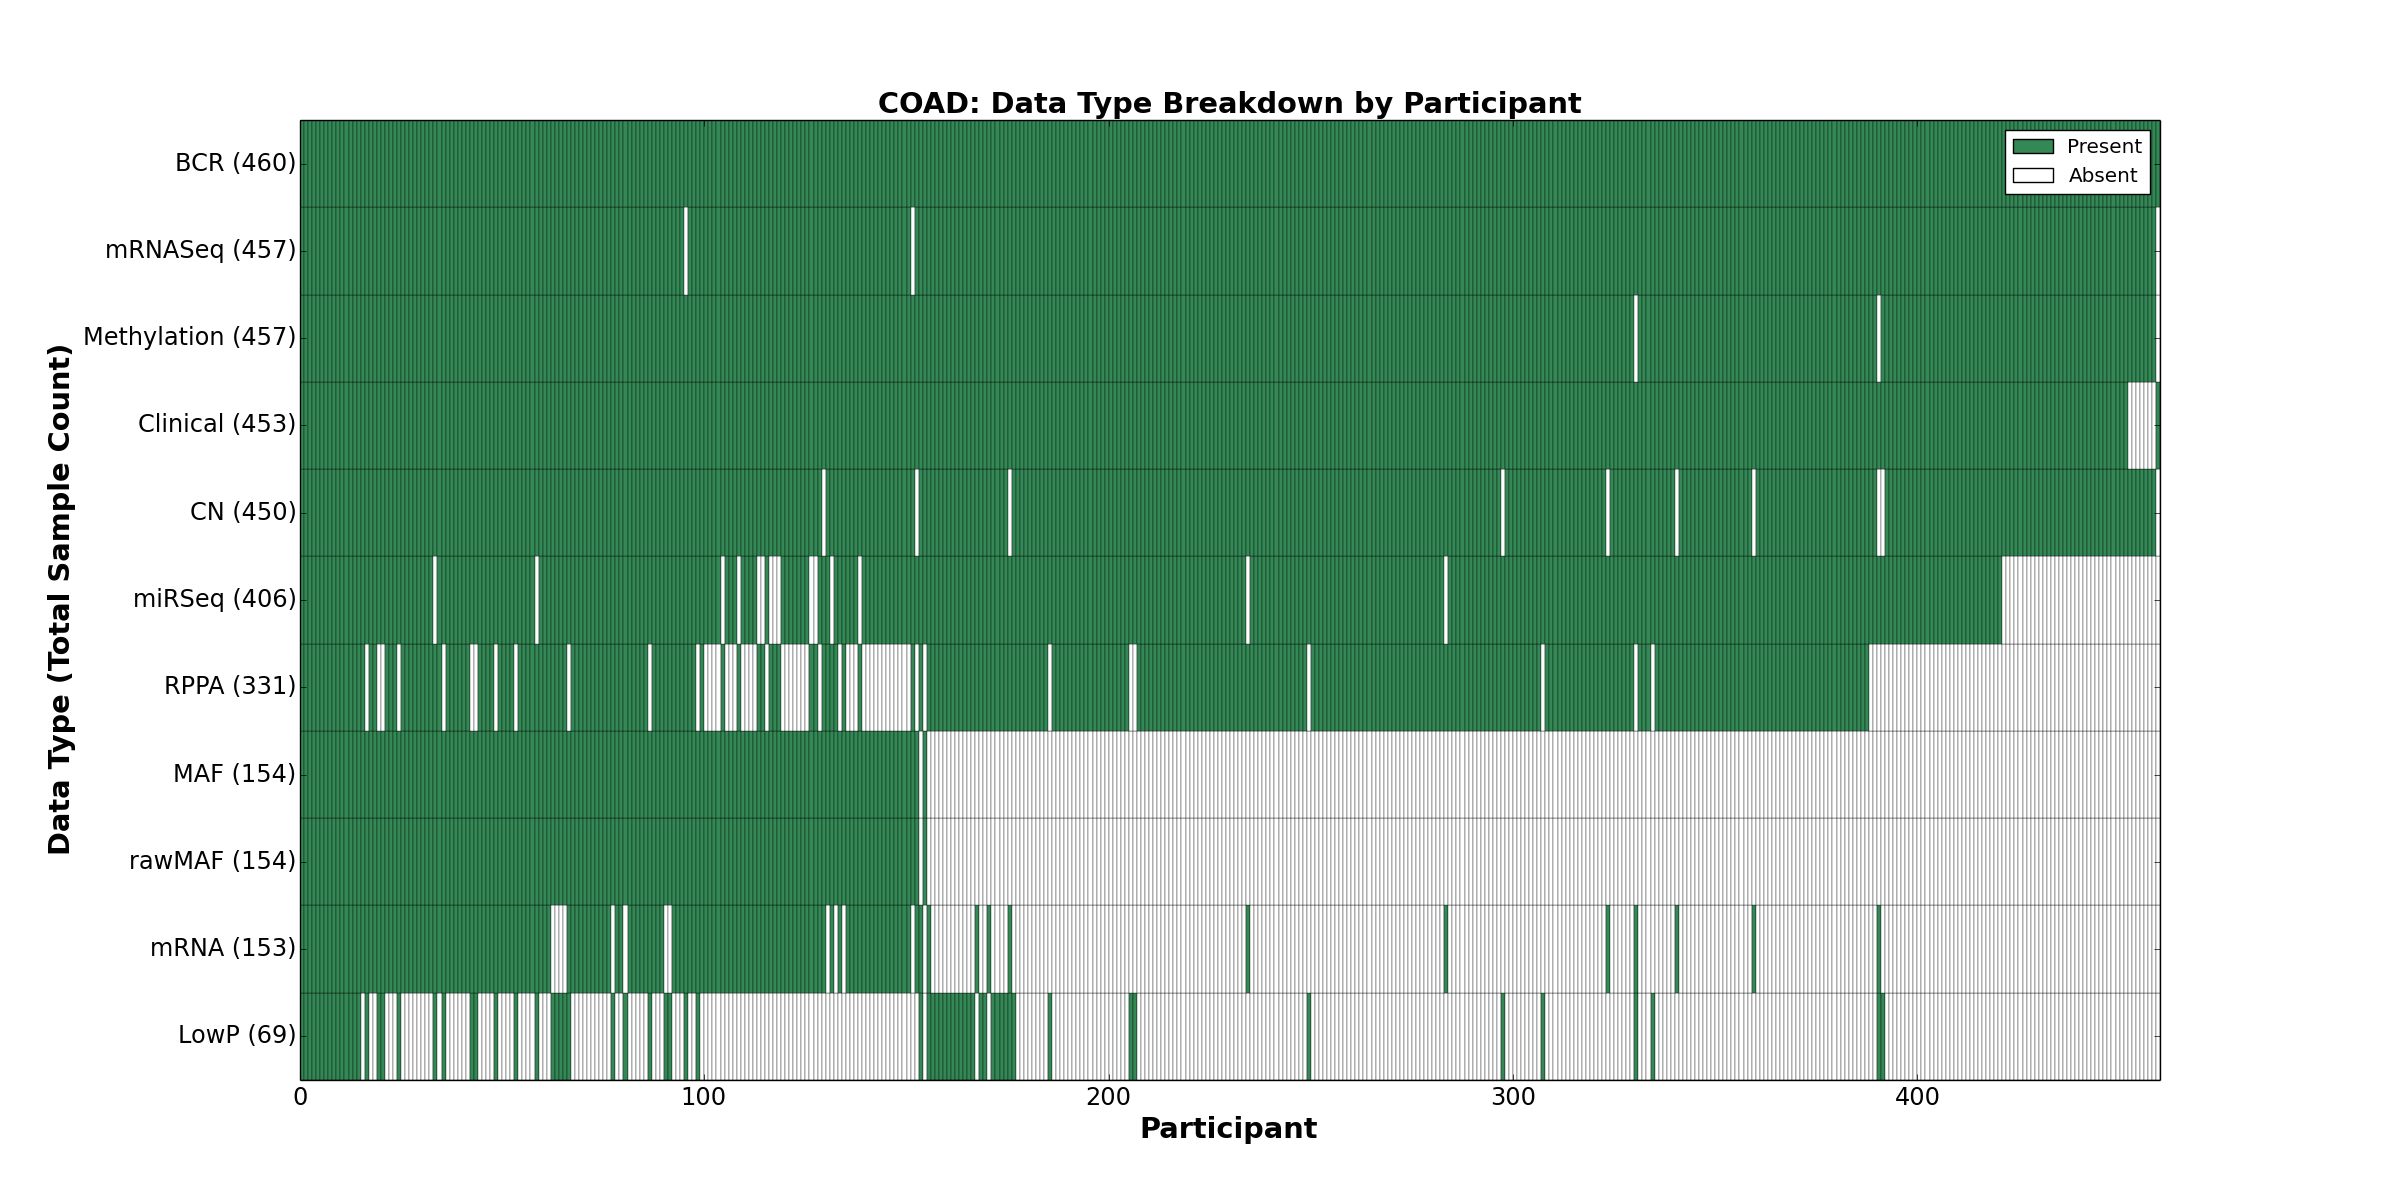
| COAD | 460 | 453 | 450 | 69 | 457 | 153 | 457 | 0 | 406 | 331 | 154 | 367 |
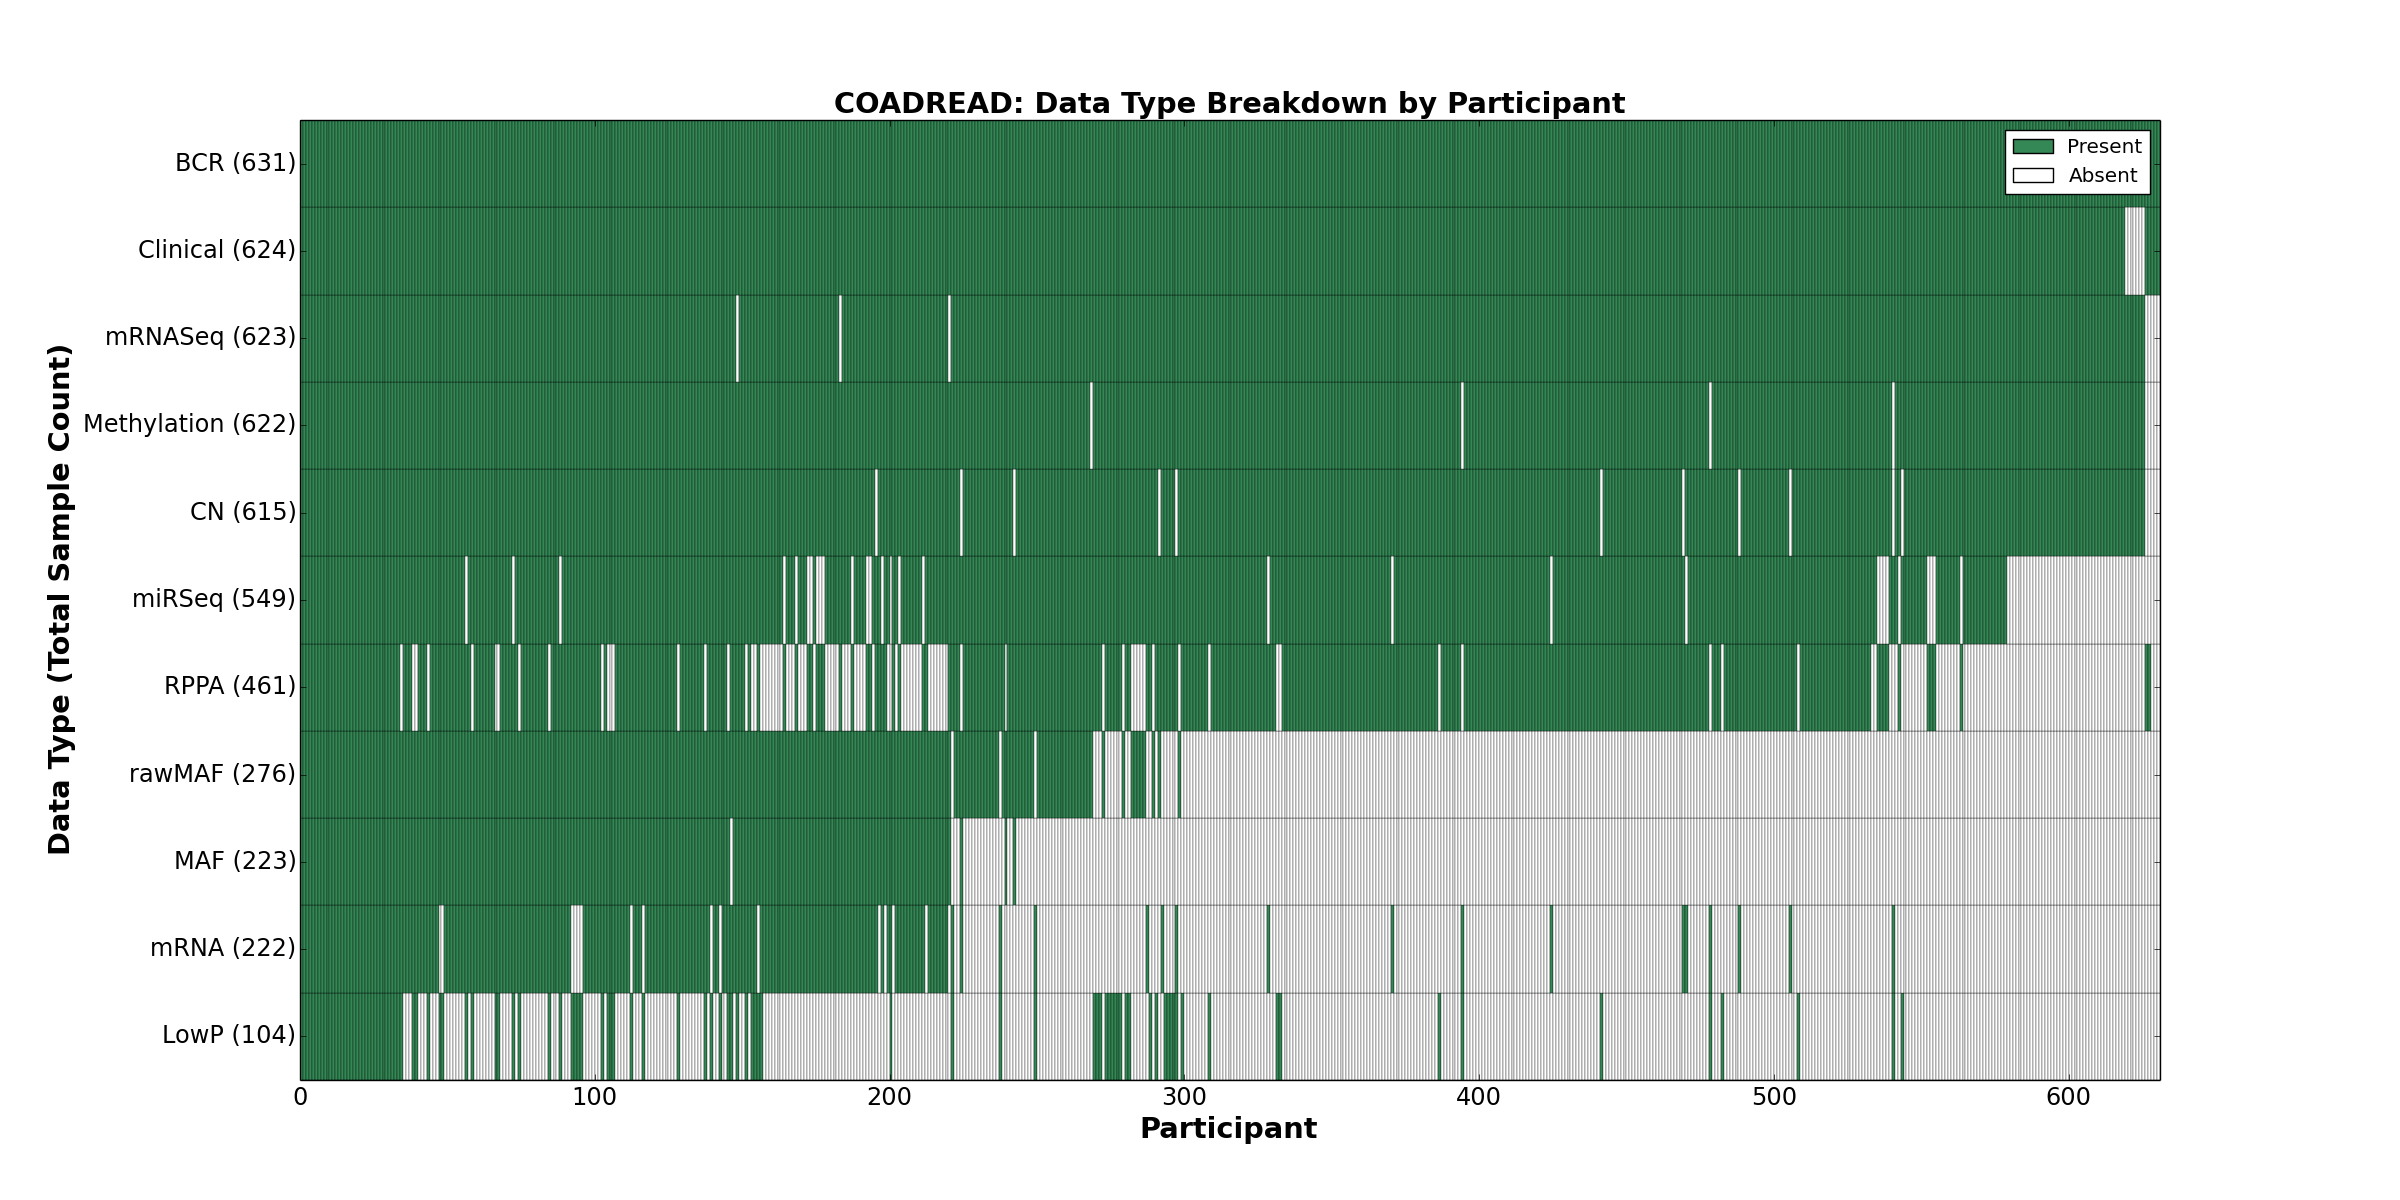
| COADREAD | 631 | 624 | 615 | 104 | 622 | 222 | 623 | 0 | 549 | 461 | 223 | 489 |
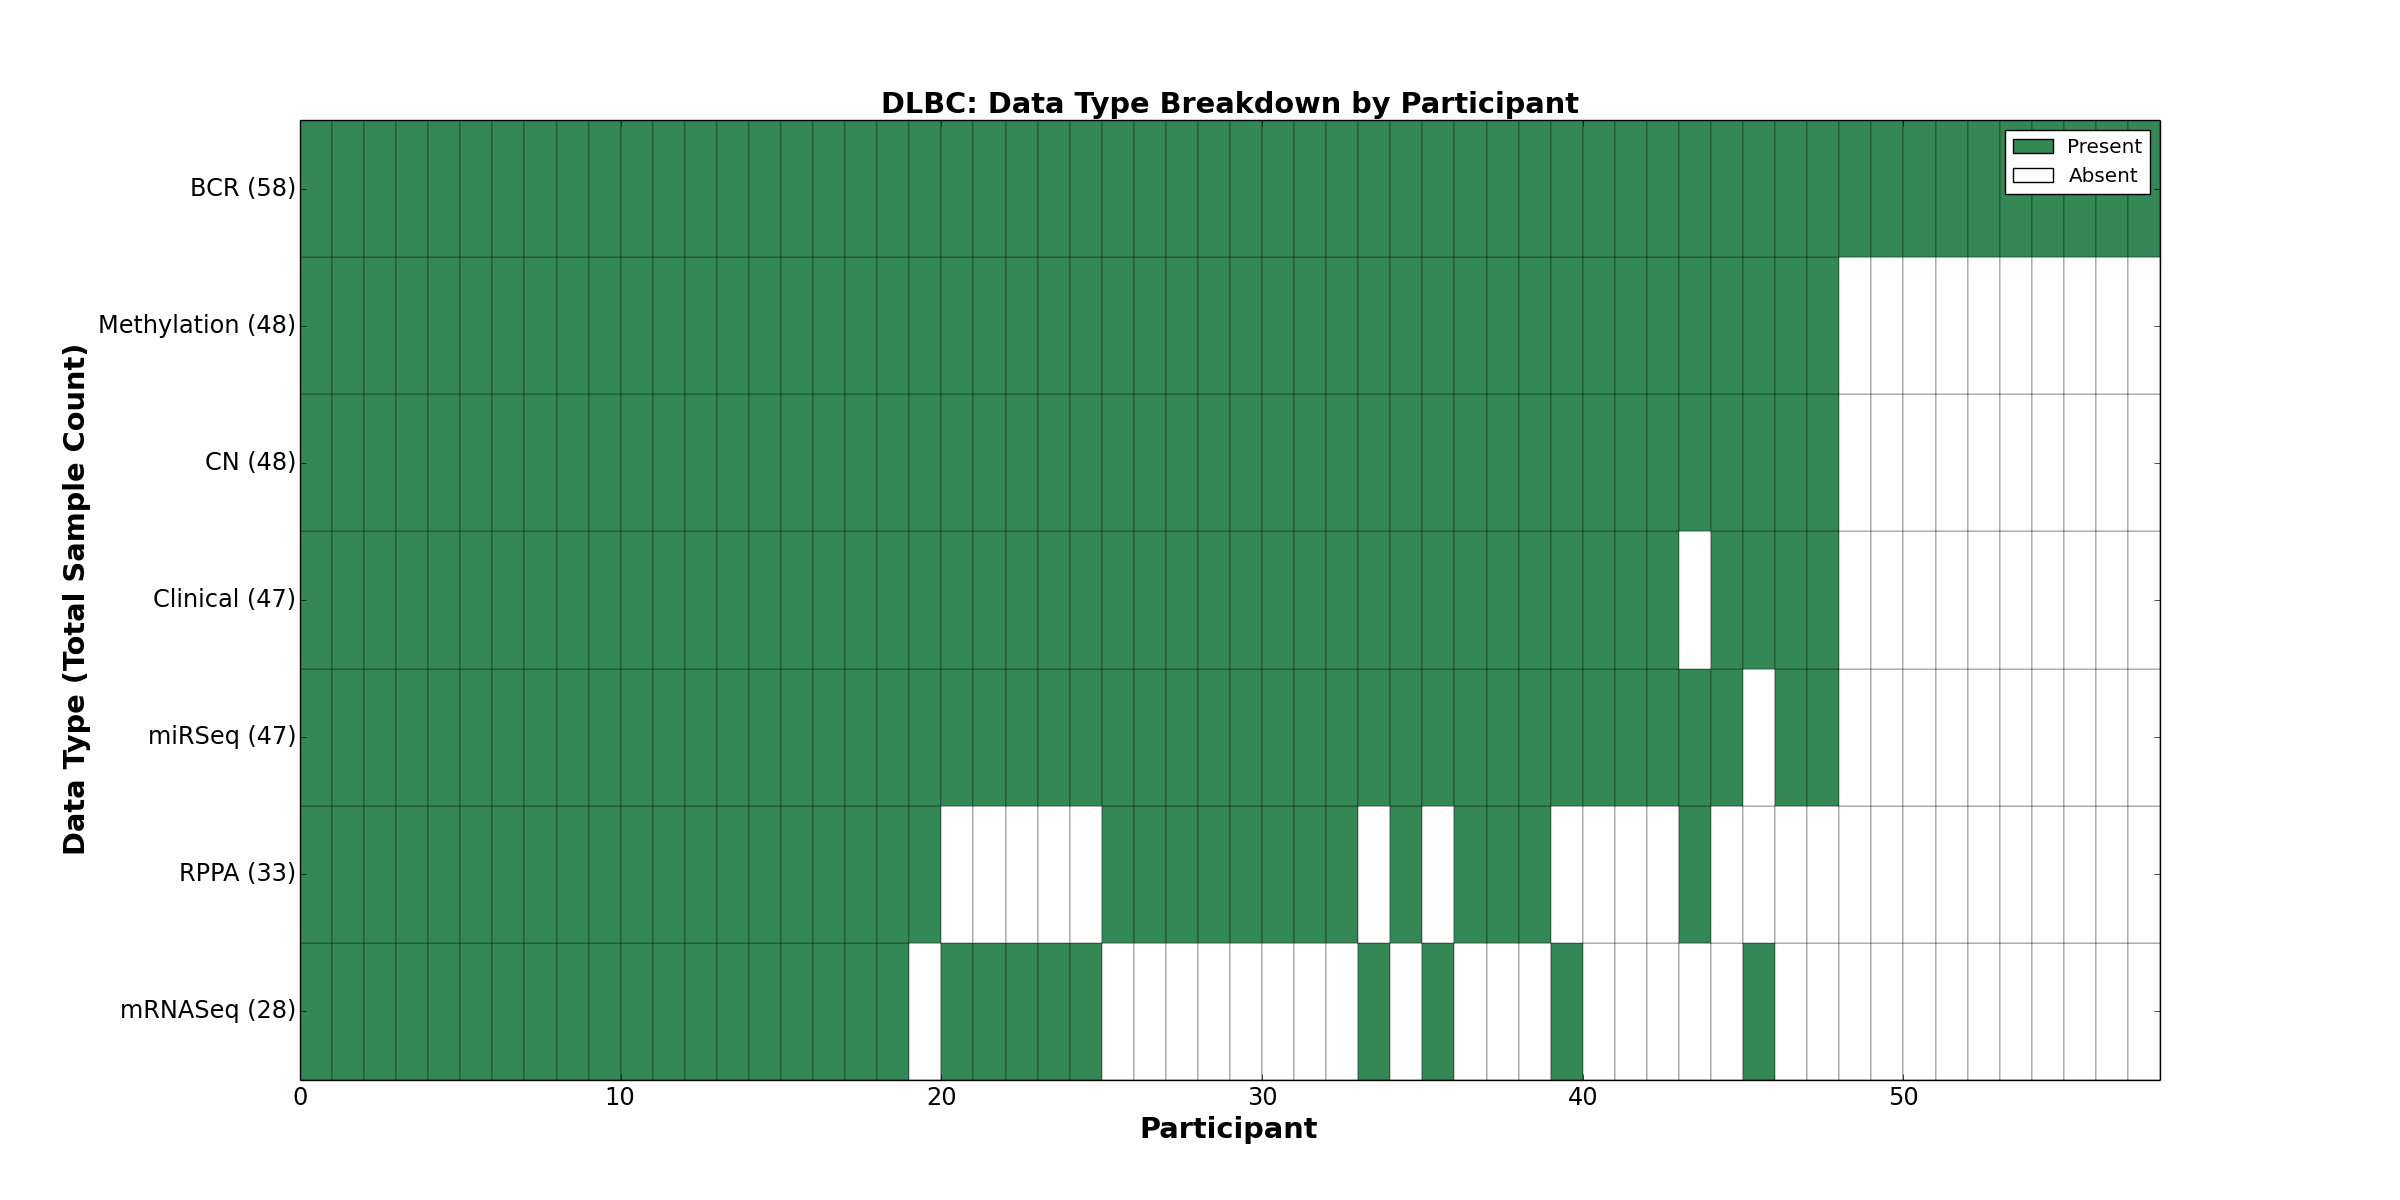
| DLBC | 58 | 47 | 48 | 0 | 48 | 0 | 28 | 0 | 47 | 33 | 0 | 0 |
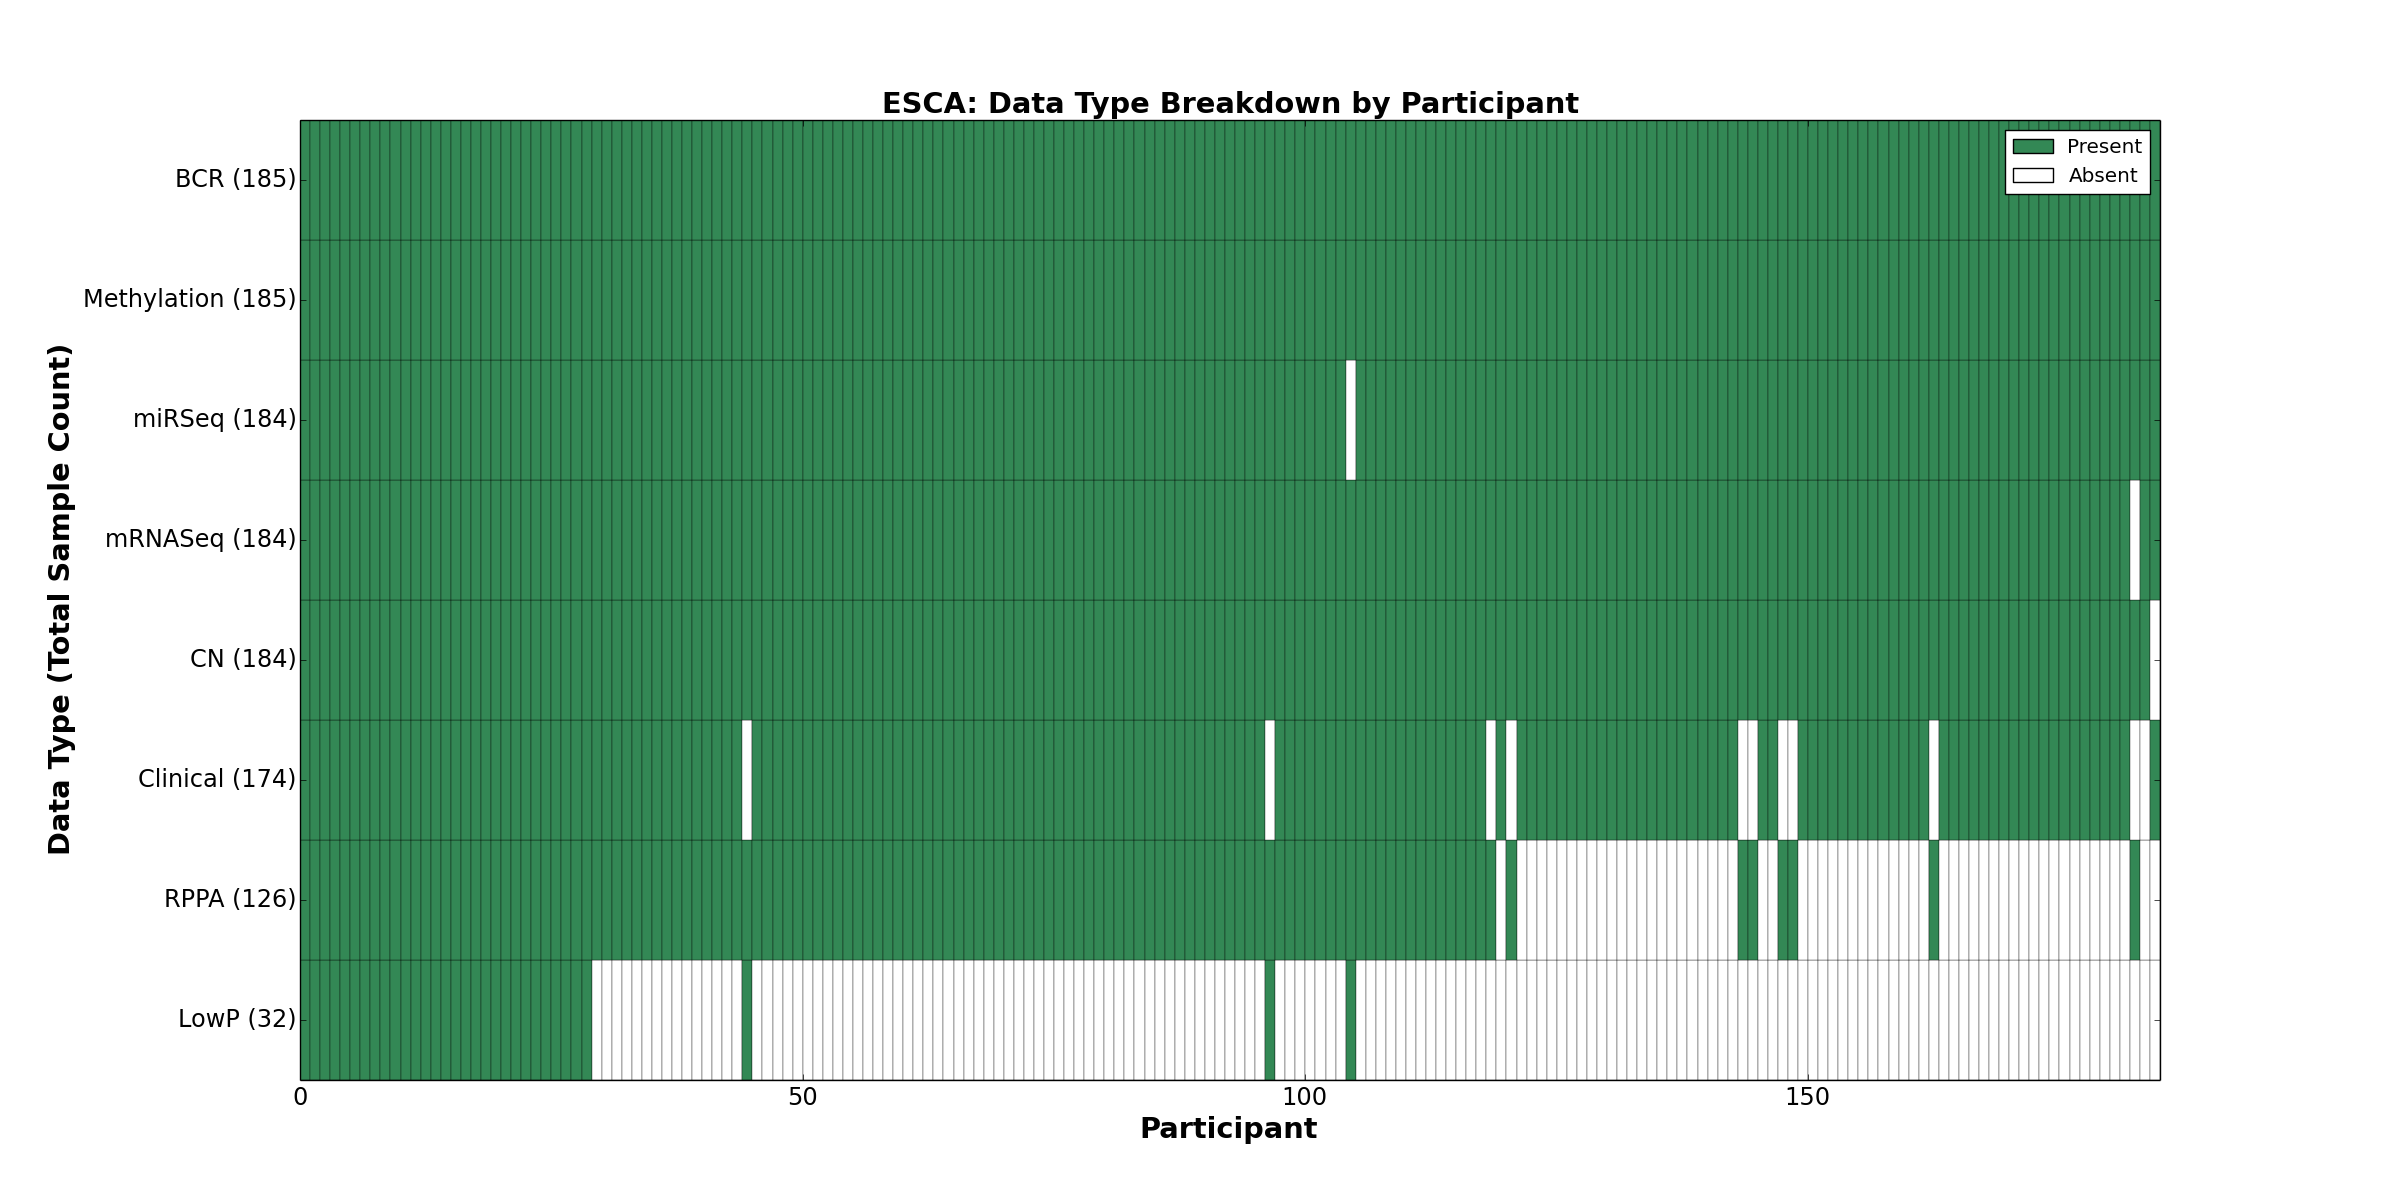
| ESCA | 185 | 174 | 184 | 32 | 185 | 0 | 184 | 0 | 184 | 126 | 0 | 0 |
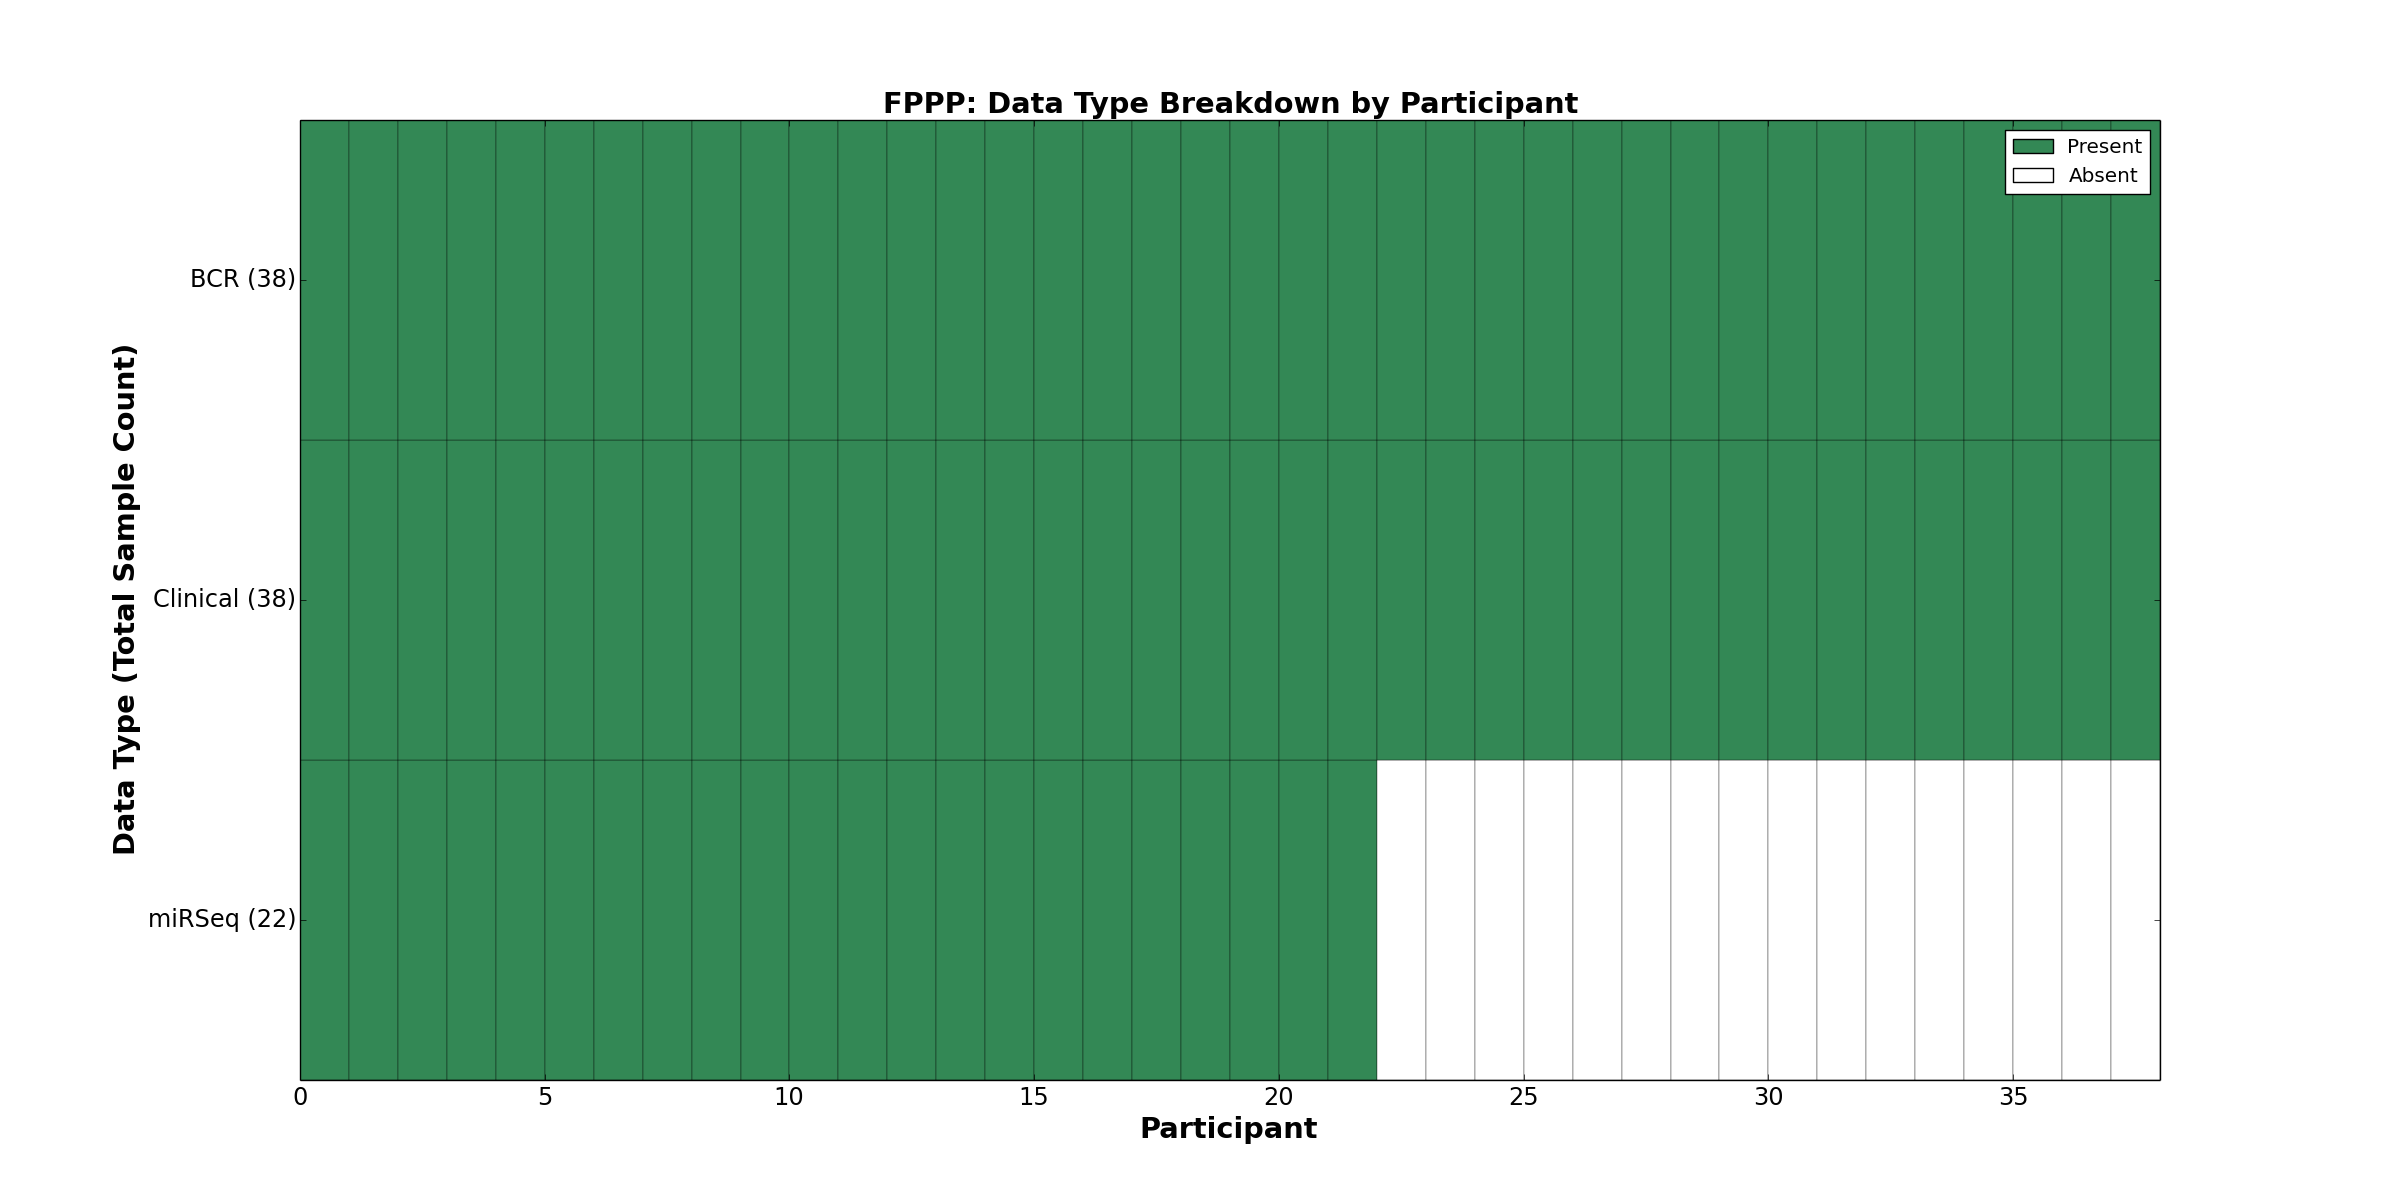
| FPPP | 38 | 38 | 0 | 0 | 0 | 0 | 0 | 0 | 22 | 0 | 0 | 0 |
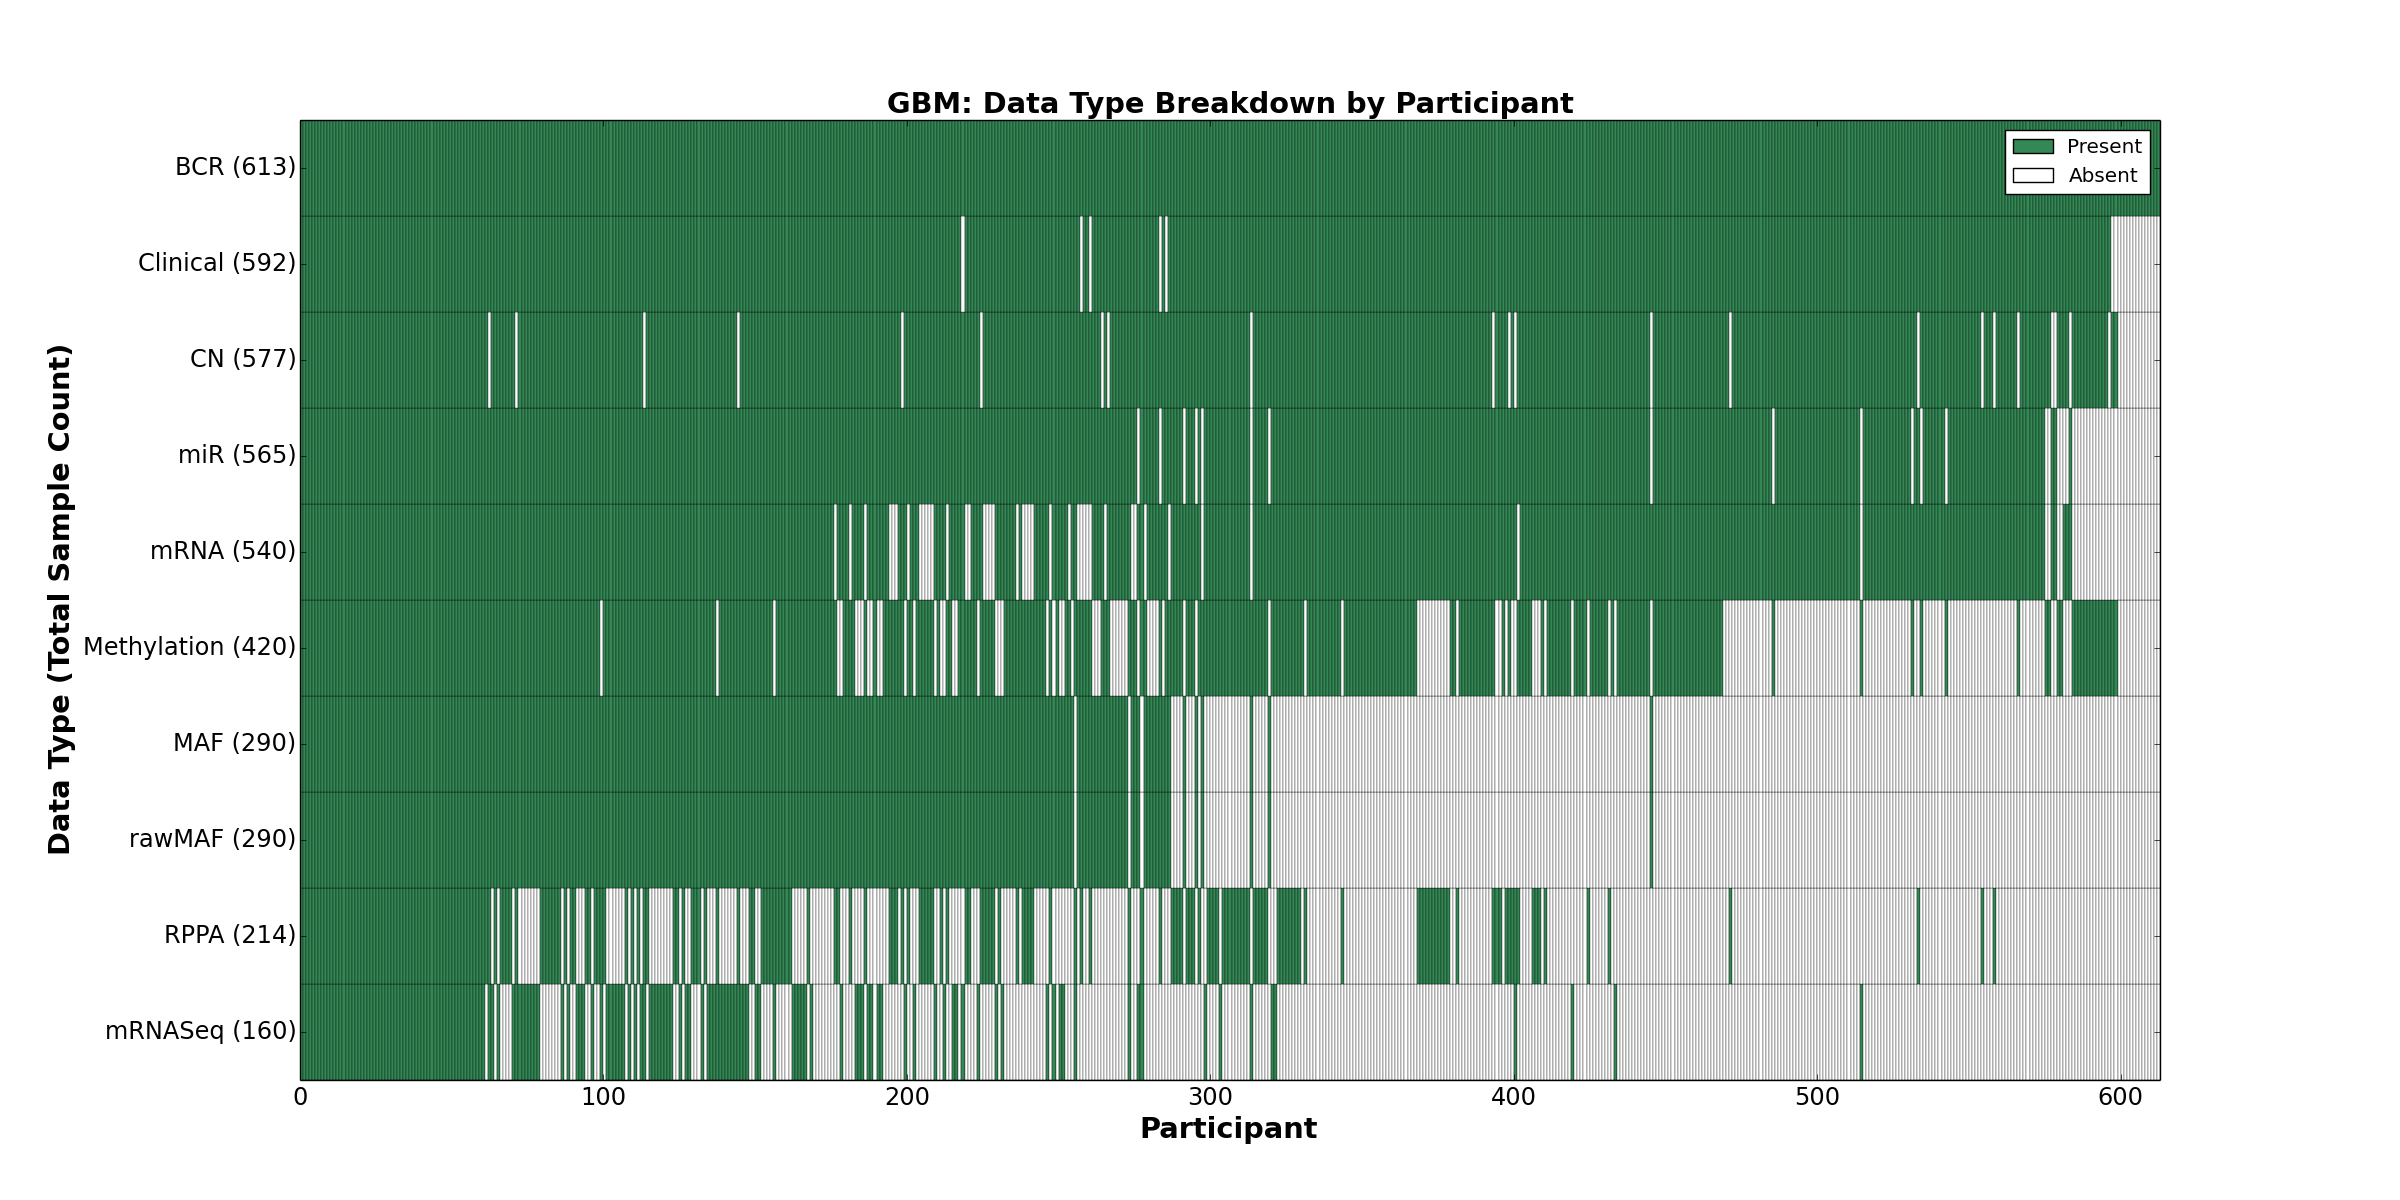
| GBM | 613 | 592 | 577 | 0 | 420 | 540 | 160 | 565 | 0 | 214 | 290 | 290 |
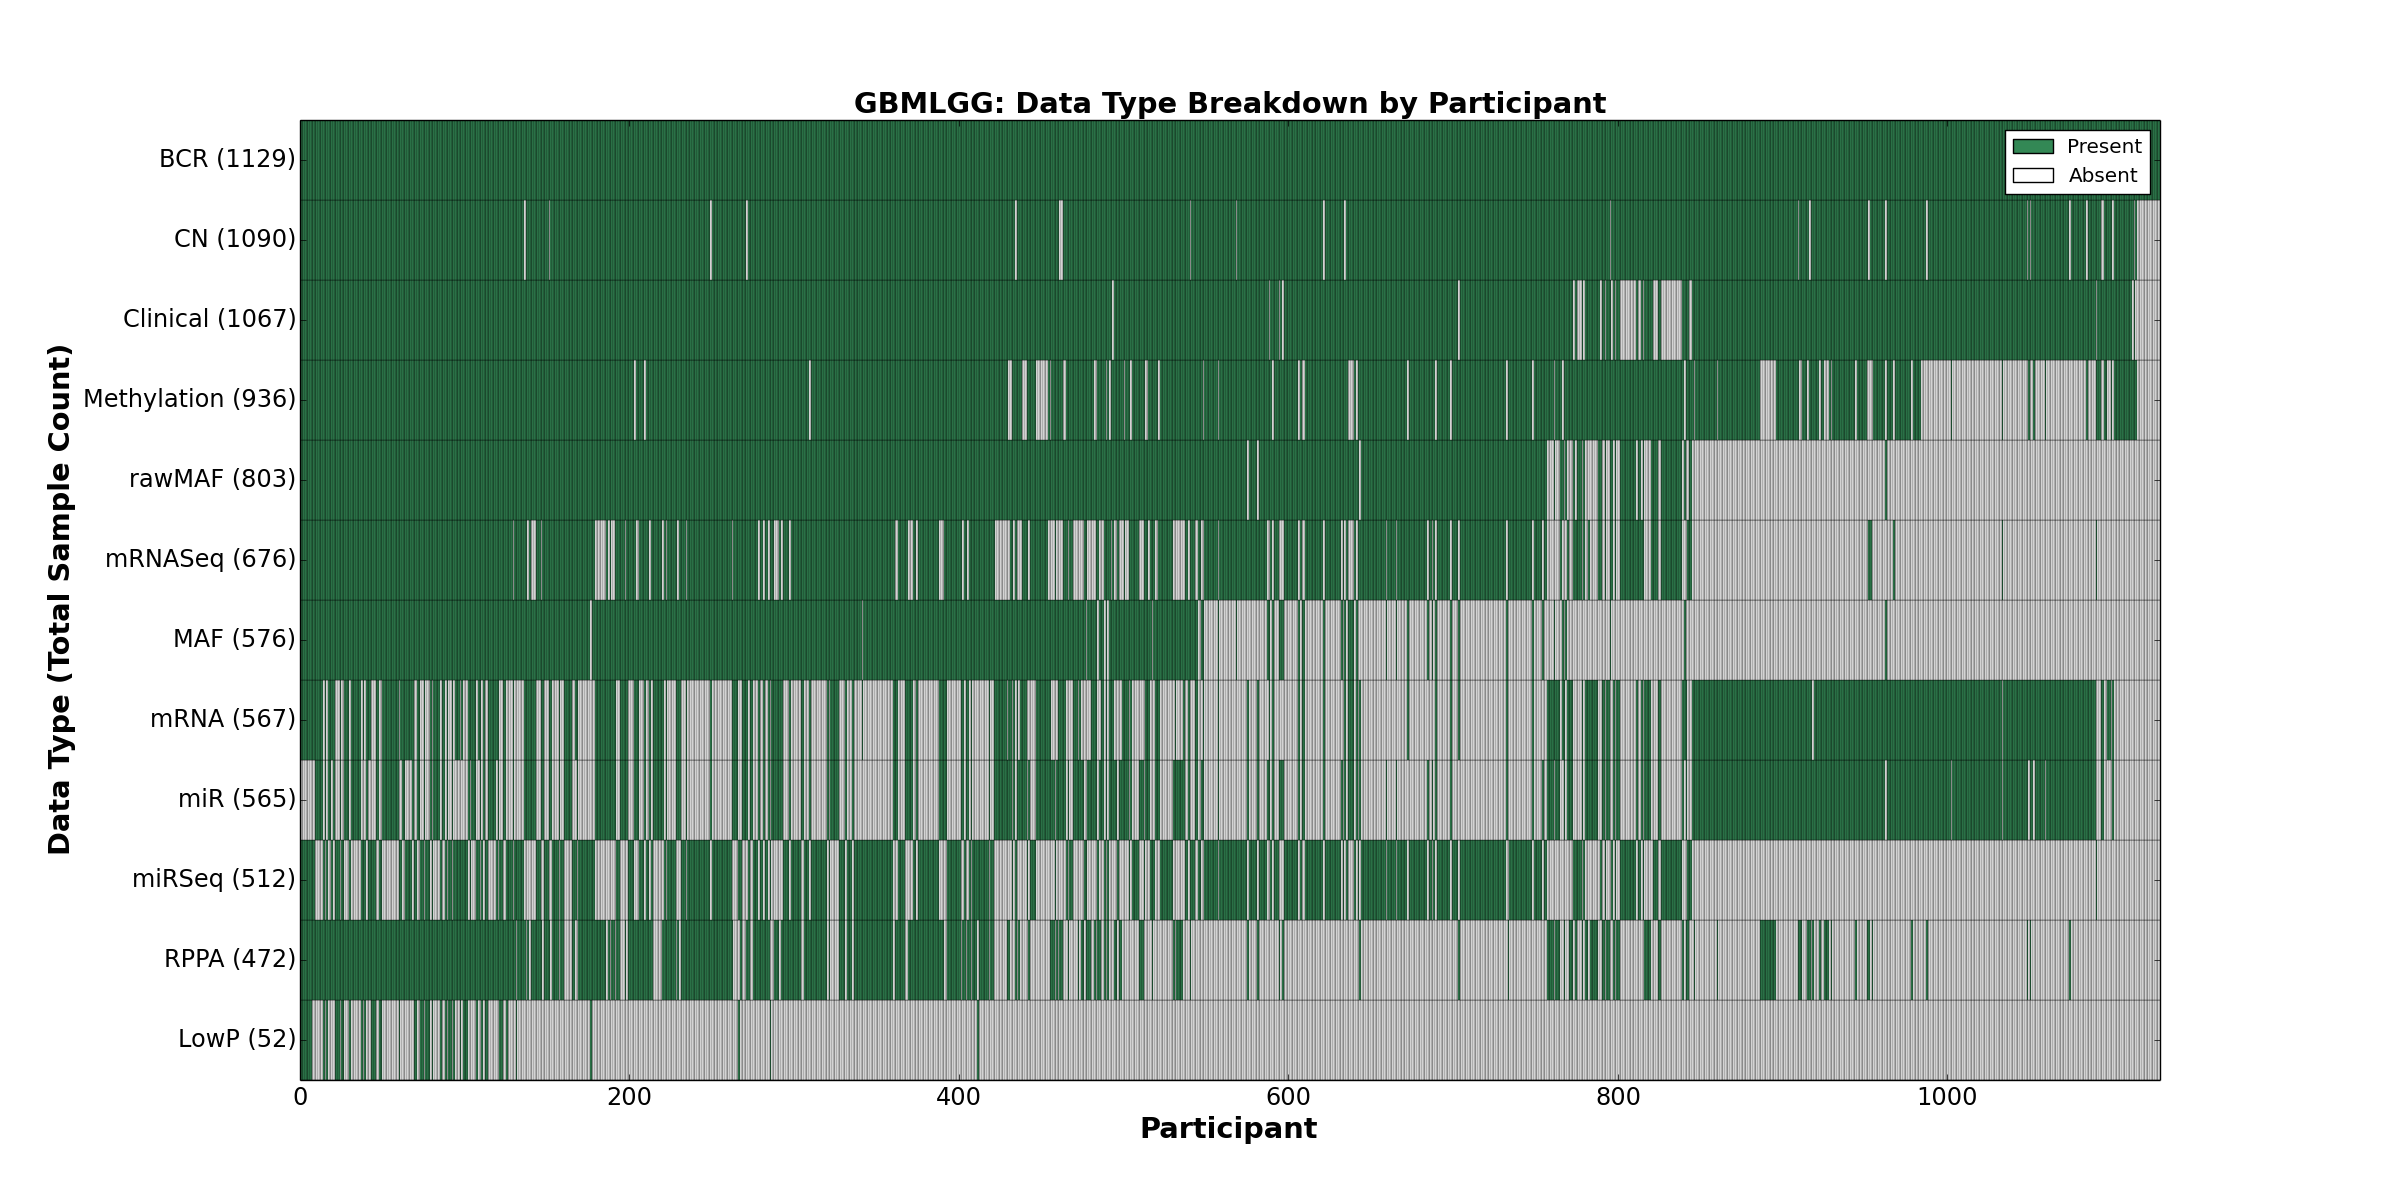
| GBMLGG | 1129 | 1067 | 1090 | 52 | 936 | 567 | 676 | 565 | 512 | 472 | 576 | 803 |
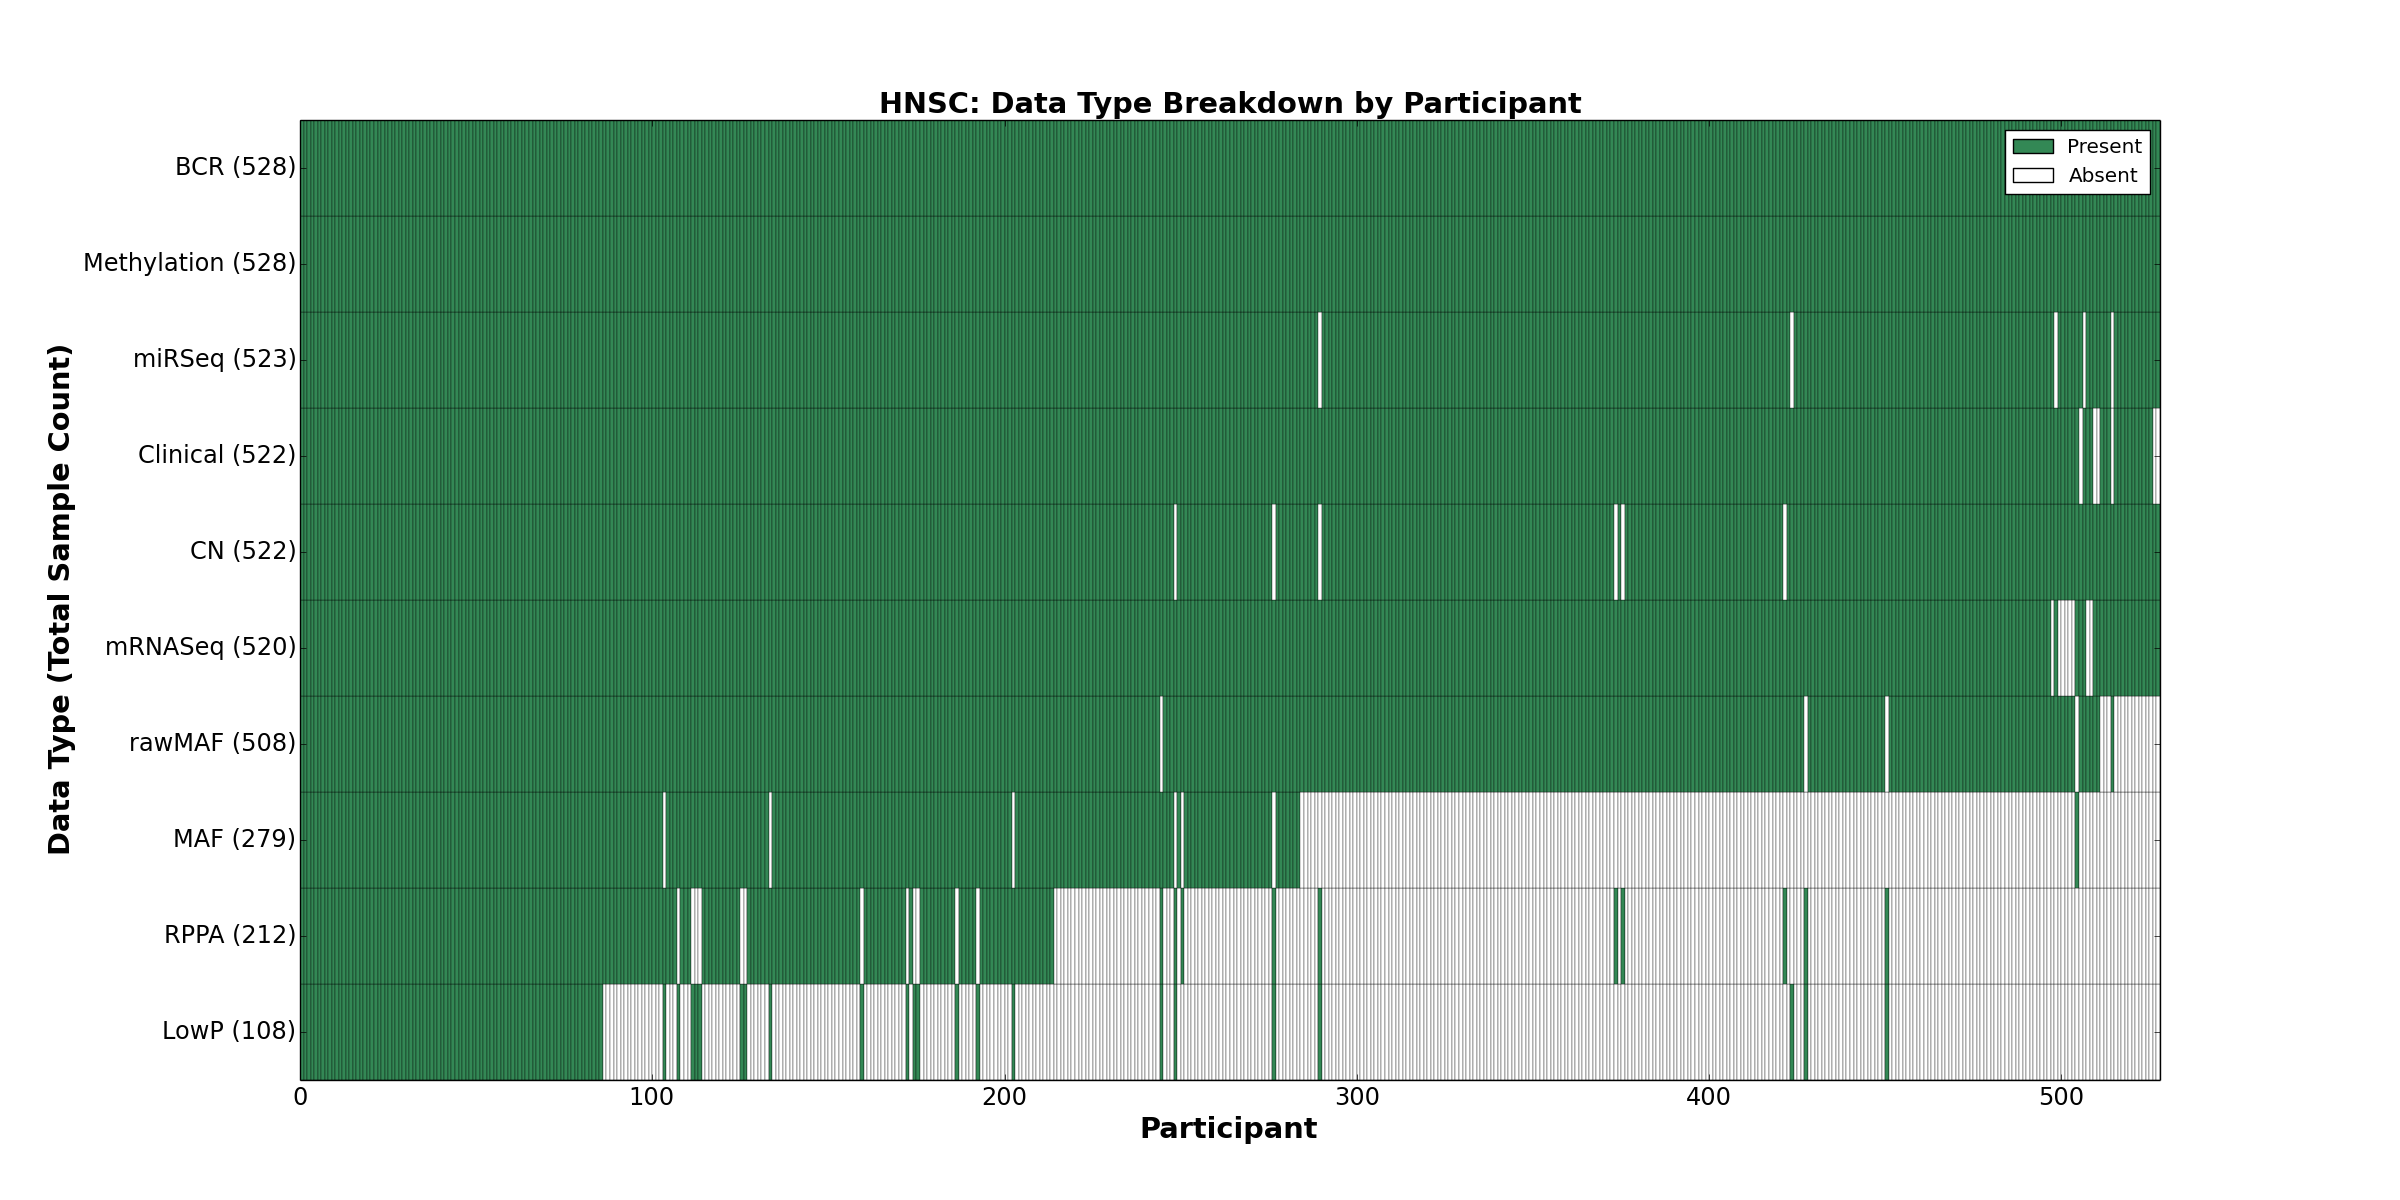
| HNSC | 528 | 522 | 522 | 108 | 528 | 0 | 520 | 0 | 523 | 212 | 279 | 508 |
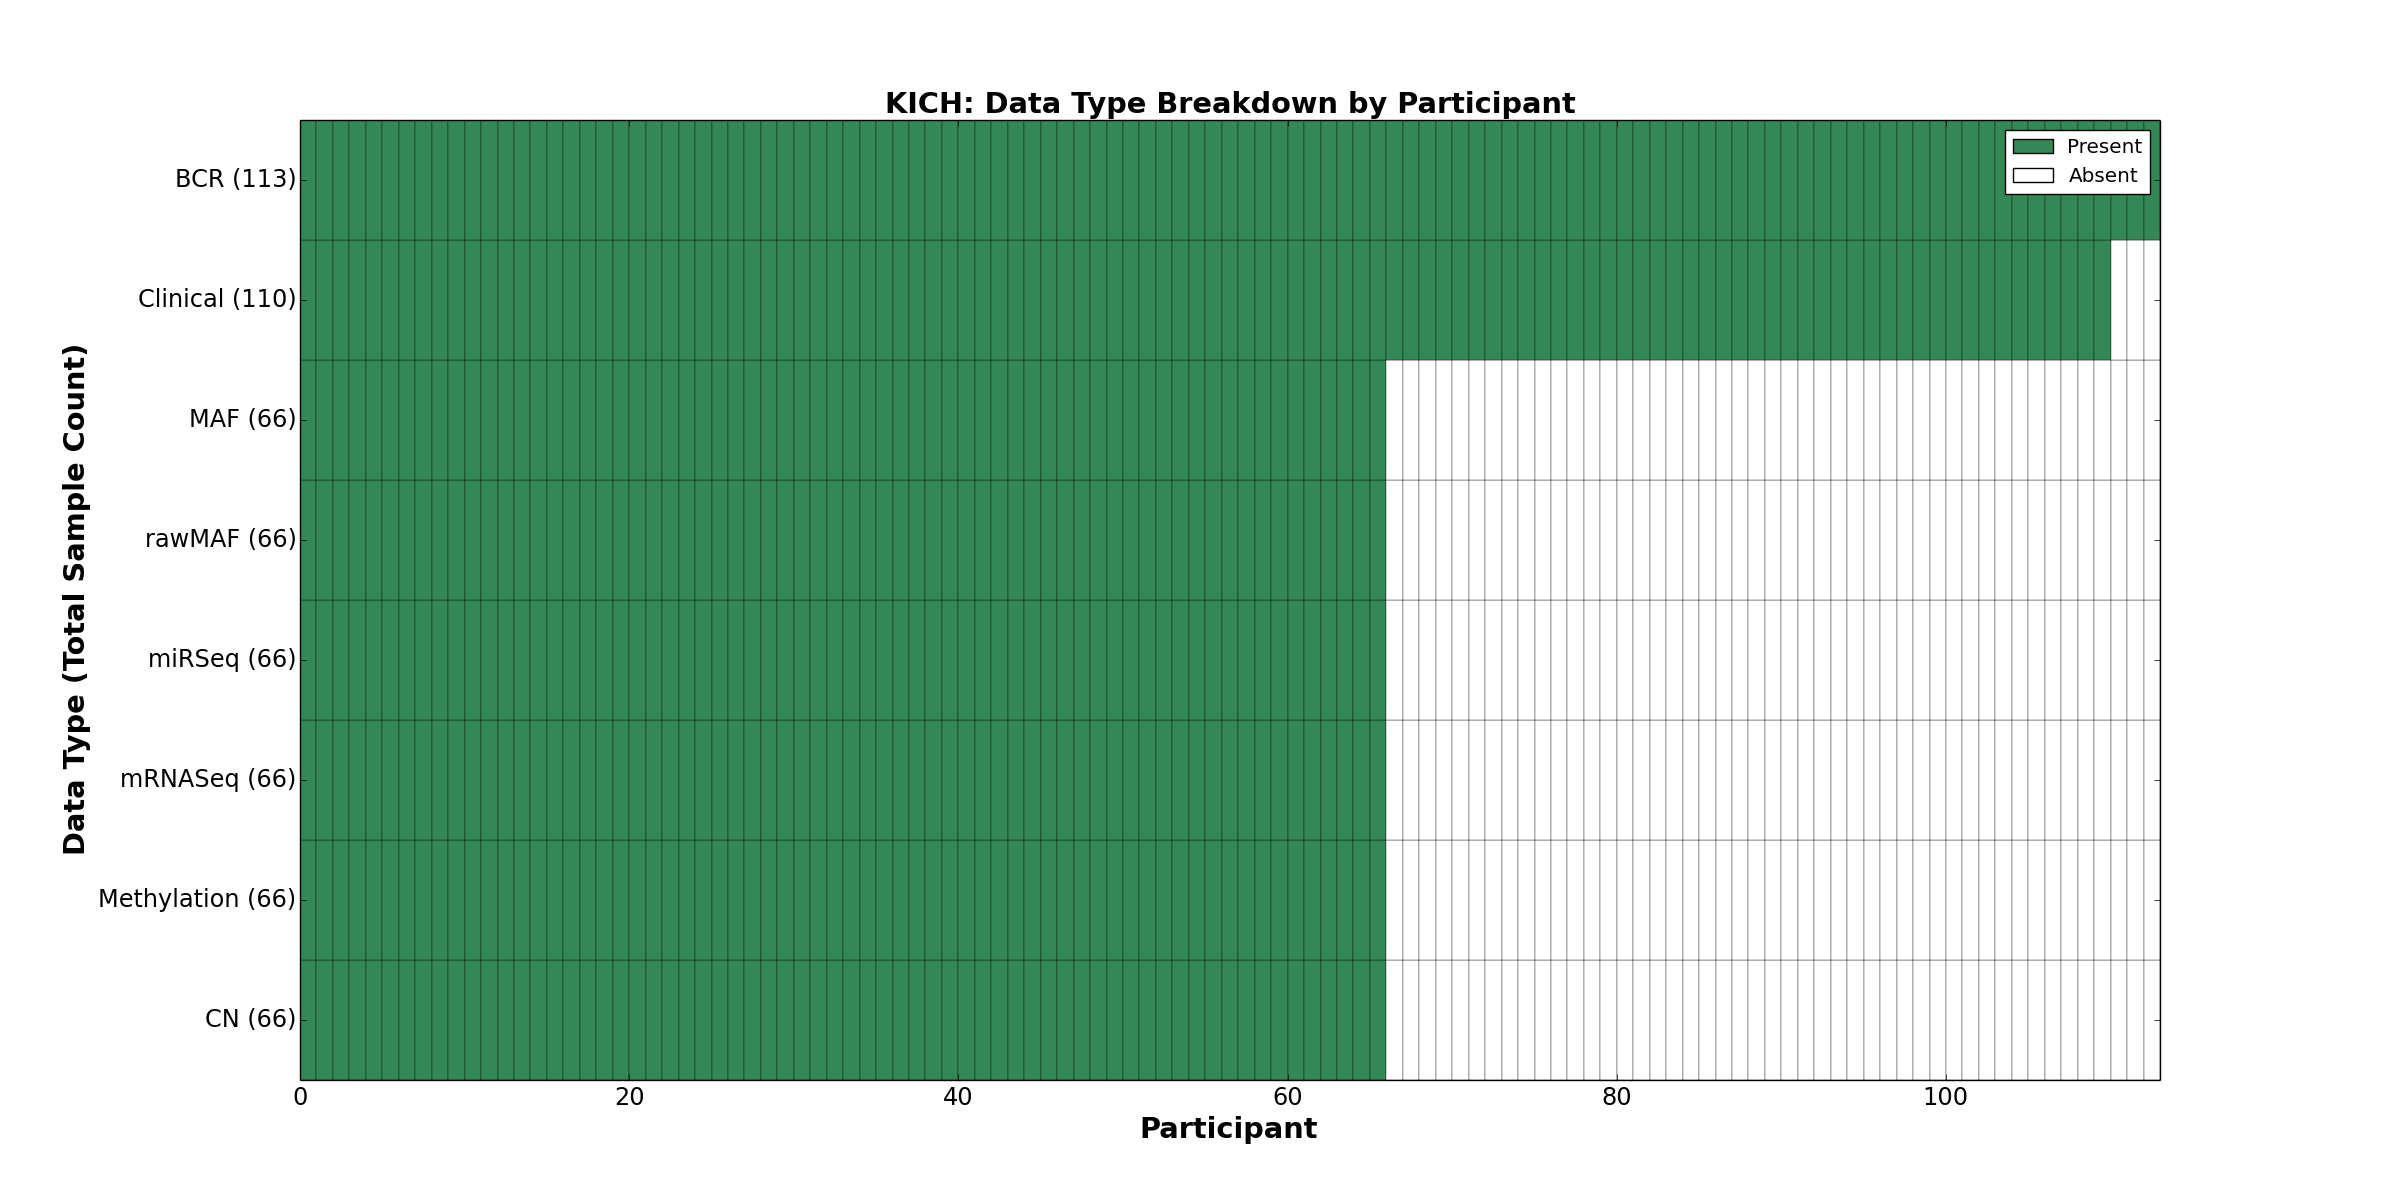
| KICH | 113 | 110 | 66 | 0 | 66 | 0 | 66 | 0 | 66 | 0 | 66 | 66 |
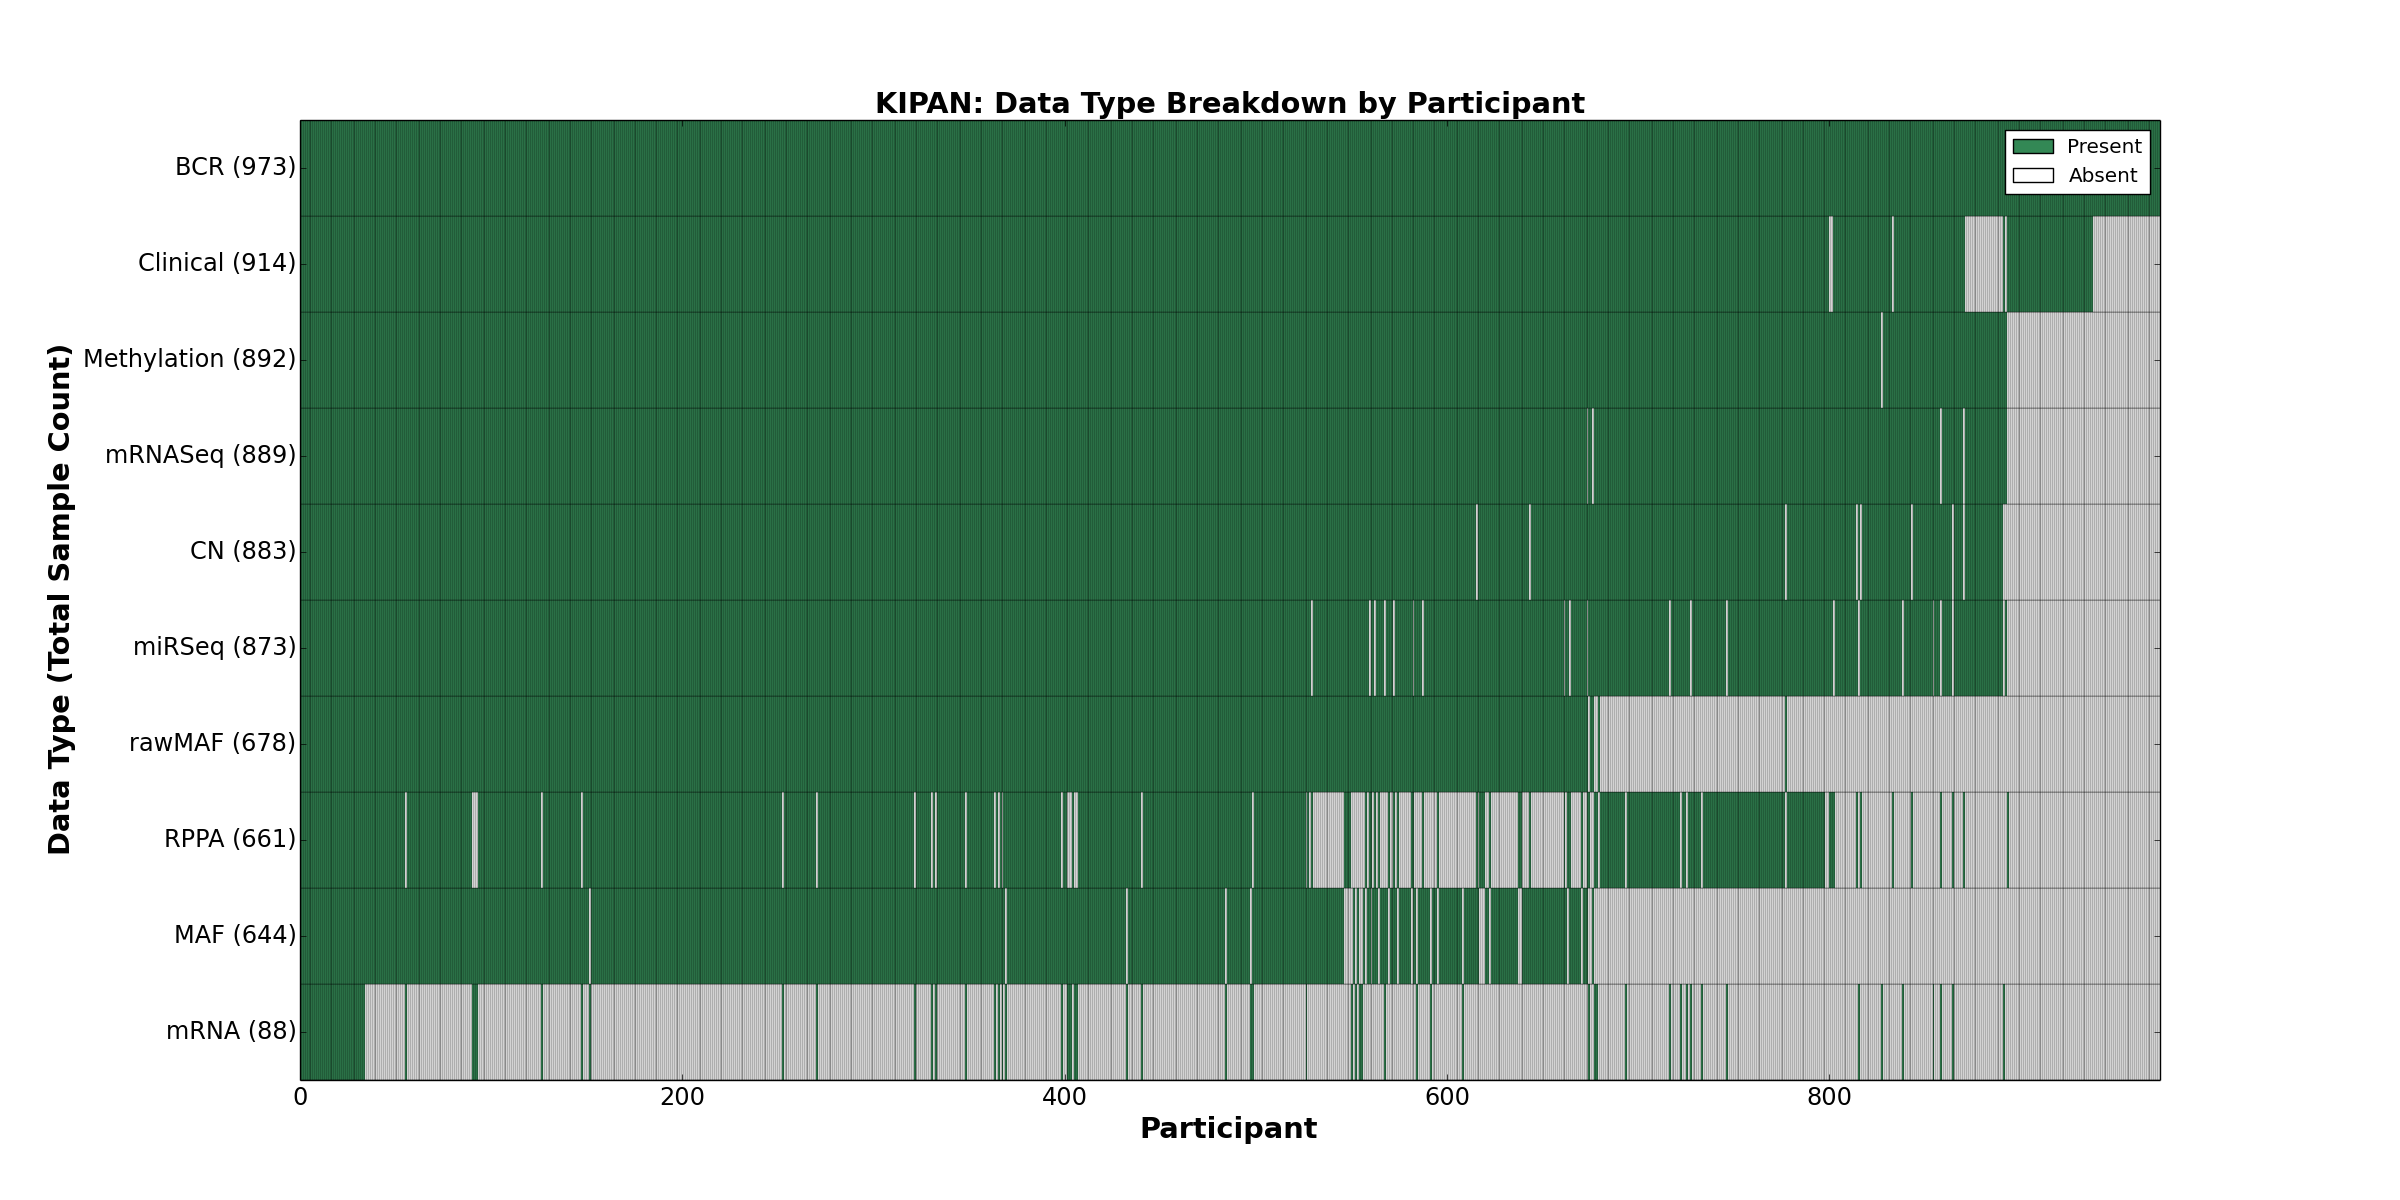
| KIPAN | 973 | 914 | 883 | 0 | 892 | 88 | 889 | 0 | 873 | 661 | 644 | 678 |
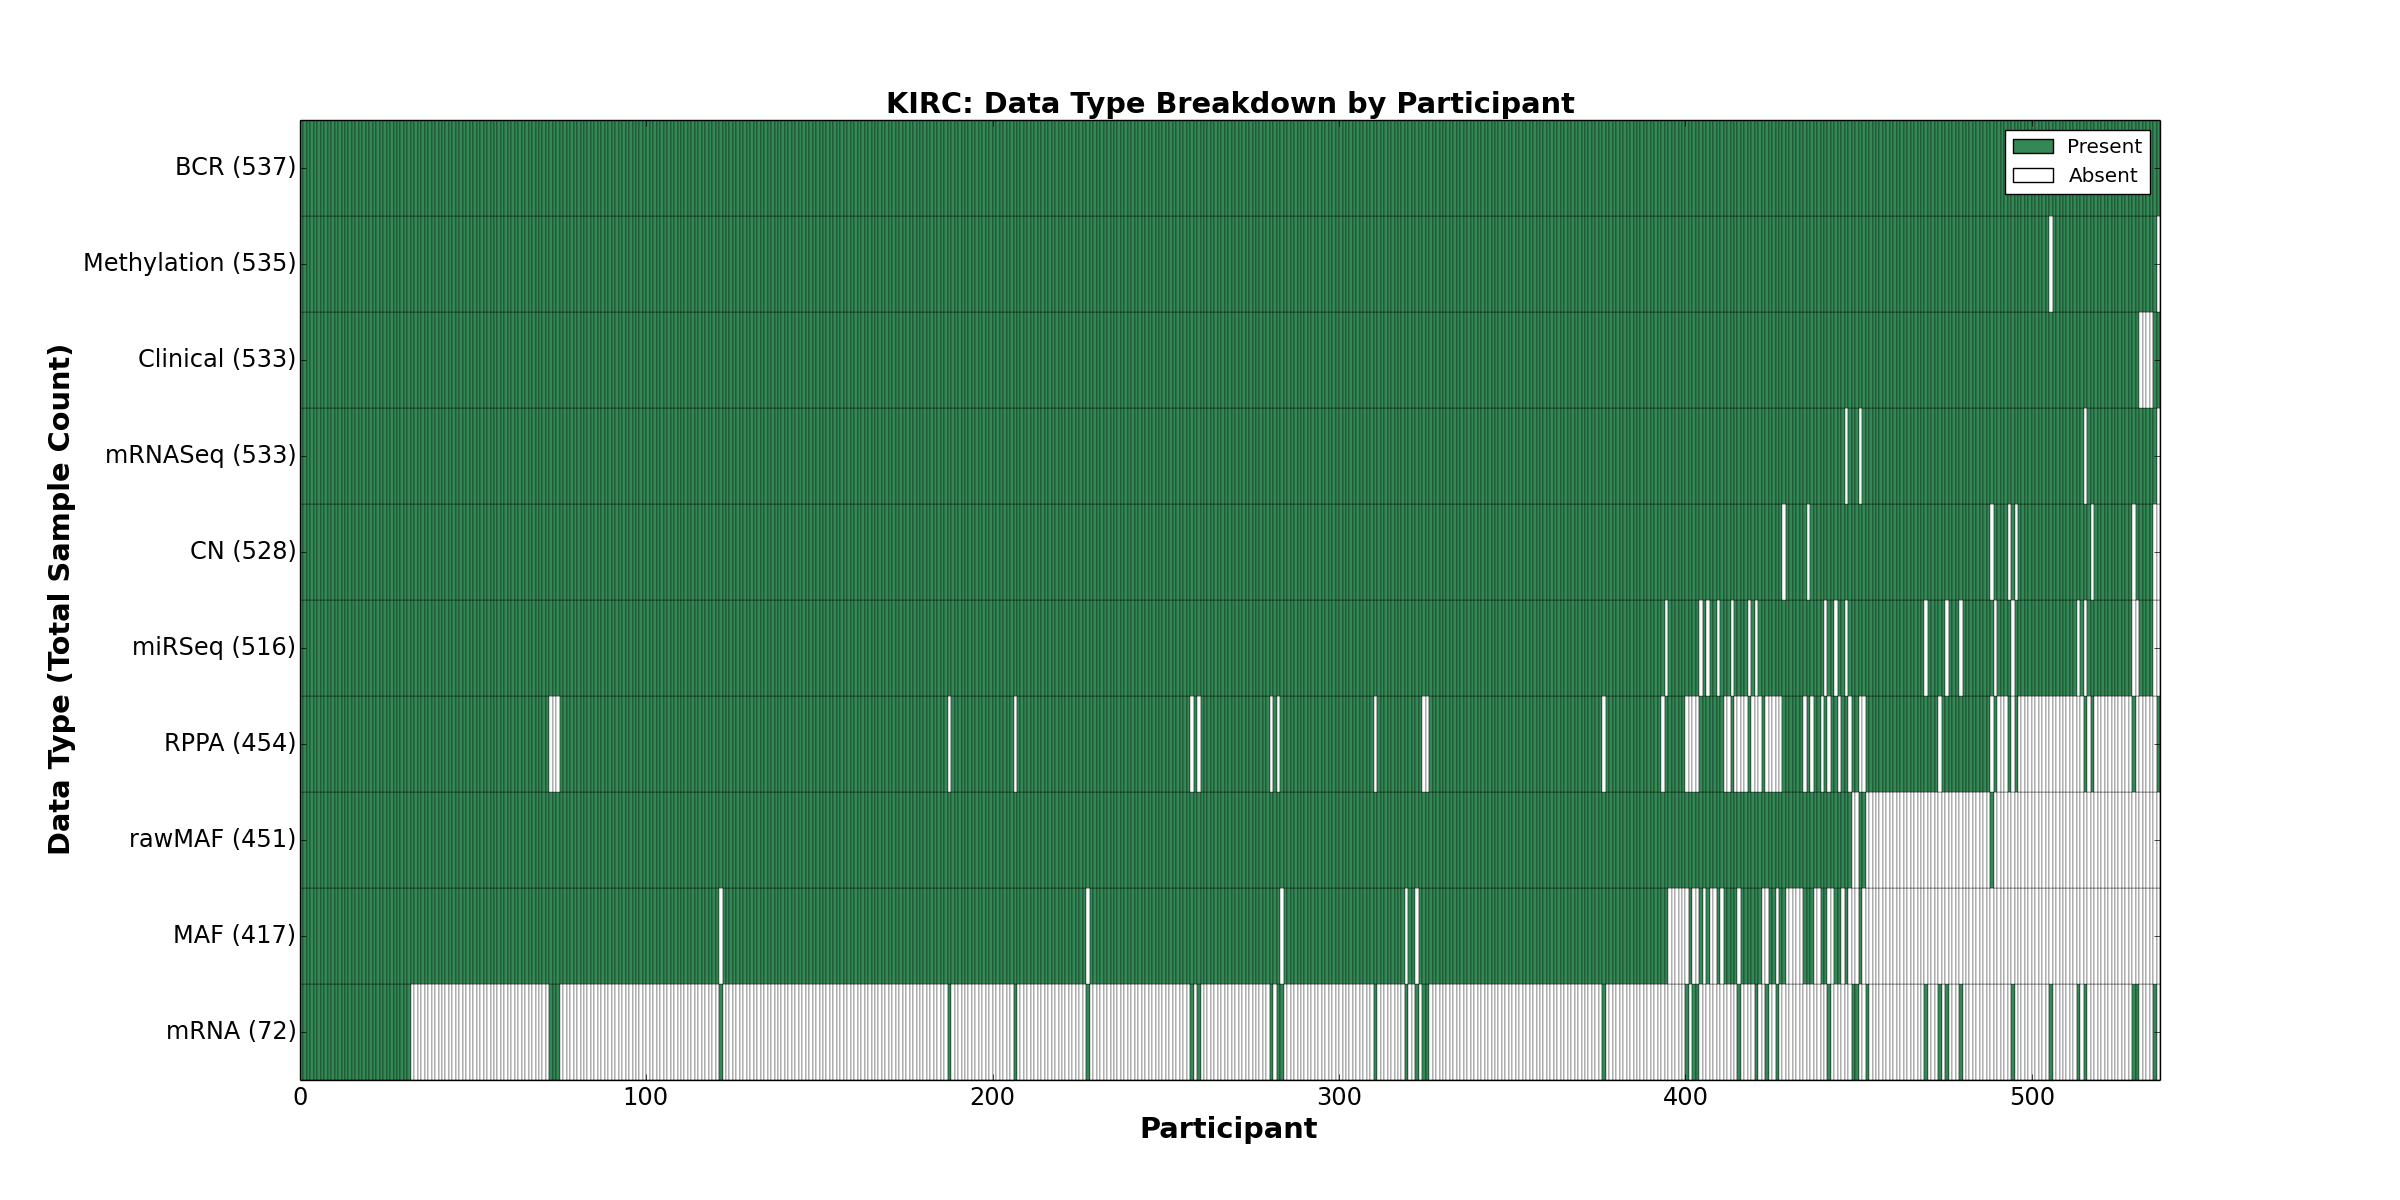
| KIRC | 537 | 533 | 528 | 0 | 535 | 72 | 533 | 0 | 516 | 454 | 417 | 451 |
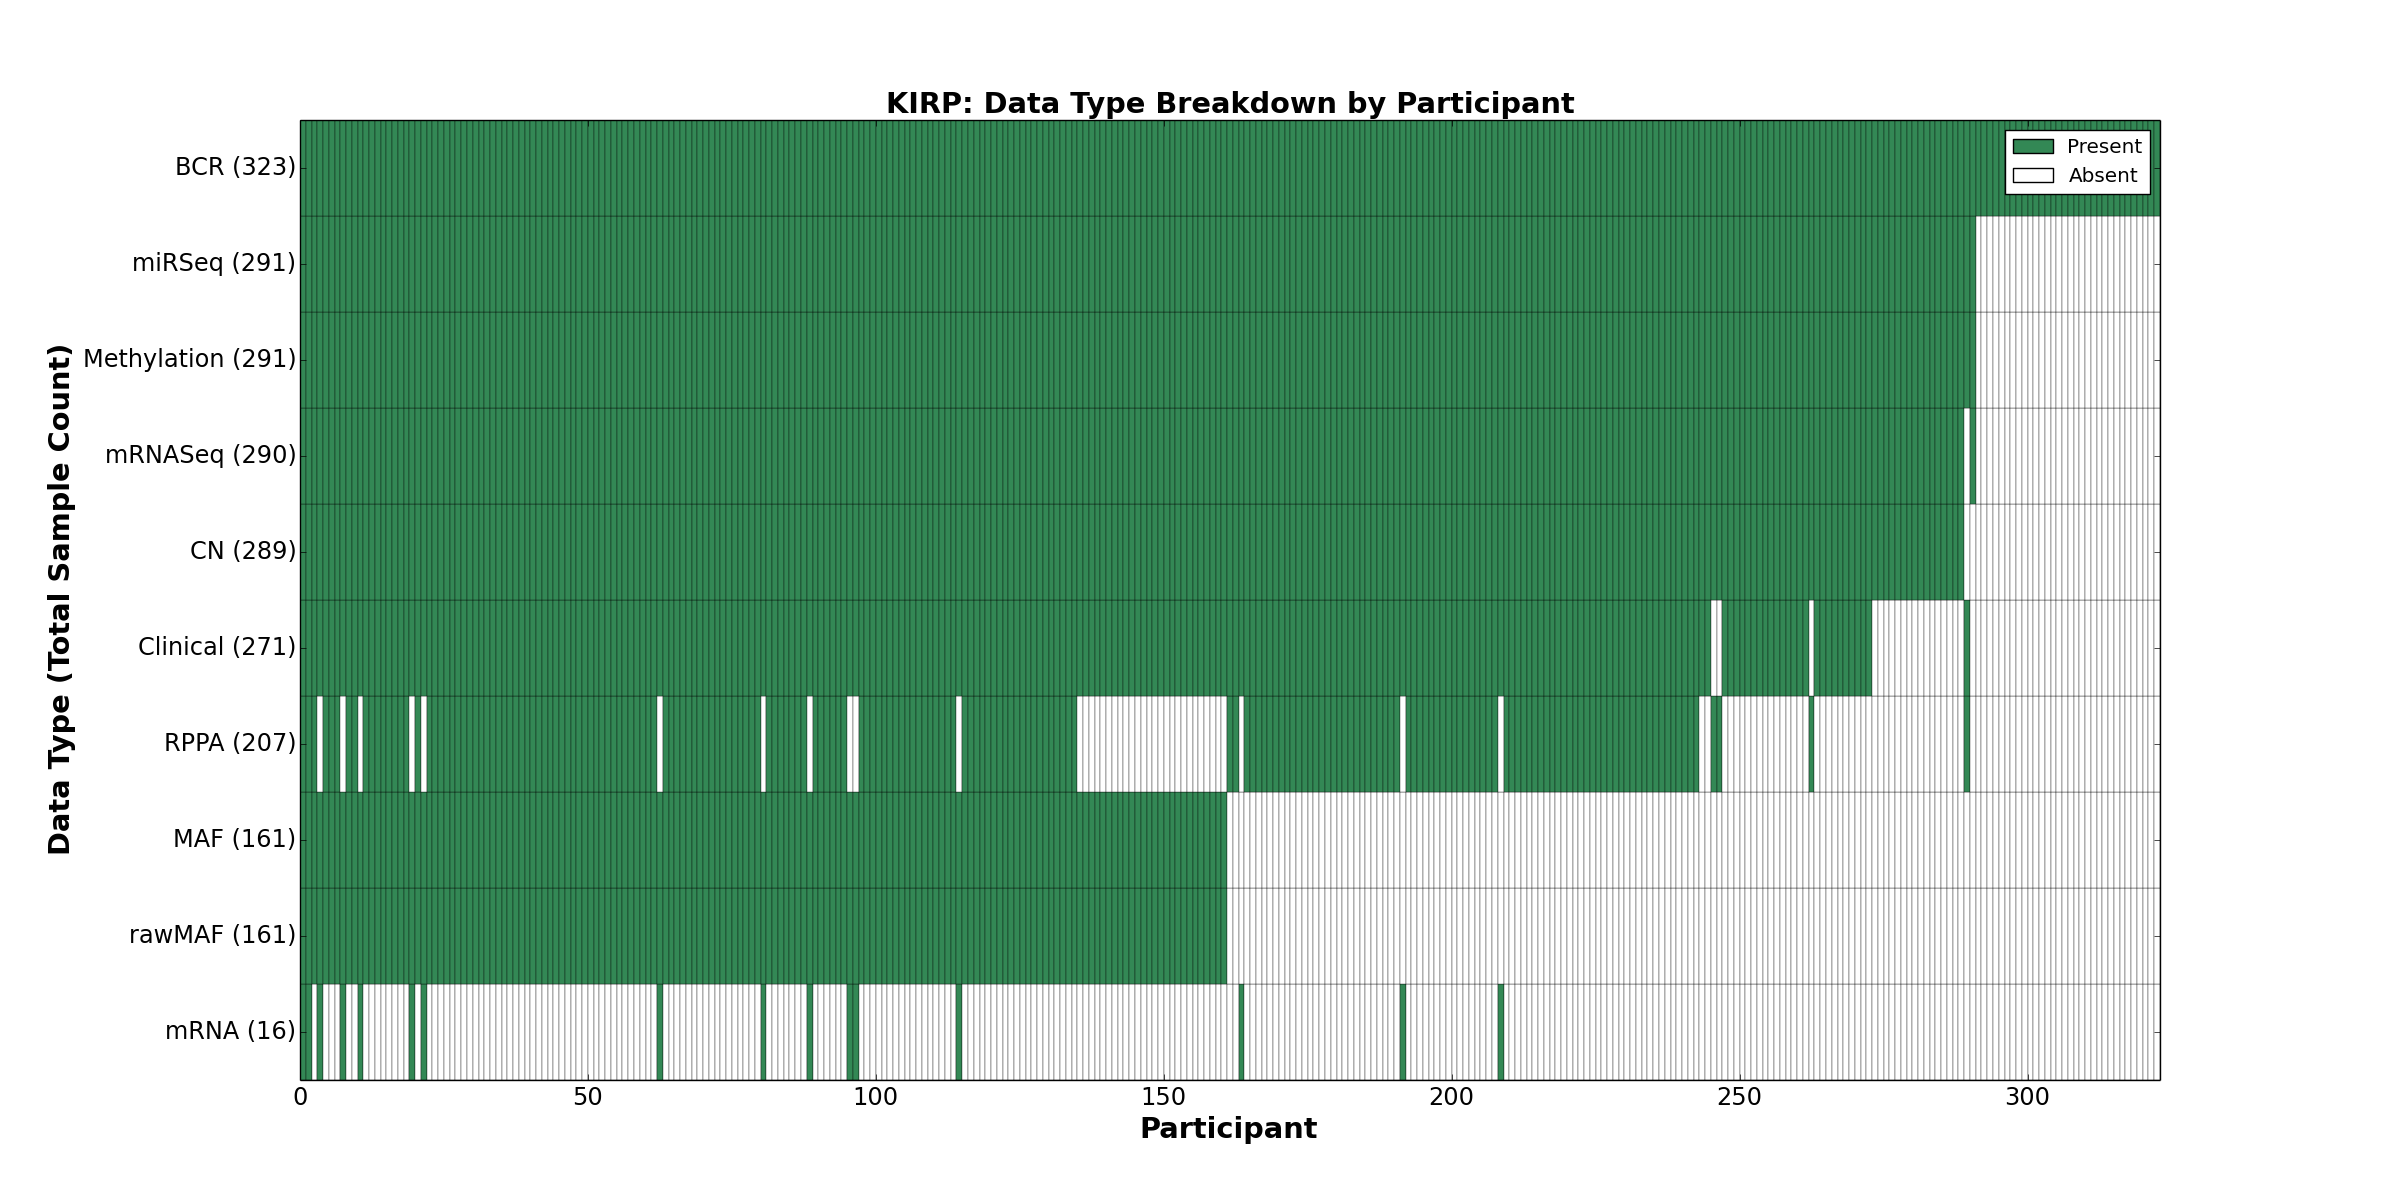
| KIRP | 323 | 271 | 289 | 0 | 291 | 16 | 290 | 0 | 291 | 207 | 161 | 161 |
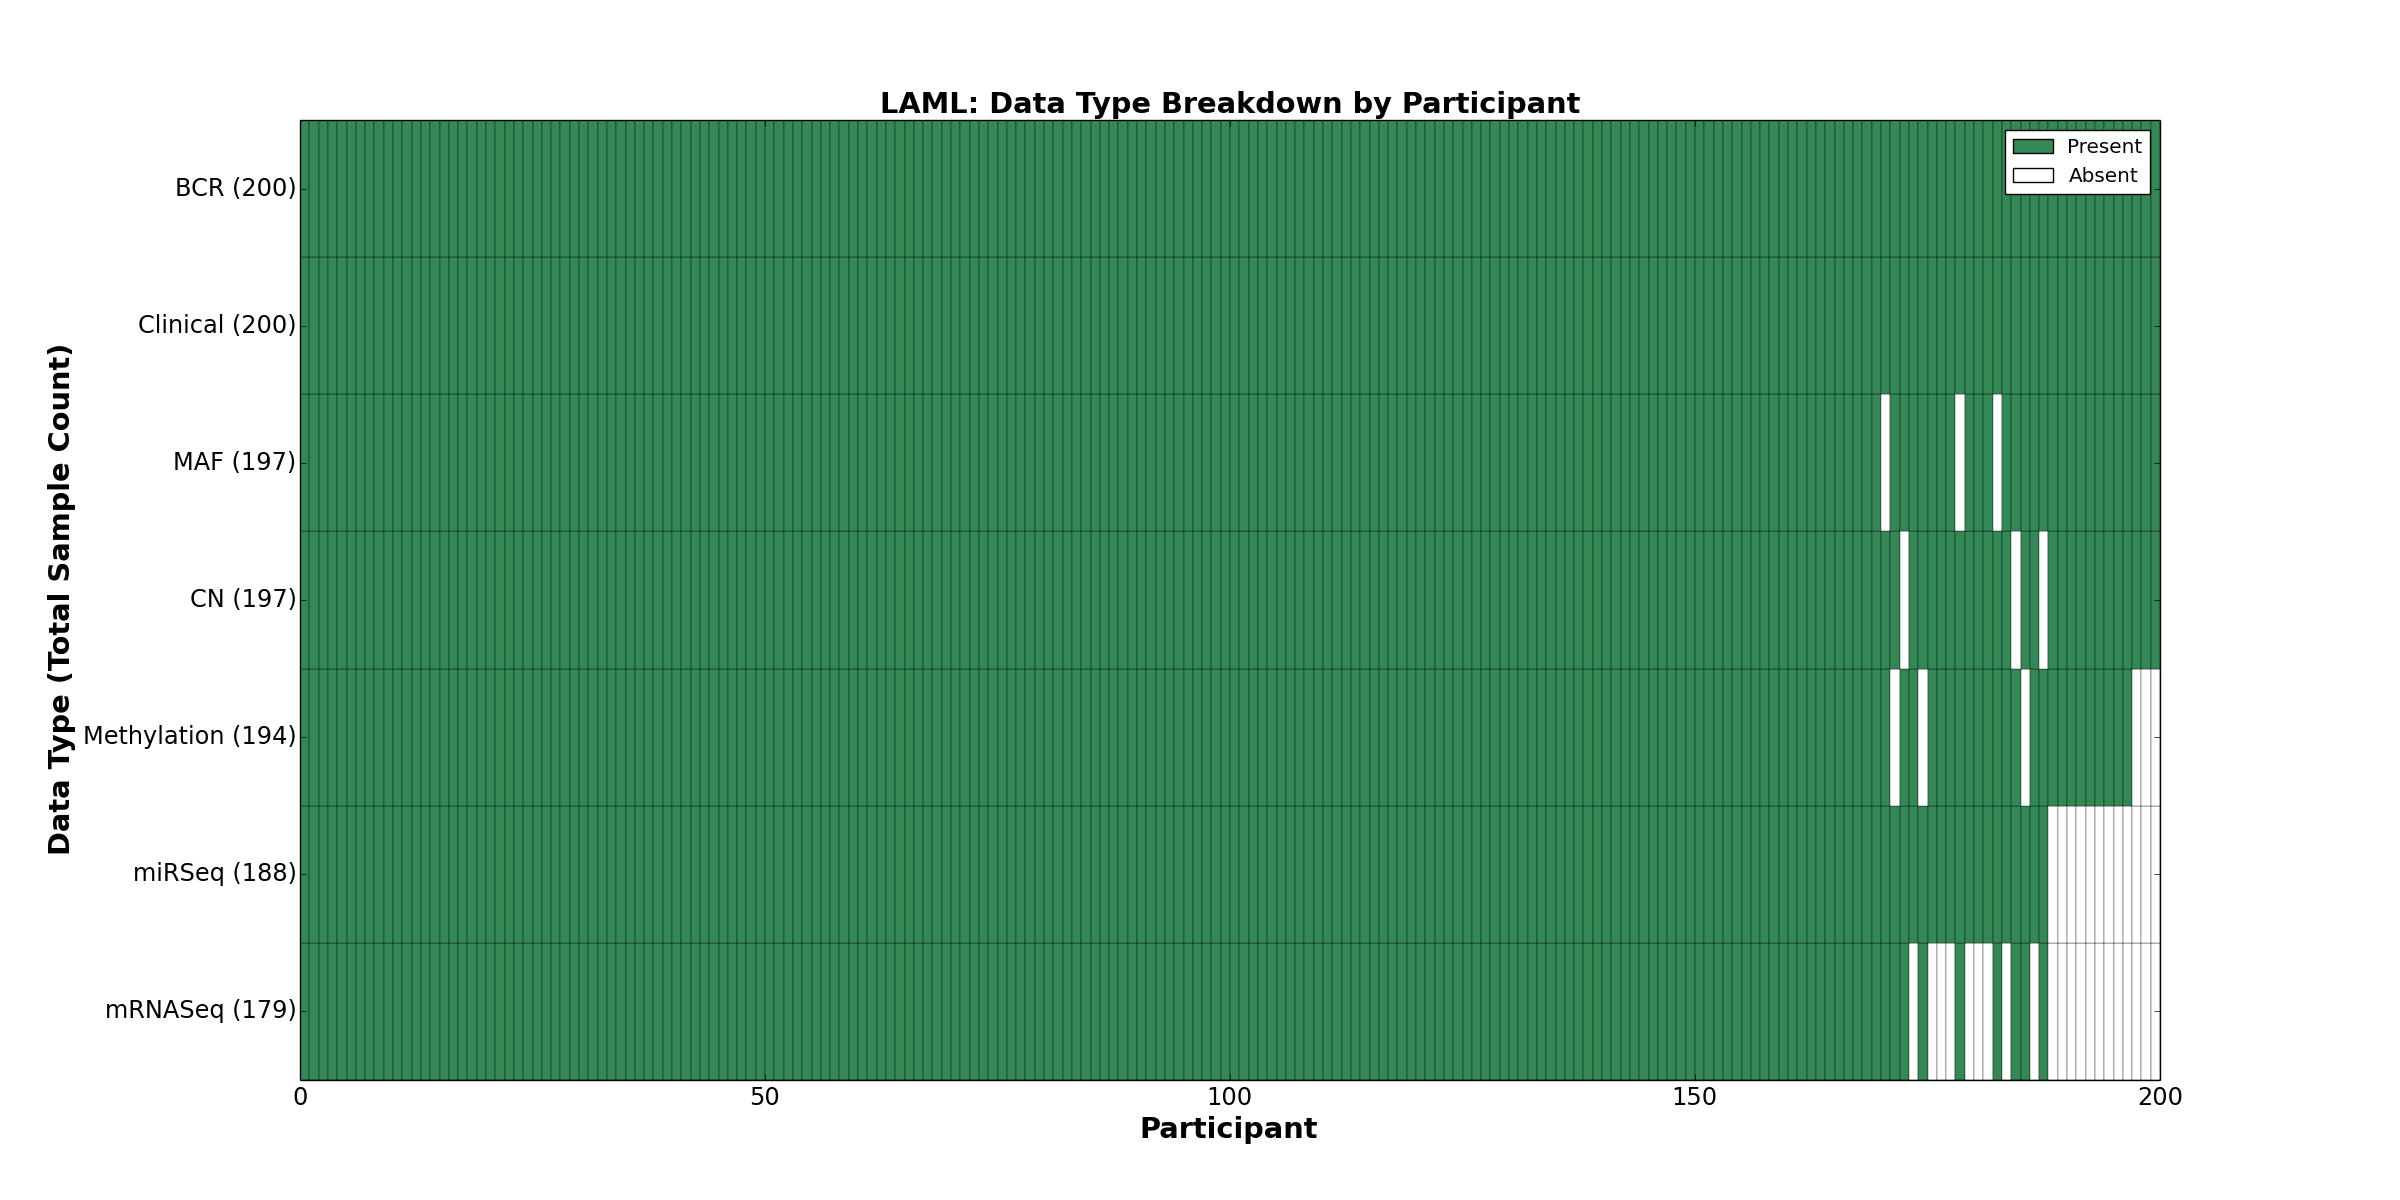
| LAML | 200 | 200 | 197 | 0 | 194 | 0 | 179 | 0 | 188 | 0 | 197 | 0 |
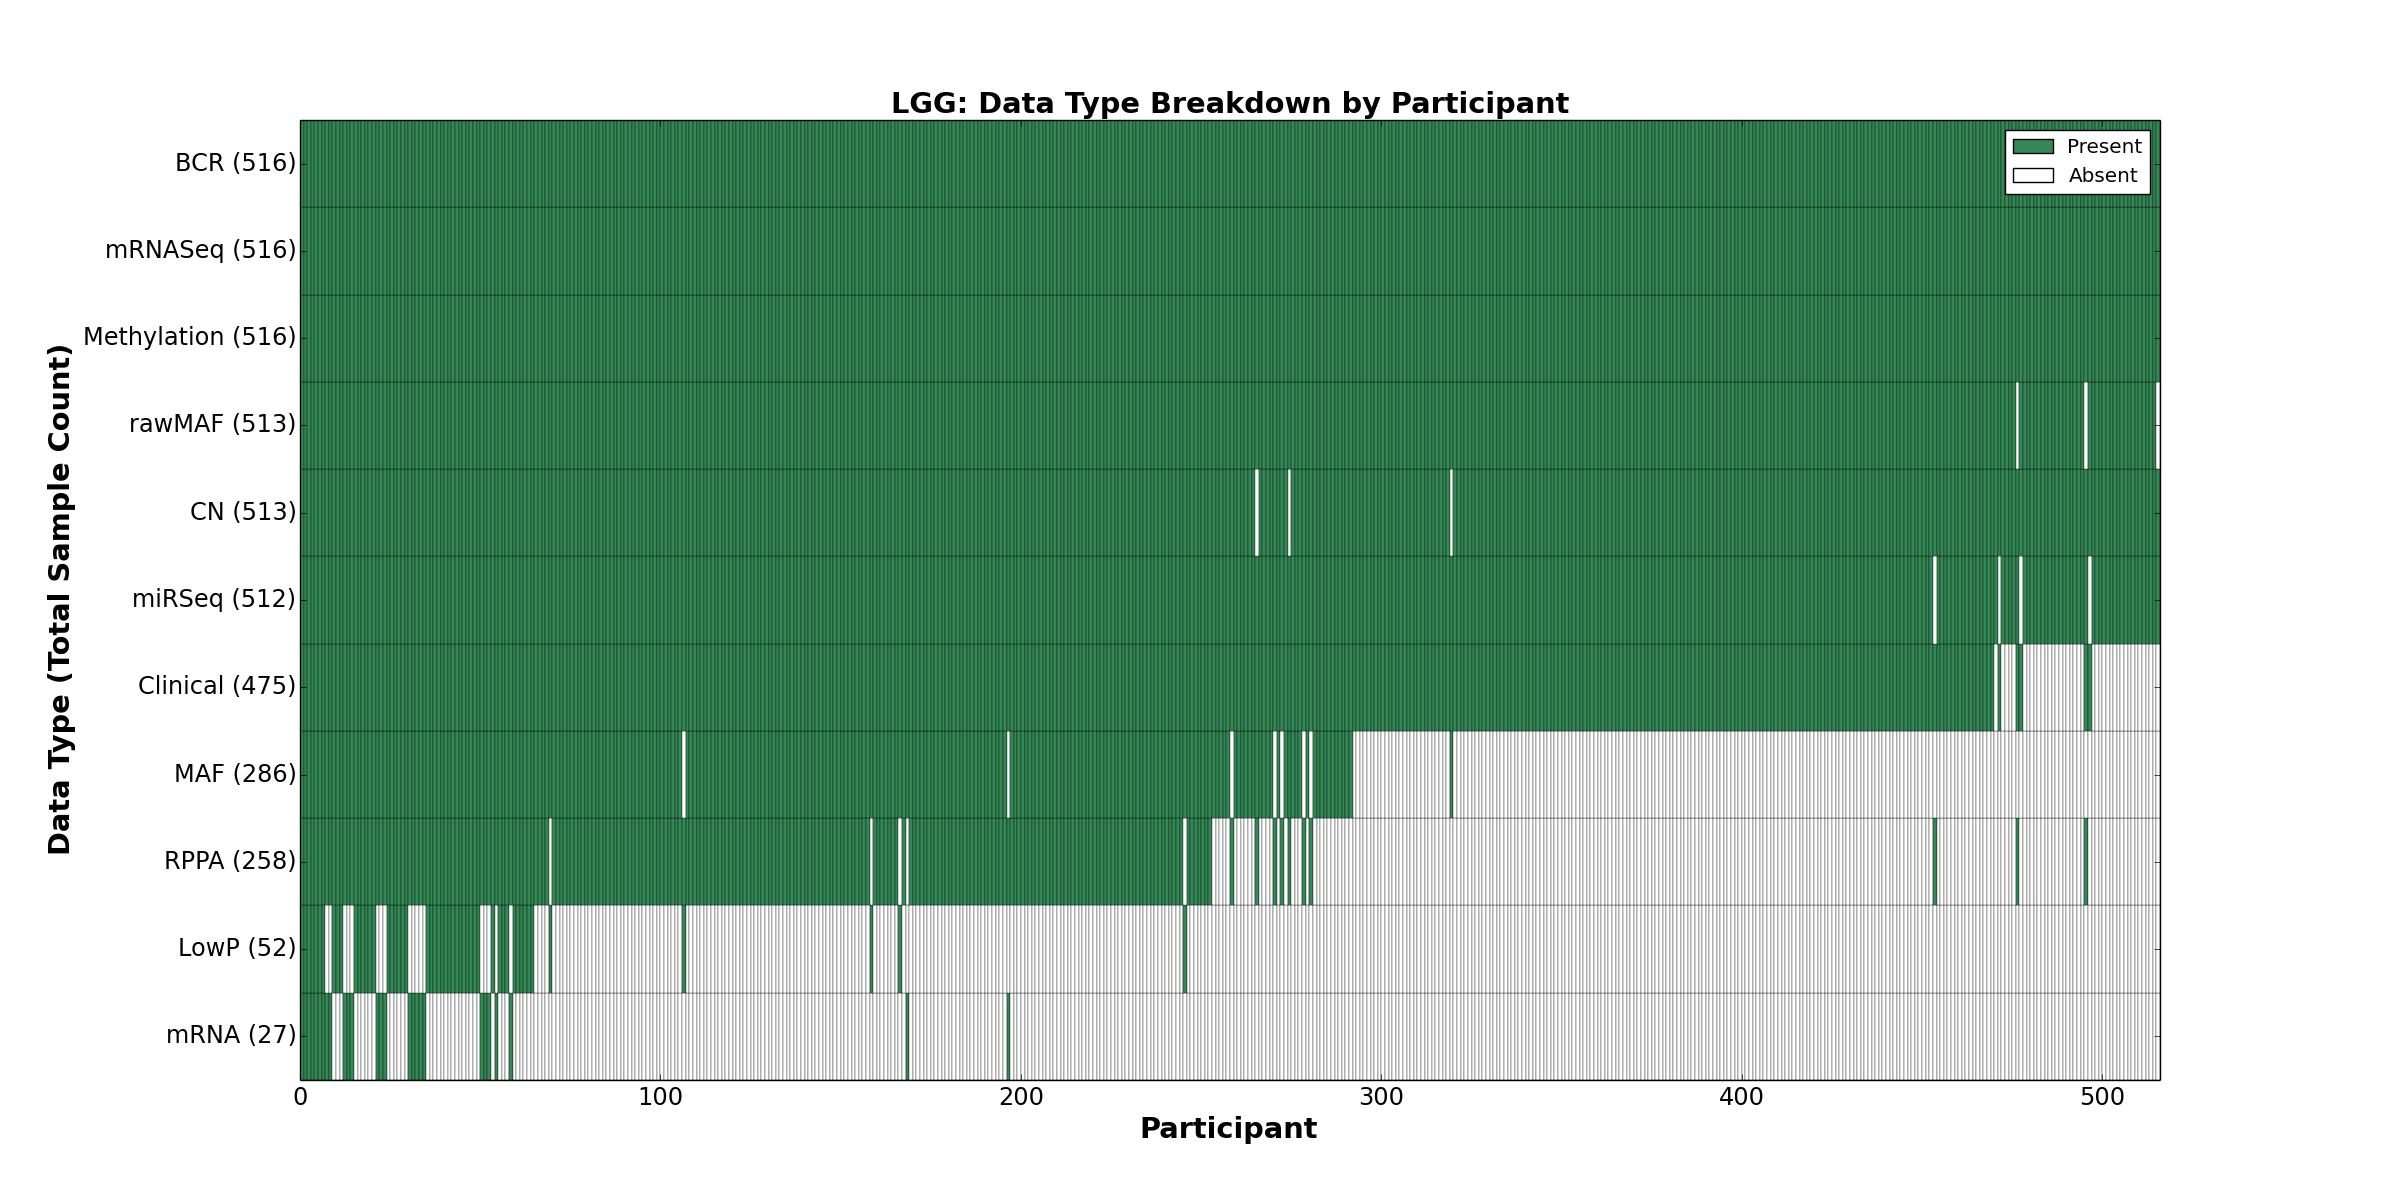
| LGG | 516 | 475 | 513 | 52 | 516 | 27 | 516 | 0 | 512 | 258 | 286 | 513 |
| LIHC | 377 | 363 | 370 | 0 | 377 | 0 | 371 | 0 | 372 | 0 | 198 | 0 |
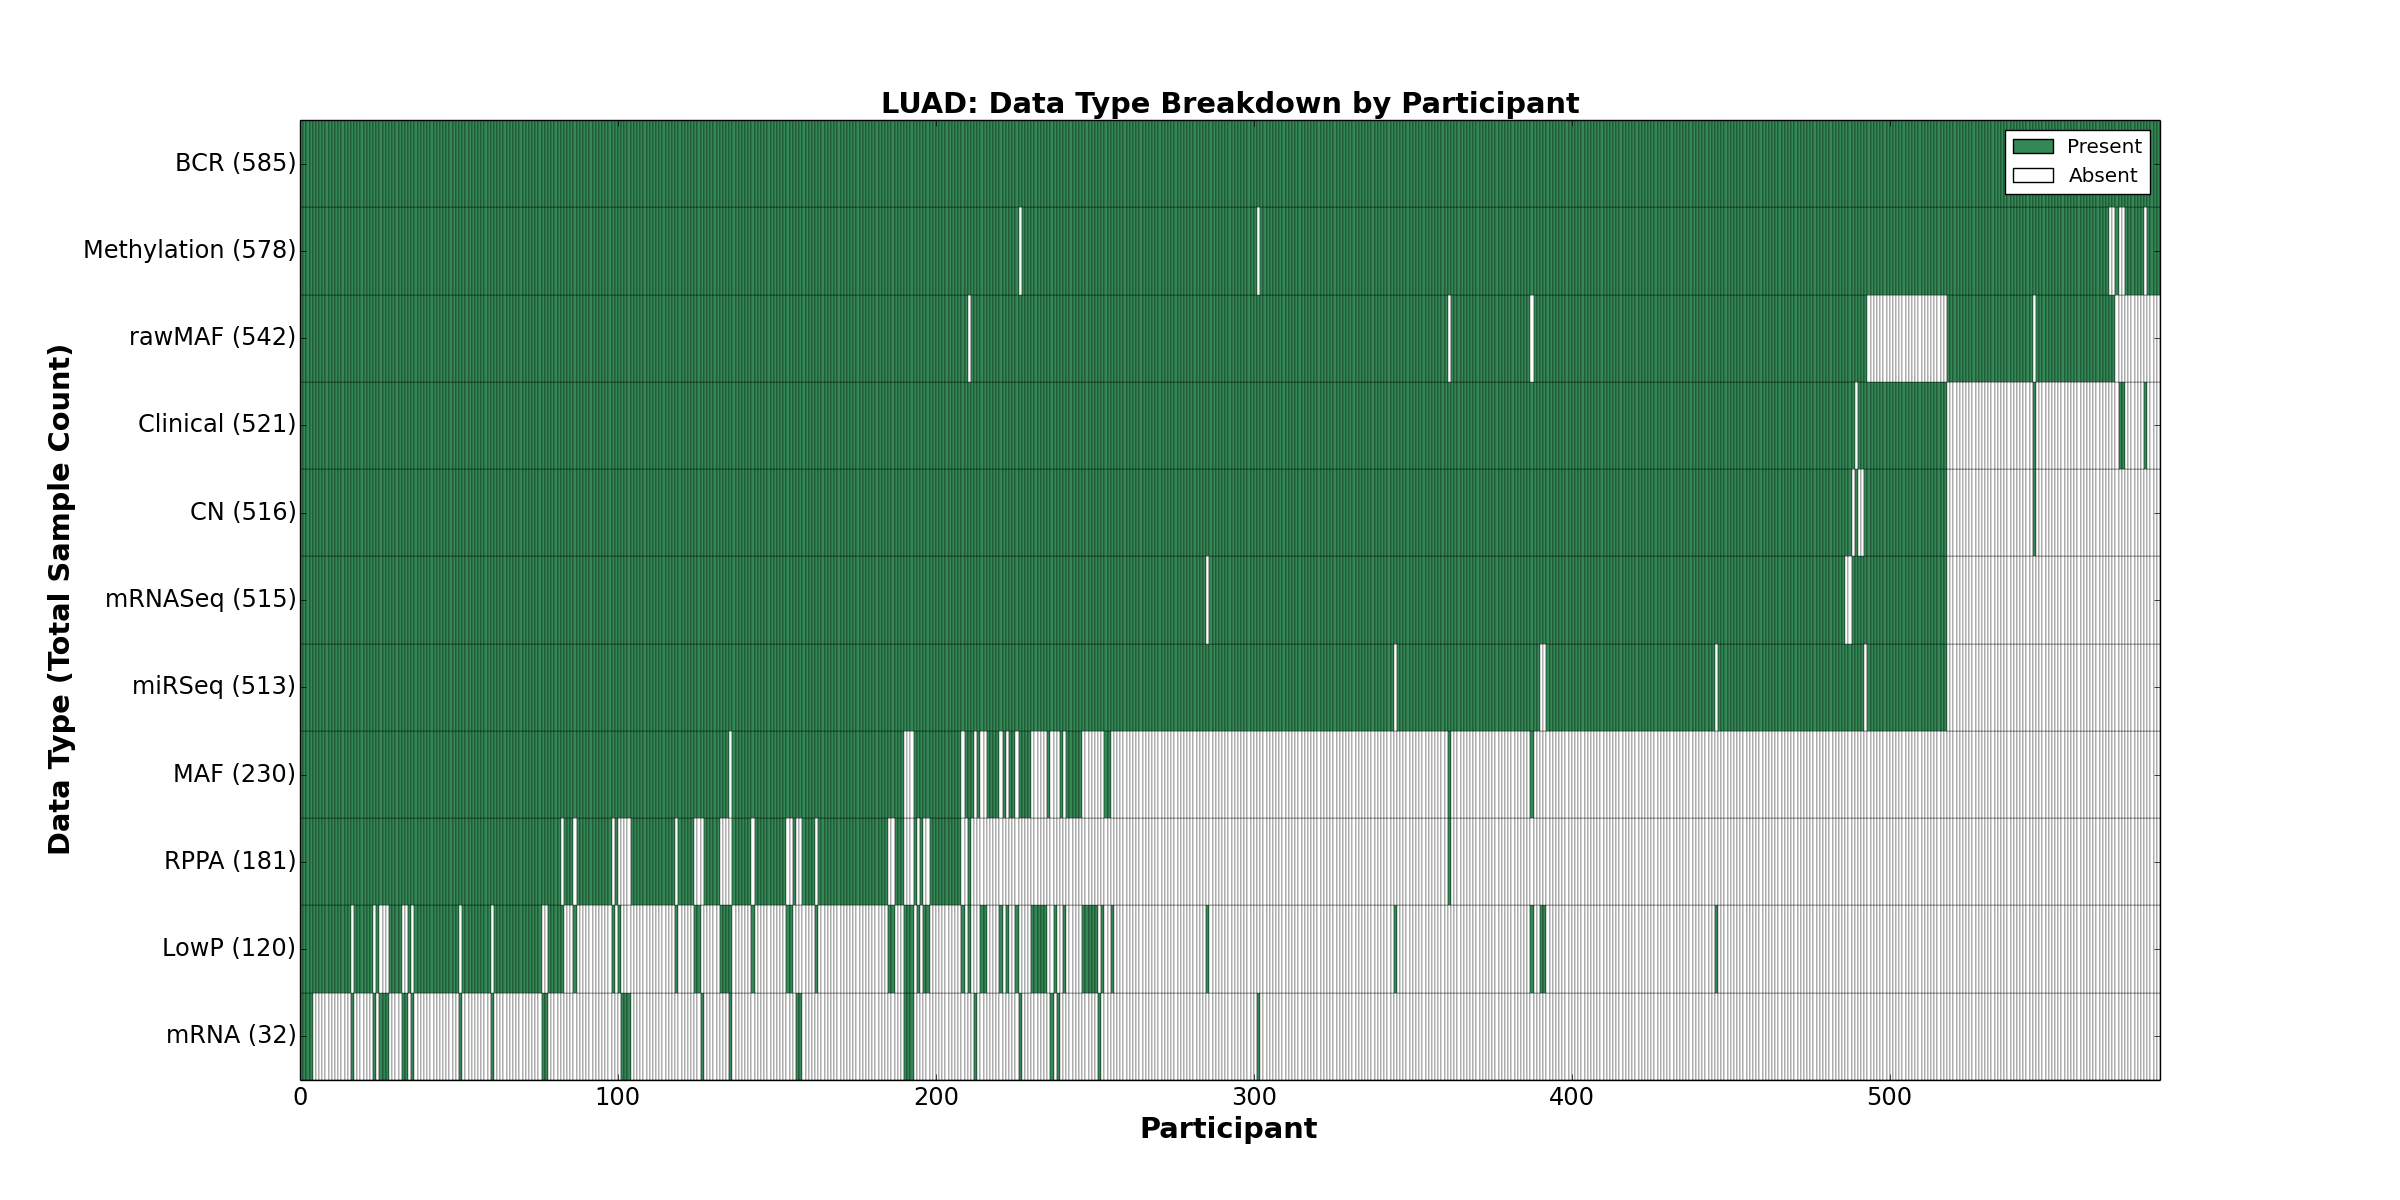
| LUAD | 585 | 521 | 516 | 120 | 578 | 32 | 515 | 0 | 513 | 181 | 230 | 542 |
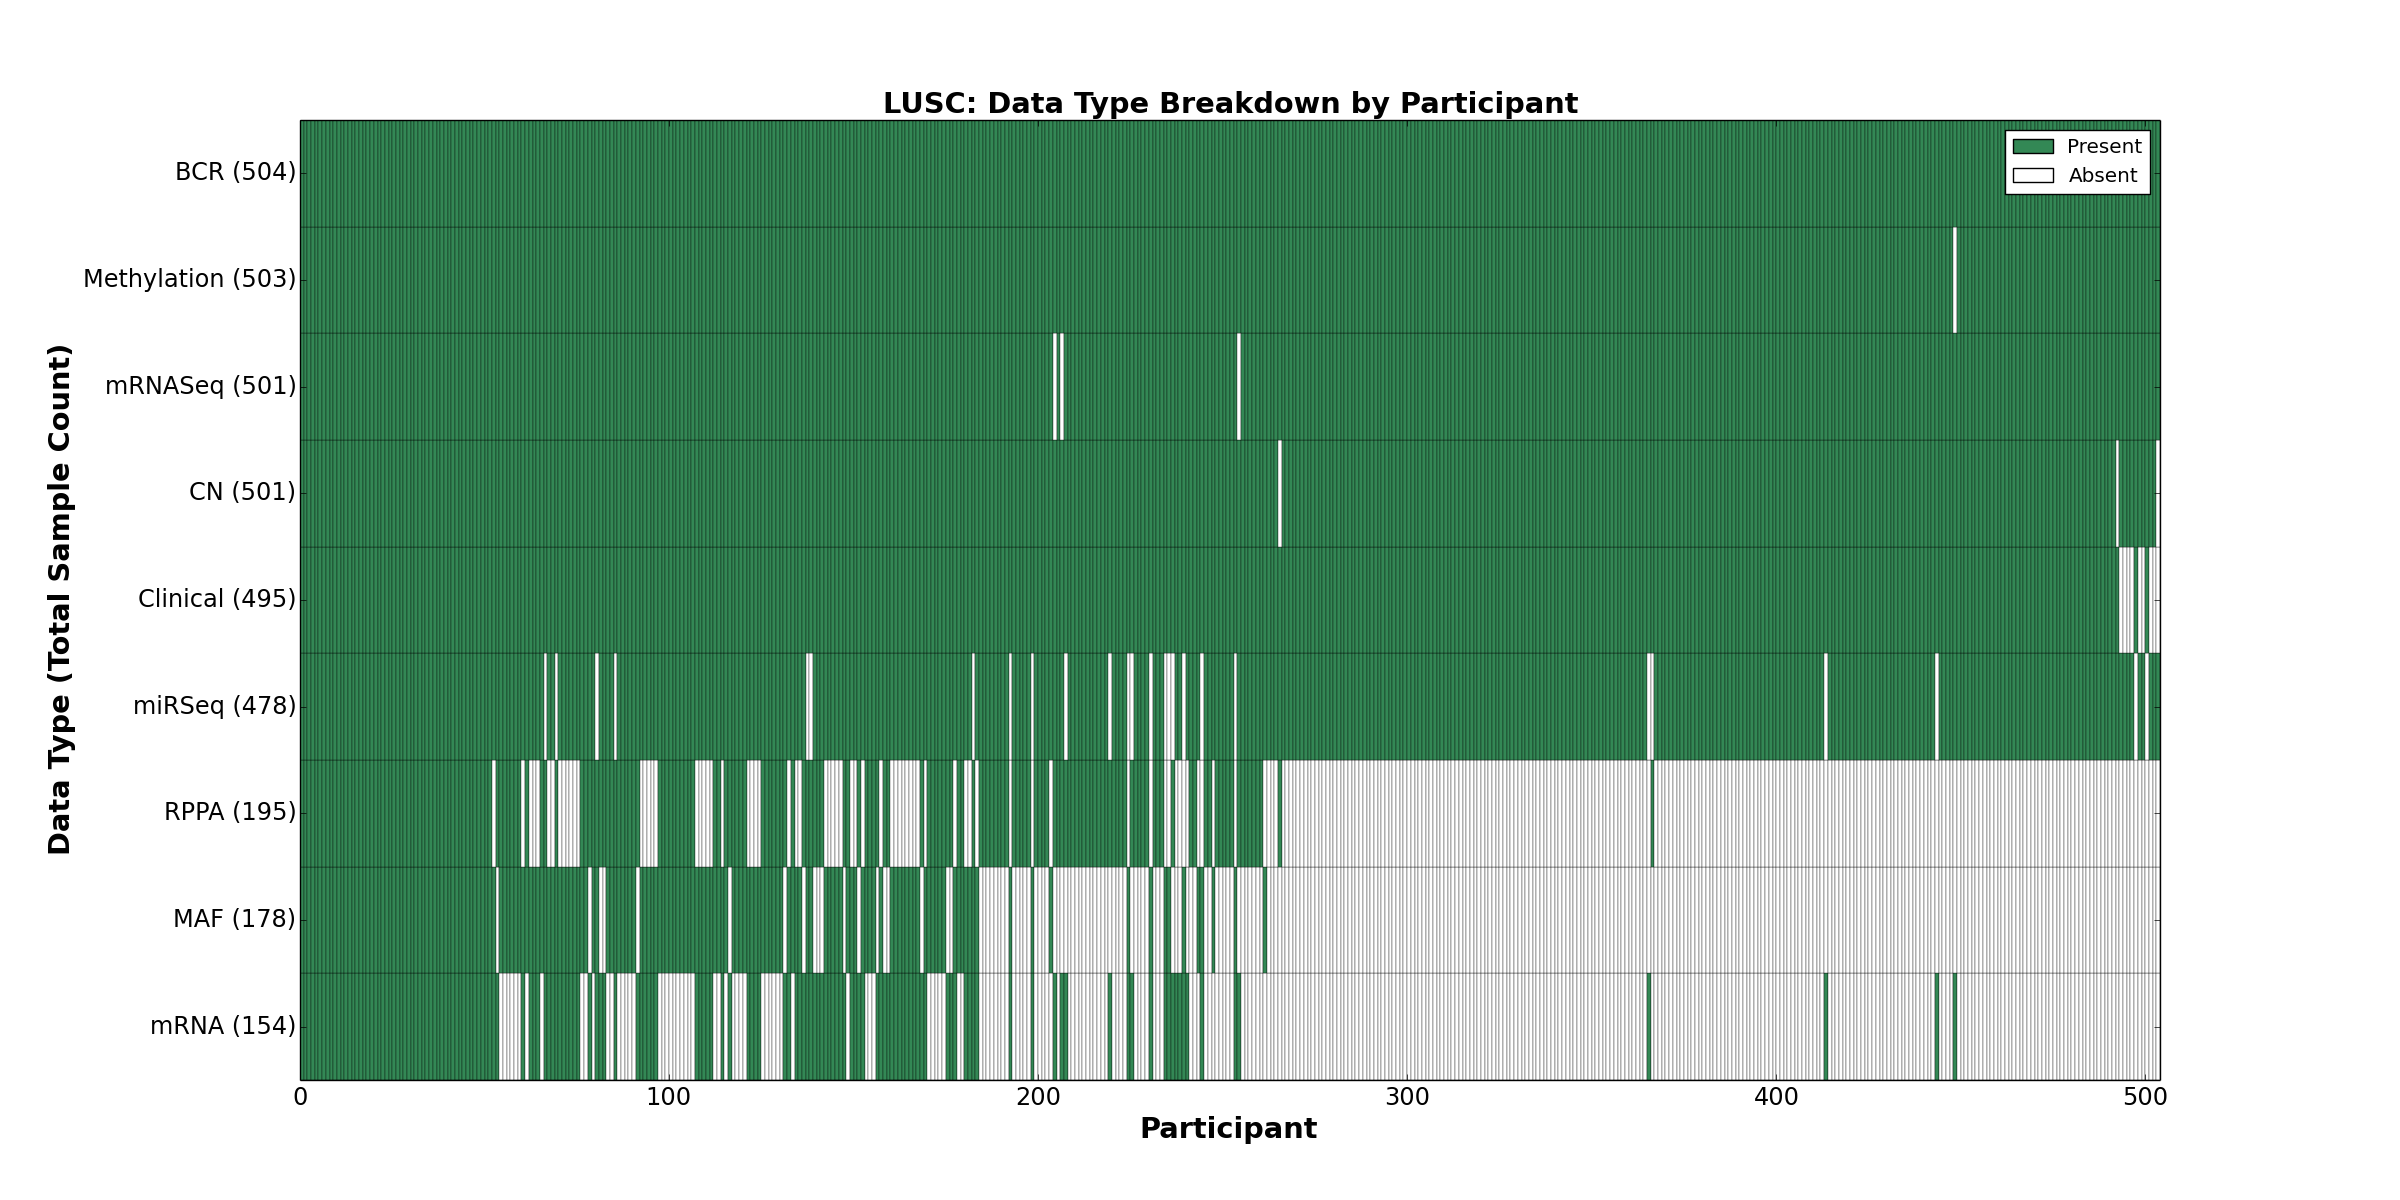
| LUSC | 504 | 495 | 501 | 0 | 503 | 154 | 501 | 0 | 478 | 195 | 178 | 0 |
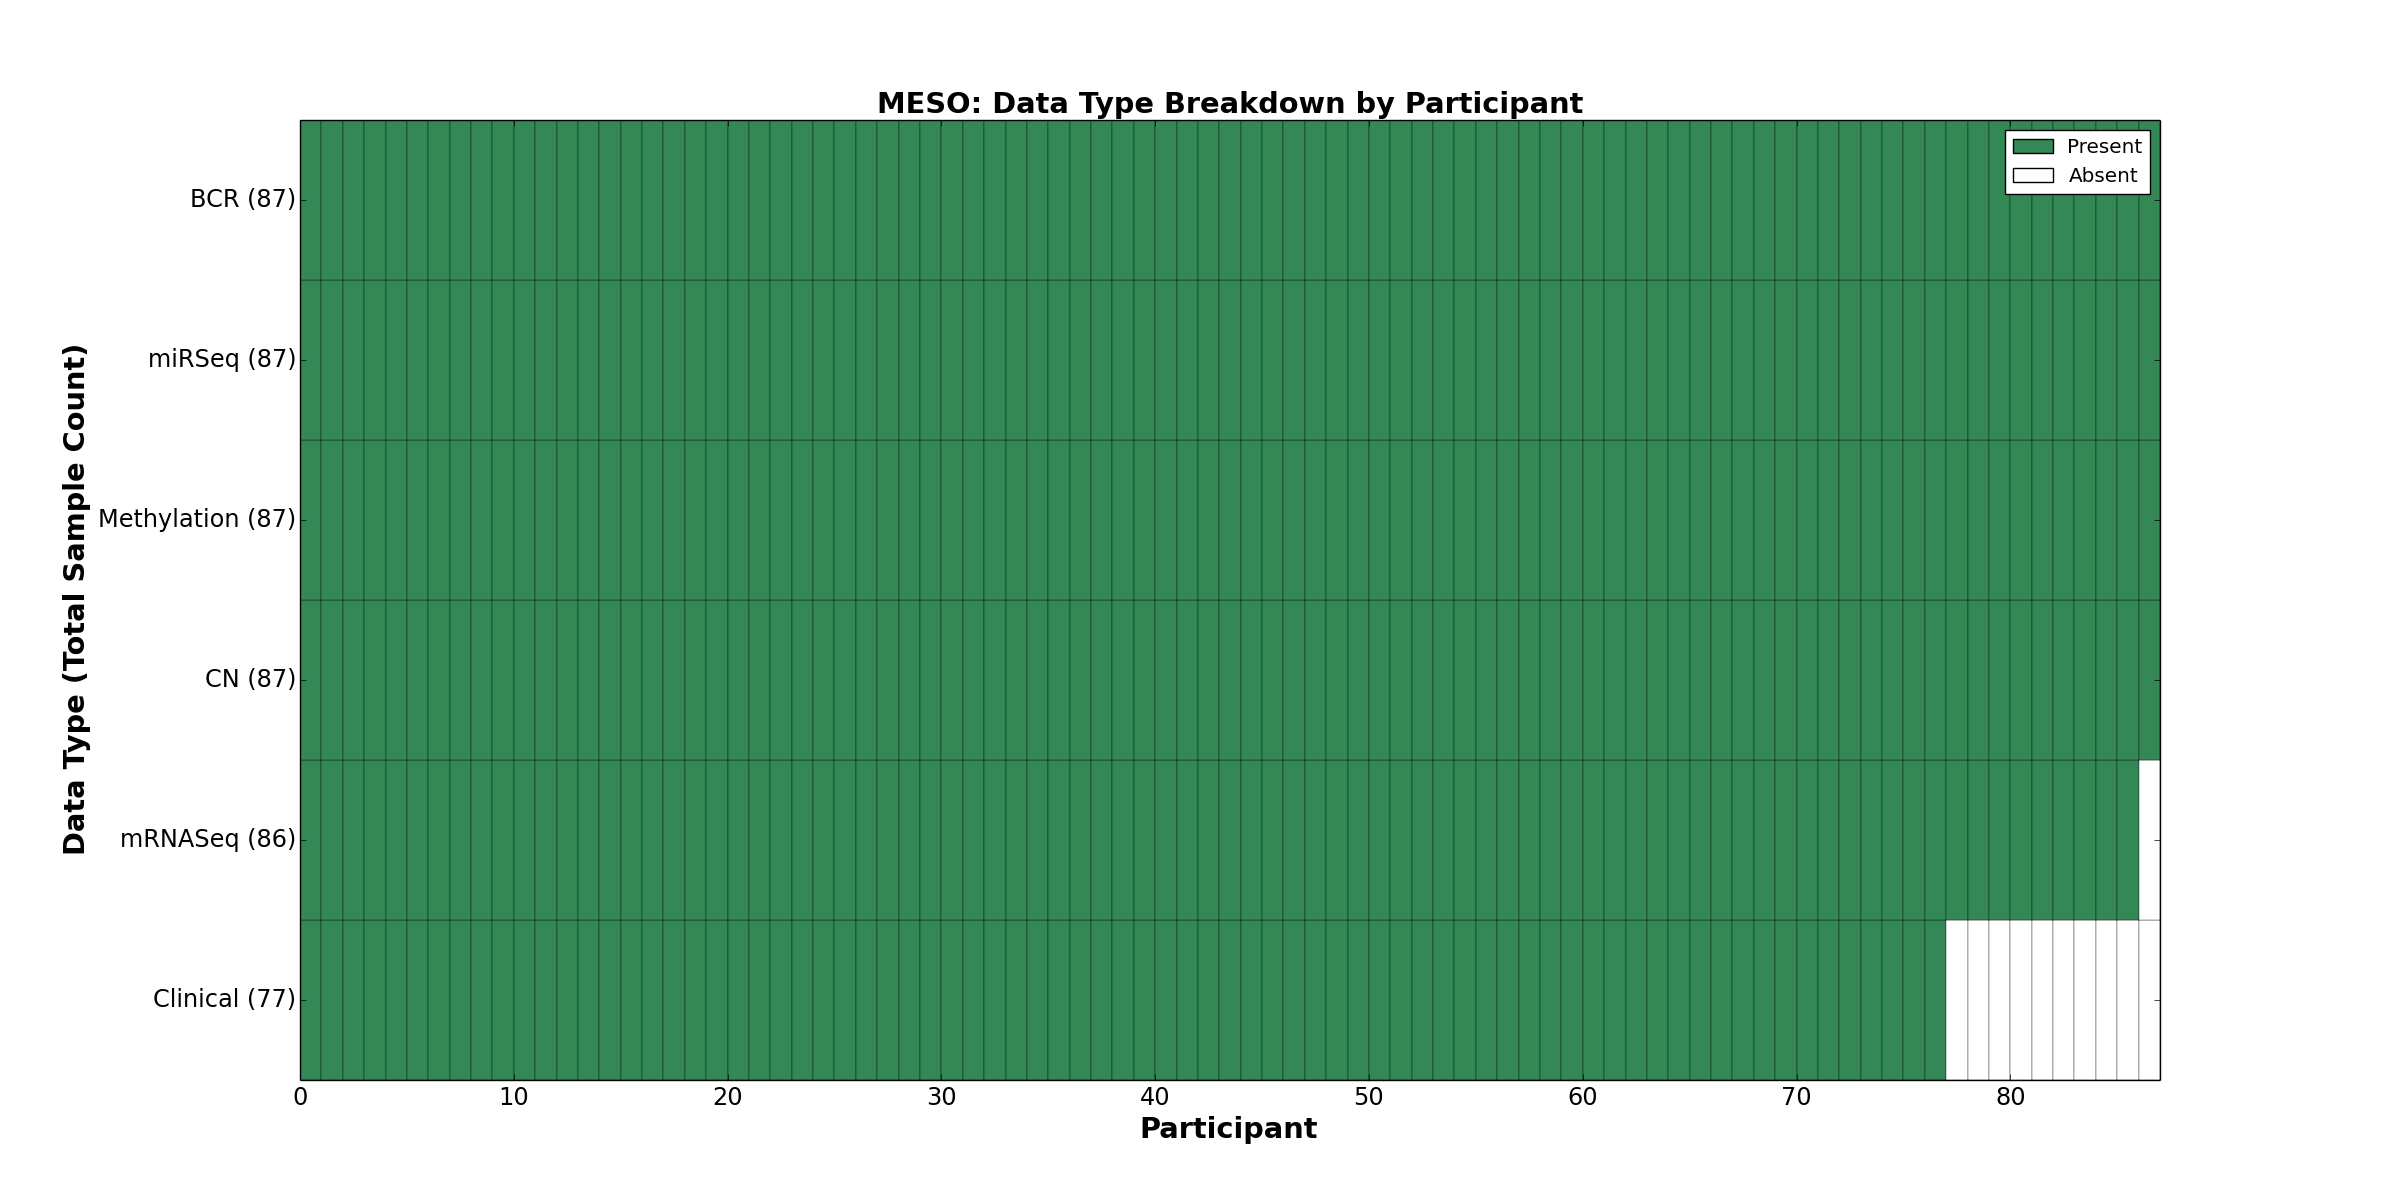
| MESO | 87 | 77 | 87 | 0 | 87 | 0 | 86 | 0 | 87 | 0 | 0 | 0 |
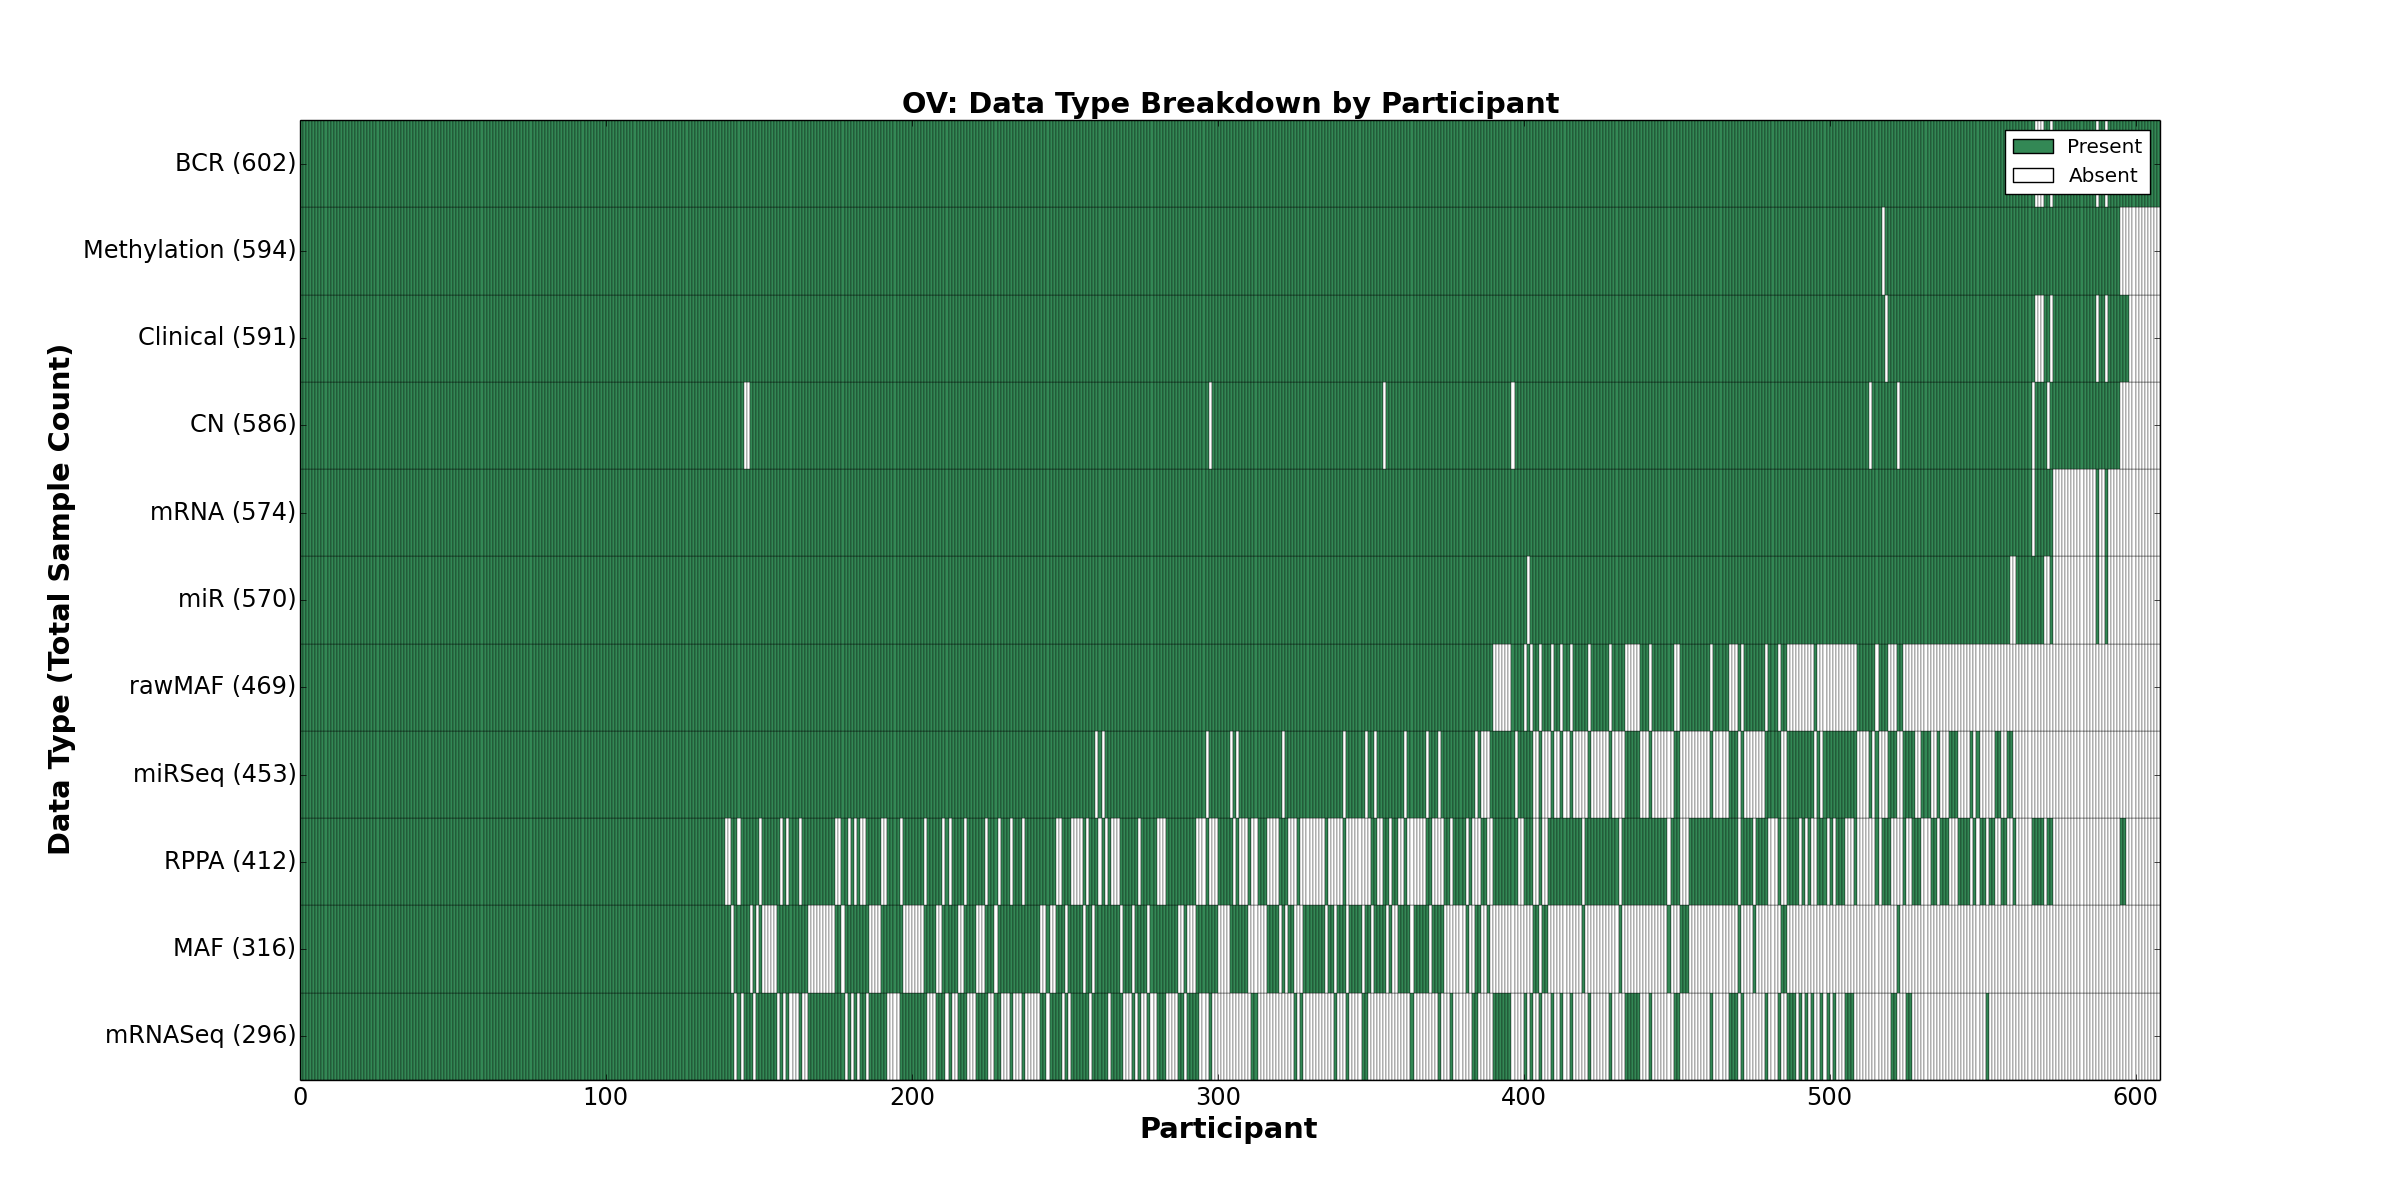
| OV | 602 | 591 | 586 | 0 | 594 | 574 | 296 | 570 | 453 | 412 | 316 | 469 |
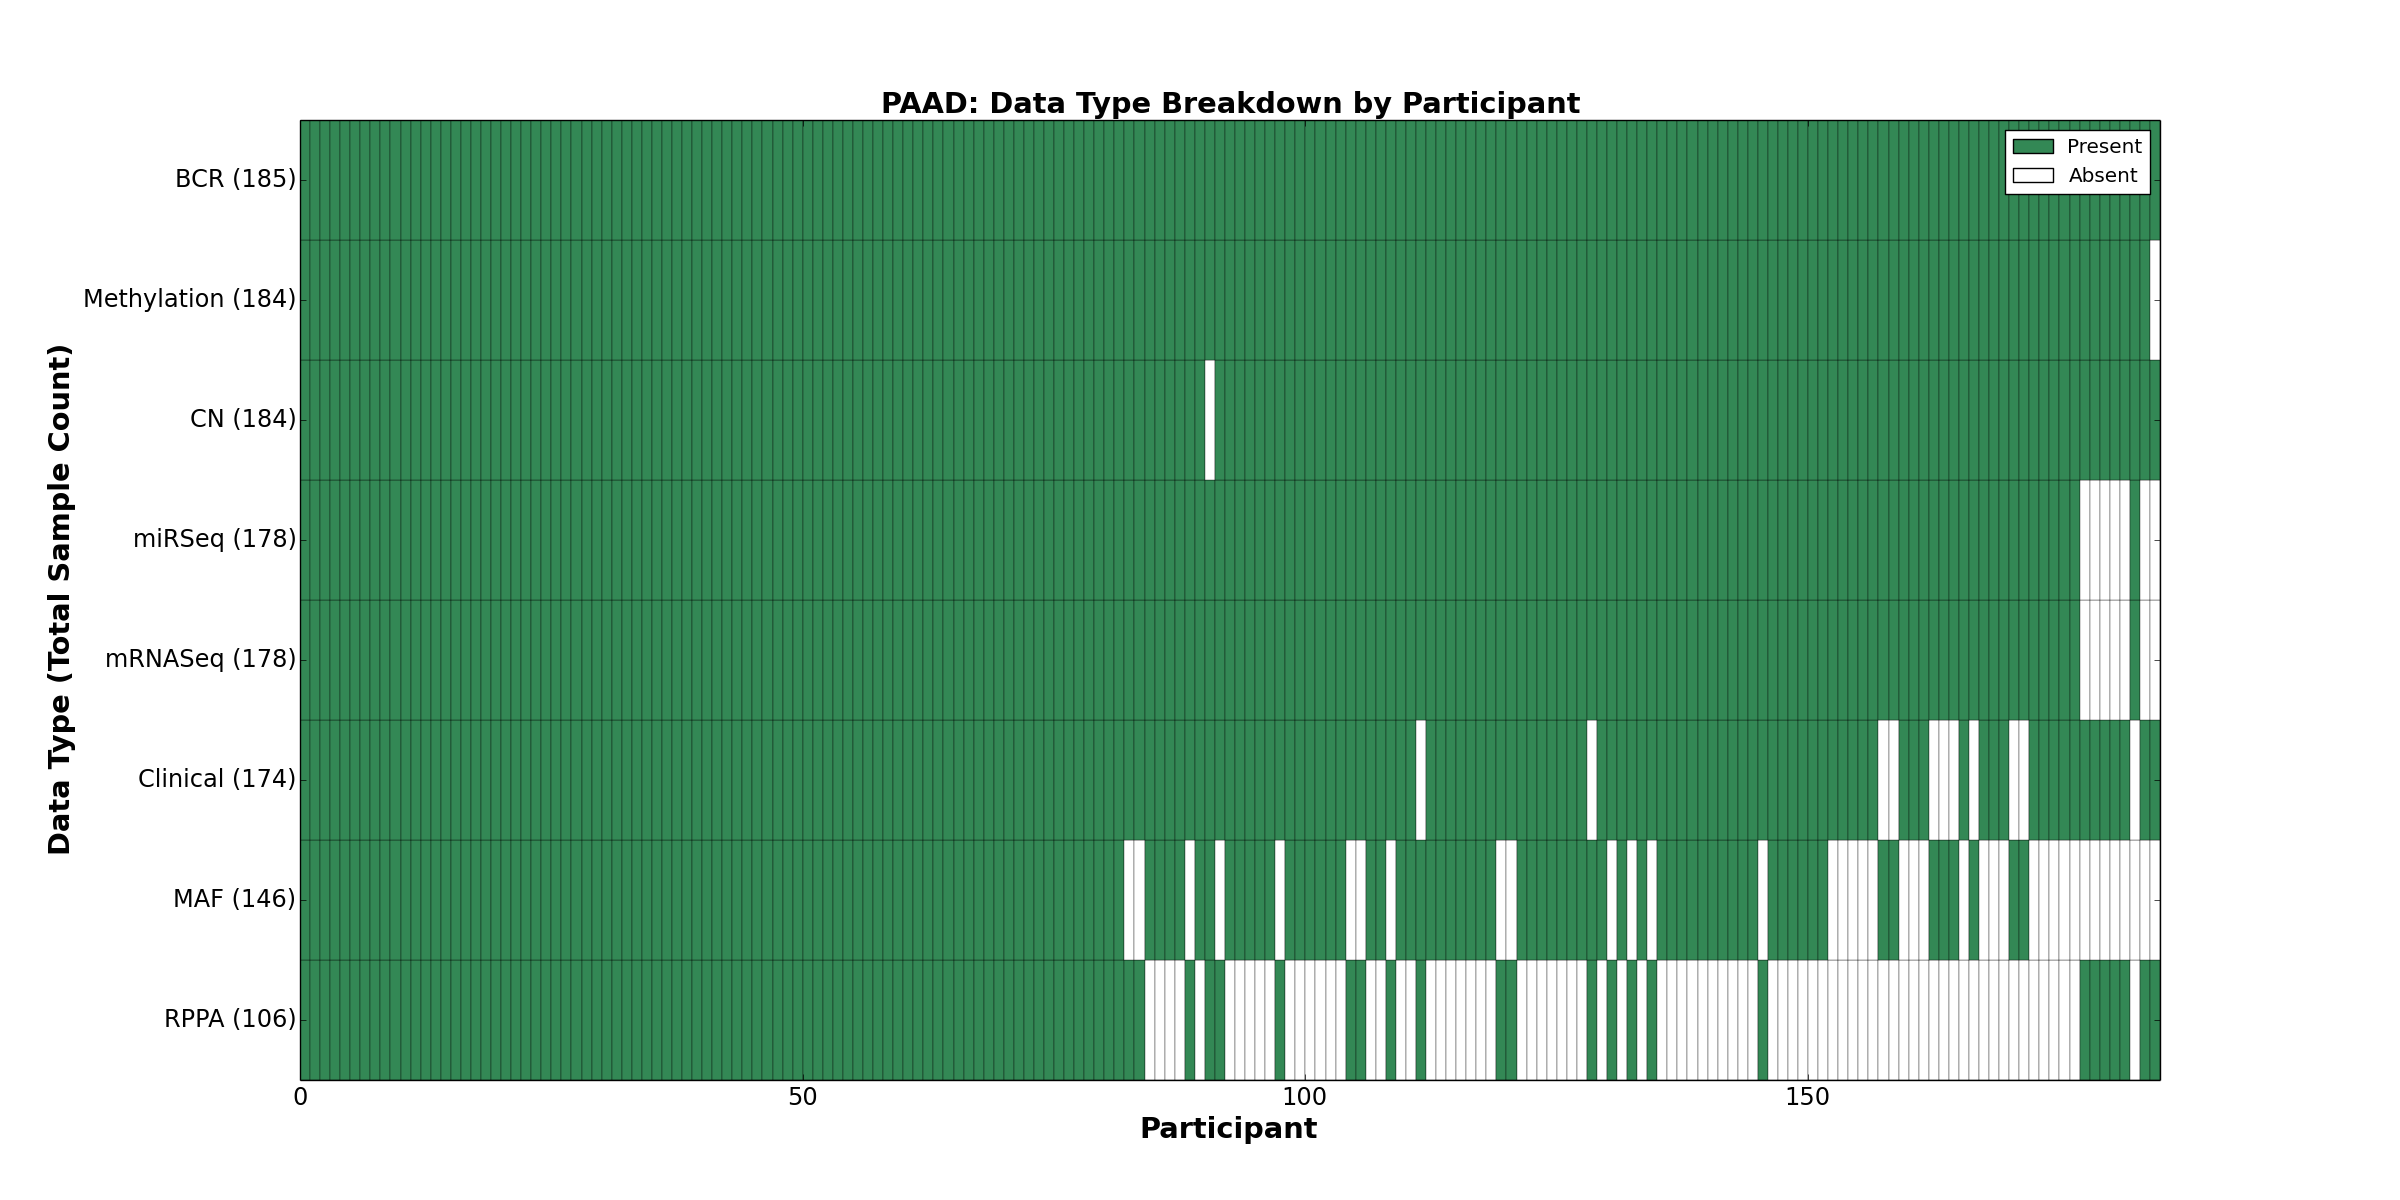
| PAAD | 185 | 174 | 184 | 0 | 184 | 0 | 178 | 0 | 178 | 106 | 146 | 0 |
| PCPG | 179 | 179 | 175 | 0 | 179 | 0 | 179 | 0 | 179 | 80 | 178 | 0 |
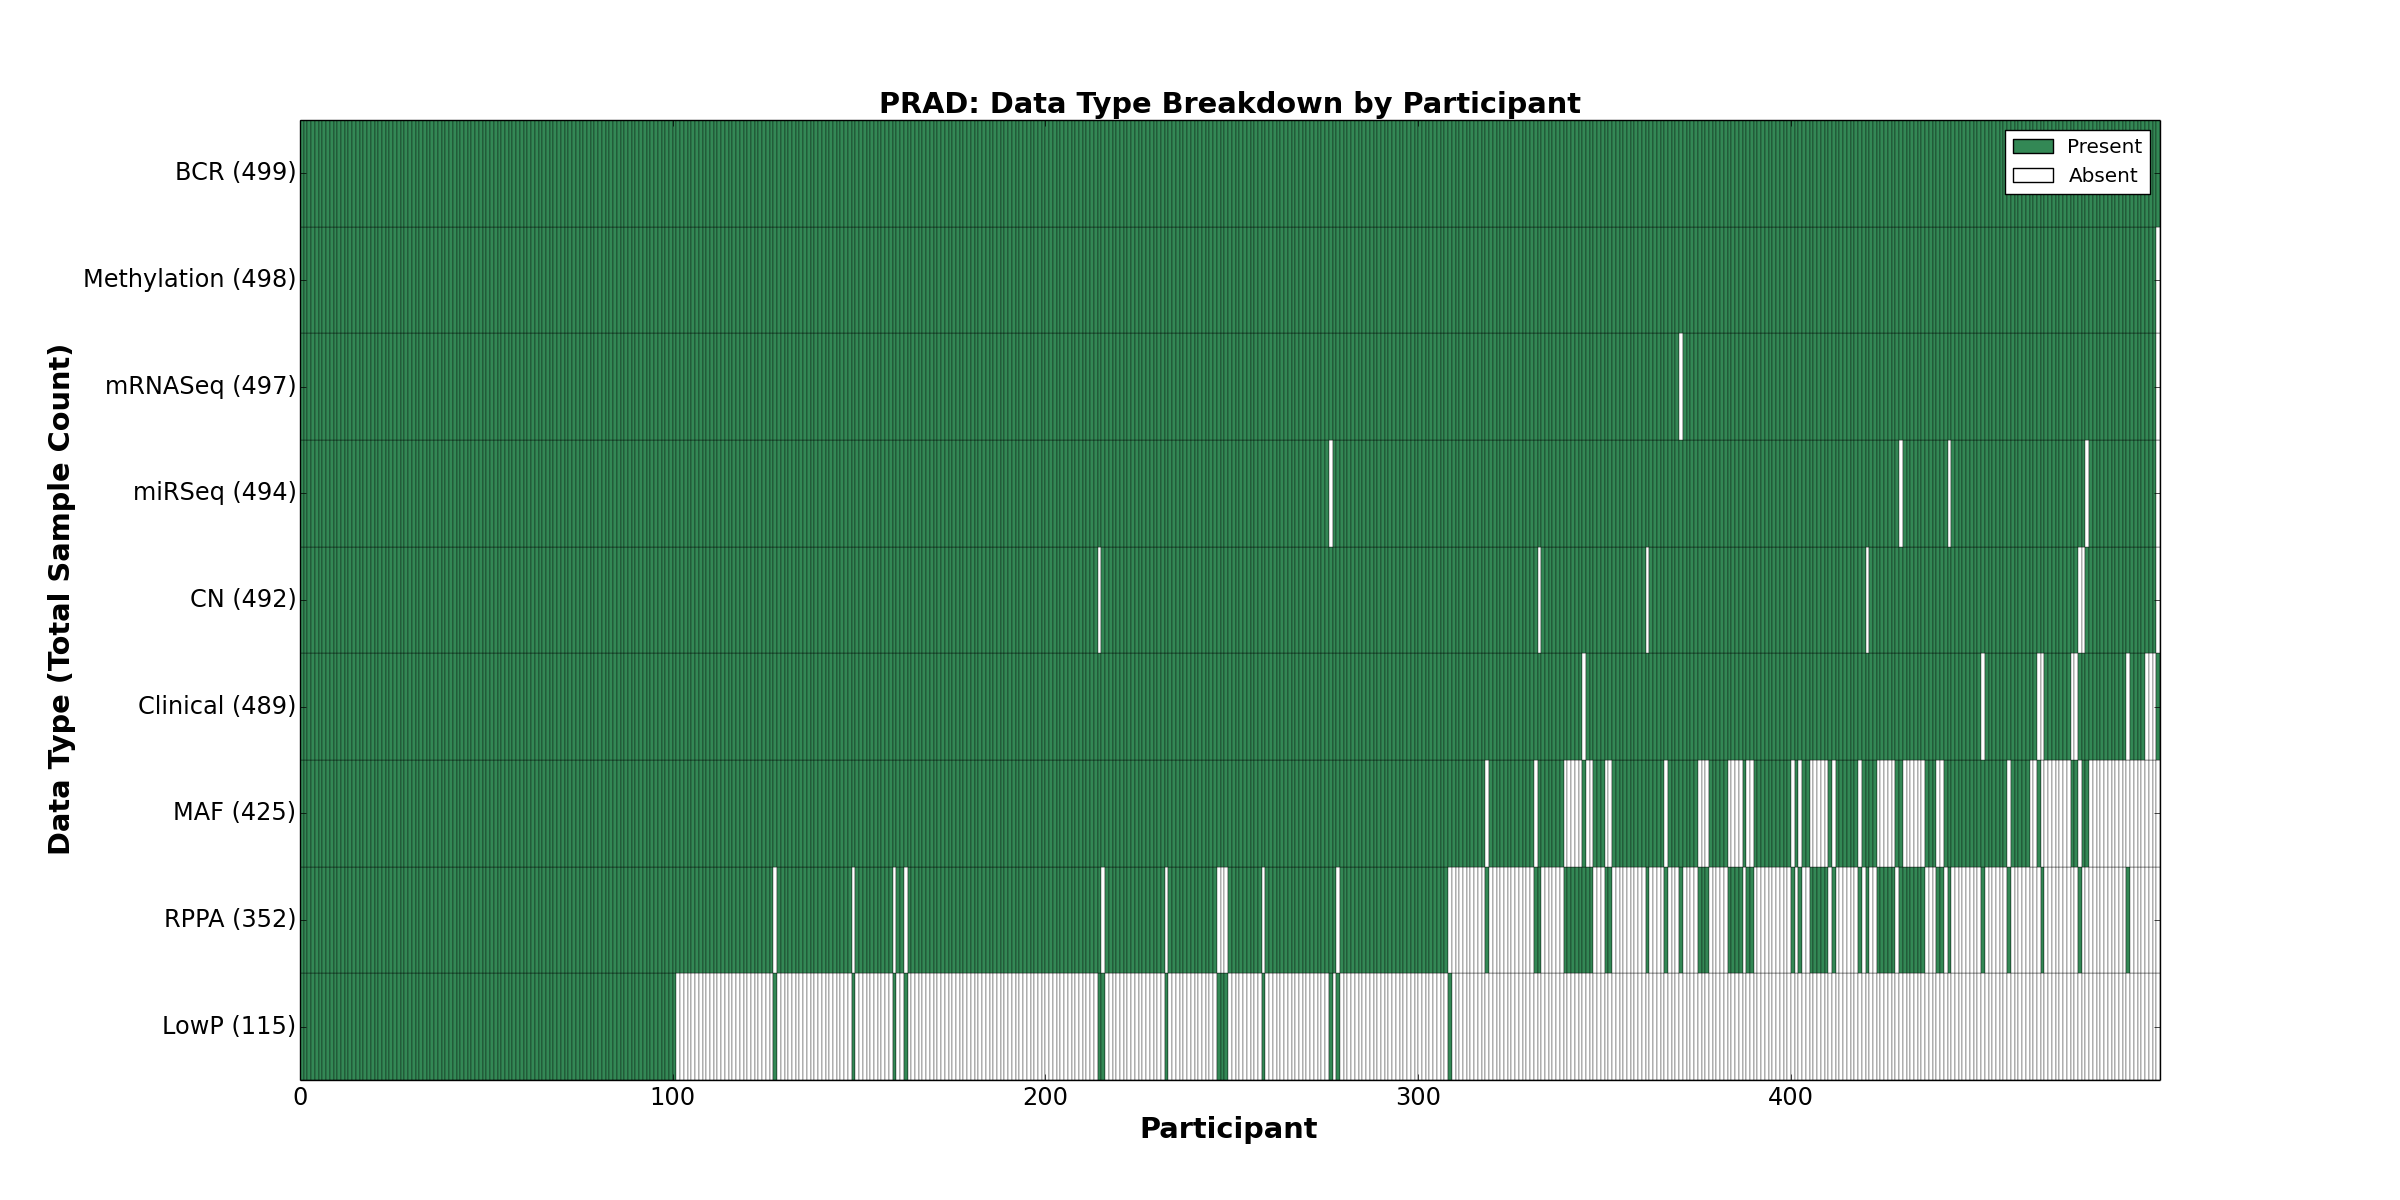
| PRAD | 499 | 489 | 492 | 115 | 498 | 0 | 497 | 0 | 494 | 352 | 425 | 0 |
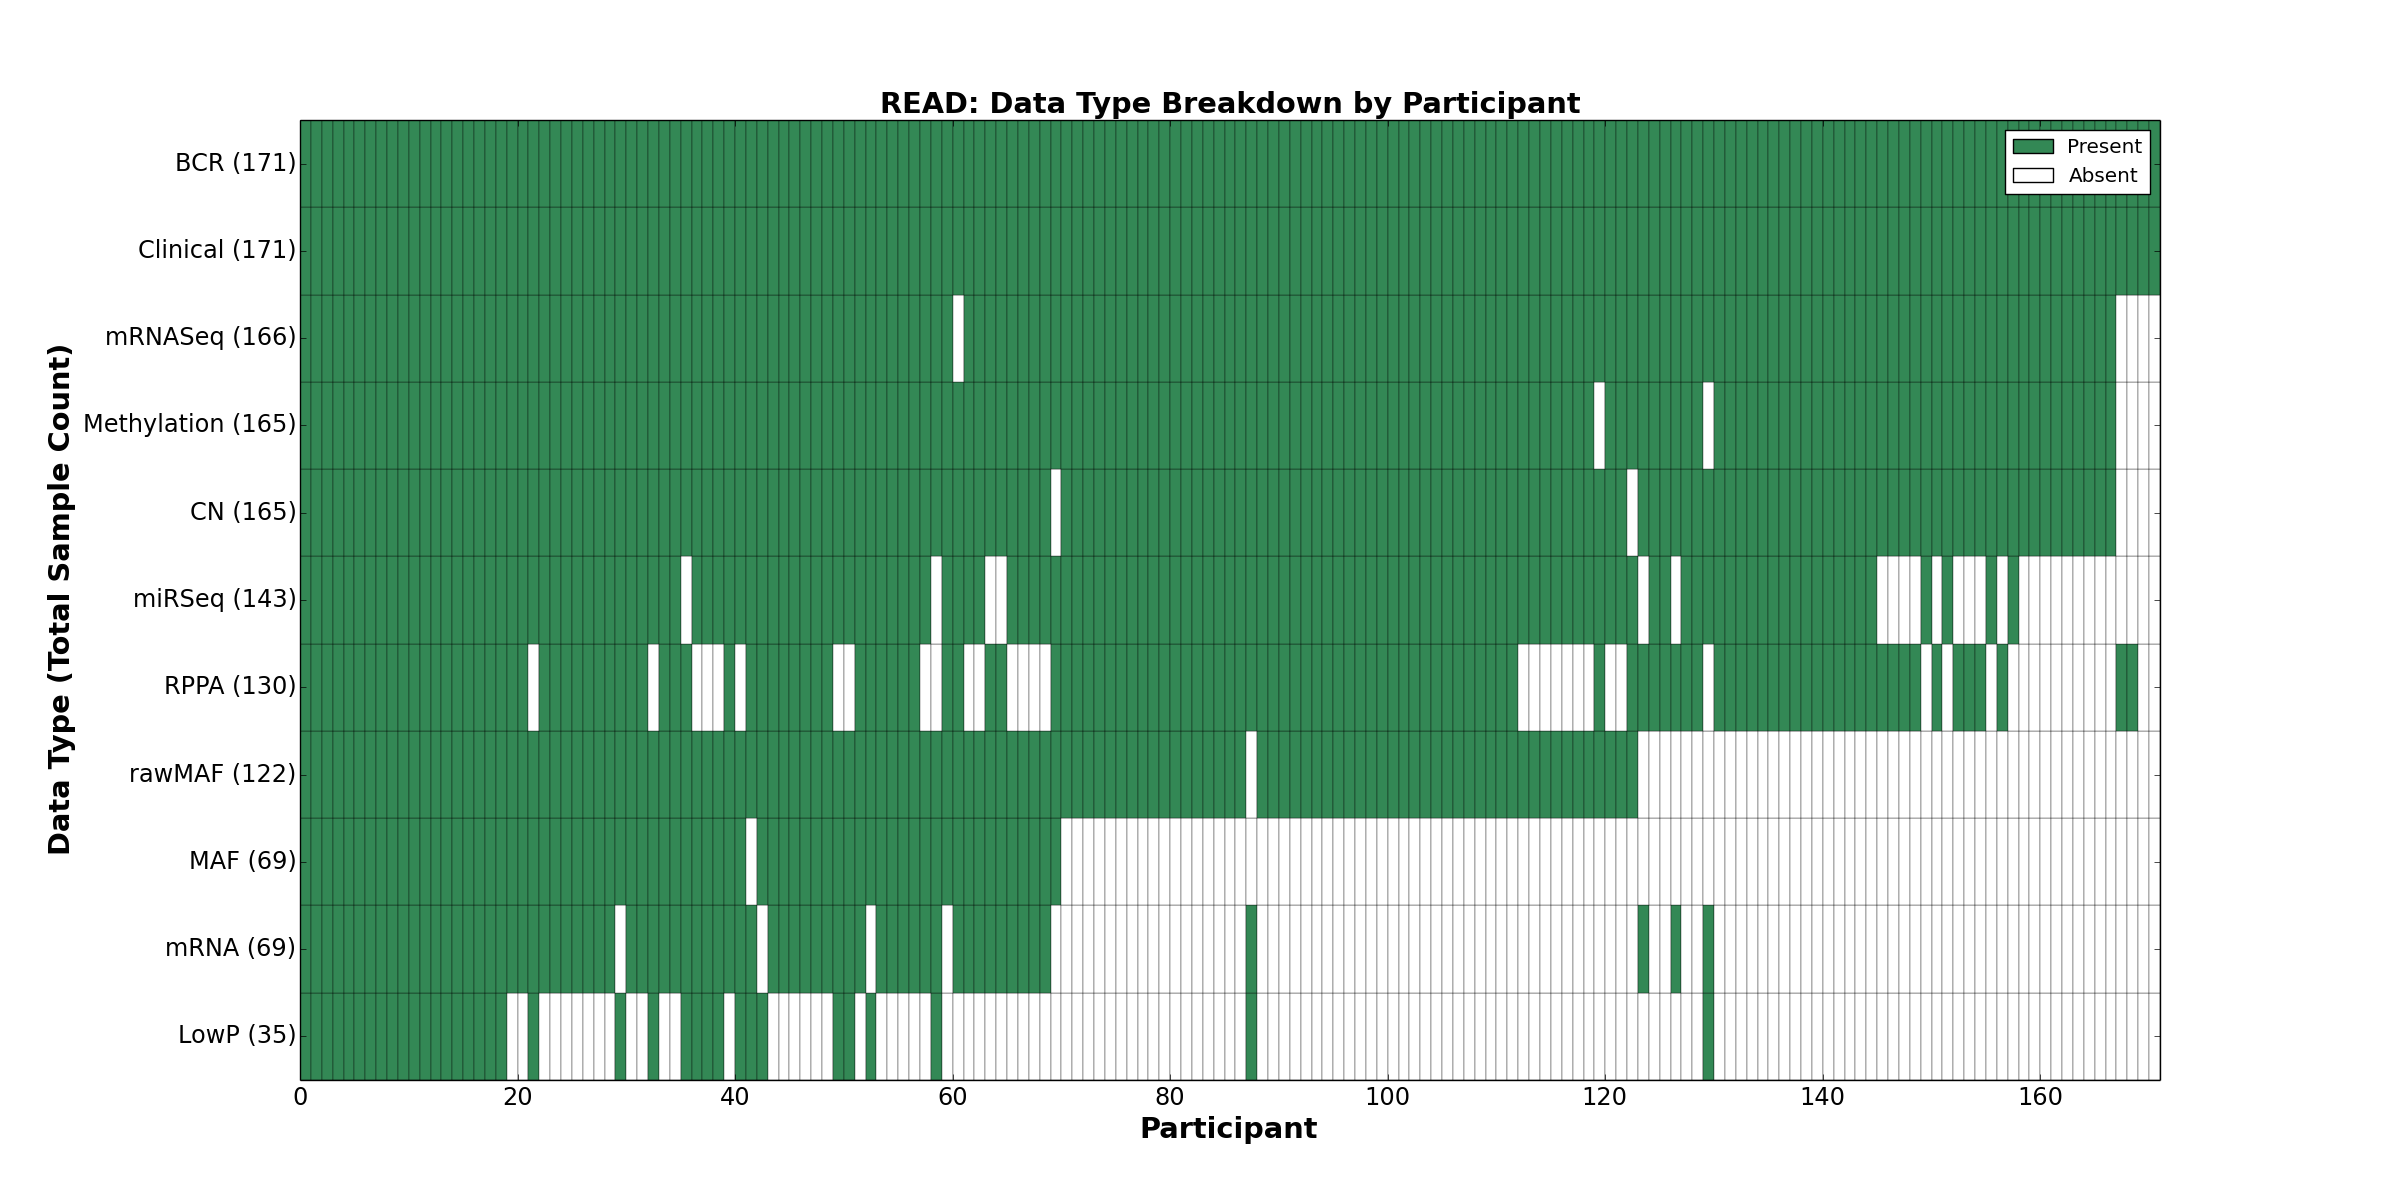
| READ | 171 | 171 | 165 | 35 | 165 | 69 | 166 | 0 | 143 | 130 | 69 | 122 |
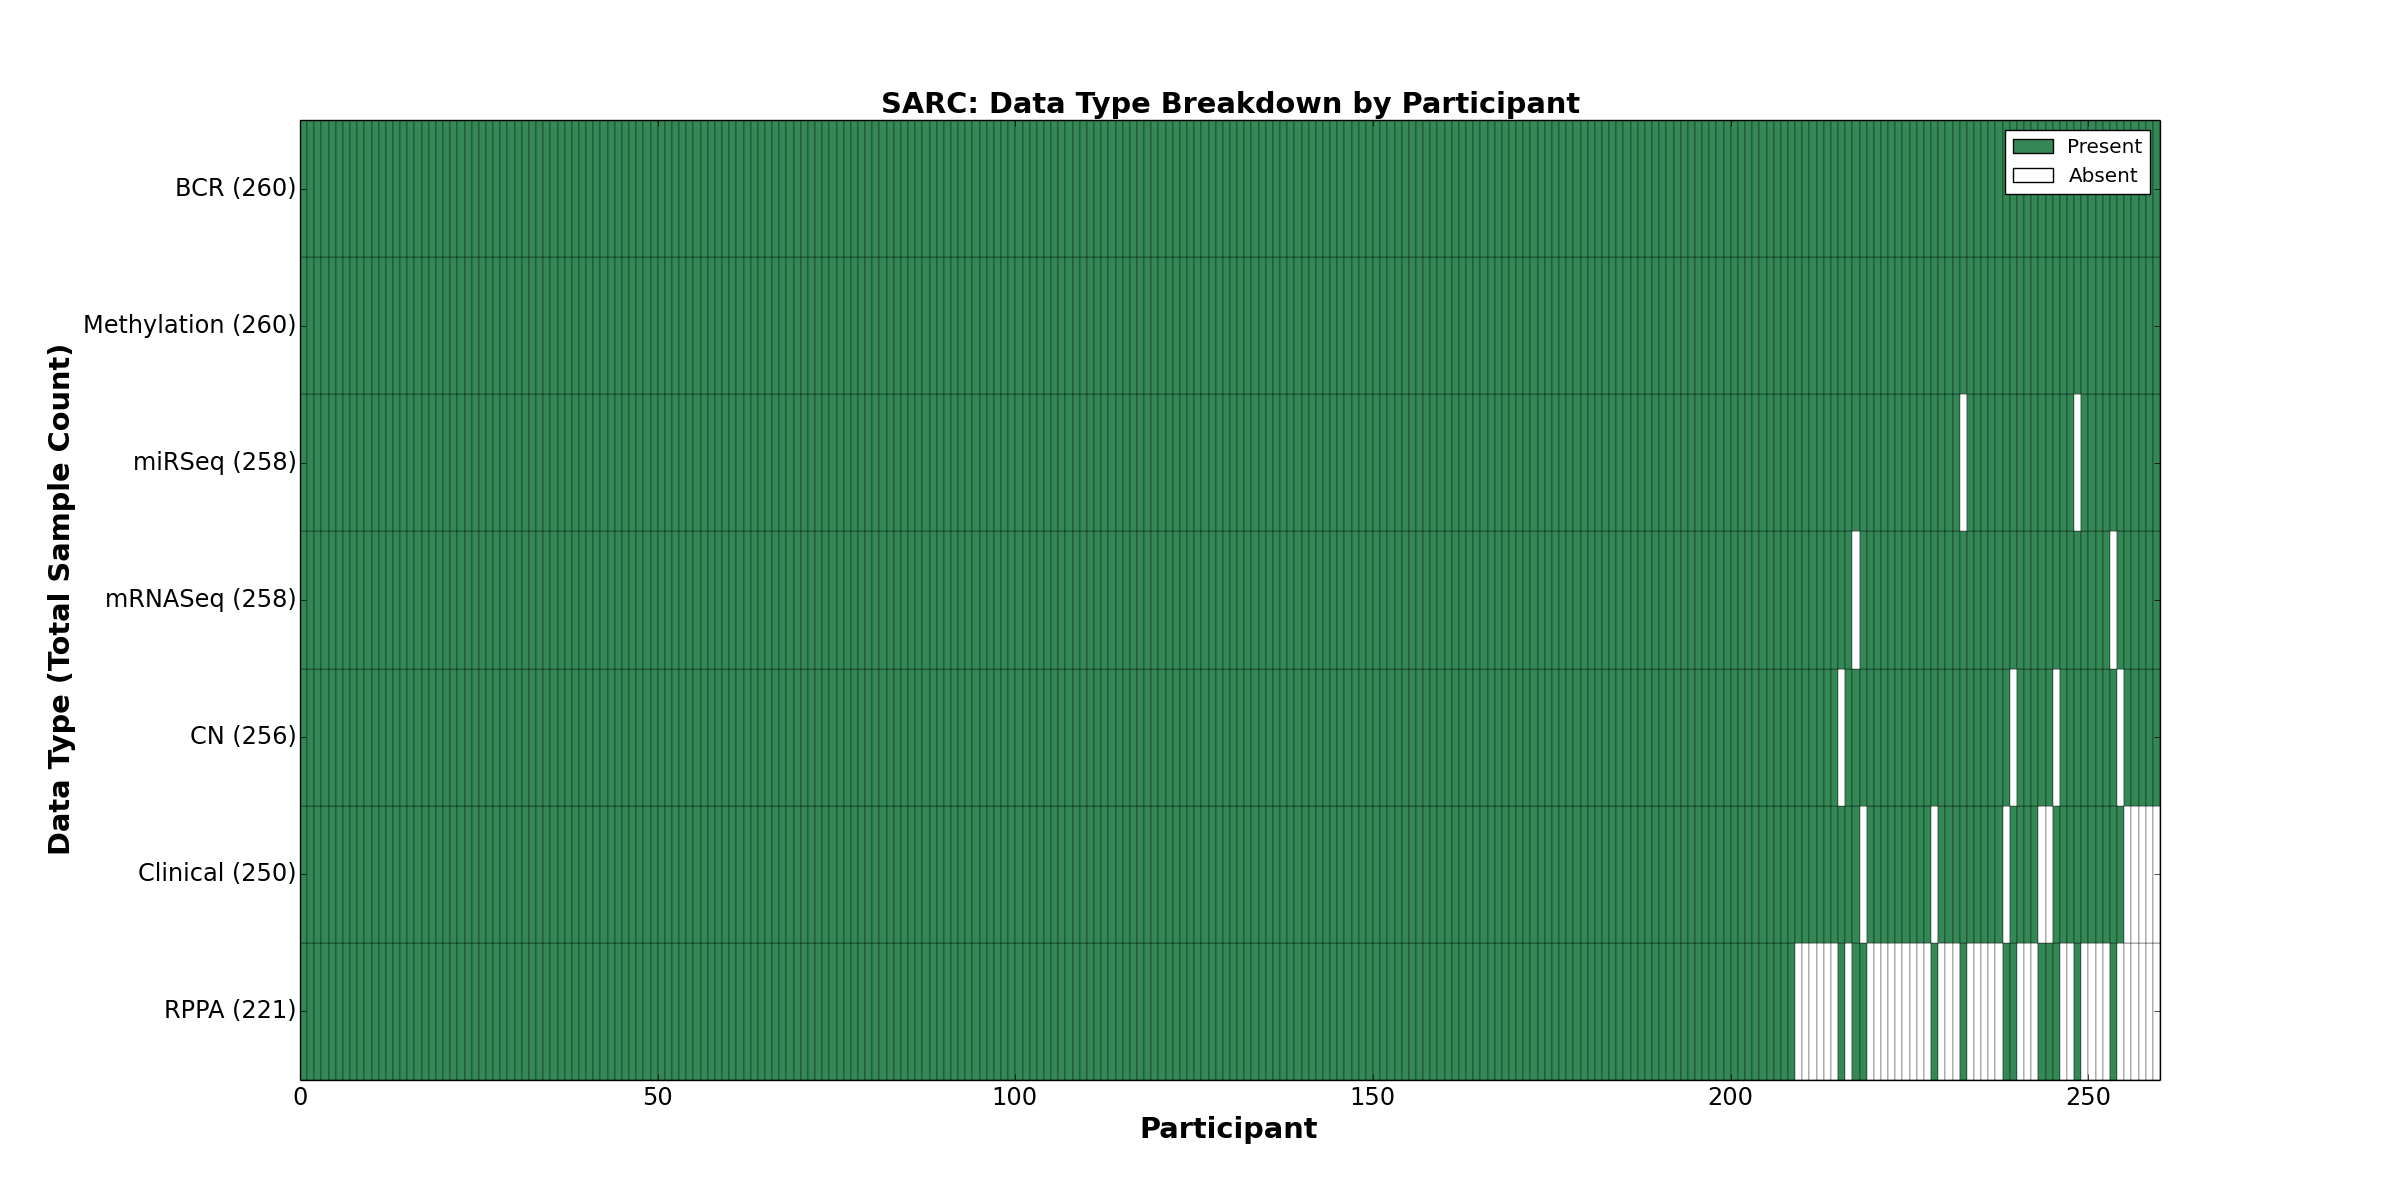
| SARC | 260 | 250 | 256 | 0 | 260 | 0 | 258 | 0 | 258 | 221 | 0 | 0 |
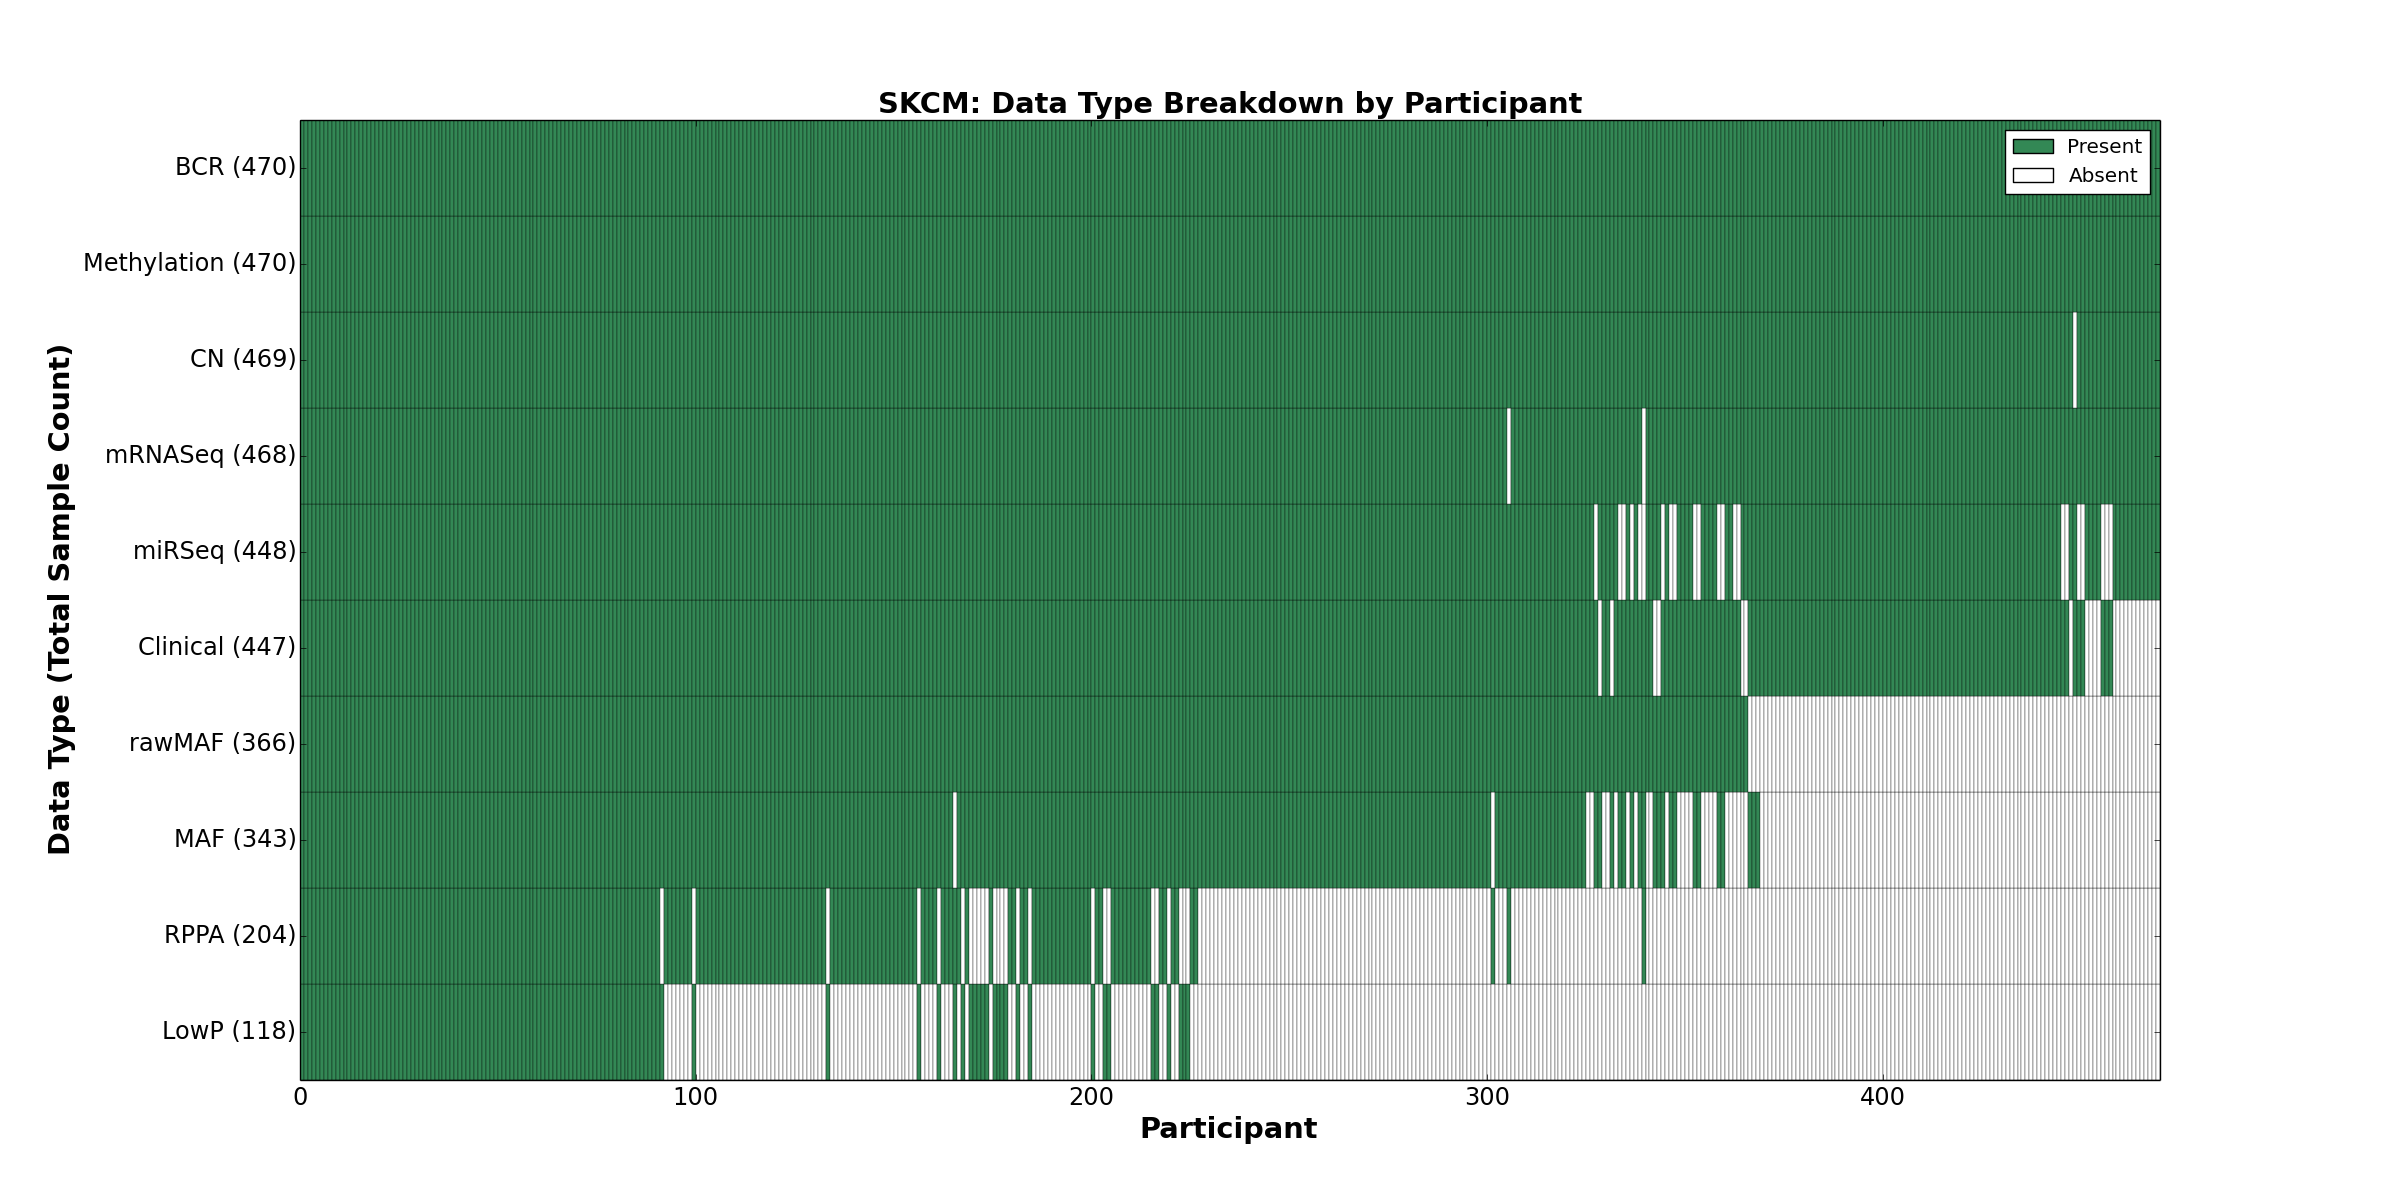
| SKCM | 470 | 447 | 469 | 118 | 470 | 0 | 468 | 0 | 448 | 204 | 343 | 366 |
| STAD | 443 | 438 | 442 | 107 | 443 | 0 | 274 | 0 | 442 | 264 | 289 | 0 |
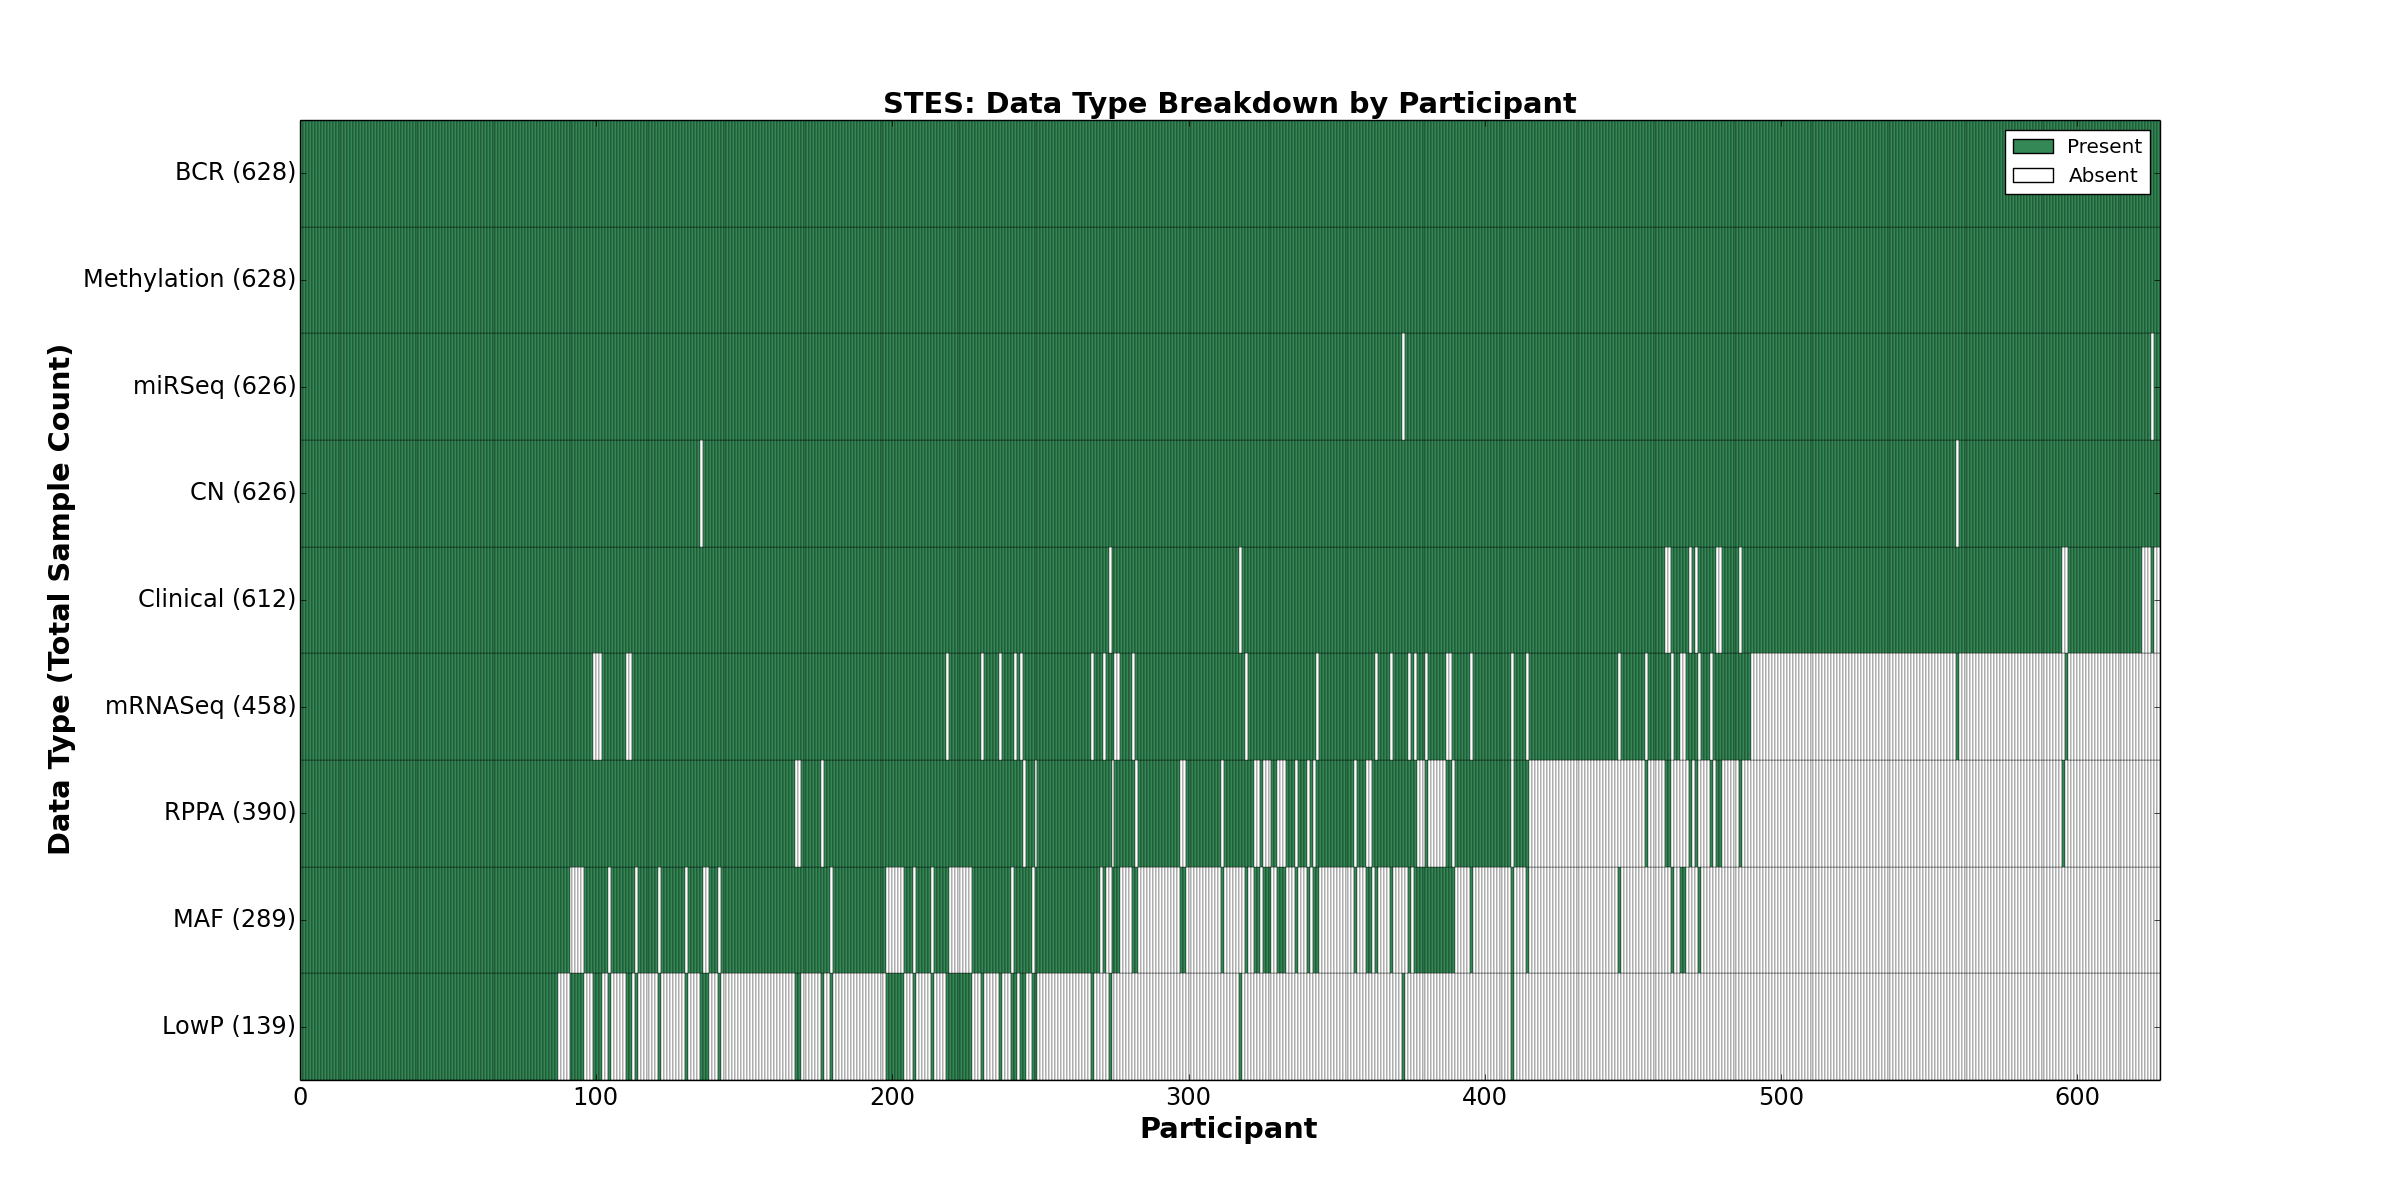
| STES | 628 | 612 | 626 | 139 | 628 | 0 | 458 | 0 | 626 | 390 | 289 | 0 |
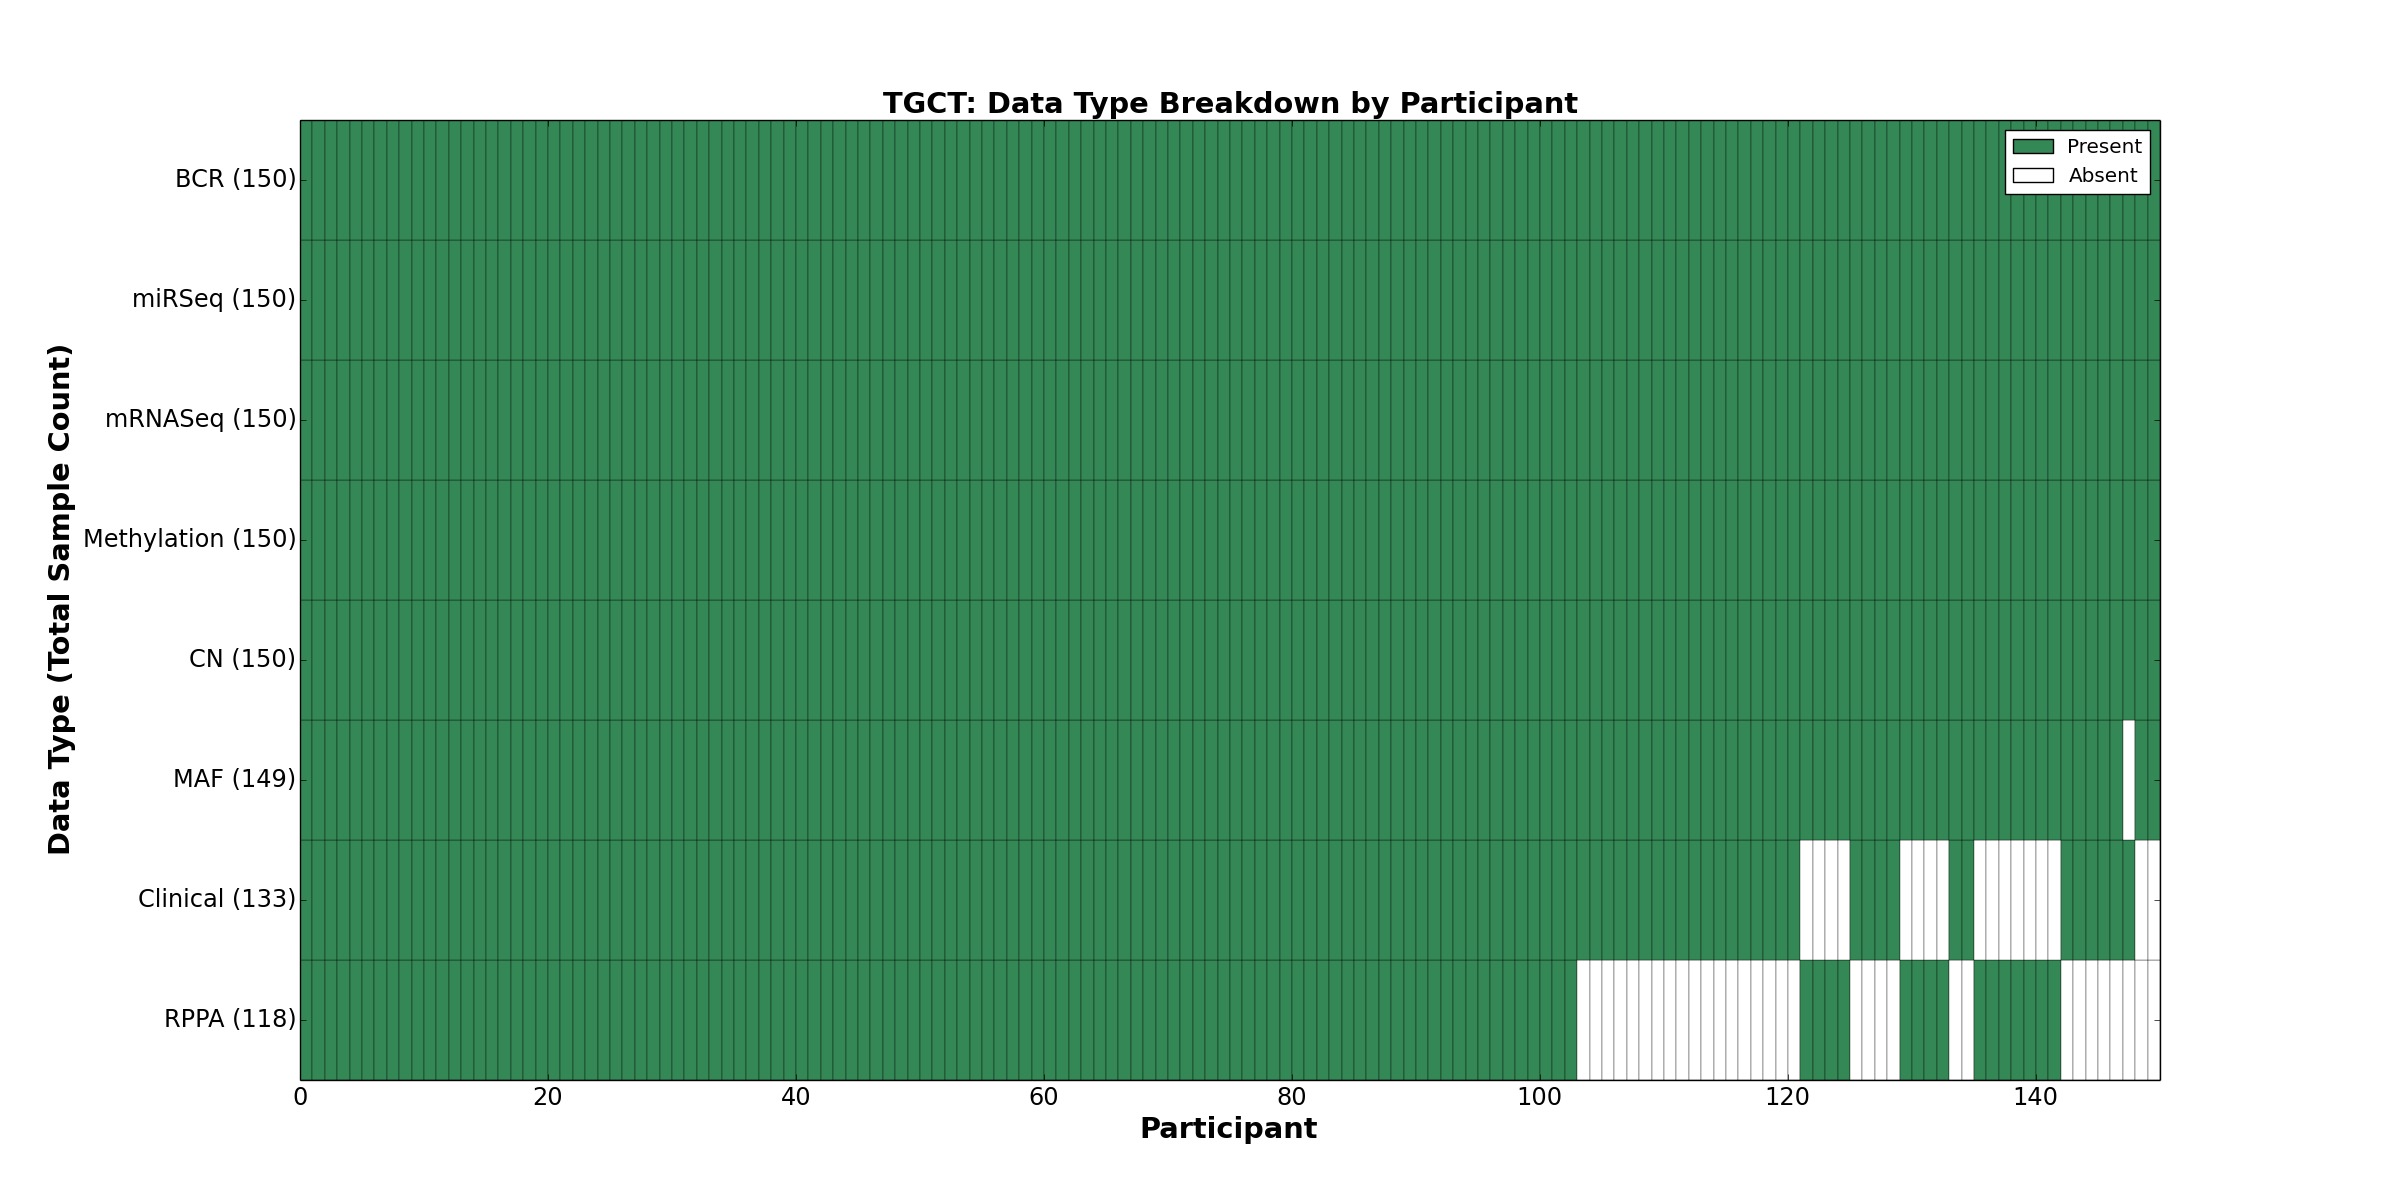
| TGCT | 150 | 133 | 150 | 0 | 150 | 0 | 150 | 0 | 150 | 118 | 149 | 0 |
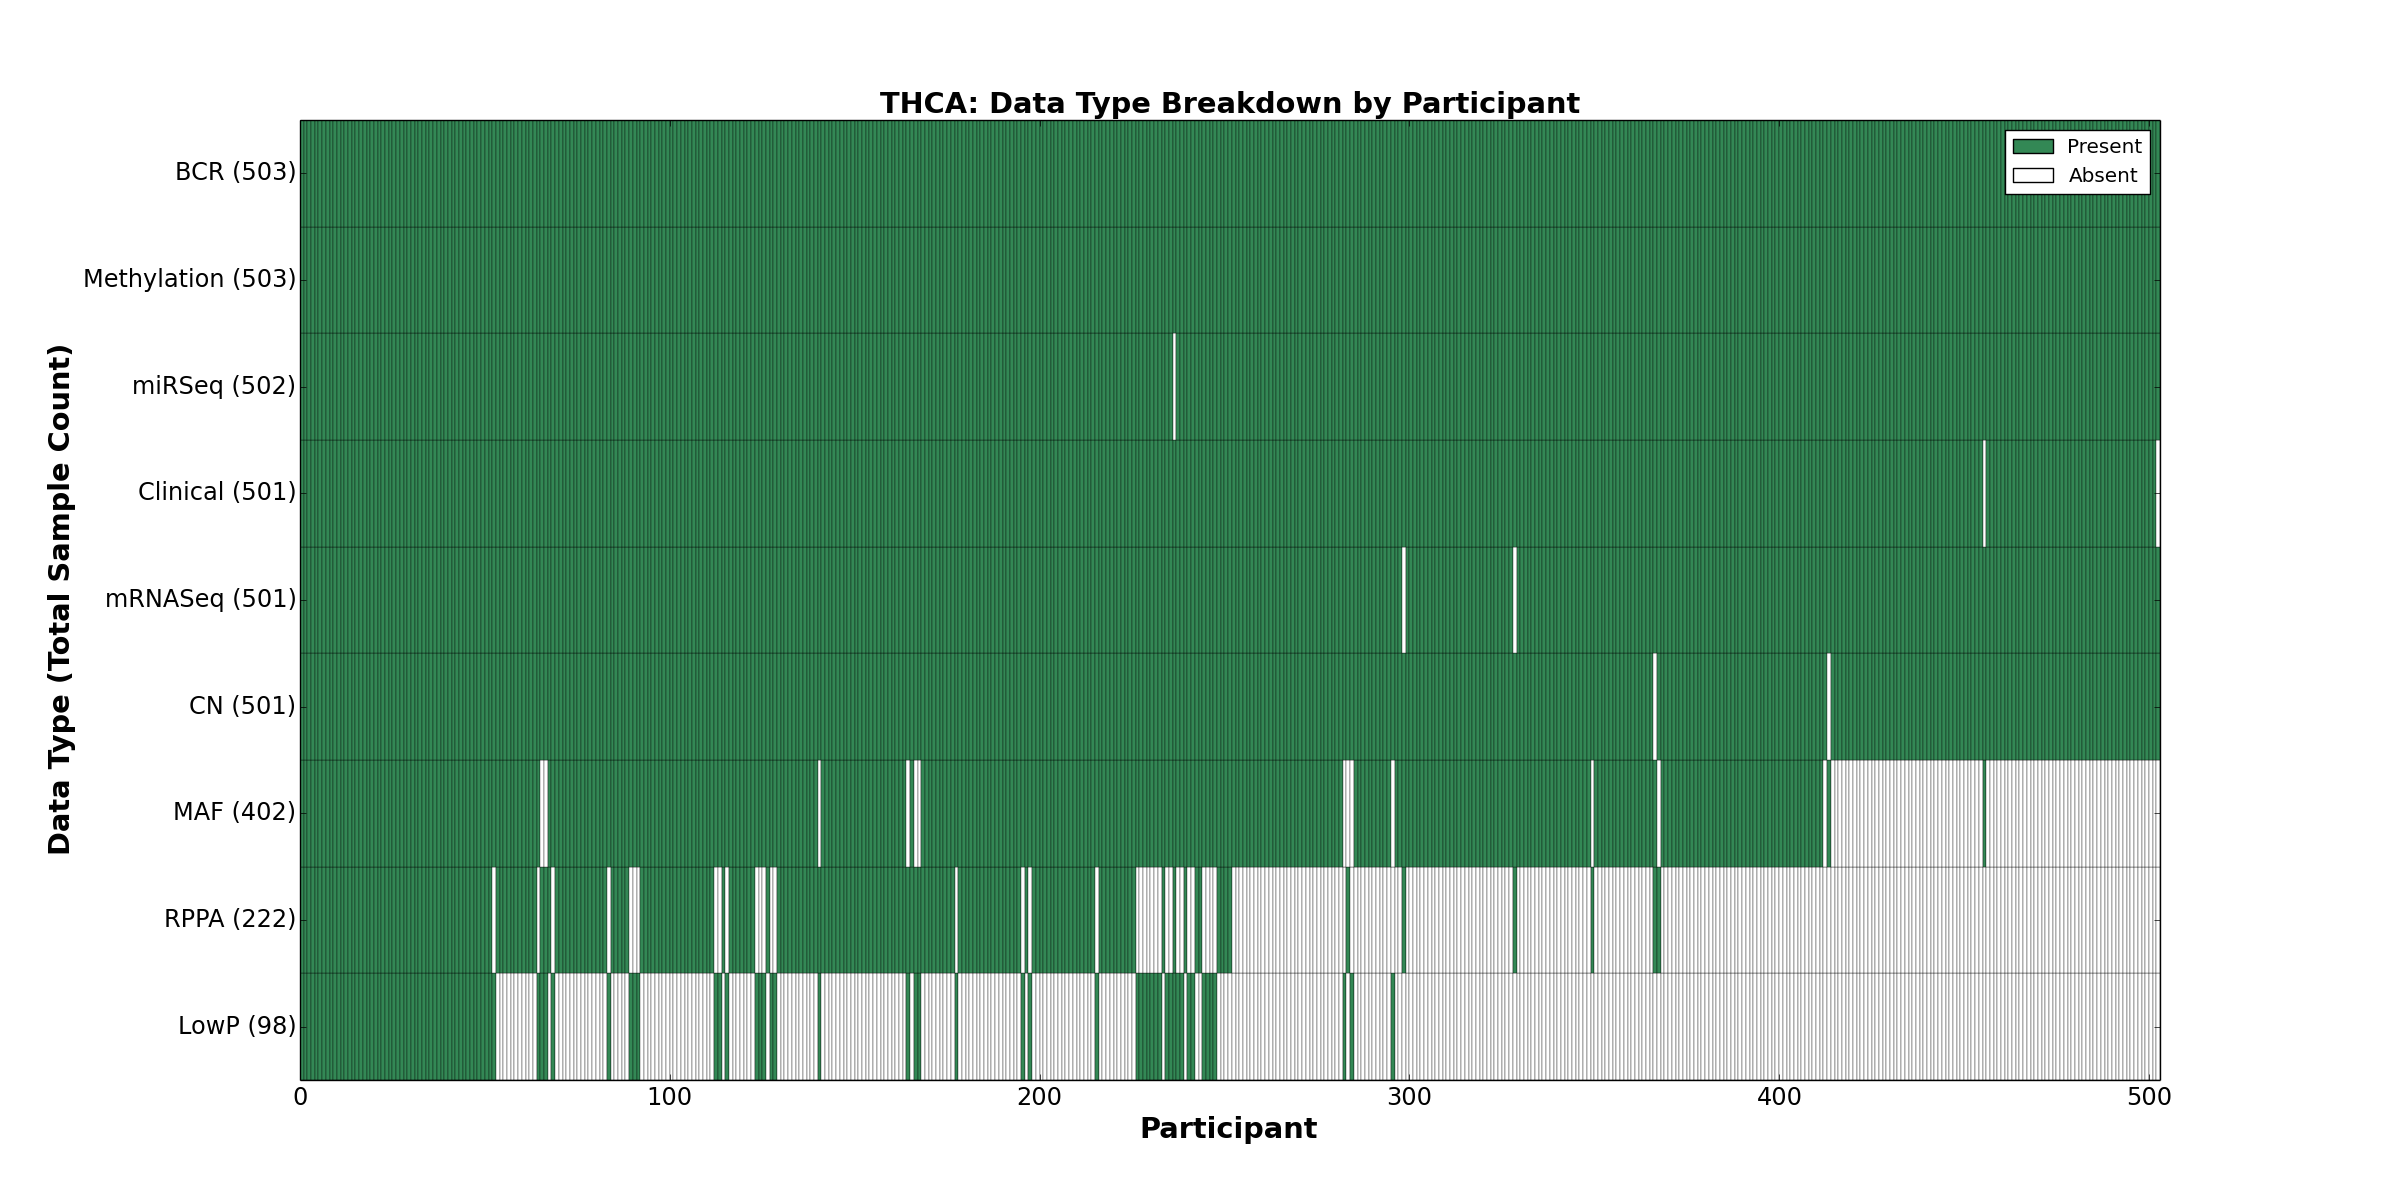
| THCA | 503 | 501 | 501 | 98 | 503 | 0 | 501 | 0 | 502 | 222 | 402 | 0 |
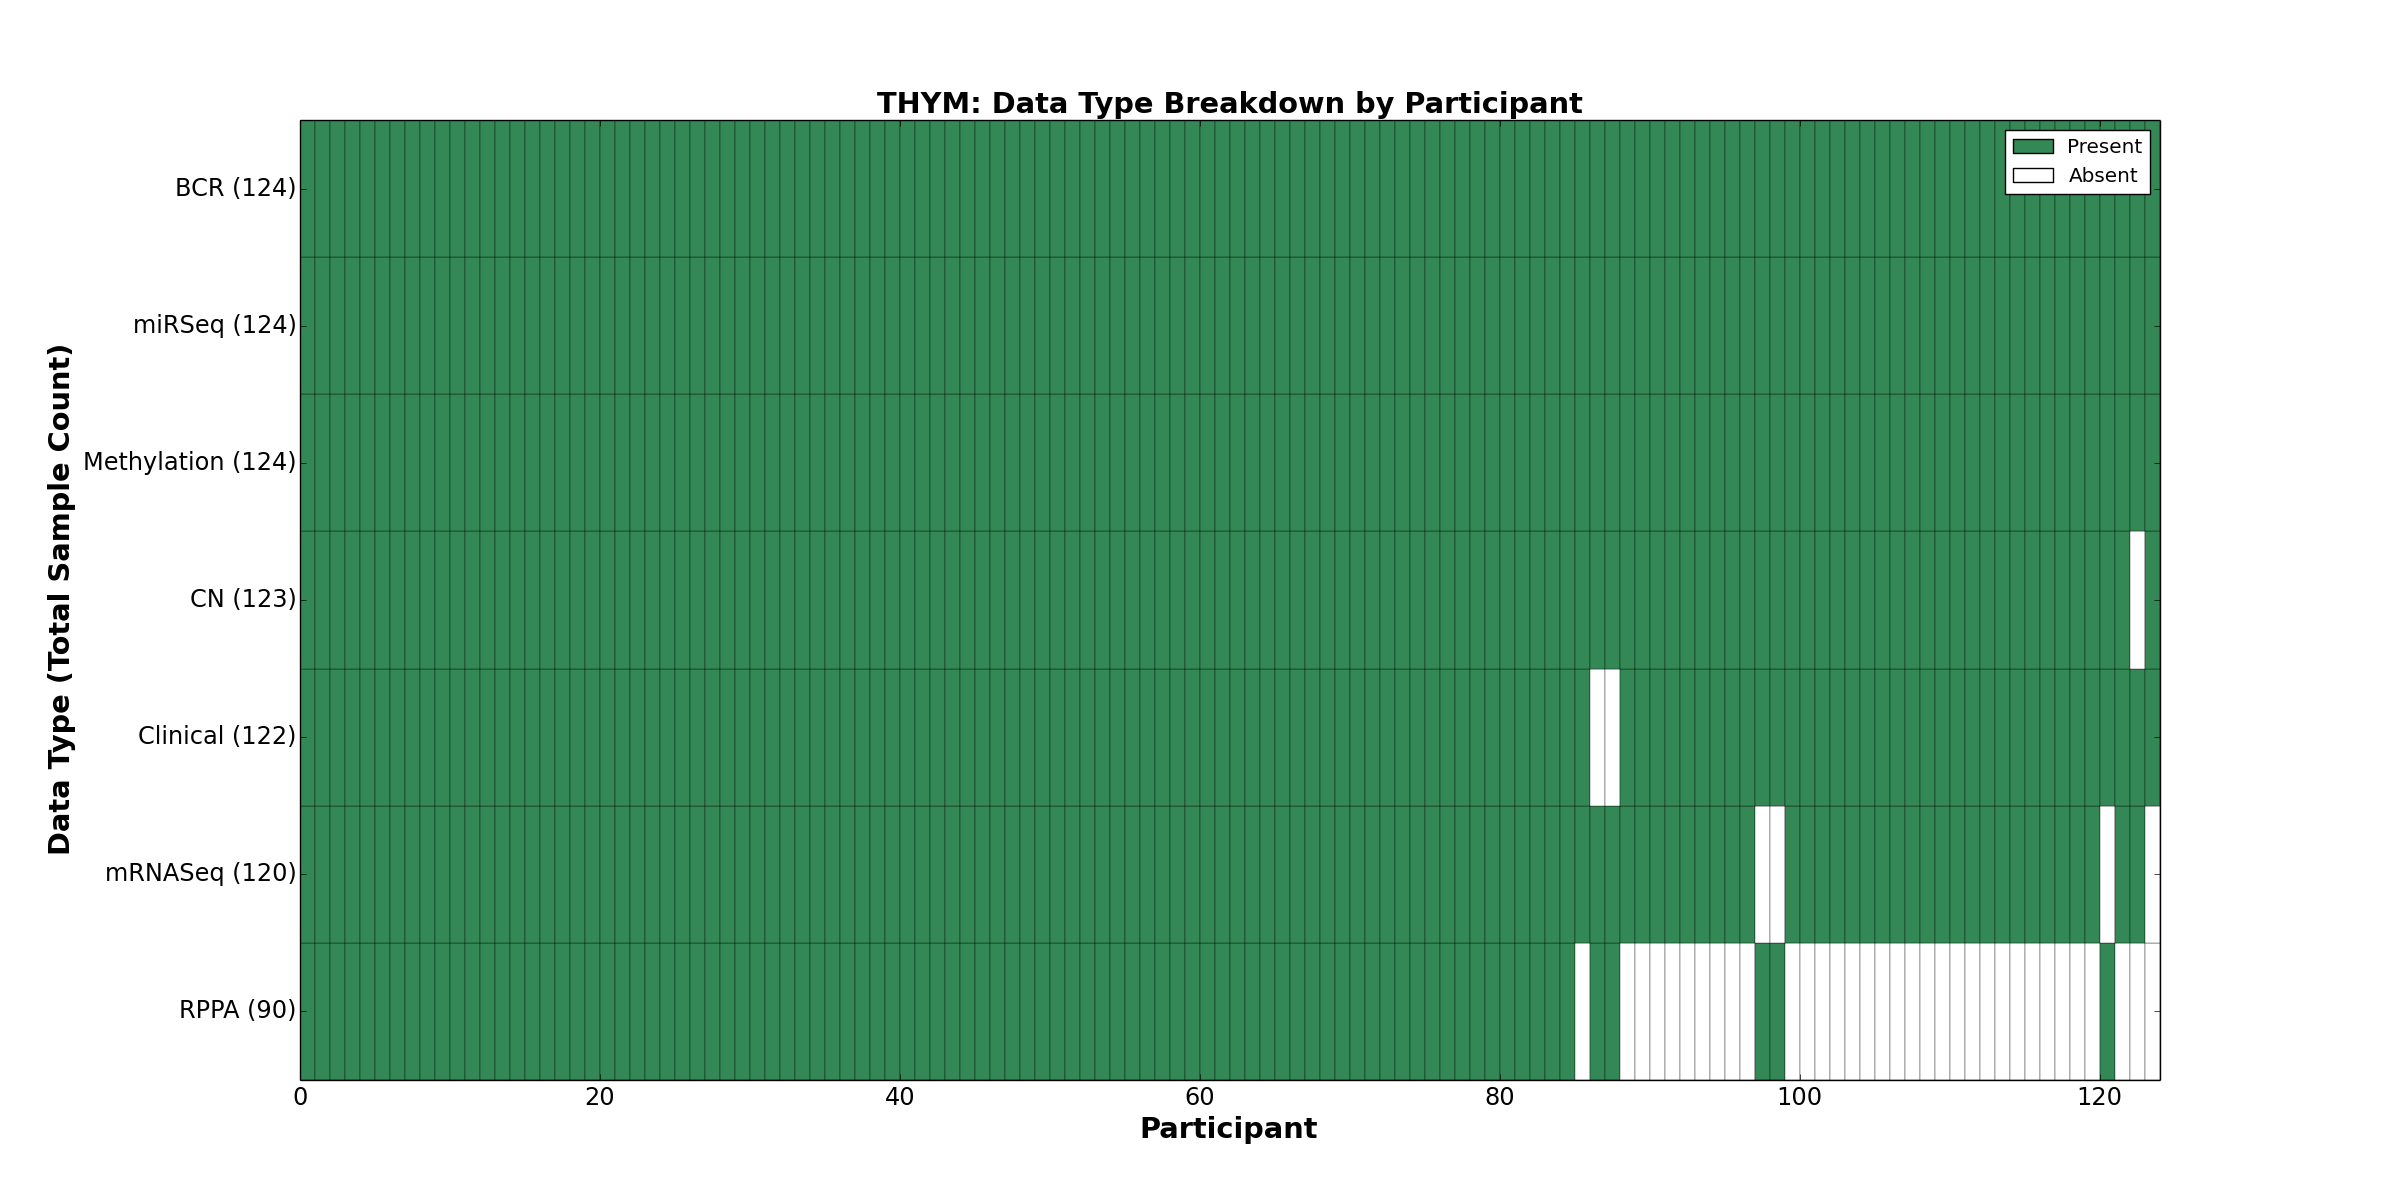
| THYM | 124 | 122 | 123 | 0 | 124 | 0 | 120 | 0 | 124 | 90 | 0 | 0 |
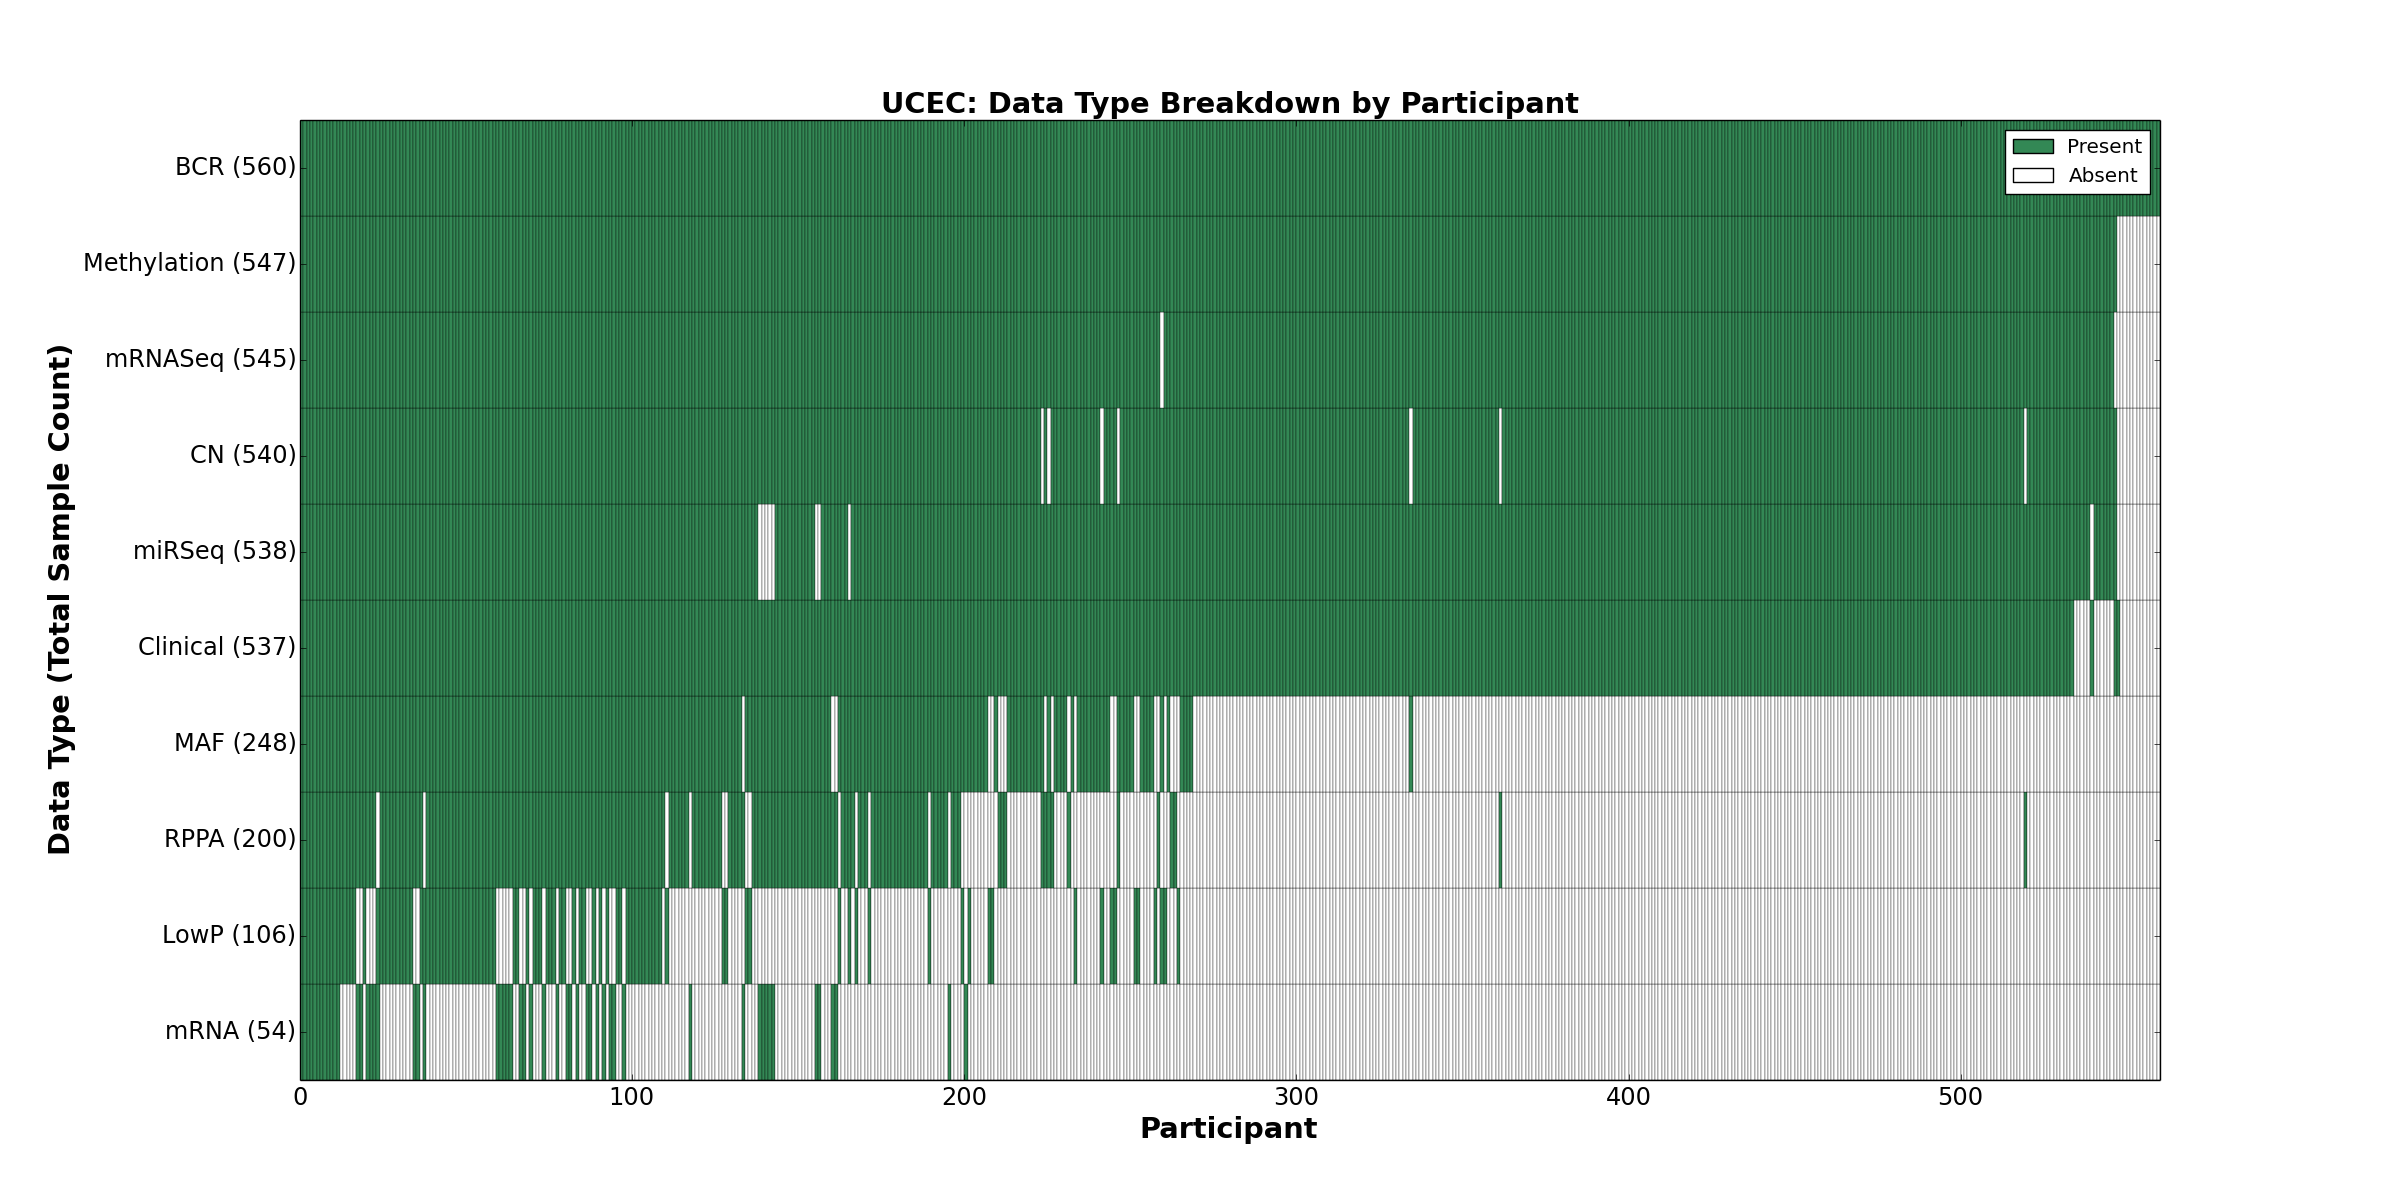
| UCEC | 560 | 537 | 540 | 106 | 547 | 54 | 545 | 0 | 538 | 200 | 248 | 0 |
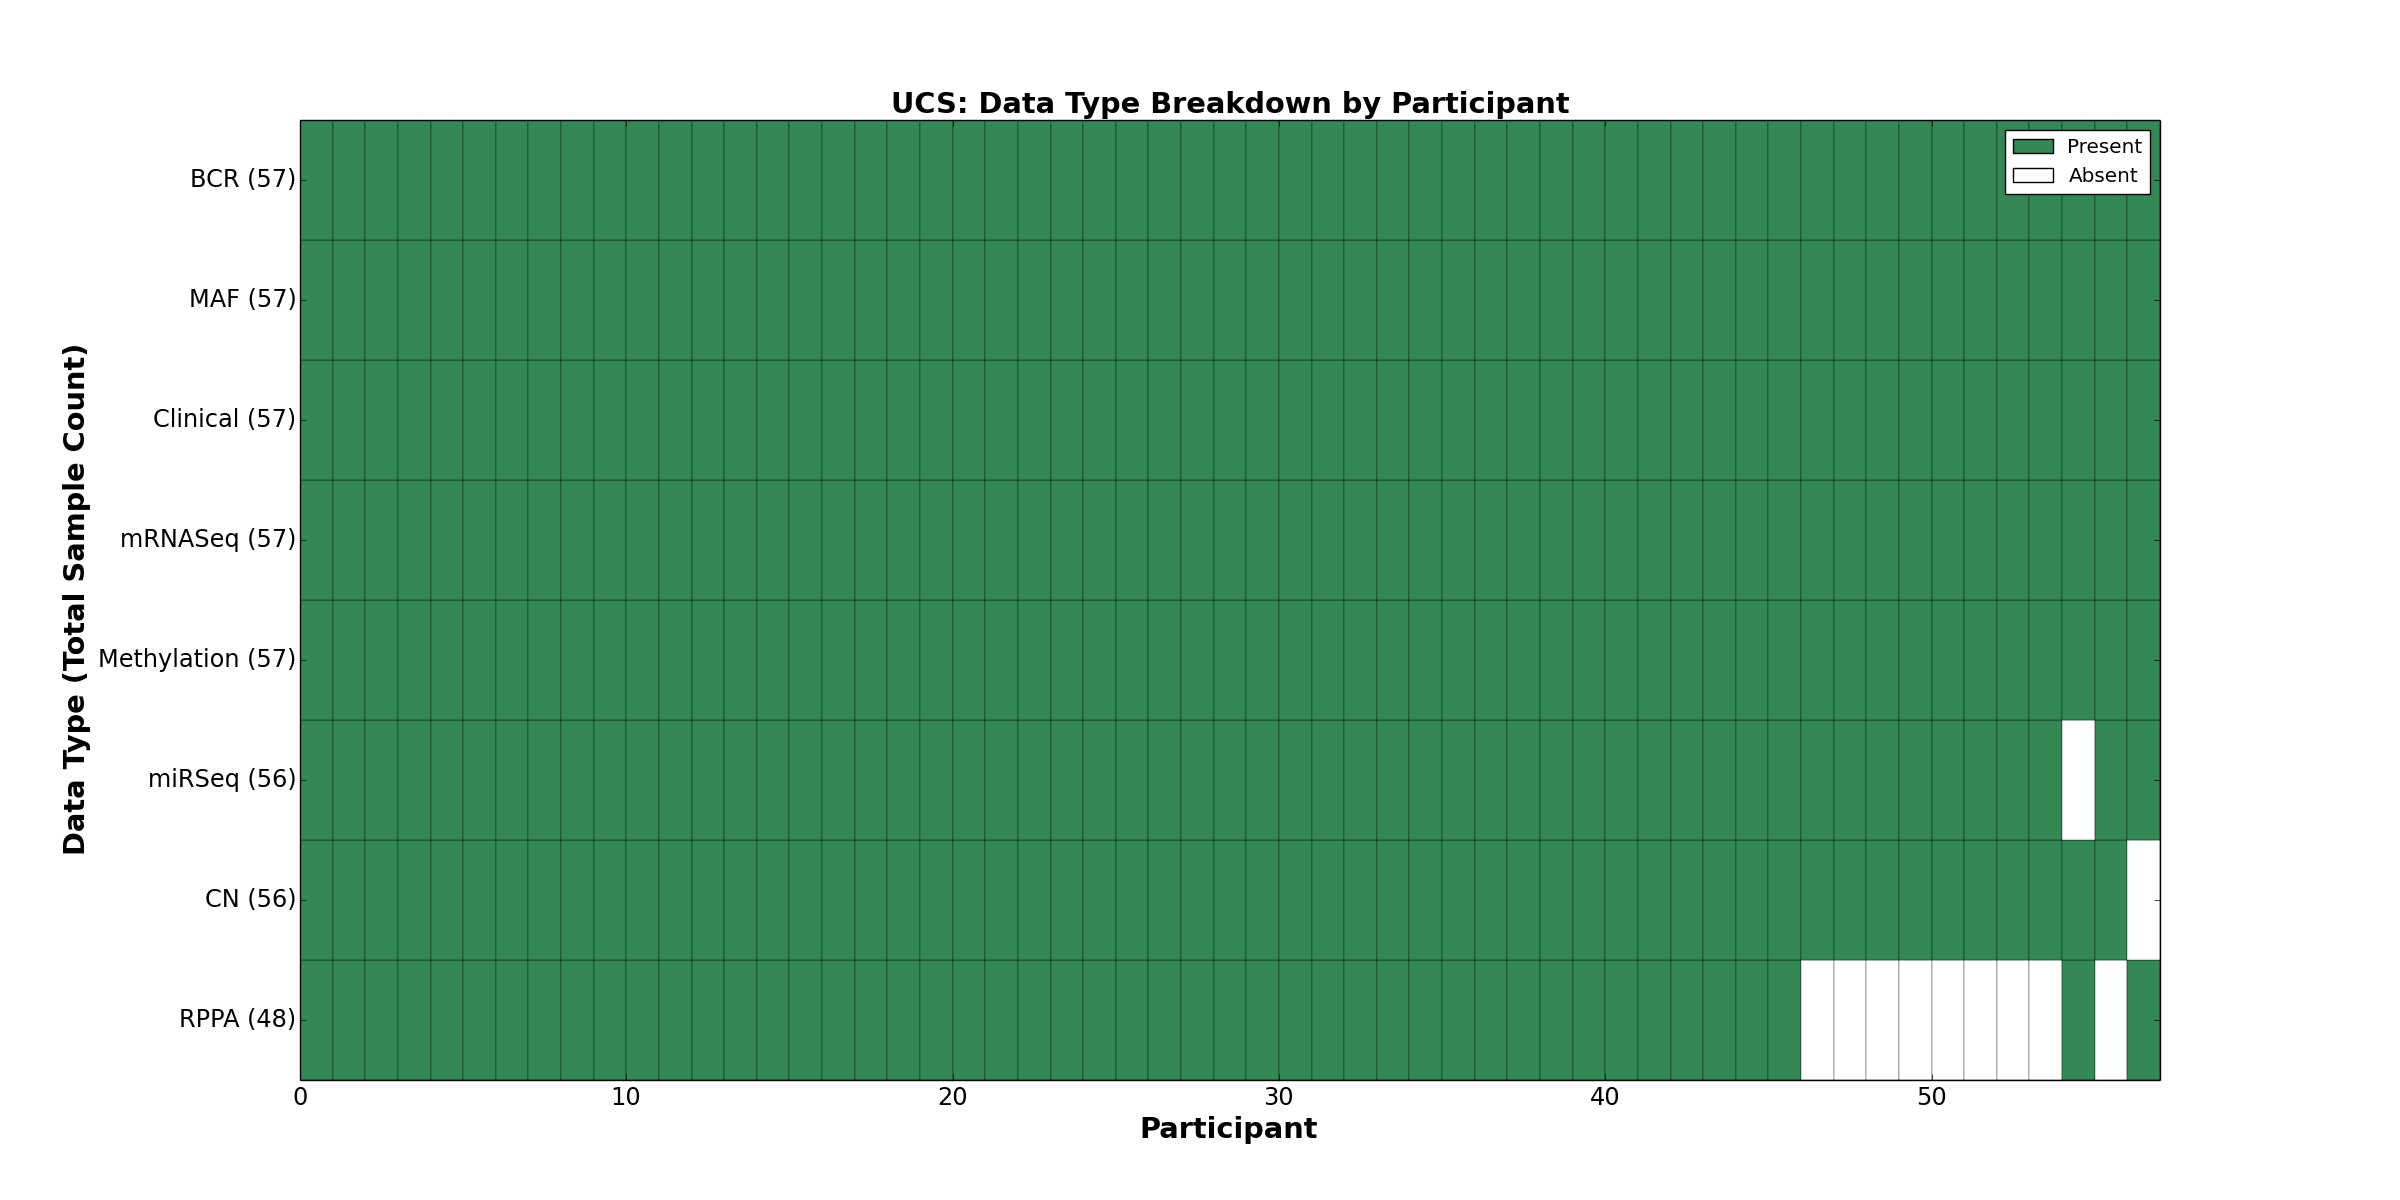
| UCS | 57 | 57 | 56 | 0 | 57 | 0 | 57 | 0 | 56 | 48 | 57 | 0 |
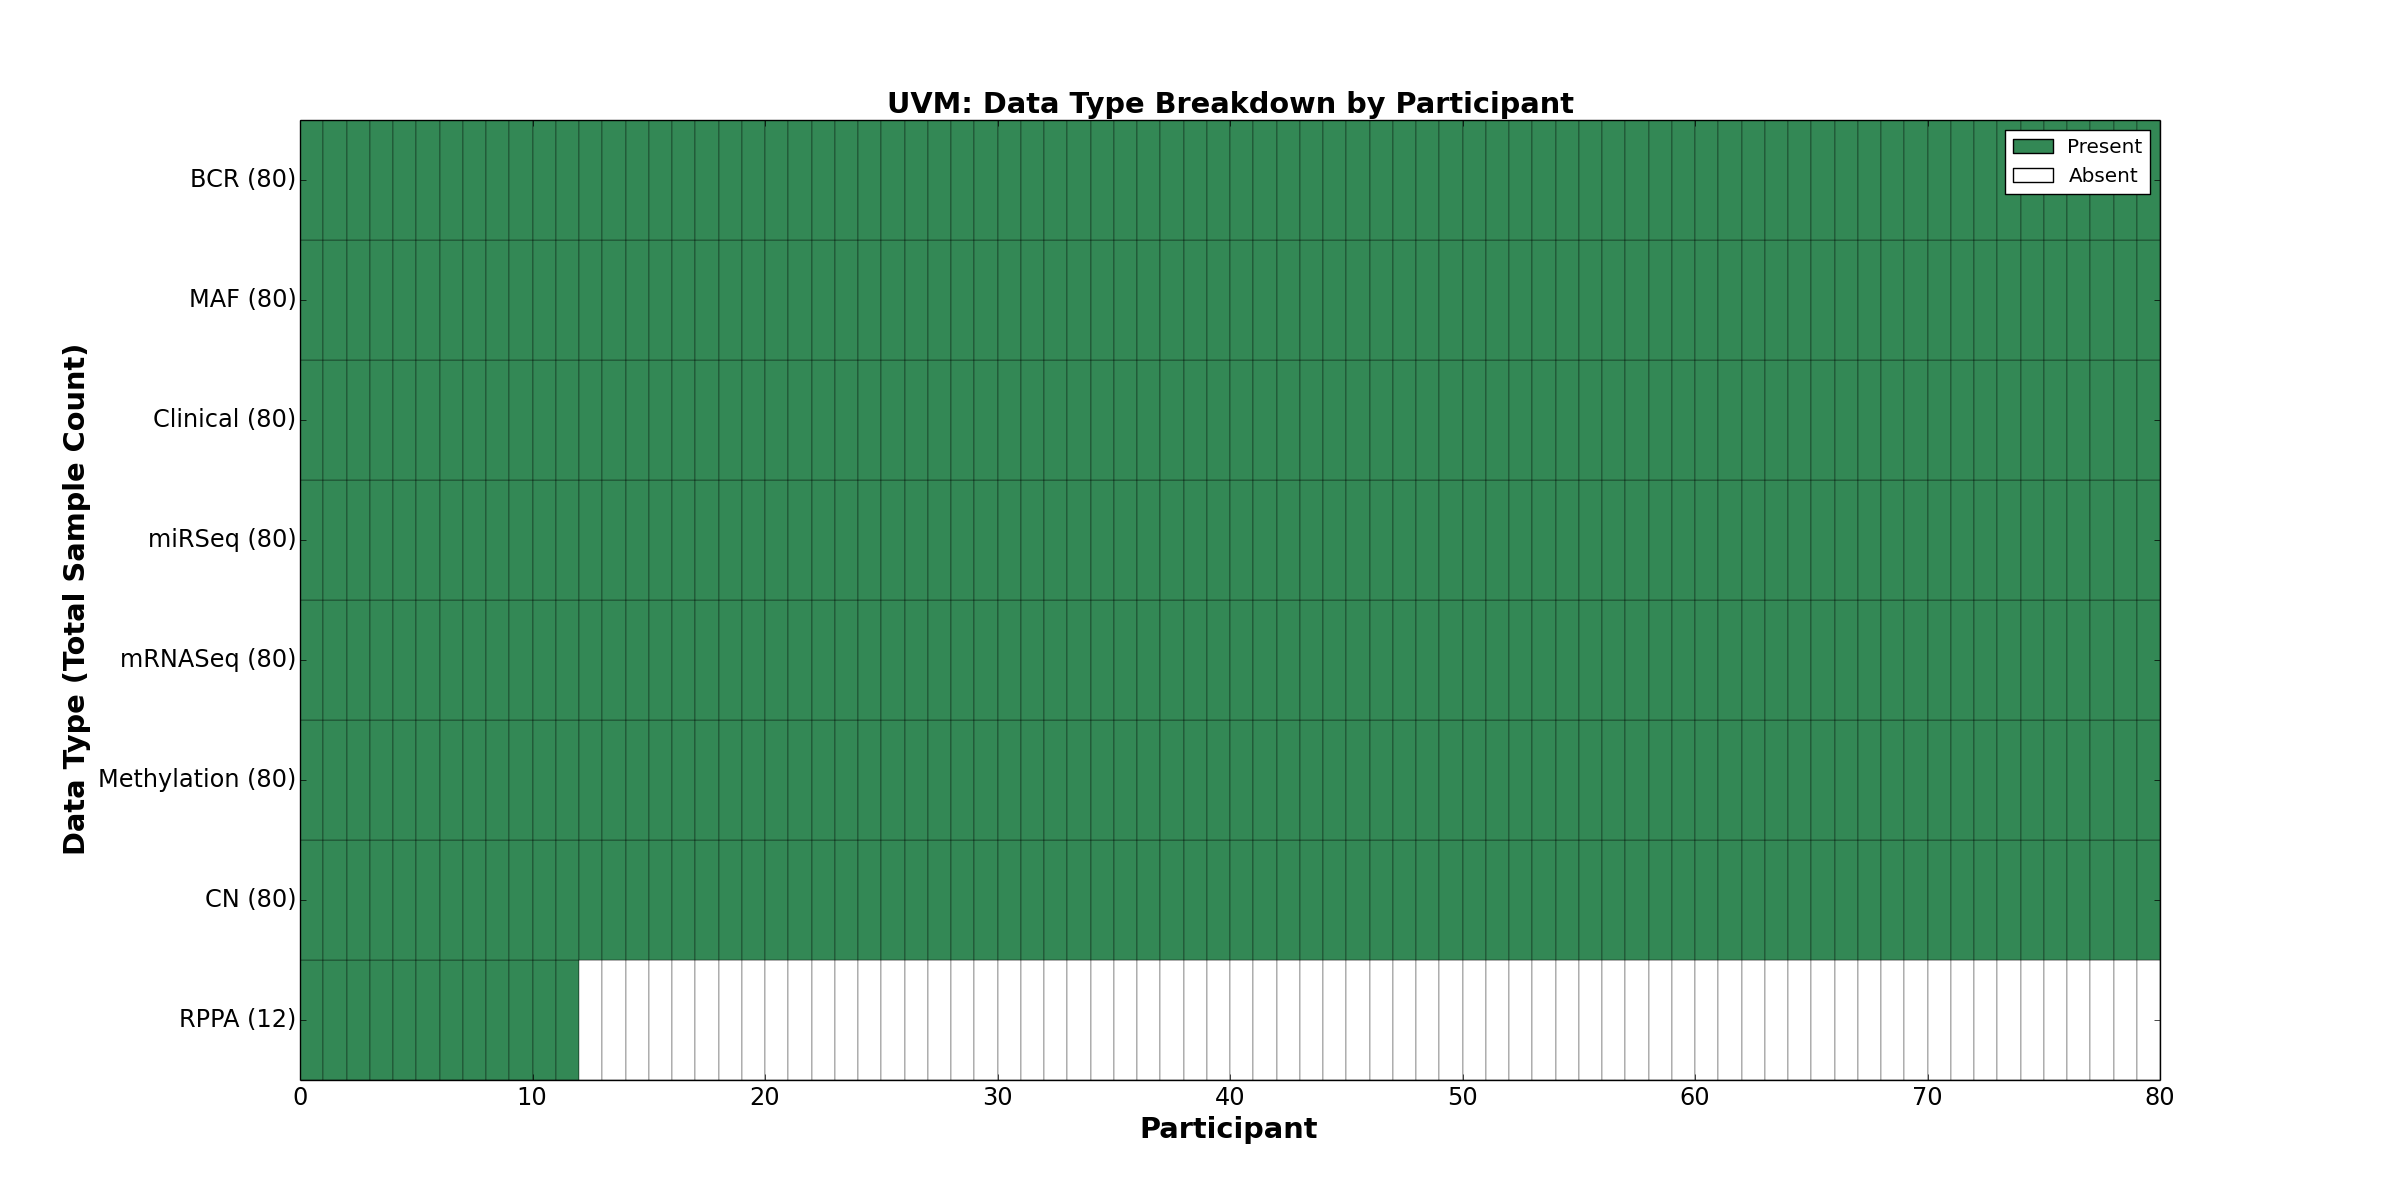
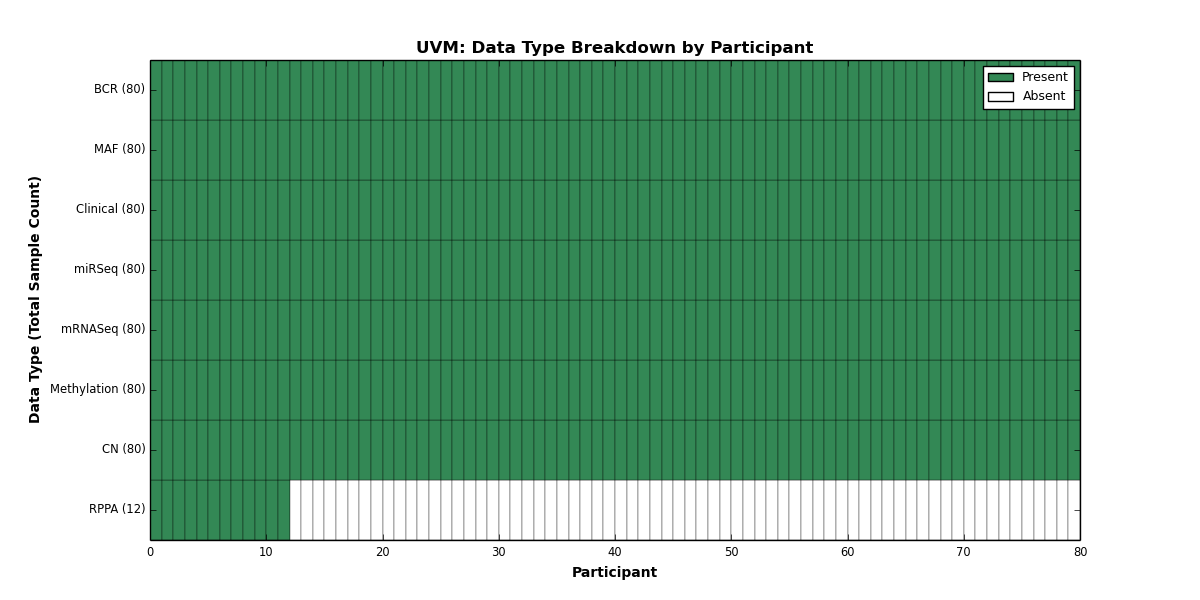
| UVM | 80 | 80 | 80 | 0 | 80 | 0 | 80 | 0 | 80 | 12 | 80 | 0 |
| Totals | 11352 | 10945 | 10987 | 1091 | 10955 | 2217 | 10095 | 1135 | 10160 | 5456 | 6584 | 4250 |
Figure 1. Get High-res Image This figure depicts the distribution of available data on a per participant basis.
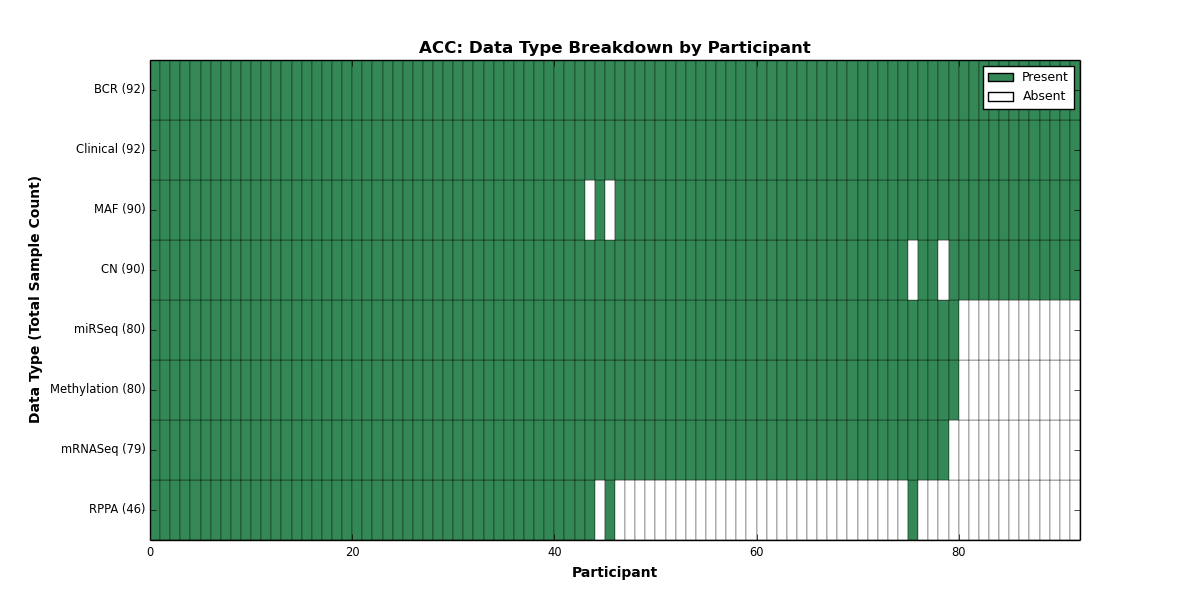
Figure 2. Get High-res Image This figure depicts the distribution of available data on a per participant basis.
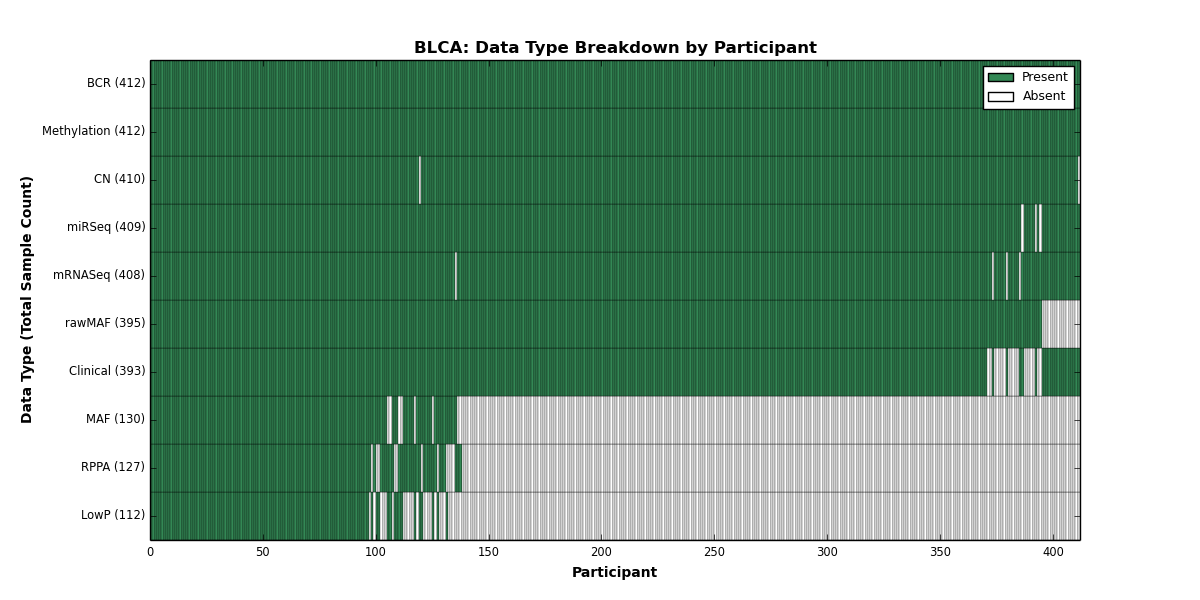
Figure 3. Get High-res Image This figure depicts the distribution of available data on a per participant basis.
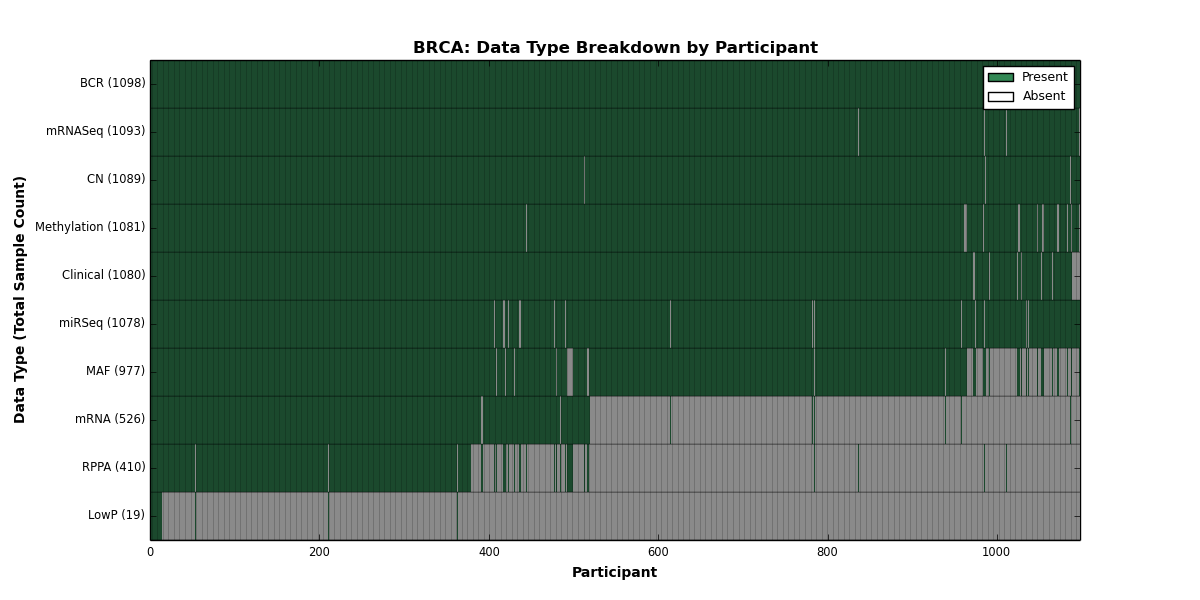
Figure 4. Get High-res Image This figure depicts the distribution of available data on a per participant basis.
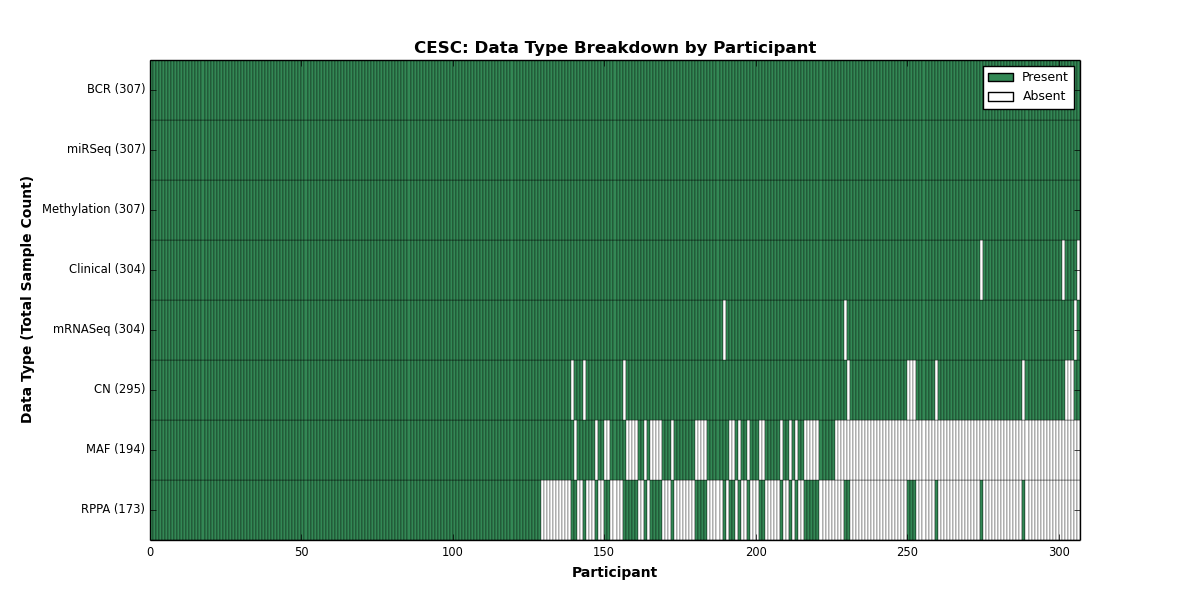
Figure 5. Get High-res Image This figure depicts the distribution of available data on a per participant basis.
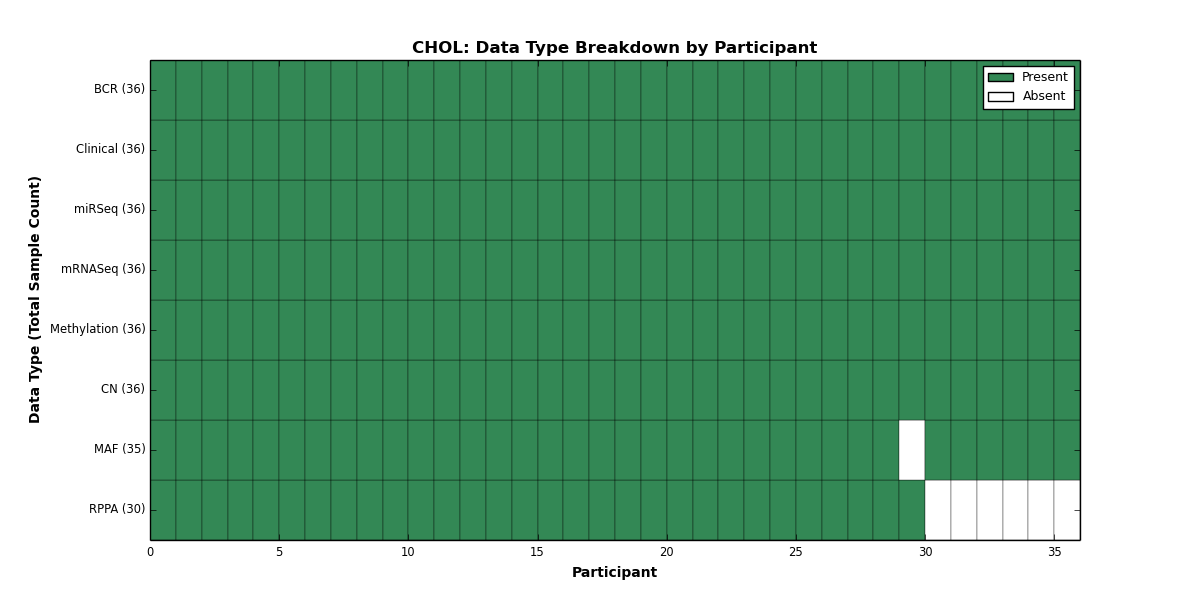
Figure 6. Get High-res Image This figure depicts the distribution of available data on a per participant basis.
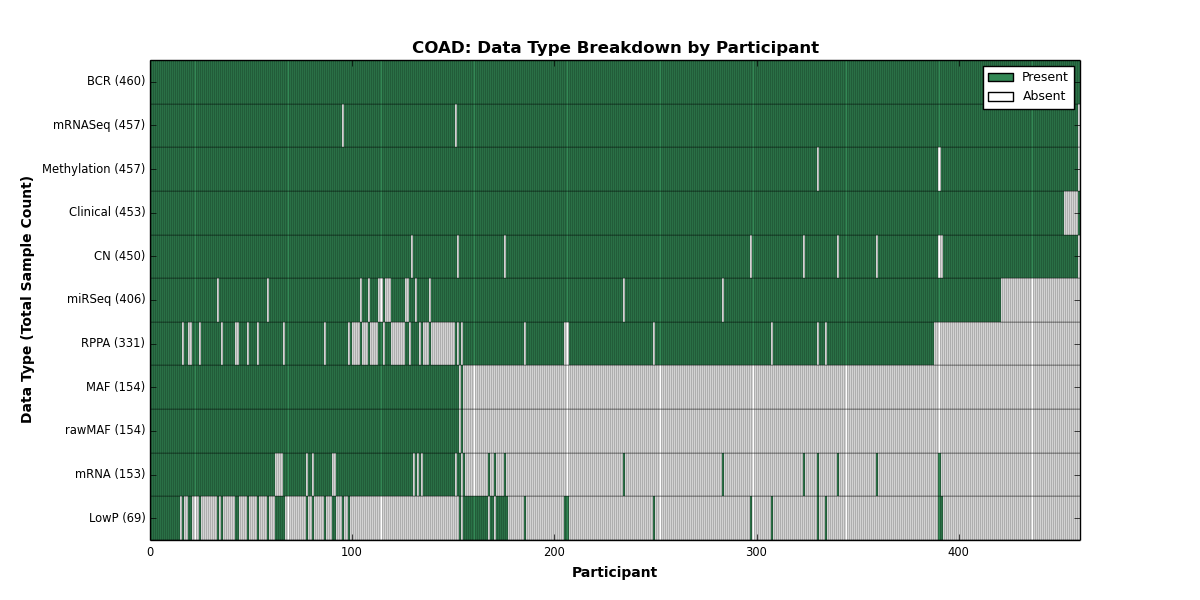
Figure 7. Get High-res Image This figure depicts the distribution of available data on a per participant basis.
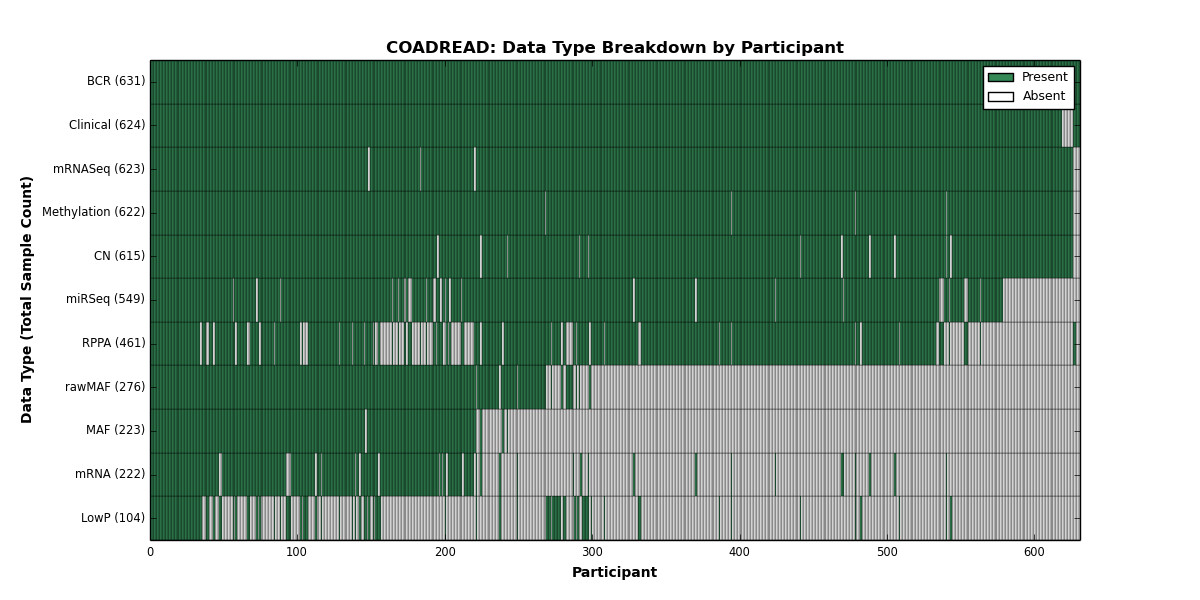
Figure 8. Get High-res Image This figure depicts the distribution of available data on a per participant basis.
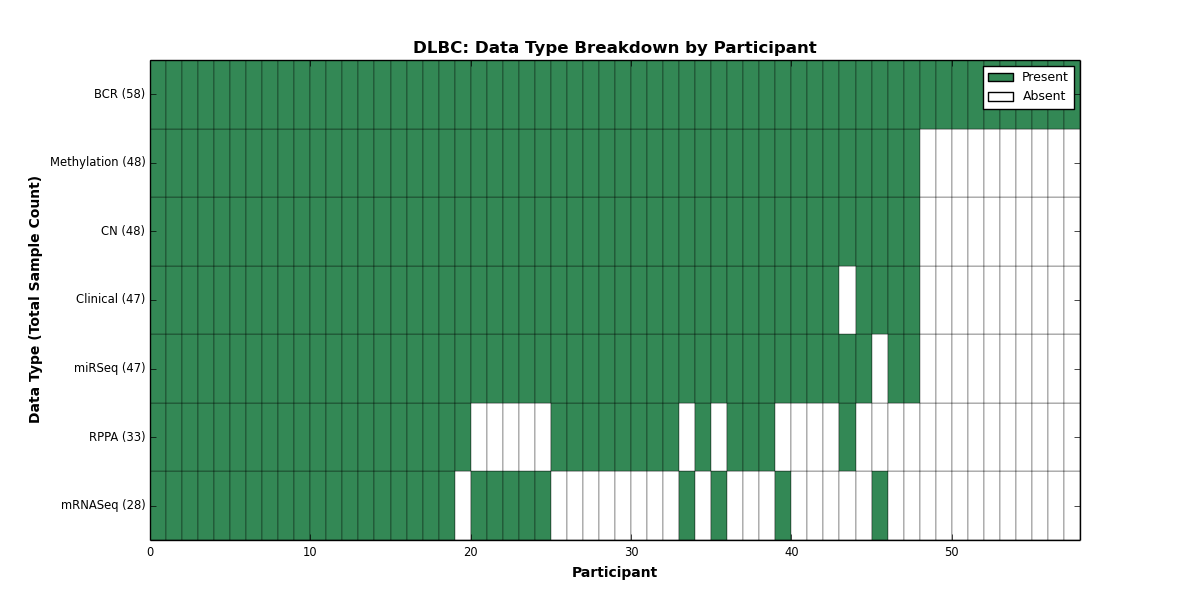
Figure 9. Get High-res Image This figure depicts the distribution of available data on a per participant basis.
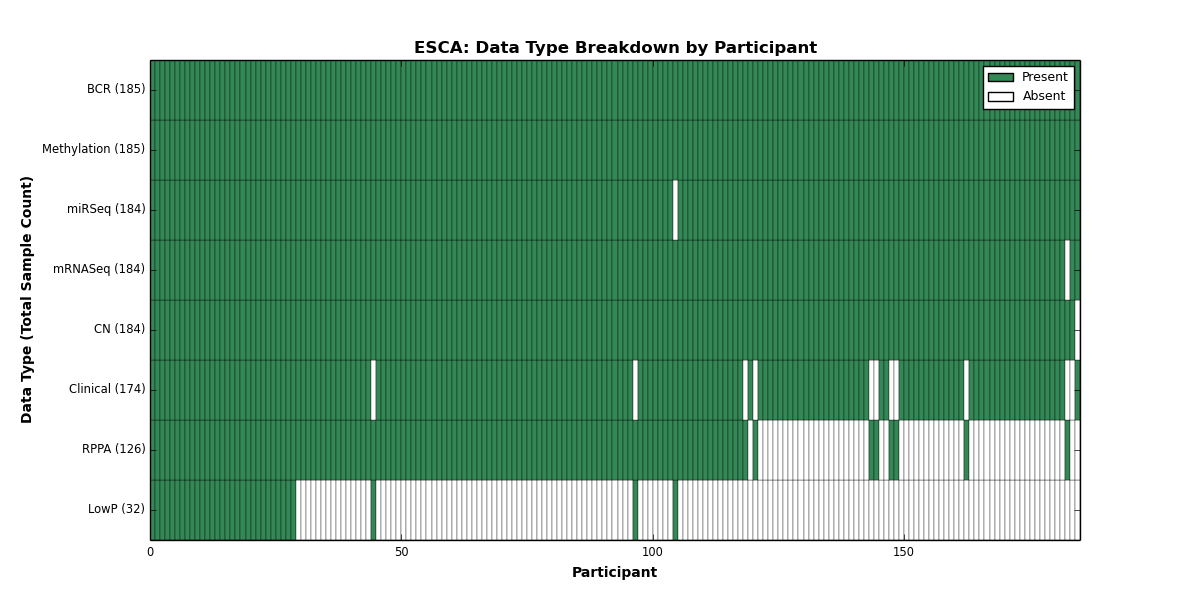
Figure 10. Get High-res Image This figure depicts the distribution of available data on a per participant basis.
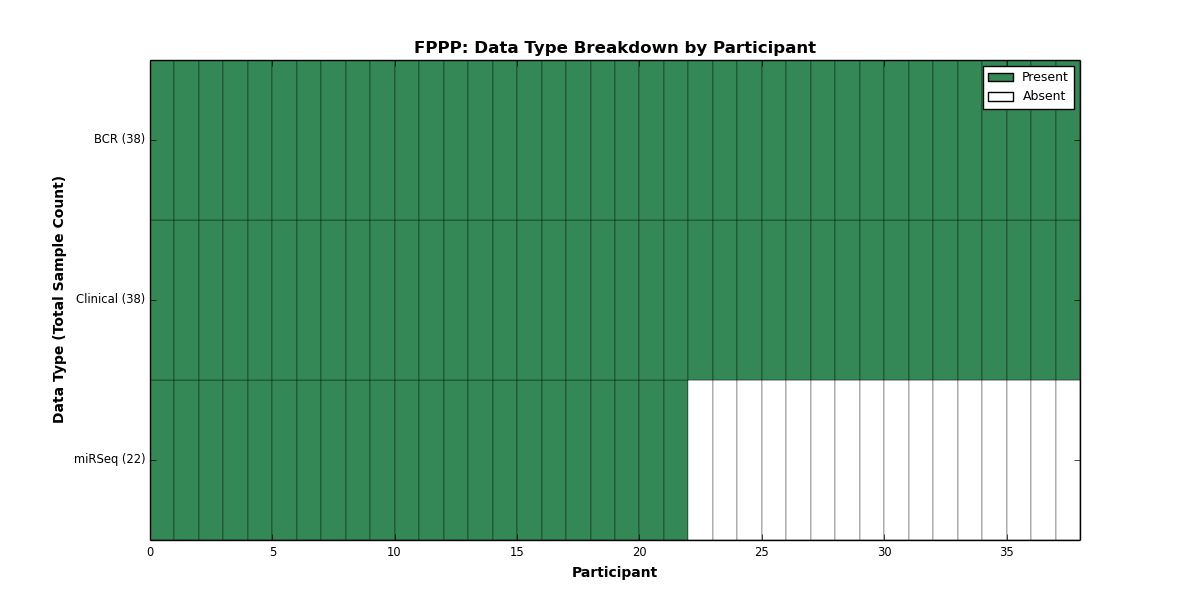
Figure 11. Get High-res Image This figure depicts the distribution of available data on a per participant basis.
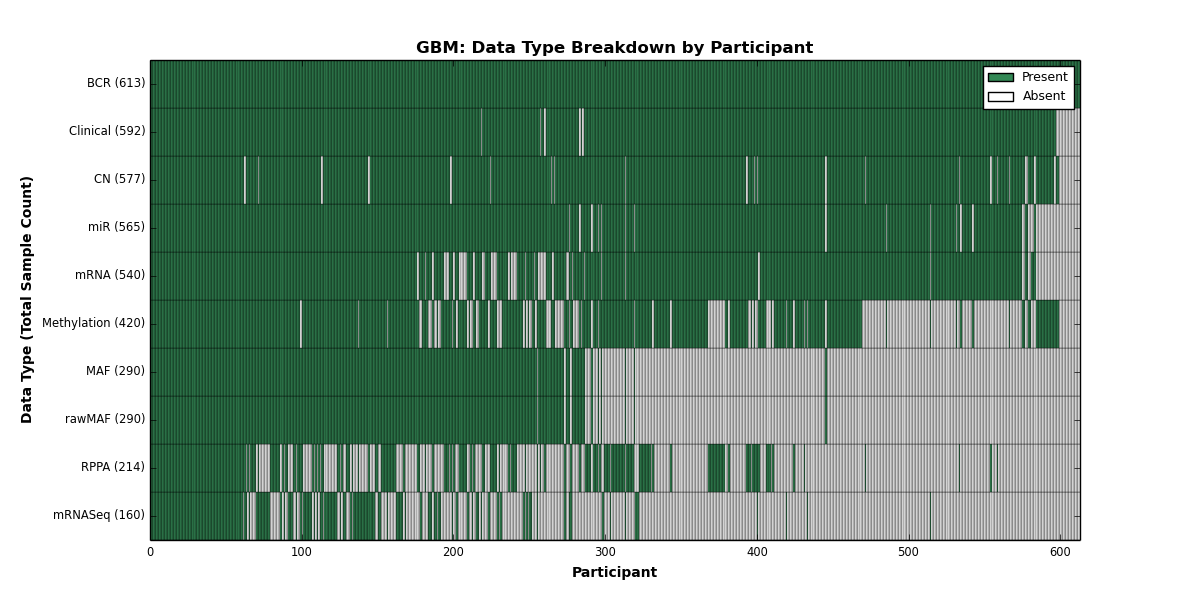
Figure 12. Get High-res Image This figure depicts the distribution of available data on a per participant basis.
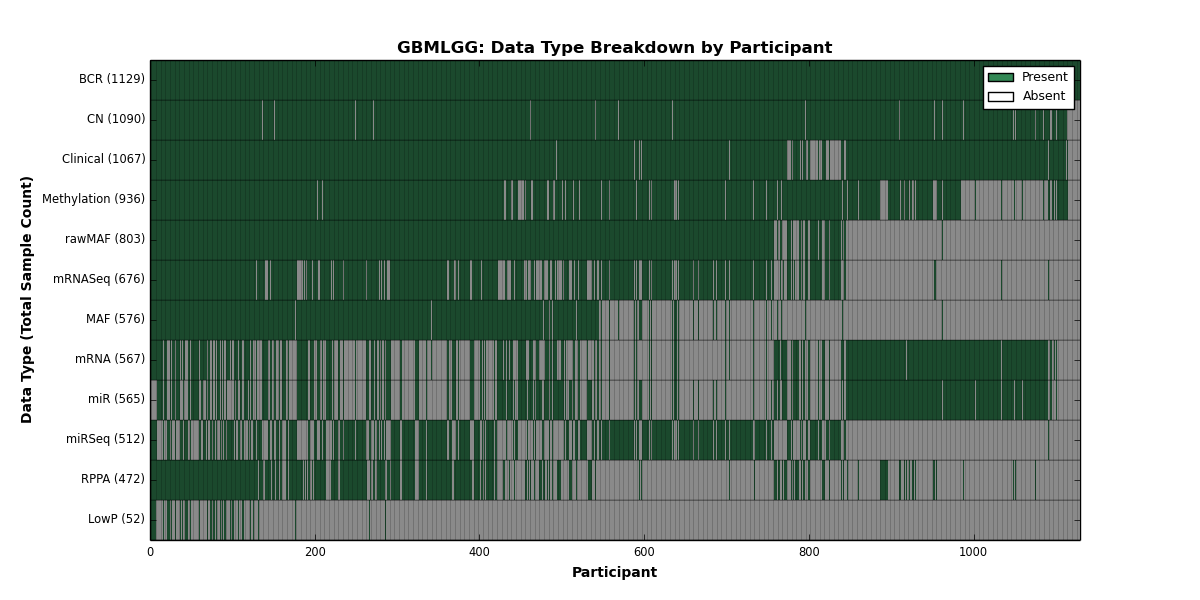
Figure 13. Get High-res Image This figure depicts the distribution of available data on a per participant basis.
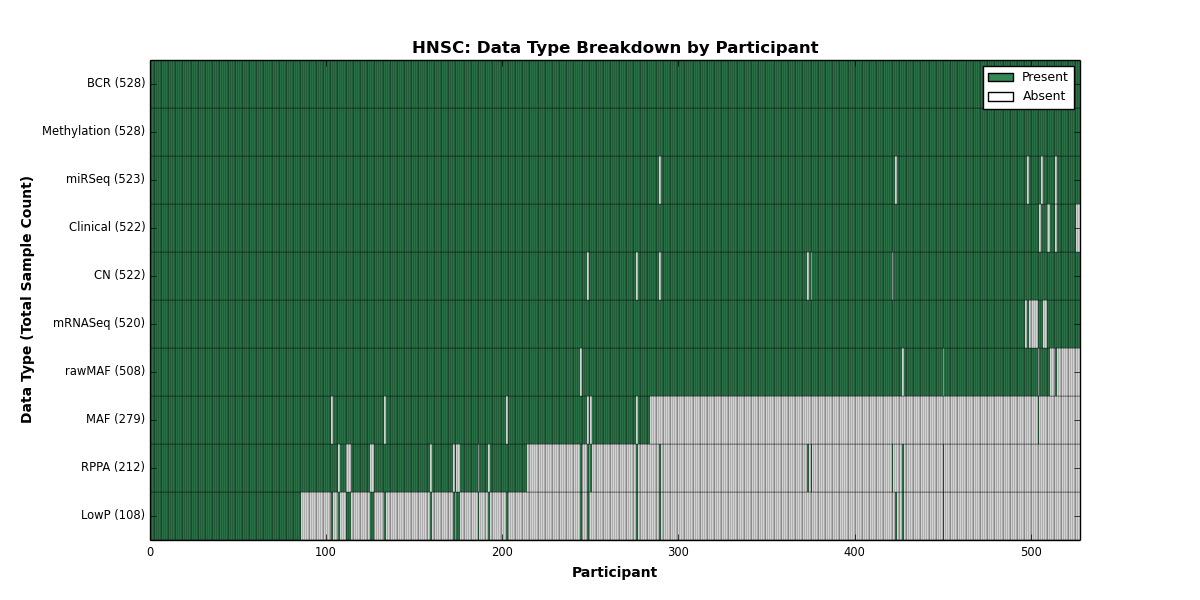
Figure 14. Get High-res Image This figure depicts the distribution of available data on a per participant basis.
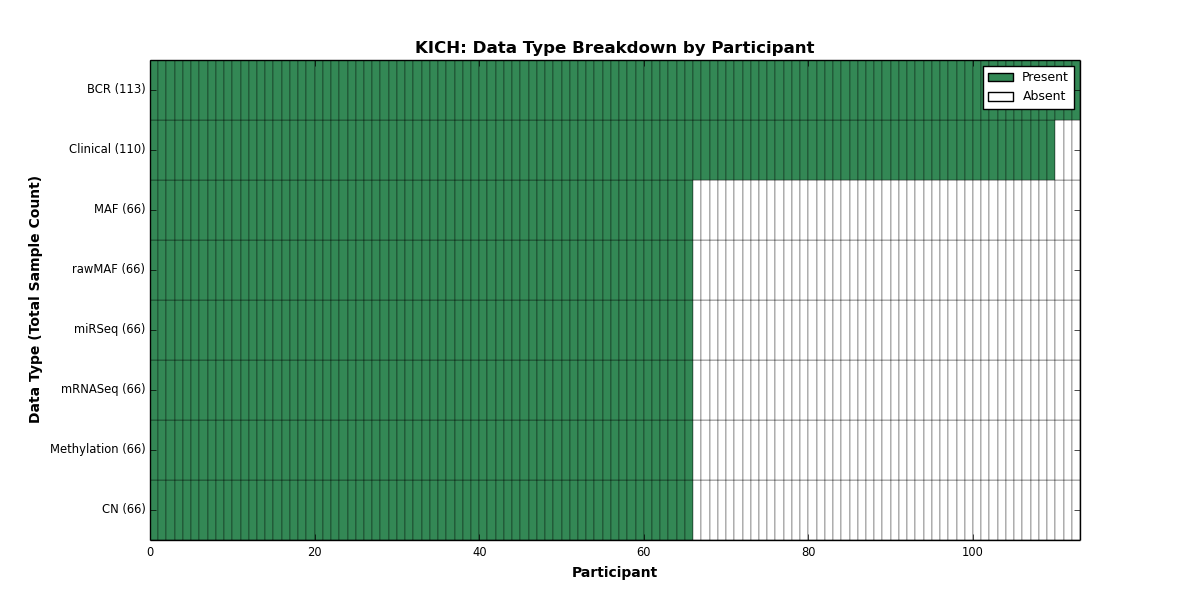
Figure 15. Get High-res Image This figure depicts the distribution of available data on a per participant basis.
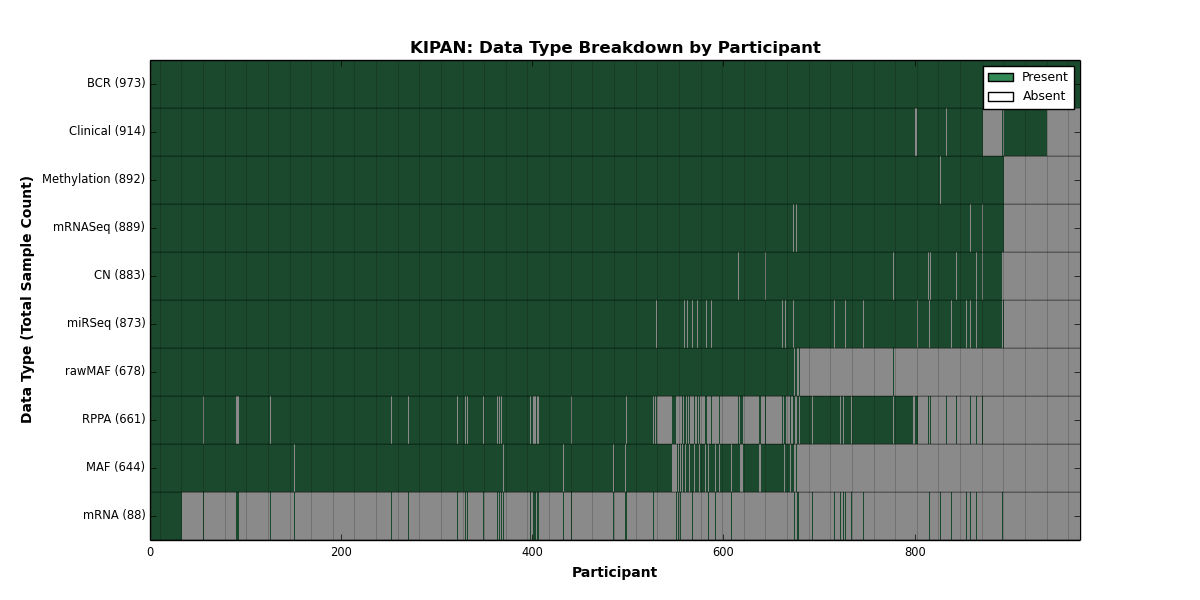
Figure 16. Get High-res Image This figure depicts the distribution of available data on a per participant basis.
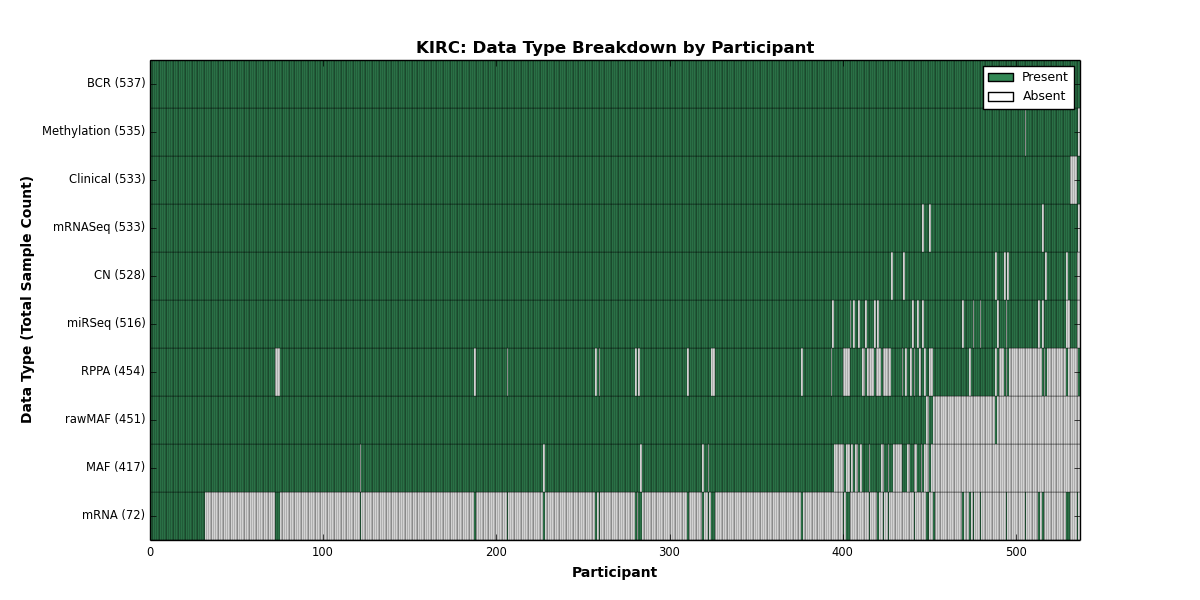
Figure 17. Get High-res Image This figure depicts the distribution of available data on a per participant basis.
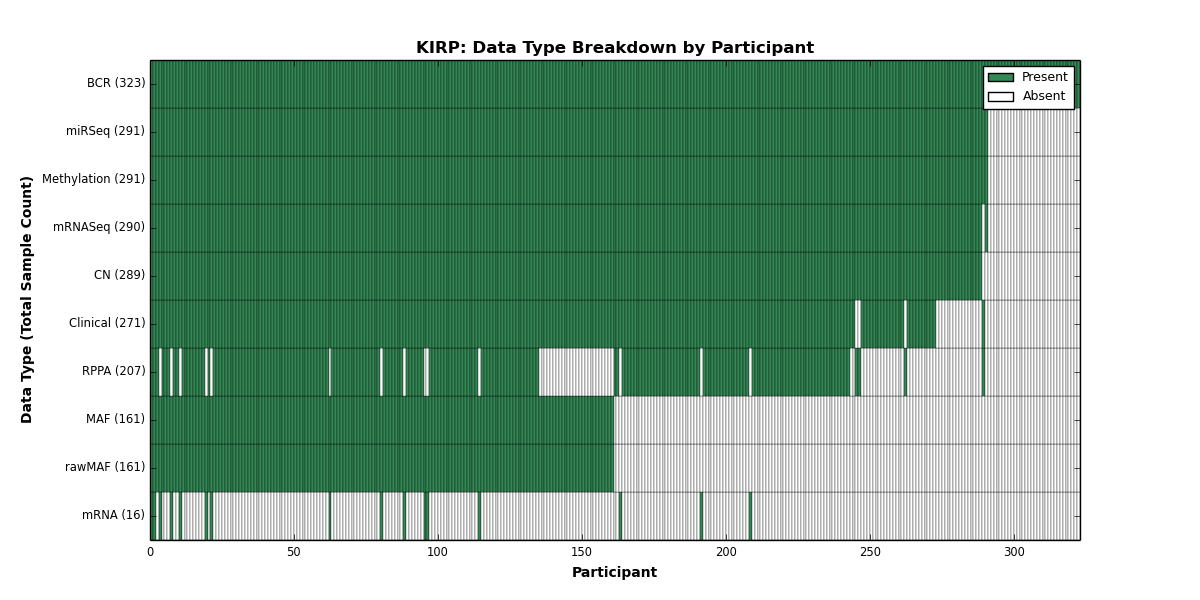
Figure 18. Get High-res Image This figure depicts the distribution of available data on a per participant basis.
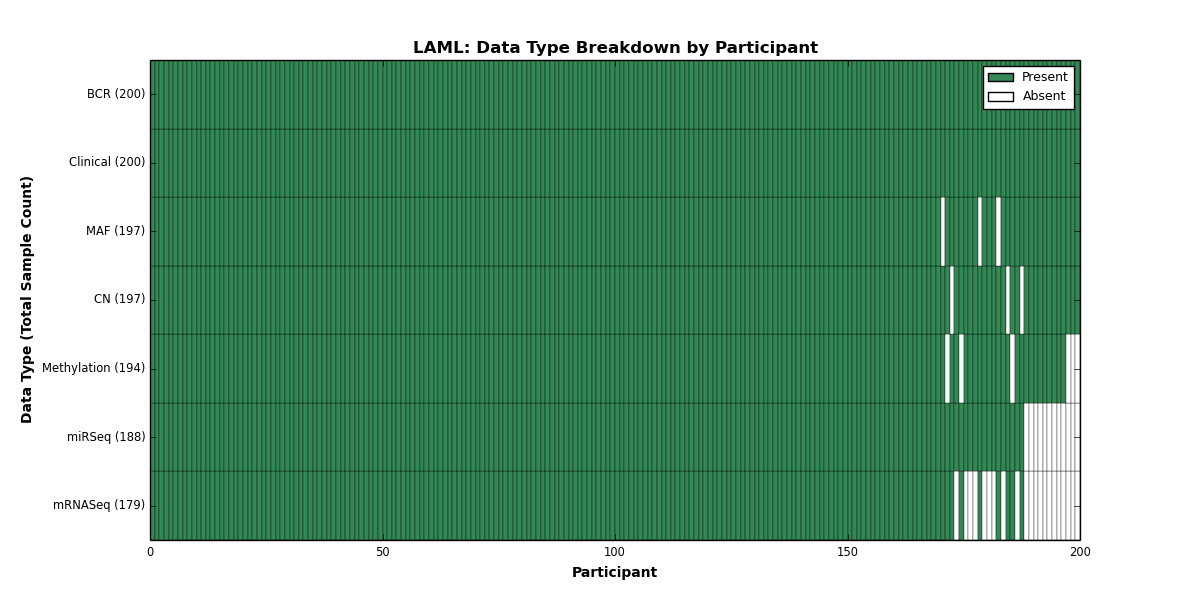
Figure 19. Get High-res Image This figure depicts the distribution of available data on a per participant basis.
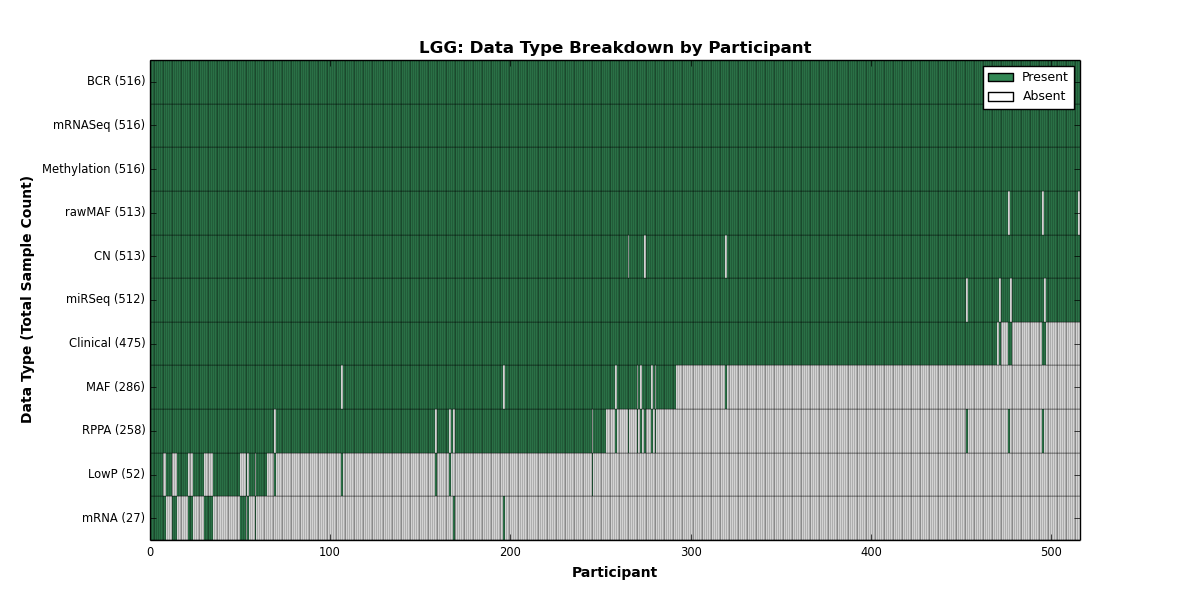
Figure 20. Get High-res Image This figure depicts the distribution of available data on a per participant basis.
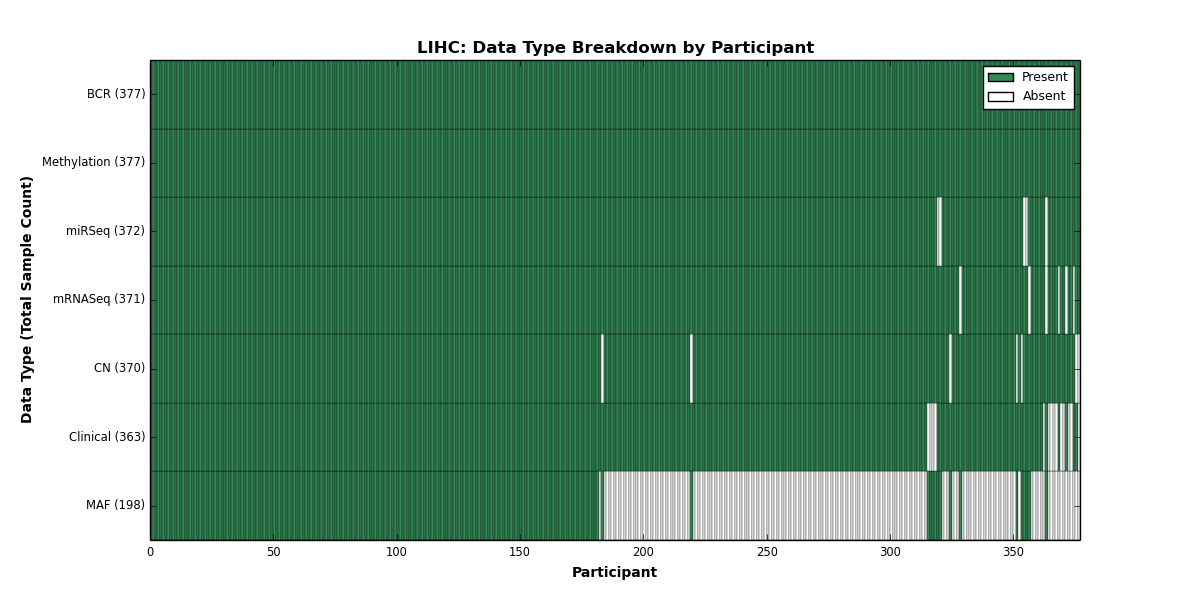
Figure 21. Get High-res Image This figure depicts the distribution of available data on a per participant basis.
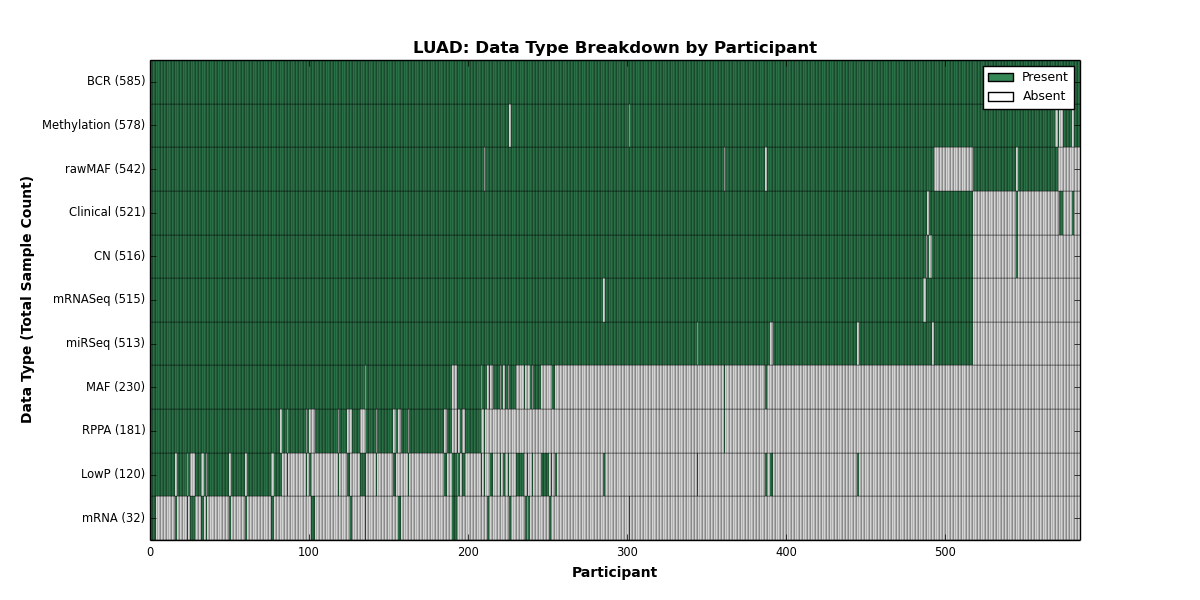
Figure 22. Get High-res Image This figure depicts the distribution of available data on a per participant basis.
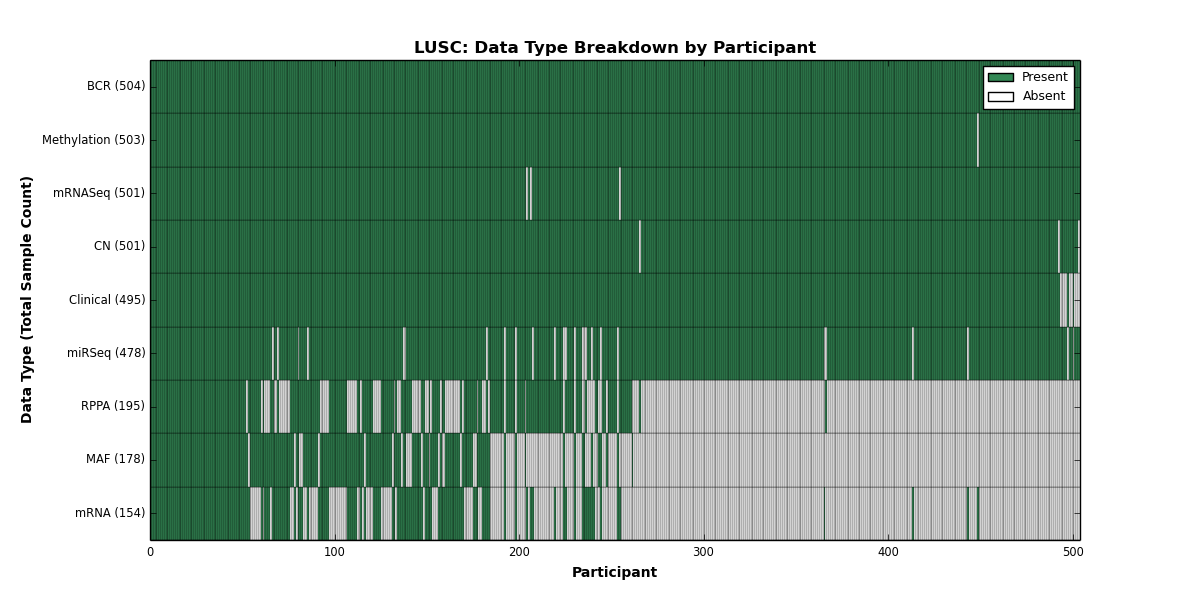
Figure 23. Get High-res Image This figure depicts the distribution of available data on a per participant basis.
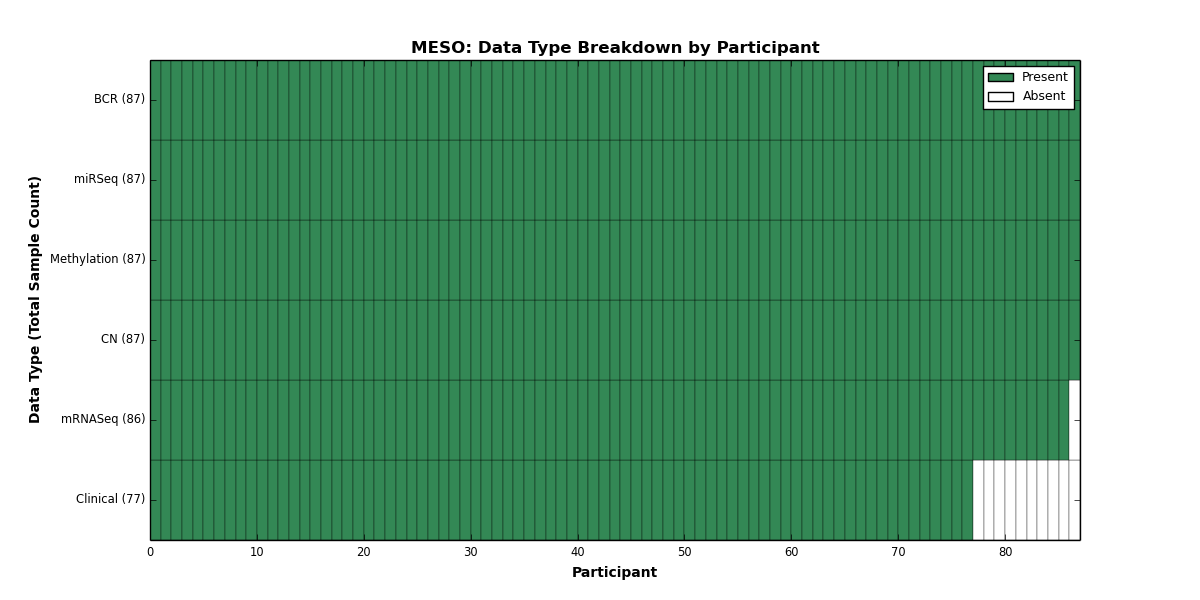
Figure 24. Get High-res Image This figure depicts the distribution of available data on a per participant basis.
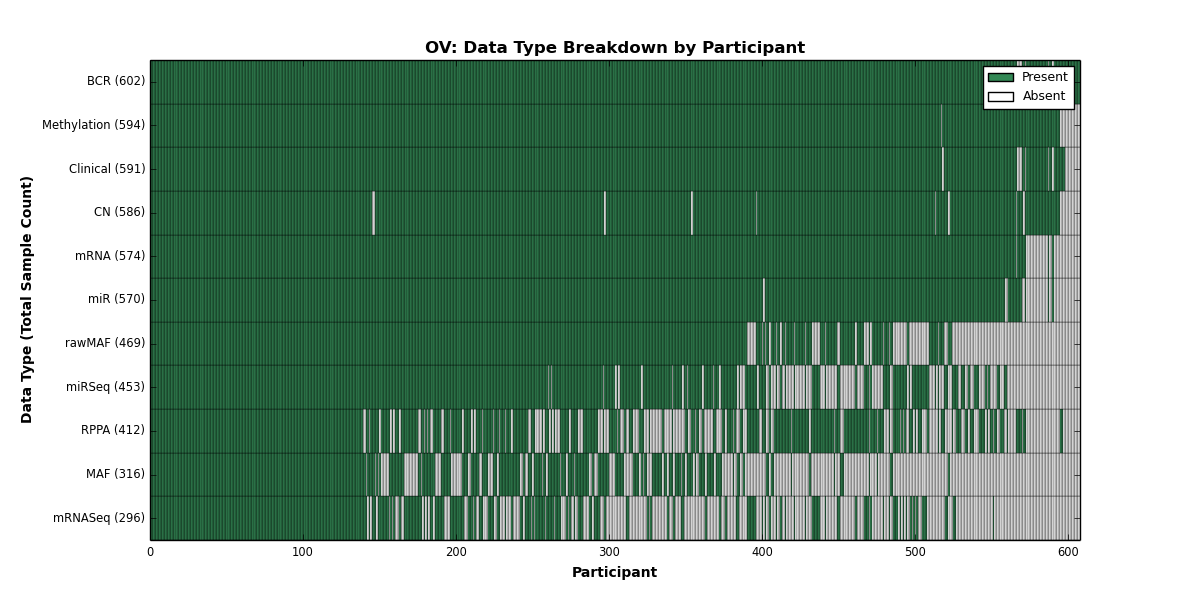
Figure 25. Get High-res Image This figure depicts the distribution of available data on a per participant basis.
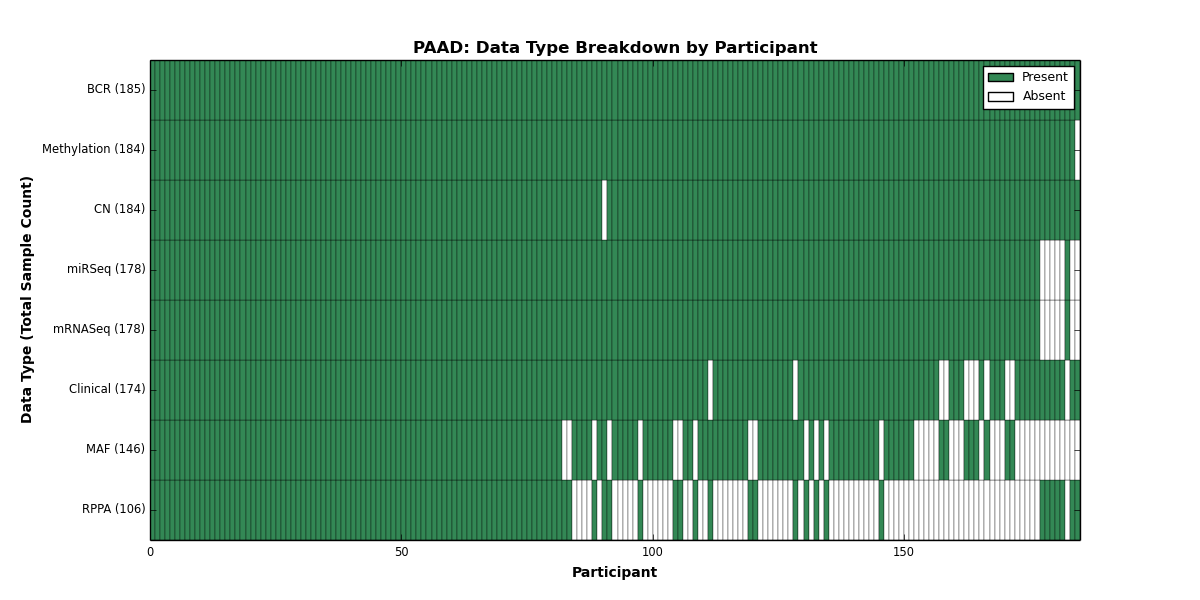
Figure 26. Get High-res Image This figure depicts the distribution of available data on a per participant basis.
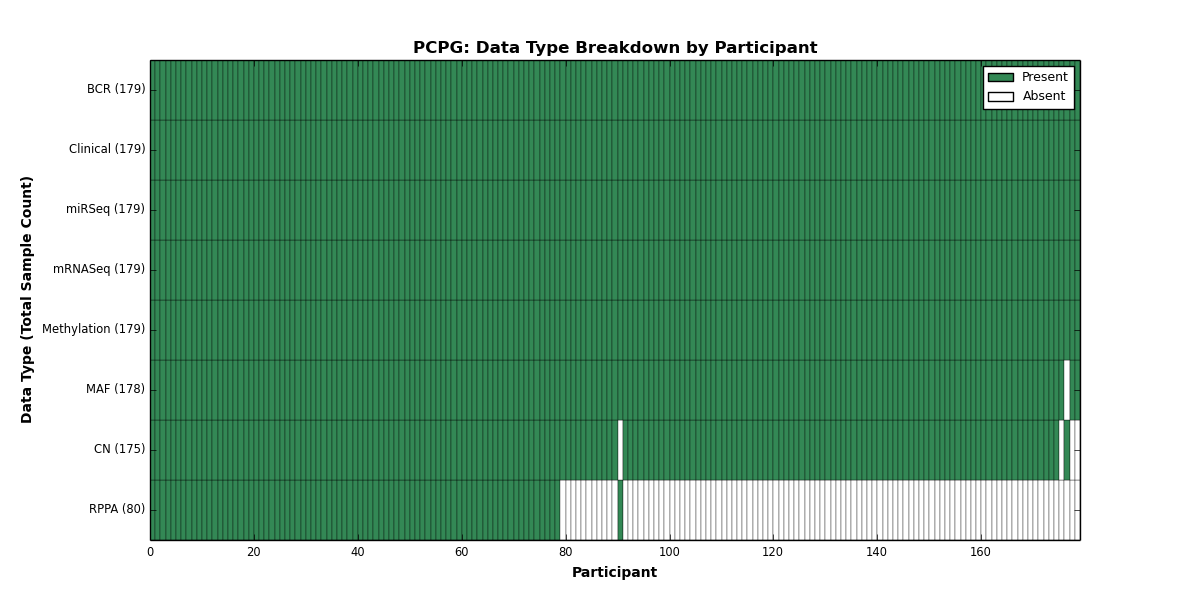
Figure 27. Get High-res Image This figure depicts the distribution of available data on a per participant basis.
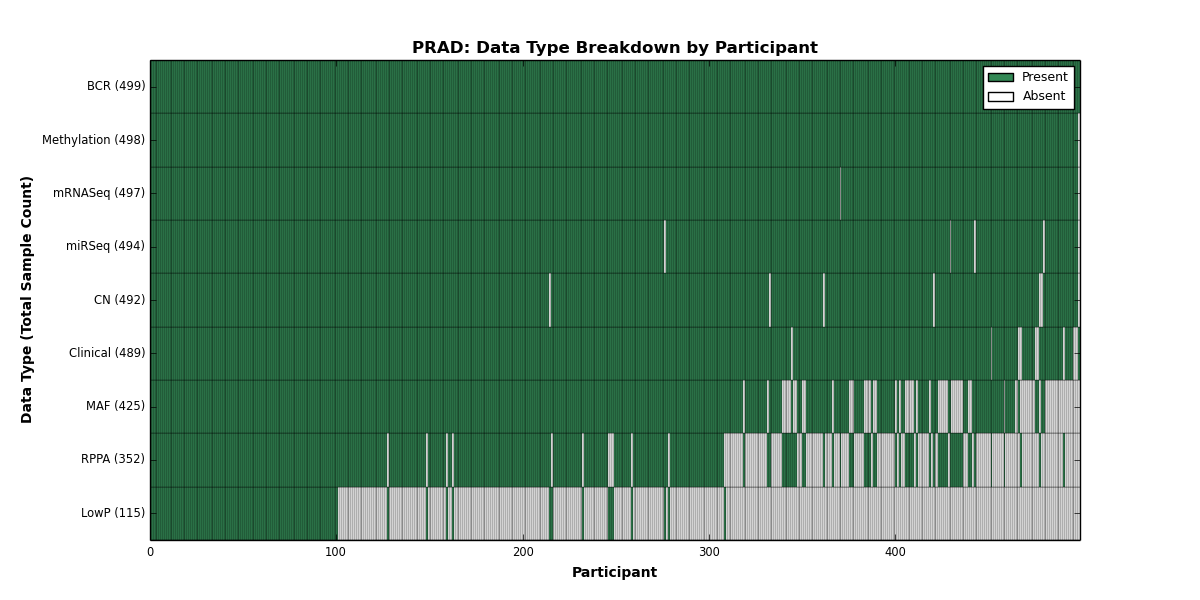
Figure 28. Get High-res Image This figure depicts the distribution of available data on a per participant basis.
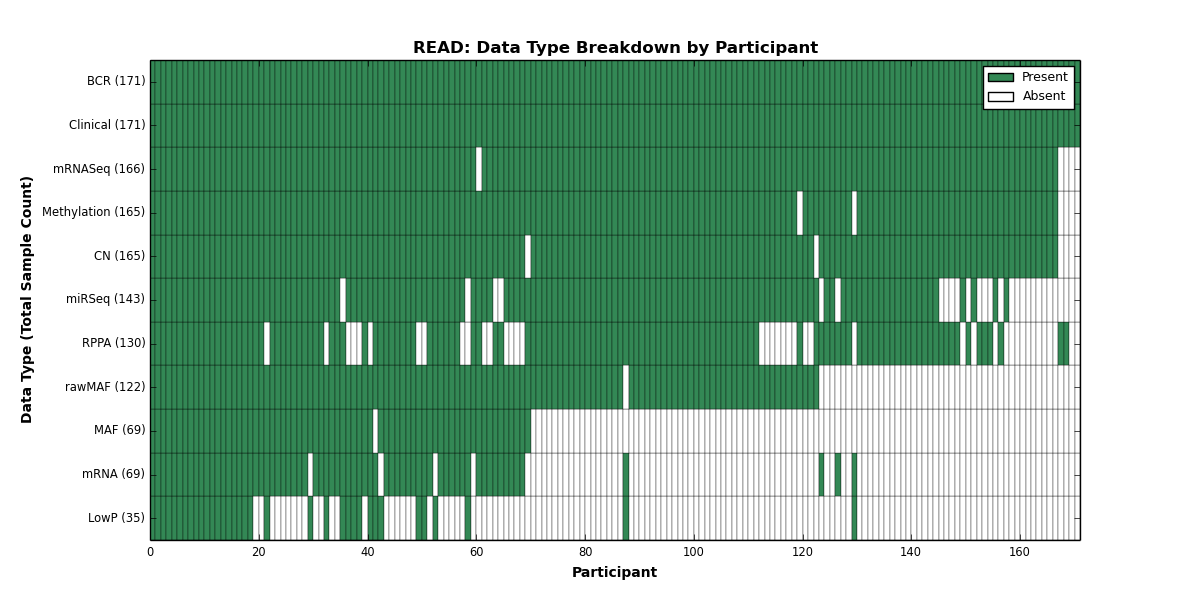
Figure 29. Get High-res Image This figure depicts the distribution of available data on a per participant basis.
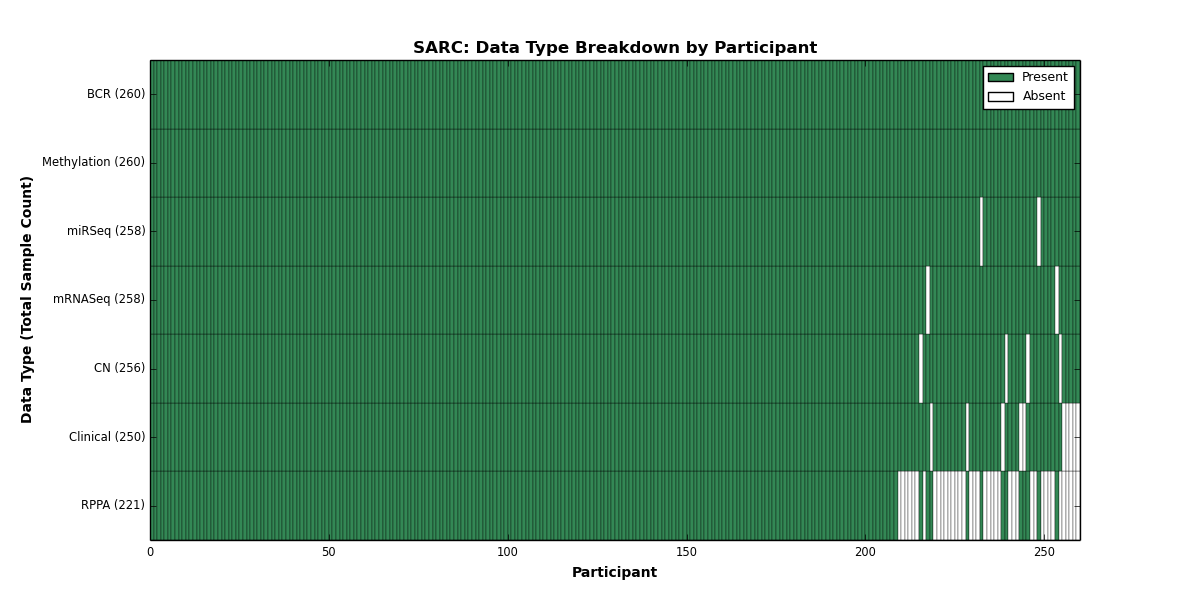
Figure 30. Get High-res Image This figure depicts the distribution of available data on a per participant basis.
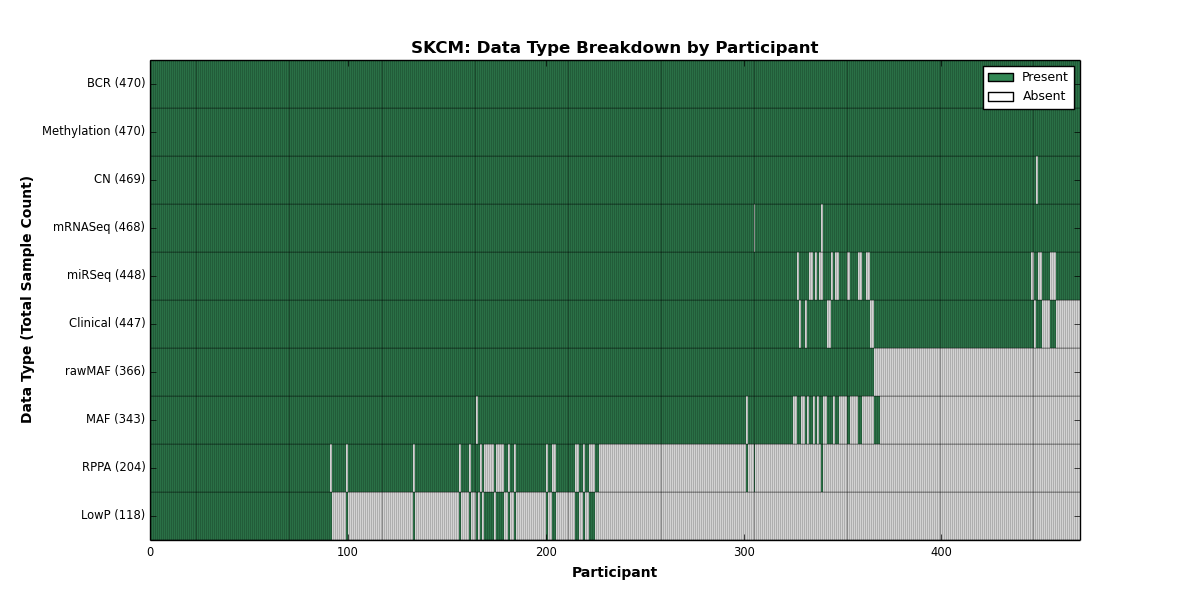
Figure 31. Get High-res Image This figure depicts the distribution of available data on a per participant basis.
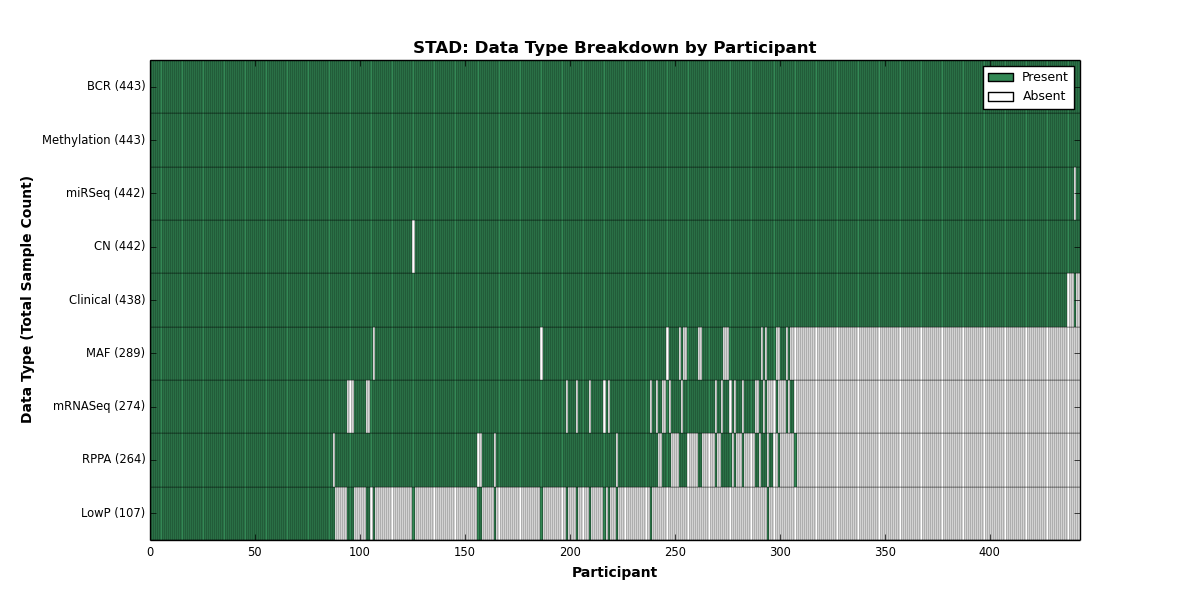
Figure 32. Get High-res Image This figure depicts the distribution of available data on a per participant basis.
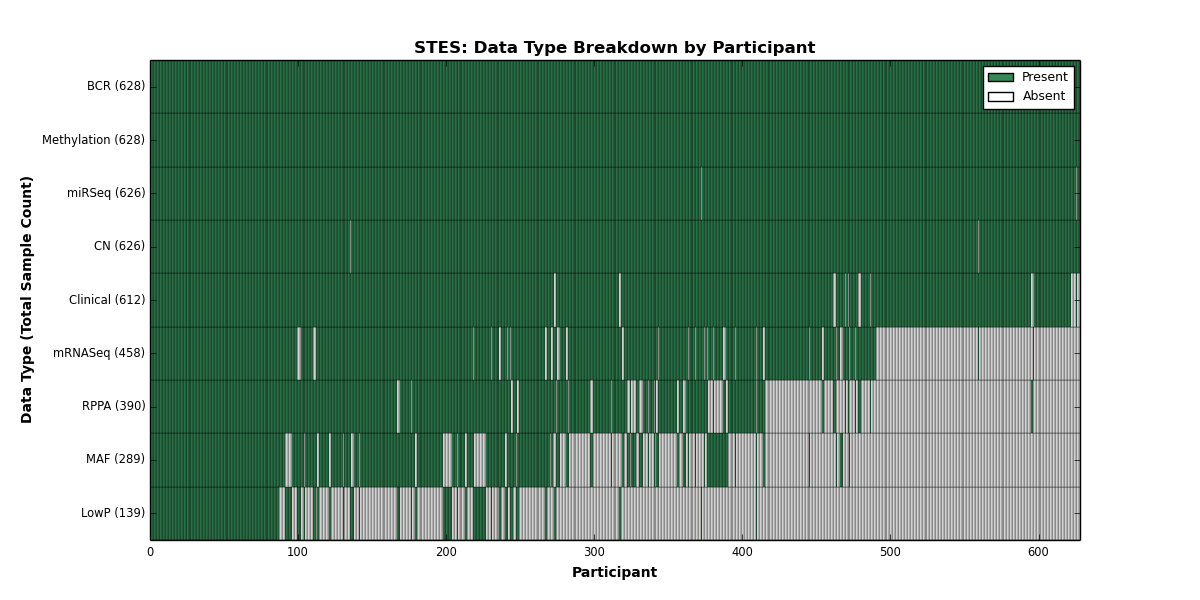
Figure 33. Get High-res Image This figure depicts the distribution of available data on a per participant basis.
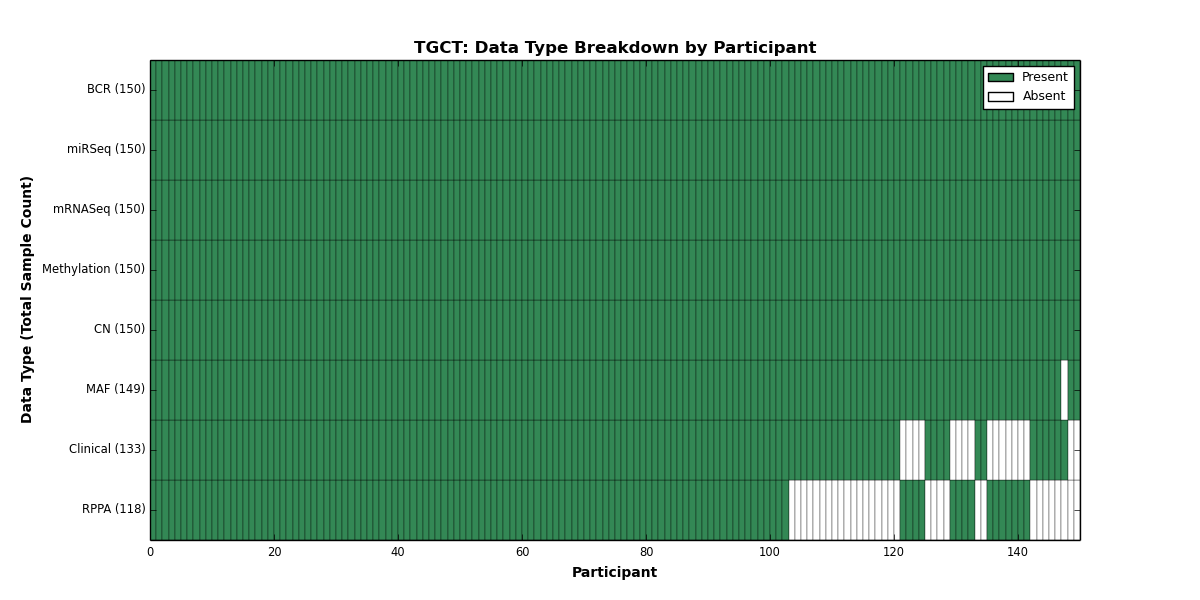
Figure 34. Get High-res Image This figure depicts the distribution of available data on a per participant basis.
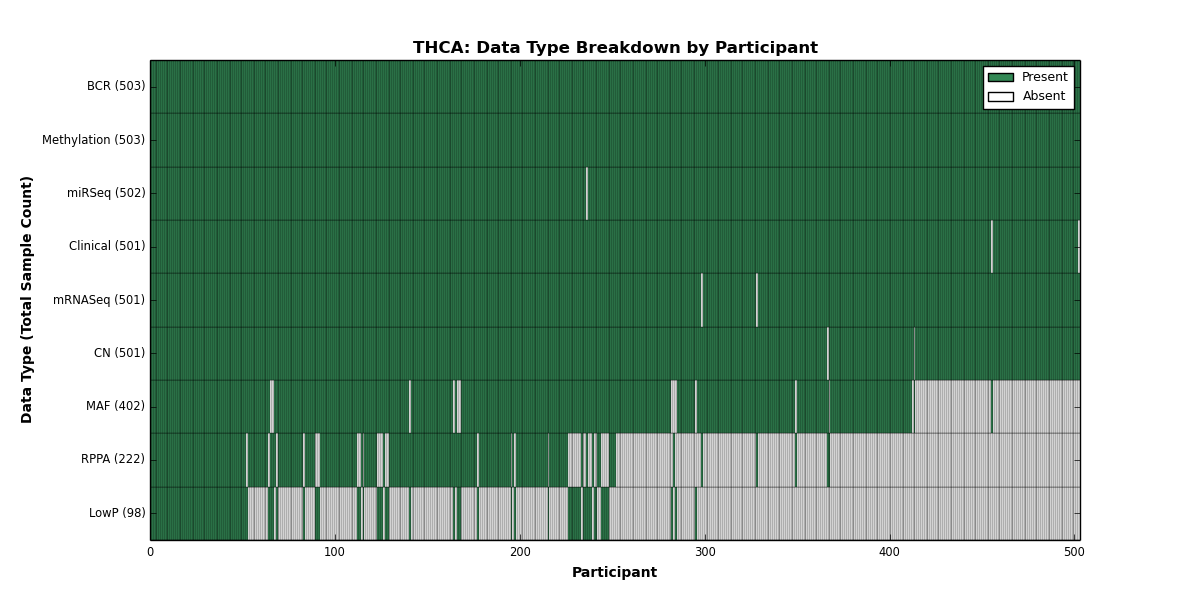
Figure 35. Get High-res Image This figure depicts the distribution of available data on a per participant basis.
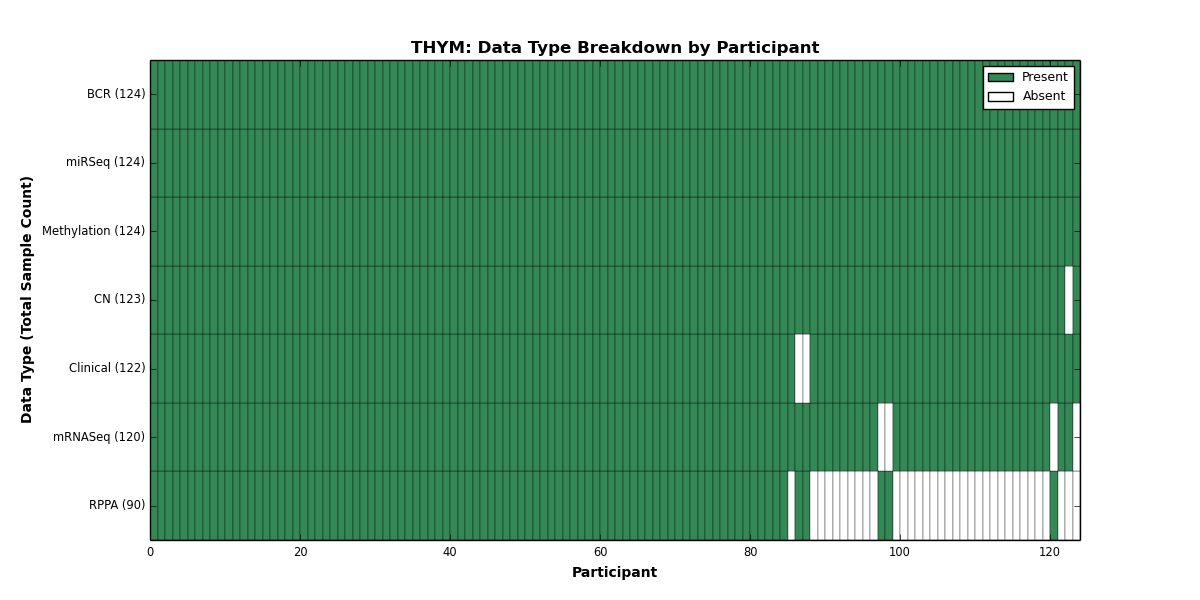
Figure 36. Get High-res Image This figure depicts the distribution of available data on a per participant basis.
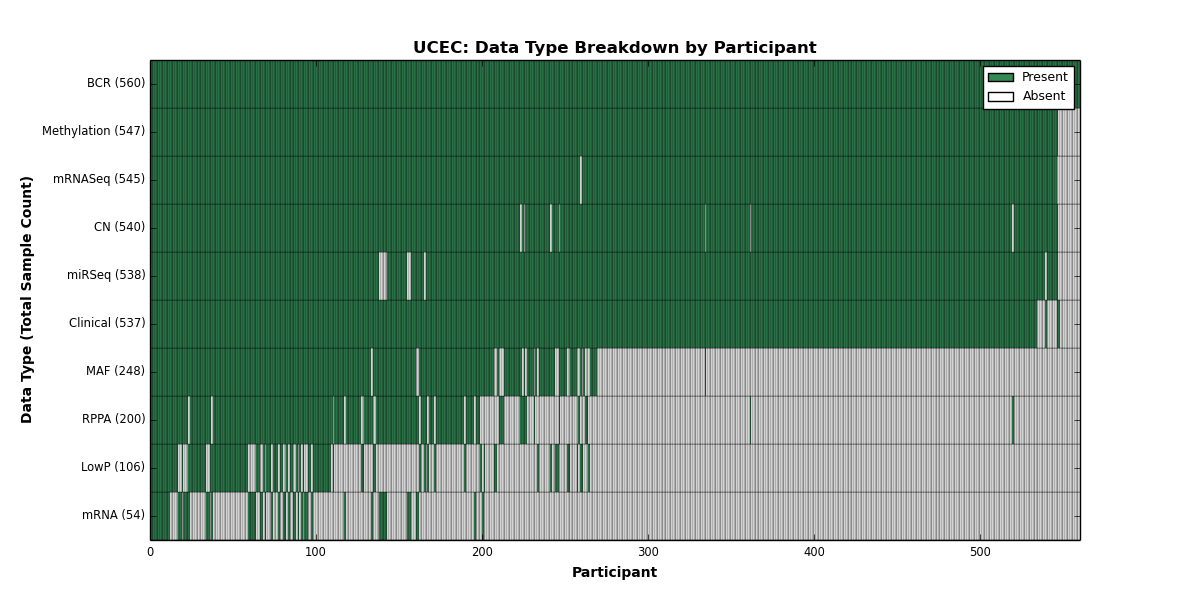
Figure 37. Get High-res Image This figure depicts the distribution of available data on a per participant basis.
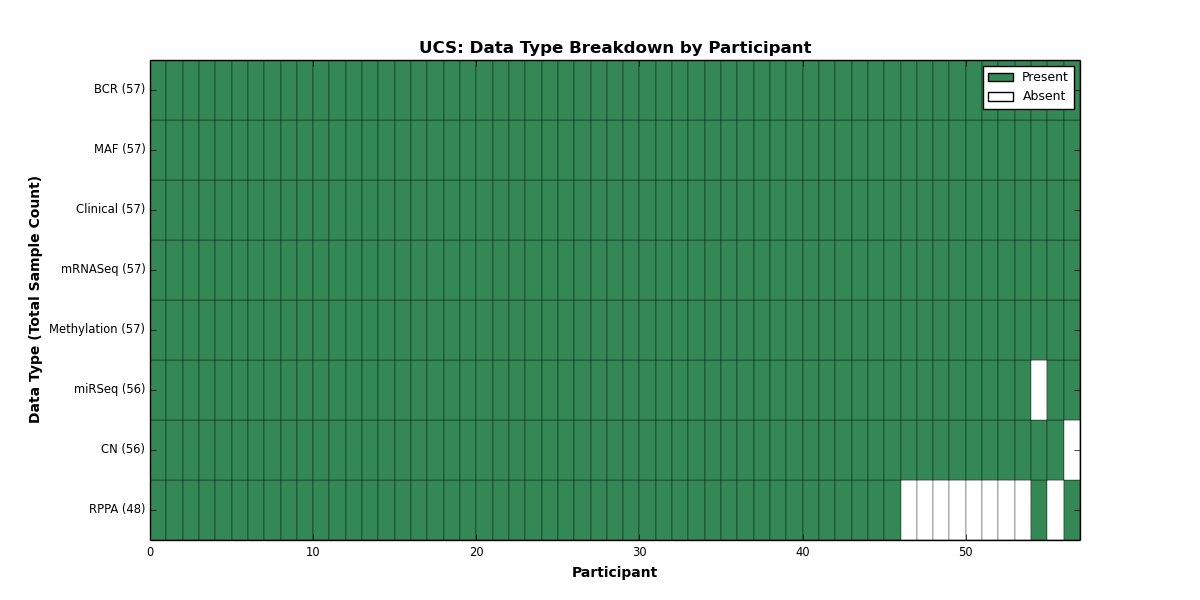
Figure 38. Get High-res Image This figure depicts the distribution of available data on a per participant basis.
Annotation data was taken from theTCGA Data Portalusing the query string:
https://tcga-data.nci.nih.gov/annotations/resources/searchannotations/json?item=TCGA
Redaction information was generated by filtering for the annotationClassificationName "Redaction"
FFPE information was generated by filtering for "FFPE" in annotation note text
Additional FFPEs were garnered from clinical data
Remaining annotations were sorted into sections by annotationClassificationName
The mRNA preprocess median module chooses the matrix for the platform(Affymetrix HG U133, Affymetrix Exon Array and Agilent Gene Expression) with the largest number of samples.
The mRNAseq preprocessor picks the "scaled_estimate" (RSEM) value from Illumina HiSeq/GA2 mRNAseq level_3 (v2) data set and makes the mRNAseq matrix with log2 transformed for the downstream analysis. If there are overlap samples between two different platforms, samples from illumina hiseq will be selected. The pipeline also creates the matrix with RPKM and log2 transform from HiSeq/GA2 mRNAseq level 3 (v1) data set.
The miRseq preprocessor picks the "RPM" (reads per million miRNA precursor reads) from the Illumina HiSeq/GA miRseq Level_3 data set and makes the matrix with log2 transformed values.
The methylation preprocessor filters methylation data for use in downstream pipelines. To learn more about this preprocessor, please visit the documentation.