This pipeline computes the correlation between cancer subtypes identified by different molecular patterns and selected clinical features.
Testing the association between subtypes identified by 4 different clustering approaches and 8 clinical features across 259 patients, one significant finding detected with P value < 0.05.
-
CNMF clustering analysis on sequencing-based mRNA expression data identified 3 subtypes that do not correlate to any clinical features.
-
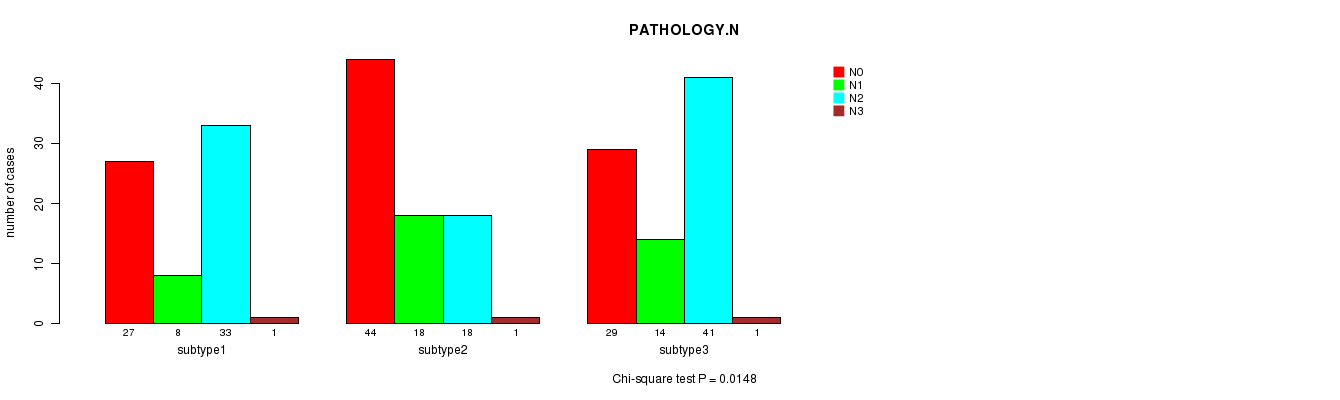
Consensus hierarchical clustering analysis on sequencing-based mRNA expression data identified 3 subtypes that correlate to 'PATHOLOGY.N'.
-
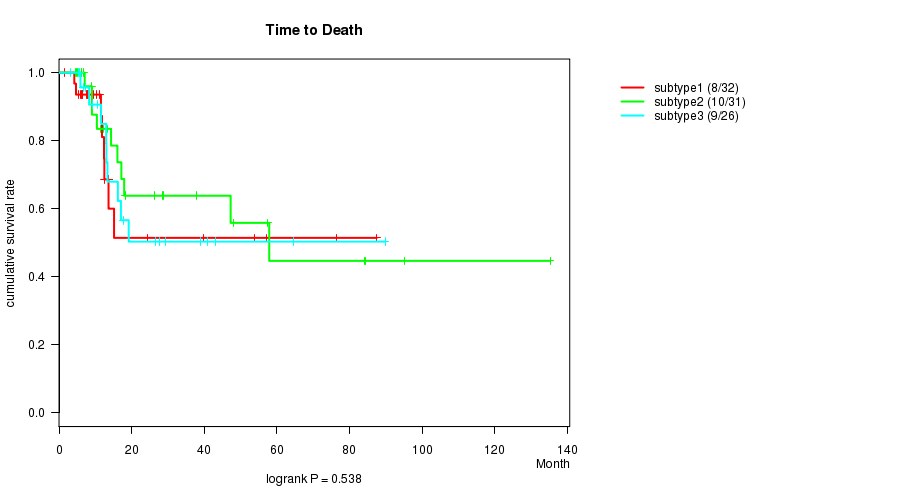
CNMF clustering analysis on sequencing-based miR expression data identified 3 subtypes that do not correlate to any clinical features.
-
Consensus hierarchical clustering analysis on sequencing-based miR expression data identified 3 subtypes that do not correlate to any clinical features.
Table 1. Get Full Table Overview of the association between subtypes identified by 4 different clustering approaches and 8 clinical features. Shown in the table are P values from statistical tests. Thresholded by P value < 0.05, one significant finding detected.
|
Clinical Features |
Statistical Tests |
RNAseq CNMF subtypes |
RNAseq cHierClus subtypes |
MIRseq CNMF subtypes |
MIRseq cHierClus subtypes |
| Time to Death | logrank test | 0.182 | 0.0678 | 0.538 | 0.481 |
| AGE | ANOVA | 0.483 | 0.245 | 0.511 | 0.247 |
| GENDER | Fisher's exact test | 0.31 | 0.124 | 0.275 | 0.237 |
| PATHOLOGY T | Chi-square test | 0.5 | 0.073 | 0.603 | 0.21 |
| PATHOLOGY N | Chi-square test | 0.136 | 0.0148 | 0.652 | 0.612 |
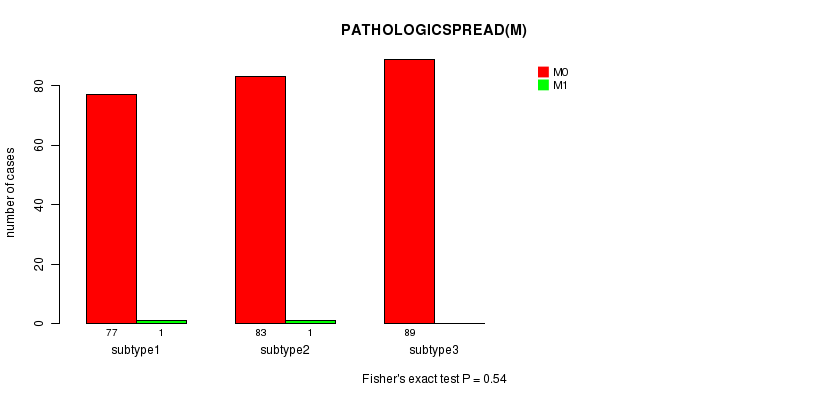
| PATHOLOGICSPREAD(M) | Fisher's exact test | 1 | 0.54 | 1 | 1 |
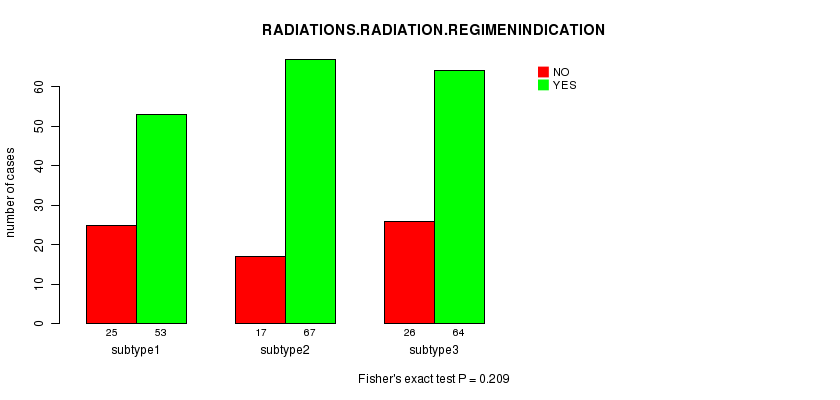
| RADIATIONS RADIATION REGIMENINDICATION | Fisher's exact test | 0.727 | 0.209 | 0.173 | 0.842 |
| NEOADJUVANT THERAPY | Fisher's exact test | 0.311 | 0.0851 | 0.507 | 0.631 |
Table S1. Get Full Table Description of clustering approach #1: 'RNAseq CNMF subtypes'
| Cluster Labels | 1 | 2 | 3 |
|---|---|---|---|
| Number of samples | 98 | 69 | 85 |
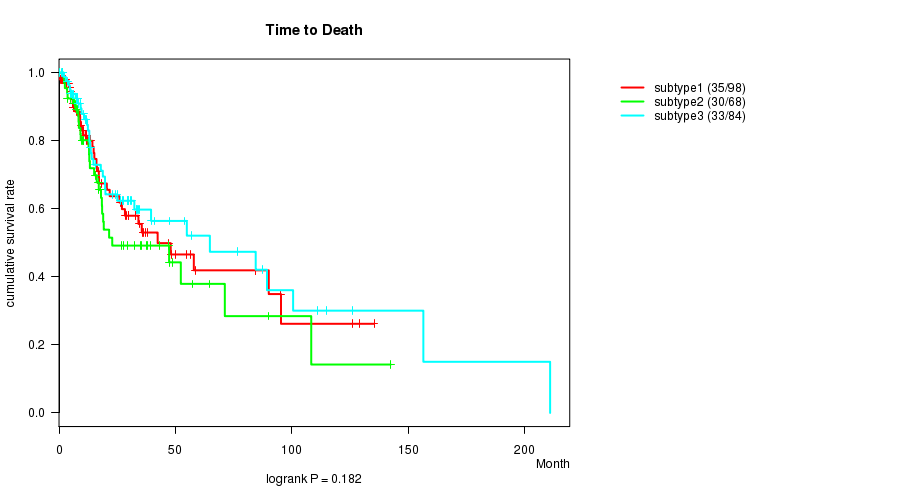
P value = 0.182 (logrank test)
Table S2. Clustering Approach #1: 'RNAseq CNMF subtypes' versus Clinical Feature #1: 'Time to Death'
| nPatients | nDeath | Duration Range (Median), Month | |
|---|---|---|---|
| ALL | 250 | 98 | 0.1 - 210.9 (13.8) |
| subtype1 | 98 | 35 | 0.1 - 135.3 (12.4) |
| subtype2 | 68 | 30 | 0.2 - 142.5 (15.4) |
| subtype3 | 84 | 33 | 0.1 - 210.9 (16.9) |
Figure S1. Get High-res Image Clustering Approach #1: 'RNAseq CNMF subtypes' versus Clinical Feature #1: 'Time to Death'
P value = 0.483 (ANOVA)
Table S3. Clustering Approach #1: 'RNAseq CNMF subtypes' versus Clinical Feature #2: 'AGE'
| nPatients | Mean (Std.Dev) | |
|---|---|---|
| ALL | 252 | 61.0 (12.1) |
| subtype1 | 98 | 62.2 (11.2) |
| subtype2 | 69 | 60.1 (12.4) |
| subtype3 | 85 | 60.4 (12.7) |
Figure S2. Get High-res Image Clustering Approach #1: 'RNAseq CNMF subtypes' versus Clinical Feature #2: 'AGE'

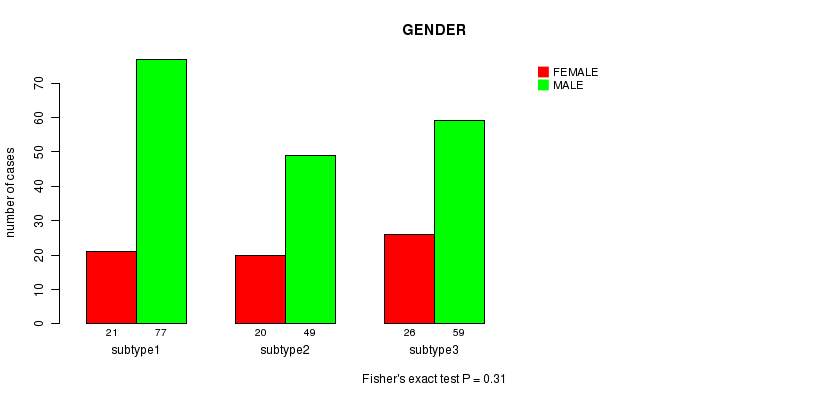
P value = 0.31 (Fisher's exact test)
Table S4. Clustering Approach #1: 'RNAseq CNMF subtypes' versus Clinical Feature #3: 'GENDER'
| nPatients | FEMALE | MALE |
|---|---|---|
| ALL | 185 | 67 |
| subtype1 | 77 | 21 |
| subtype2 | 49 | 20 |
| subtype3 | 59 | 26 |
Figure S3. Get High-res Image Clustering Approach #1: 'RNAseq CNMF subtypes' versus Clinical Feature #3: 'GENDER'
P value = 0.5 (Chi-square test)
Table S5. Clustering Approach #1: 'RNAseq CNMF subtypes' versus Clinical Feature #4: 'PATHOLOGY.T'
| nPatients | T1 | T2 | T3 | T4 |
|---|---|---|---|---|
| ALL | 16 | 70 | 65 | 91 |
| subtype1 | 3 | 27 | 30 | 31 |
| subtype2 | 6 | 21 | 15 | 26 |
| subtype3 | 7 | 22 | 20 | 34 |
Figure S4. Get High-res Image Clustering Approach #1: 'RNAseq CNMF subtypes' versus Clinical Feature #4: 'PATHOLOGY.T'

P value = 0.136 (Chi-square test)
Table S6. Clustering Approach #1: 'RNAseq CNMF subtypes' versus Clinical Feature #5: 'PATHOLOGY.N'
| nPatients | N0 | N1 | N2 | N3 |
|---|---|---|---|---|
| ALL | 100 | 40 | 92 | 3 |
| subtype1 | 40 | 11 | 36 | 1 |
| subtype2 | 20 | 12 | 33 | 1 |
| subtype3 | 40 | 17 | 23 | 1 |
Figure S5. Get High-res Image Clustering Approach #1: 'RNAseq CNMF subtypes' versus Clinical Feature #5: 'PATHOLOGY.N'

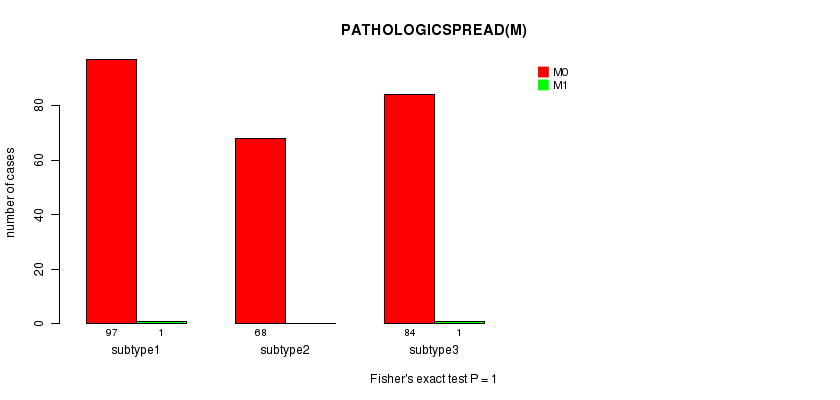
P value = 1 (Fisher's exact test)
Table S7. Clustering Approach #1: 'RNAseq CNMF subtypes' versus Clinical Feature #6: 'PATHOLOGICSPREAD(M)'
| nPatients | M0 | M1 |
|---|---|---|
| ALL | 249 | 2 |
| subtype1 | 97 | 1 |
| subtype2 | 68 | 0 |
| subtype3 | 84 | 1 |
Figure S6. Get High-res Image Clustering Approach #1: 'RNAseq CNMF subtypes' versus Clinical Feature #6: 'PATHOLOGICSPREAD(M)'
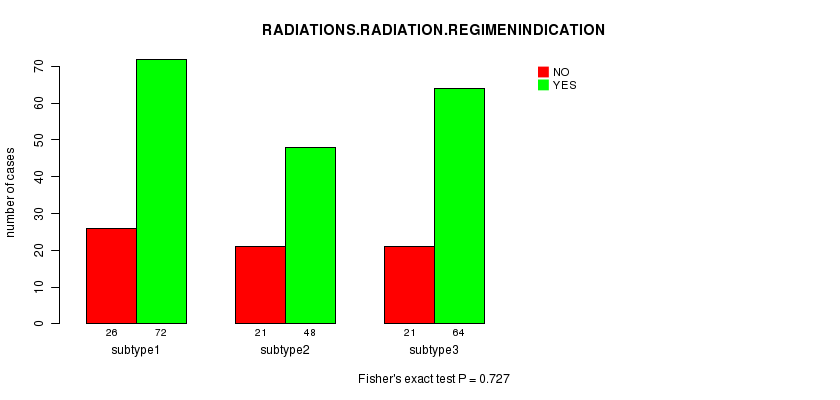
P value = 0.727 (Fisher's exact test)
Table S8. Clustering Approach #1: 'RNAseq CNMF subtypes' versus Clinical Feature #7: 'RADIATIONS.RADIATION.REGIMENINDICATION'
| nPatients | NO | YES |
|---|---|---|
| ALL | 184 | 68 |
| subtype1 | 72 | 26 |
| subtype2 | 48 | 21 |
| subtype3 | 64 | 21 |
Figure S7. Get High-res Image Clustering Approach #1: 'RNAseq CNMF subtypes' versus Clinical Feature #7: 'RADIATIONS.RADIATION.REGIMENINDICATION'
P value = 0.311 (Fisher's exact test)
Table S9. Clustering Approach #1: 'RNAseq CNMF subtypes' versus Clinical Feature #8: 'NEOADJUVANT.THERAPY'
| nPatients | NO | YES |
|---|---|---|
| ALL | 42 | 210 |
| subtype1 | 18 | 80 |
| subtype2 | 14 | 55 |
| subtype3 | 10 | 75 |
Figure S8. Get High-res Image Clustering Approach #1: 'RNAseq CNMF subtypes' versus Clinical Feature #8: 'NEOADJUVANT.THERAPY'
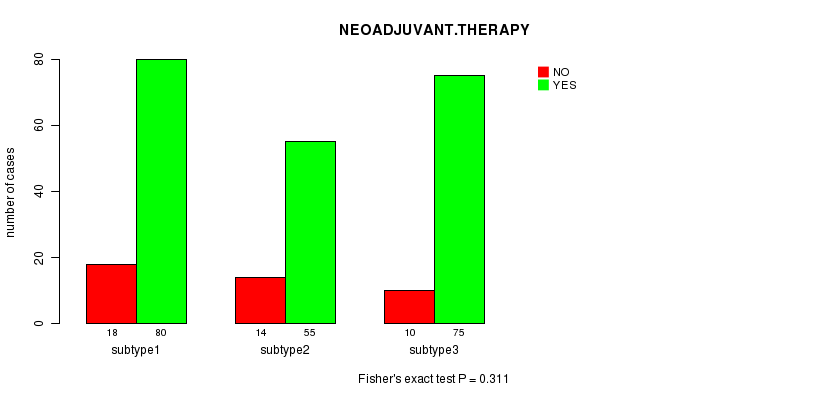
Table S10. Get Full Table Description of clustering approach #2: 'RNAseq cHierClus subtypes'
| Cluster Labels | 1 | 2 | 3 |
|---|---|---|---|
| Number of samples | 78 | 84 | 90 |
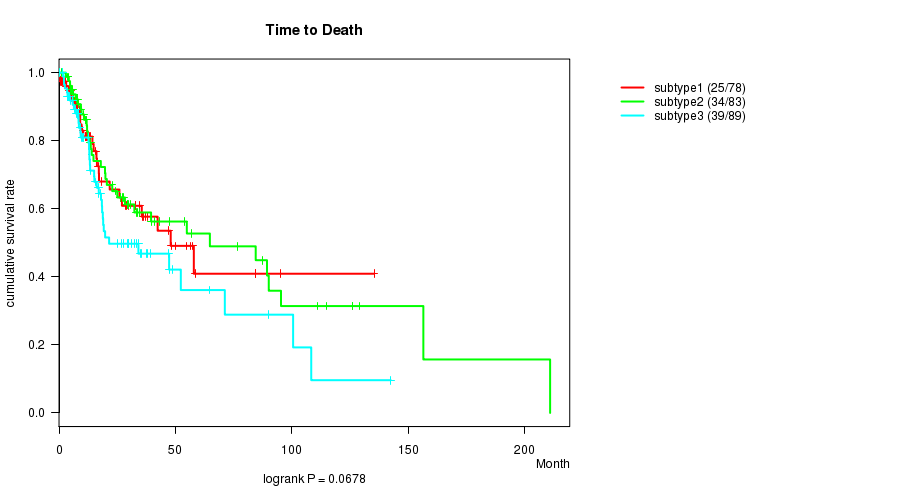
P value = 0.0678 (logrank test)
Table S11. Clustering Approach #2: 'RNAseq cHierClus subtypes' versus Clinical Feature #1: 'Time to Death'
| nPatients | nDeath | Duration Range (Median), Month | |
|---|---|---|---|
| ALL | 250 | 98 | 0.1 - 210.9 (13.8) |
| subtype1 | 78 | 25 | 0.1 - 135.3 (13.1) |
| subtype2 | 83 | 34 | 0.1 - 210.9 (17.9) |
| subtype3 | 89 | 39 | 0.2 - 142.5 (13.3) |
Figure S9. Get High-res Image Clustering Approach #2: 'RNAseq cHierClus subtypes' versus Clinical Feature #1: 'Time to Death'
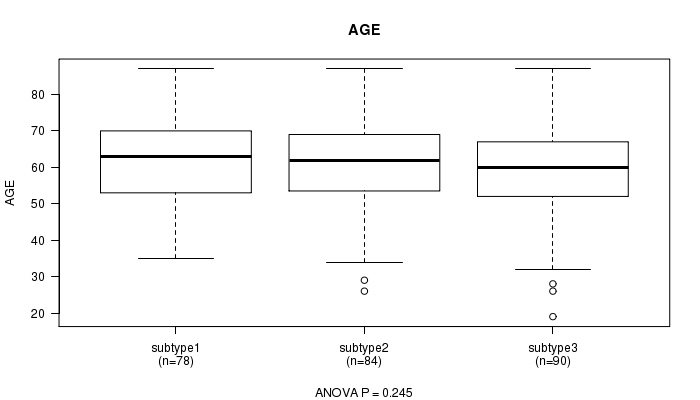
P value = 0.245 (ANOVA)
Table S12. Clustering Approach #2: 'RNAseq cHierClus subtypes' versus Clinical Feature #2: 'AGE'
| nPatients | Mean (Std.Dev) | |
|---|---|---|
| ALL | 252 | 61.0 (12.1) |
| subtype1 | 78 | 62.7 (11.2) |
| subtype2 | 84 | 61.1 (11.7) |
| subtype3 | 90 | 59.5 (13.0) |
Figure S10. Get High-res Image Clustering Approach #2: 'RNAseq cHierClus subtypes' versus Clinical Feature #2: 'AGE'
P value = 0.124 (Fisher's exact test)
Table S13. Clustering Approach #2: 'RNAseq cHierClus subtypes' versus Clinical Feature #3: 'GENDER'
| nPatients | FEMALE | MALE |
|---|---|---|
| ALL | 185 | 67 |
| subtype1 | 63 | 15 |
| subtype2 | 62 | 22 |
| subtype3 | 60 | 30 |
Figure S11. Get High-res Image Clustering Approach #2: 'RNAseq cHierClus subtypes' versus Clinical Feature #3: 'GENDER'

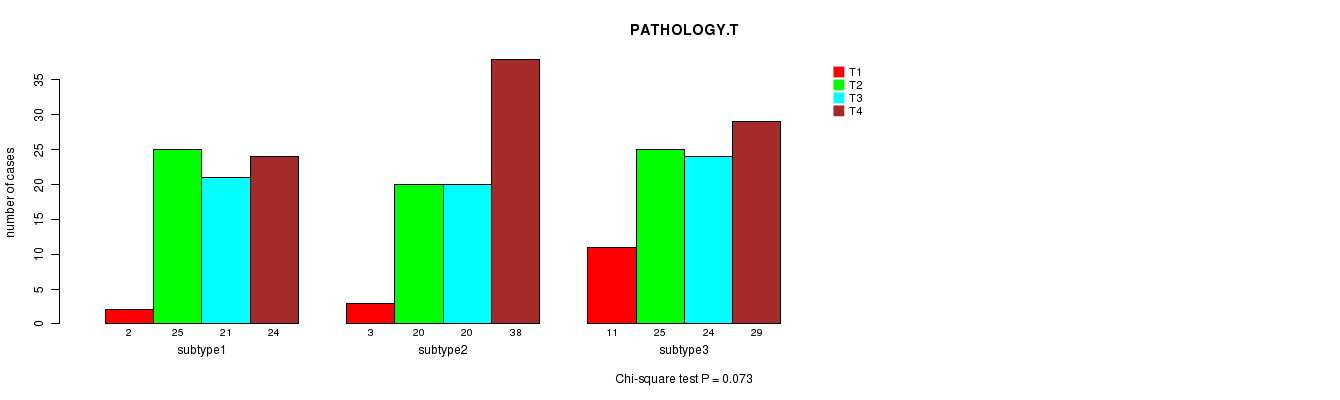
P value = 0.073 (Chi-square test)
Table S14. Clustering Approach #2: 'RNAseq cHierClus subtypes' versus Clinical Feature #4: 'PATHOLOGY.T'
| nPatients | T1 | T2 | T3 | T4 |
|---|---|---|---|---|
| ALL | 16 | 70 | 65 | 91 |
| subtype1 | 2 | 25 | 21 | 24 |
| subtype2 | 3 | 20 | 20 | 38 |
| subtype3 | 11 | 25 | 24 | 29 |
Figure S12. Get High-res Image Clustering Approach #2: 'RNAseq cHierClus subtypes' versus Clinical Feature #4: 'PATHOLOGY.T'
P value = 0.0148 (Chi-square test)
Table S15. Clustering Approach #2: 'RNAseq cHierClus subtypes' versus Clinical Feature #5: 'PATHOLOGY.N'
| nPatients | N0 | N1 | N2 | N3 |
|---|---|---|---|---|
| ALL | 100 | 40 | 92 | 3 |
| subtype1 | 27 | 8 | 33 | 1 |
| subtype2 | 44 | 18 | 18 | 1 |
| subtype3 | 29 | 14 | 41 | 1 |
Figure S13. Get High-res Image Clustering Approach #2: 'RNAseq cHierClus subtypes' versus Clinical Feature #5: 'PATHOLOGY.N'
P value = 0.54 (Fisher's exact test)
Table S16. Clustering Approach #2: 'RNAseq cHierClus subtypes' versus Clinical Feature #6: 'PATHOLOGICSPREAD(M)'
| nPatients | M0 | M1 |
|---|---|---|
| ALL | 249 | 2 |
| subtype1 | 77 | 1 |
| subtype2 | 83 | 1 |
| subtype3 | 89 | 0 |
Figure S14. Get High-res Image Clustering Approach #2: 'RNAseq cHierClus subtypes' versus Clinical Feature #6: 'PATHOLOGICSPREAD(M)'
P value = 0.209 (Fisher's exact test)
Table S17. Clustering Approach #2: 'RNAseq cHierClus subtypes' versus Clinical Feature #7: 'RADIATIONS.RADIATION.REGIMENINDICATION'
| nPatients | NO | YES |
|---|---|---|
| ALL | 184 | 68 |
| subtype1 | 53 | 25 |
| subtype2 | 67 | 17 |
| subtype3 | 64 | 26 |
Figure S15. Get High-res Image Clustering Approach #2: 'RNAseq cHierClus subtypes' versus Clinical Feature #7: 'RADIATIONS.RADIATION.REGIMENINDICATION'
P value = 0.0851 (Fisher's exact test)
Table S18. Clustering Approach #2: 'RNAseq cHierClus subtypes' versus Clinical Feature #8: 'NEOADJUVANT.THERAPY'
| nPatients | NO | YES |
|---|---|---|
| ALL | 42 | 210 |
| subtype1 | 15 | 63 |
| subtype2 | 8 | 76 |
| subtype3 | 19 | 71 |
Figure S16. Get High-res Image Clustering Approach #2: 'RNAseq cHierClus subtypes' versus Clinical Feature #8: 'NEOADJUVANT.THERAPY'
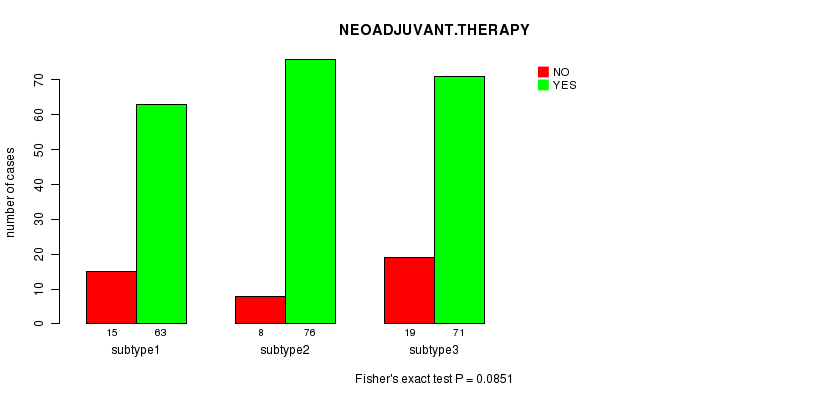
Table S19. Get Full Table Description of clustering approach #3: 'MIRseq CNMF subtypes'
| Cluster Labels | 1 | 2 | 3 |
|---|---|---|---|
| Number of samples | 32 | 31 | 26 |
P value = 0.538 (logrank test)
Table S20. Clustering Approach #3: 'MIRseq CNMF subtypes' versus Clinical Feature #1: 'Time to Death'
| nPatients | nDeath | Duration Range (Median), Month | |
|---|---|---|---|
| ALL | 89 | 27 | 1.5 - 135.3 (12.5) |
| subtype1 | 32 | 8 | 1.5 - 87.5 (10.7) |
| subtype2 | 31 | 10 | 4.6 - 135.3 (16.1) |
| subtype3 | 26 | 9 | 3.2 - 89.8 (13.2) |
Figure S17. Get High-res Image Clustering Approach #3: 'MIRseq CNMF subtypes' versus Clinical Feature #1: 'Time to Death'
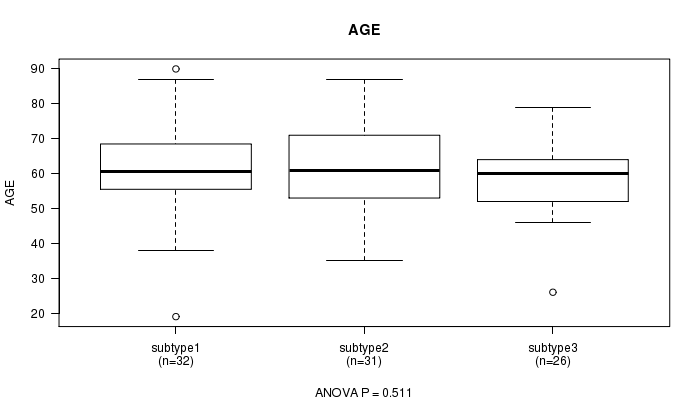
P value = 0.511 (ANOVA)
Table S21. Clustering Approach #3: 'MIRseq CNMF subtypes' versus Clinical Feature #2: 'AGE'
| nPatients | Mean (Std.Dev) | |
|---|---|---|
| ALL | 89 | 60.3 (12.6) |
| subtype1 | 32 | 60.8 (14.8) |
| subtype2 | 31 | 61.7 (12.1) |
| subtype3 | 26 | 58.0 (10.1) |
Figure S18. Get High-res Image Clustering Approach #3: 'MIRseq CNMF subtypes' versus Clinical Feature #2: 'AGE'
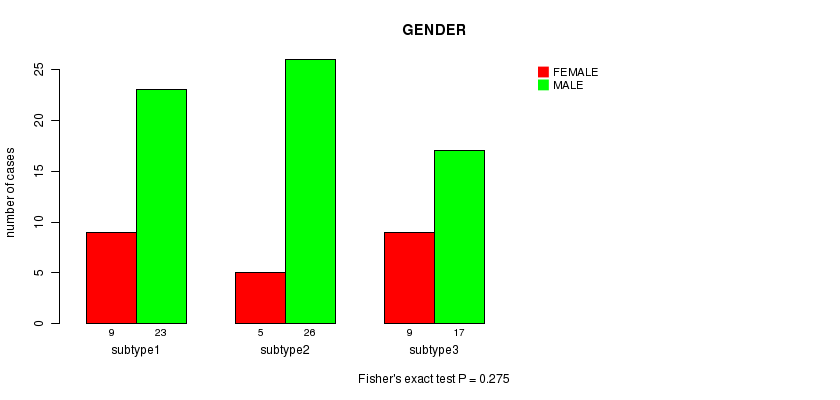
P value = 0.275 (Fisher's exact test)
Table S22. Clustering Approach #3: 'MIRseq CNMF subtypes' versus Clinical Feature #3: 'GENDER'
| nPatients | FEMALE | MALE |
|---|---|---|
| ALL | 66 | 23 |
| subtype1 | 23 | 9 |
| subtype2 | 26 | 5 |
| subtype3 | 17 | 9 |
Figure S19. Get High-res Image Clustering Approach #3: 'MIRseq CNMF subtypes' versus Clinical Feature #3: 'GENDER'
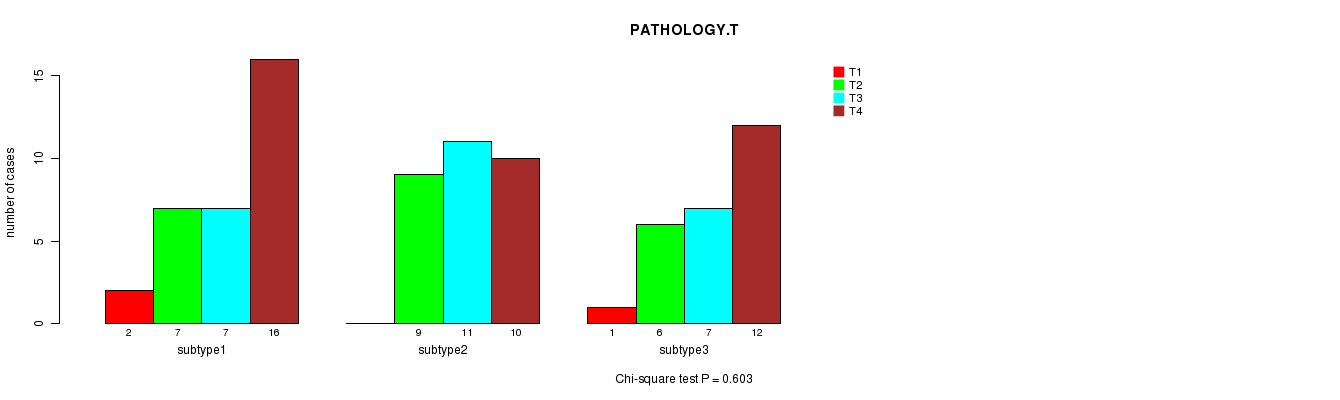
P value = 0.603 (Chi-square test)
Table S23. Clustering Approach #3: 'MIRseq CNMF subtypes' versus Clinical Feature #4: 'PATHOLOGY.T'
| nPatients | T1 | T2 | T3 | T4 |
|---|---|---|---|---|
| ALL | 3 | 22 | 25 | 38 |
| subtype1 | 2 | 7 | 7 | 16 |
| subtype2 | 0 | 9 | 11 | 10 |
| subtype3 | 1 | 6 | 7 | 12 |
Figure S20. Get High-res Image Clustering Approach #3: 'MIRseq CNMF subtypes' versus Clinical Feature #4: 'PATHOLOGY.T'
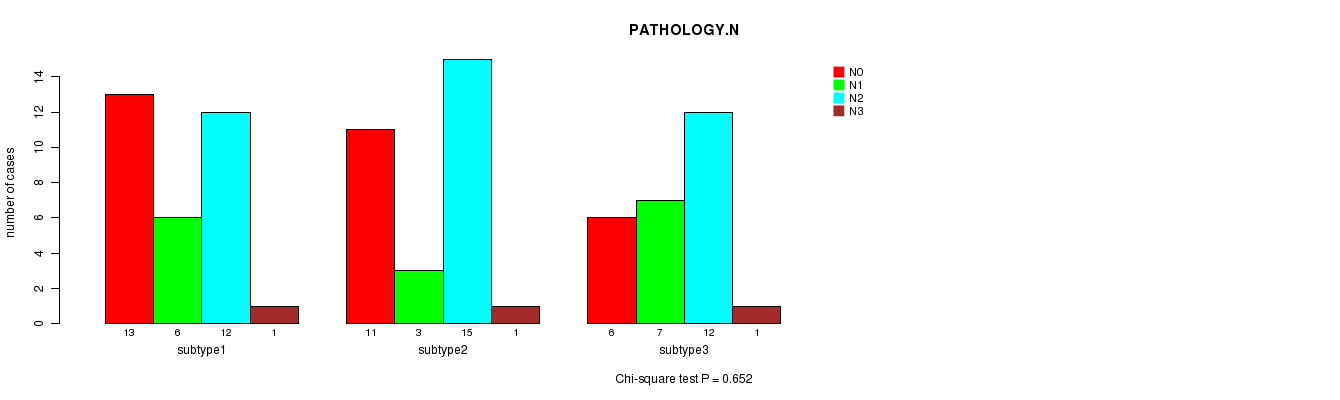
P value = 0.652 (Chi-square test)
Table S24. Clustering Approach #3: 'MIRseq CNMF subtypes' versus Clinical Feature #5: 'PATHOLOGY.N'
| nPatients | N0 | N1 | N2 | N3 |
|---|---|---|---|---|
| ALL | 30 | 16 | 39 | 3 |
| subtype1 | 13 | 6 | 12 | 1 |
| subtype2 | 11 | 3 | 15 | 1 |
| subtype3 | 6 | 7 | 12 | 1 |
Figure S21. Get High-res Image Clustering Approach #3: 'MIRseq CNMF subtypes' versus Clinical Feature #5: 'PATHOLOGY.N'
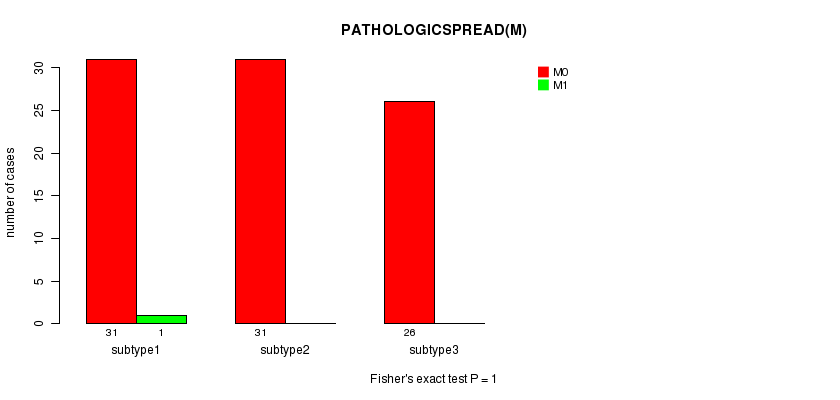
P value = 1 (Fisher's exact test)
Table S25. Clustering Approach #3: 'MIRseq CNMF subtypes' versus Clinical Feature #6: 'PATHOLOGICSPREAD(M)'
| nPatients | M0 | M1 |
|---|---|---|
| ALL | 88 | 1 |
| subtype1 | 31 | 1 |
| subtype2 | 31 | 0 |
| subtype3 | 26 | 0 |
Figure S22. Get High-res Image Clustering Approach #3: 'MIRseq CNMF subtypes' versus Clinical Feature #6: 'PATHOLOGICSPREAD(M)'
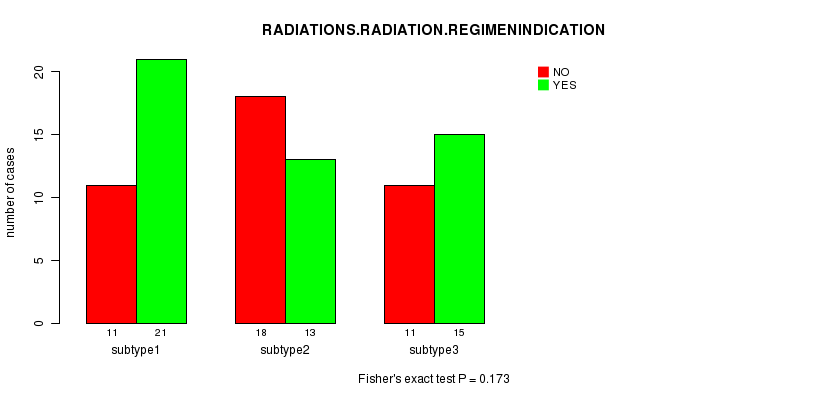
P value = 0.173 (Fisher's exact test)
Table S26. Clustering Approach #3: 'MIRseq CNMF subtypes' versus Clinical Feature #7: 'RADIATIONS.RADIATION.REGIMENINDICATION'
| nPatients | NO | YES |
|---|---|---|
| ALL | 49 | 40 |
| subtype1 | 21 | 11 |
| subtype2 | 13 | 18 |
| subtype3 | 15 | 11 |
Figure S23. Get High-res Image Clustering Approach #3: 'MIRseq CNMF subtypes' versus Clinical Feature #7: 'RADIATIONS.RADIATION.REGIMENINDICATION'
P value = 0.507 (Fisher's exact test)
Table S27. Clustering Approach #3: 'MIRseq CNMF subtypes' versus Clinical Feature #8: 'NEOADJUVANT.THERAPY'
| nPatients | NO | YES |
|---|---|---|
| ALL | 28 | 61 |
| subtype1 | 8 | 24 |
| subtype2 | 12 | 19 |
| subtype3 | 8 | 18 |
Figure S24. Get High-res Image Clustering Approach #3: 'MIRseq CNMF subtypes' versus Clinical Feature #8: 'NEOADJUVANT.THERAPY'

Table S28. Get Full Table Description of clustering approach #4: 'MIRseq cHierClus subtypes'
| Cluster Labels | 1 | 2 | 3 |
|---|---|---|---|
| Number of samples | 35 | 48 | 6 |
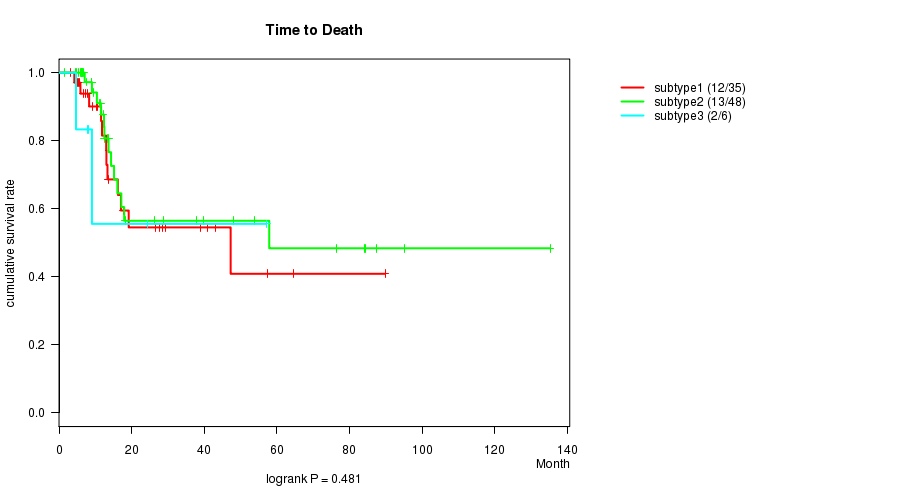
P value = 0.481 (logrank test)
Table S29. Clustering Approach #4: 'MIRseq cHierClus subtypes' versus Clinical Feature #1: 'Time to Death'
| nPatients | nDeath | Duration Range (Median), Month | |
|---|---|---|---|
| ALL | 89 | 27 | 1.5 - 135.3 (12.5) |
| subtype1 | 35 | 12 | 3.2 - 89.8 (13.1) |
| subtype2 | 48 | 13 | 1.5 - 135.3 (12.4) |
| subtype3 | 6 | 2 | 4.7 - 57.1 (8.6) |
Figure S25. Get High-res Image Clustering Approach #4: 'MIRseq cHierClus subtypes' versus Clinical Feature #1: 'Time to Death'
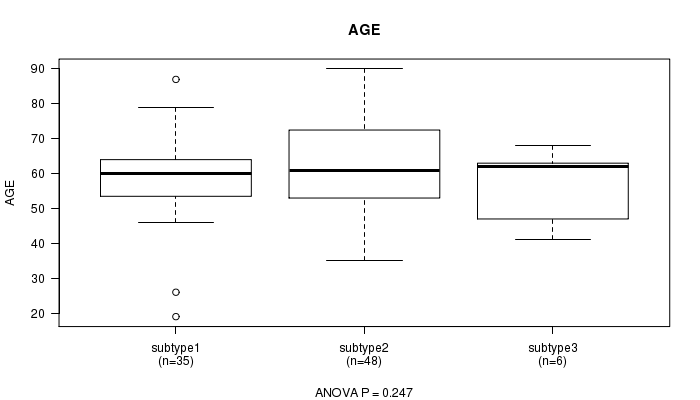
P value = 0.247 (ANOVA)
Table S30. Clustering Approach #4: 'MIRseq cHierClus subtypes' versus Clinical Feature #2: 'AGE'
| nPatients | Mean (Std.Dev) | |
|---|---|---|
| ALL | 89 | 60.3 (12.6) |
| subtype1 | 35 | 58.0 (12.4) |
| subtype2 | 48 | 62.4 (12.8) |
| subtype3 | 6 | 57.2 (10.6) |
Figure S26. Get High-res Image Clustering Approach #4: 'MIRseq cHierClus subtypes' versus Clinical Feature #2: 'AGE'
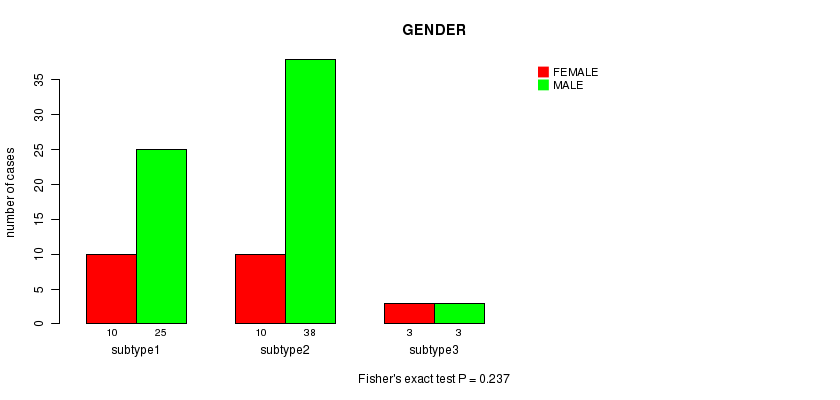
P value = 0.237 (Fisher's exact test)
Table S31. Clustering Approach #4: 'MIRseq cHierClus subtypes' versus Clinical Feature #3: 'GENDER'
| nPatients | FEMALE | MALE |
|---|---|---|
| ALL | 66 | 23 |
| subtype1 | 25 | 10 |
| subtype2 | 38 | 10 |
| subtype3 | 3 | 3 |
Figure S27. Get High-res Image Clustering Approach #4: 'MIRseq cHierClus subtypes' versus Clinical Feature #3: 'GENDER'
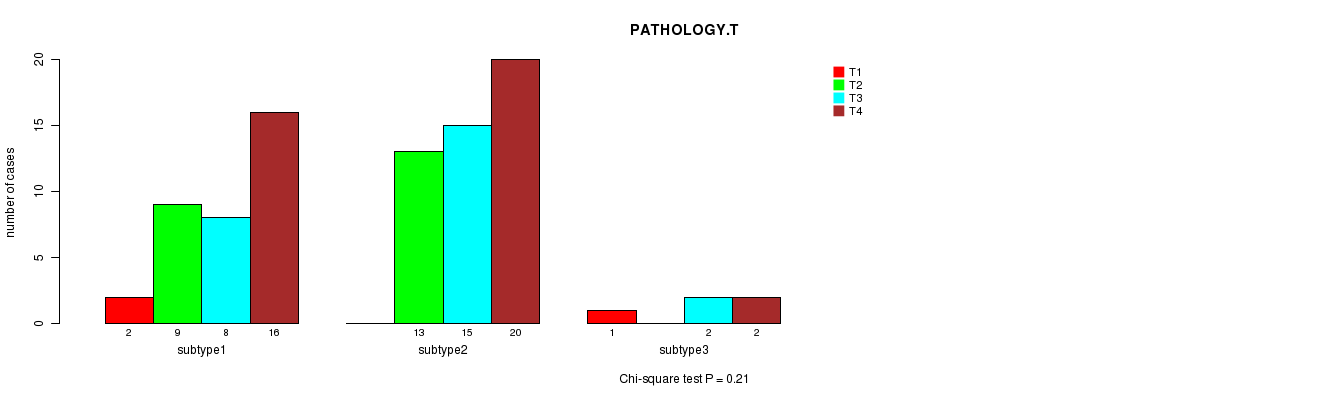
P value = 0.21 (Chi-square test)
Table S32. Clustering Approach #4: 'MIRseq cHierClus subtypes' versus Clinical Feature #4: 'PATHOLOGY.T'
| nPatients | T1 | T2 | T3 | T4 |
|---|---|---|---|---|
| ALL | 3 | 22 | 25 | 38 |
| subtype1 | 2 | 9 | 8 | 16 |
| subtype2 | 0 | 13 | 15 | 20 |
| subtype3 | 1 | 0 | 2 | 2 |
Figure S28. Get High-res Image Clustering Approach #4: 'MIRseq cHierClus subtypes' versus Clinical Feature #4: 'PATHOLOGY.T'
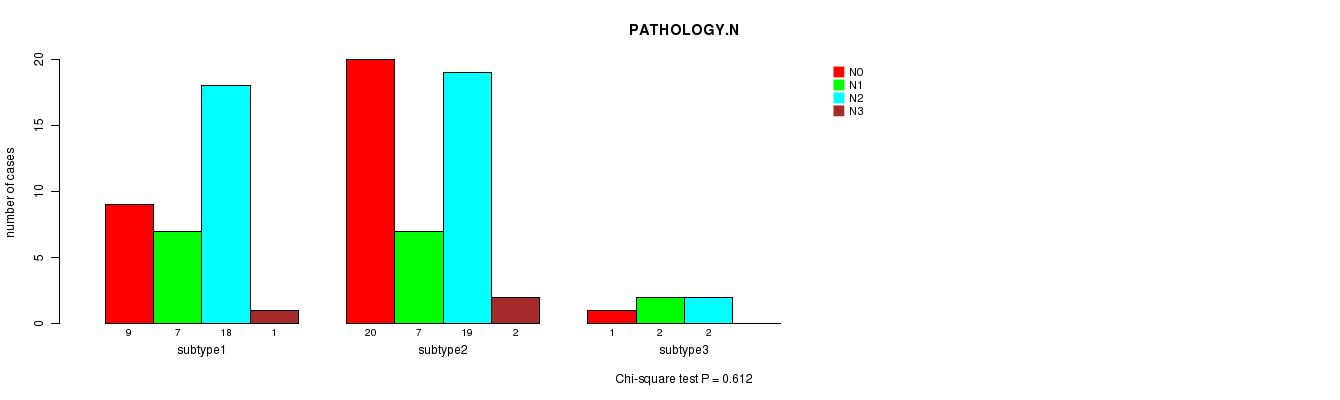
P value = 0.612 (Chi-square test)
Table S33. Clustering Approach #4: 'MIRseq cHierClus subtypes' versus Clinical Feature #5: 'PATHOLOGY.N'
| nPatients | N0 | N1 | N2 | N3 |
|---|---|---|---|---|
| ALL | 30 | 16 | 39 | 3 |
| subtype1 | 9 | 7 | 18 | 1 |
| subtype2 | 20 | 7 | 19 | 2 |
| subtype3 | 1 | 2 | 2 | 0 |
Figure S29. Get High-res Image Clustering Approach #4: 'MIRseq cHierClus subtypes' versus Clinical Feature #5: 'PATHOLOGY.N'
P value = 1 (Fisher's exact test)
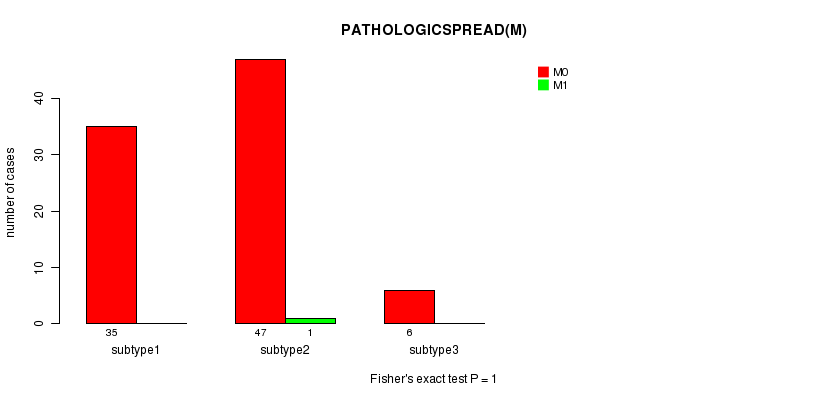
Table S34. Clustering Approach #4: 'MIRseq cHierClus subtypes' versus Clinical Feature #6: 'PATHOLOGICSPREAD(M)'
| nPatients | M0 | M1 |
|---|---|---|
| ALL | 88 | 1 |
| subtype1 | 35 | 0 |
| subtype2 | 47 | 1 |
| subtype3 | 6 | 0 |
Figure S30. Get High-res Image Clustering Approach #4: 'MIRseq cHierClus subtypes' versus Clinical Feature #6: 'PATHOLOGICSPREAD(M)'
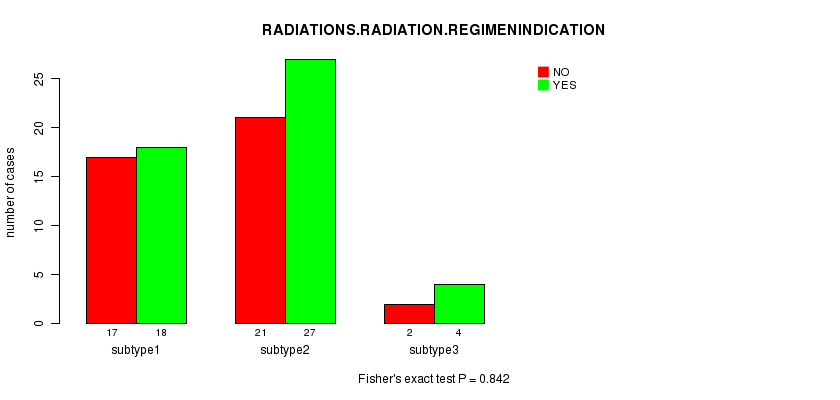
P value = 0.842 (Fisher's exact test)
Table S35. Clustering Approach #4: 'MIRseq cHierClus subtypes' versus Clinical Feature #7: 'RADIATIONS.RADIATION.REGIMENINDICATION'
| nPatients | NO | YES |
|---|---|---|
| ALL | 49 | 40 |
| subtype1 | 18 | 17 |
| subtype2 | 27 | 21 |
| subtype3 | 4 | 2 |
Figure S31. Get High-res Image Clustering Approach #4: 'MIRseq cHierClus subtypes' versus Clinical Feature #7: 'RADIATIONS.RADIATION.REGIMENINDICATION'
P value = 0.631 (Fisher's exact test)
Table S36. Clustering Approach #4: 'MIRseq cHierClus subtypes' versus Clinical Feature #8: 'NEOADJUVANT.THERAPY'
| nPatients | NO | YES |
|---|---|---|
| ALL | 28 | 61 |
| subtype1 | 13 | 22 |
| subtype2 | 13 | 35 |
| subtype3 | 2 | 4 |
Figure S32. Get High-res Image Clustering Approach #4: 'MIRseq cHierClus subtypes' versus Clinical Feature #8: 'NEOADJUVANT.THERAPY'

-
Cluster data file = HNSC.mergedcluster.txt
-
Clinical data file = HNSC.clin.merged.picked.txt
-
Number of patients = 259
-
Number of clustering approaches = 4
-
Number of selected clinical features = 8
-
Exclude small clusters that include fewer than K patients, K = 3
consensus non-negative matrix factorization clustering approach (Brunet et al. 2004)
Resampling-based clustering method (Monti et al. 2003)
For survival clinical features, the Kaplan-Meier survival curves of tumors with and without gene mutations were plotted and the statistical significance P values were estimated by logrank test (Bland and Altman 2004) using the 'survdiff' function in R
For continuous numerical clinical features, one-way analysis of variance (Howell 2002) was applied to compare the clinical values between tumor subtypes using 'anova' function in R
For binary clinical features, two-tailed Fisher's exact tests (Fisher 1922) were used to estimate the P values using the 'fisher.test' function in R
For multi-class clinical features (nominal or ordinal), Chi-square tests (Greenwood and Nikulin 1996) were used to estimate the P values using the 'chisq.test' function in R
This is an experimental feature. Location of data archives could not be determined.