This pipeline computes the correlation between cancer subtypes identified by different molecular patterns and selected clinical features.
Testing the association between subtypes identified by 7 different clustering approaches and 10 clinical features across 229 patients, 14 significant findings detected with P value < 0.05.
-
CNMF clustering analysis on array-based mRNA expression data identified 4 subtypes that correlate to 'Time to Death' and 'PATHOLOGY.T'.
-
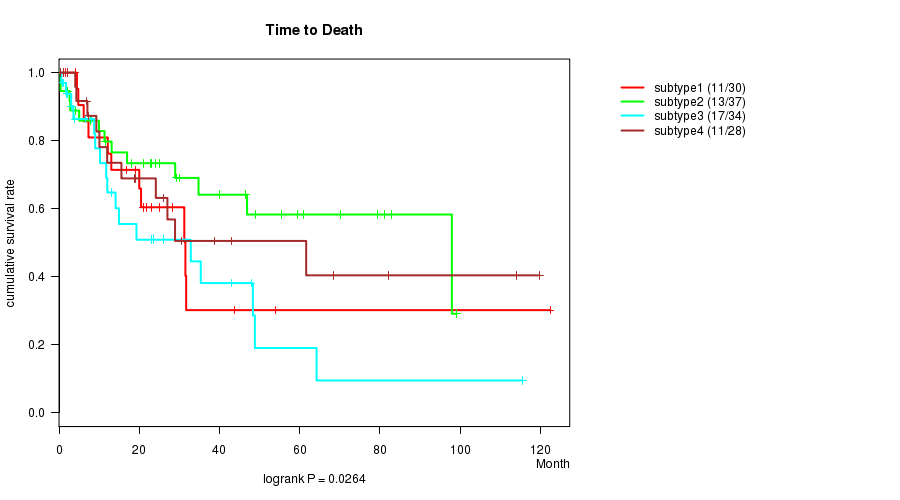
Consensus hierarchical clustering analysis on array-based mRNA expression data identified 3 subtypes that correlate to 'Time to Death', 'GENDER', and 'PATHOLOGY.T'.
-
4 subtypes identified in current cancer cohort by 'METHLYATION CNMF'. These subtypes correlate to 'Time to Death'.
-
CNMF clustering analysis on sequencing-based mRNA expression data identified 4 subtypes that correlate to 'GENDER' and 'PATHOLOGY.T'.
-
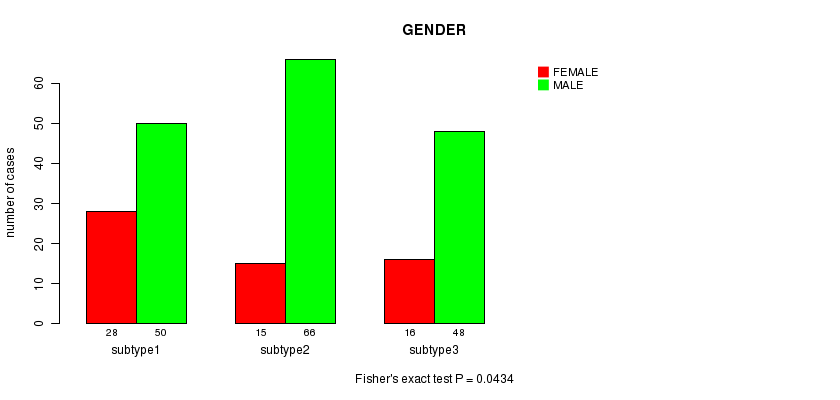
Consensus hierarchical clustering analysis on sequencing-based mRNA expression data identified 3 subtypes that correlate to 'GENDER' and 'PATHOLOGY.T'.
-
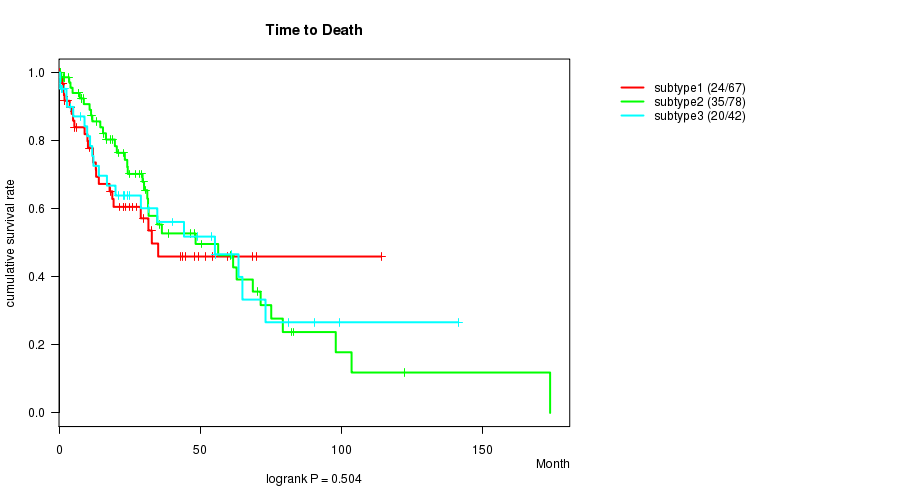
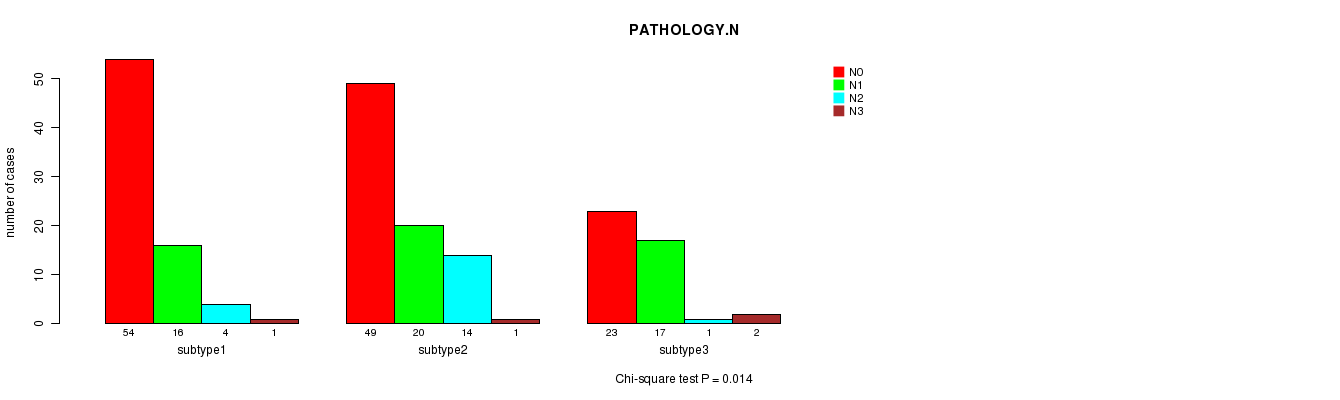
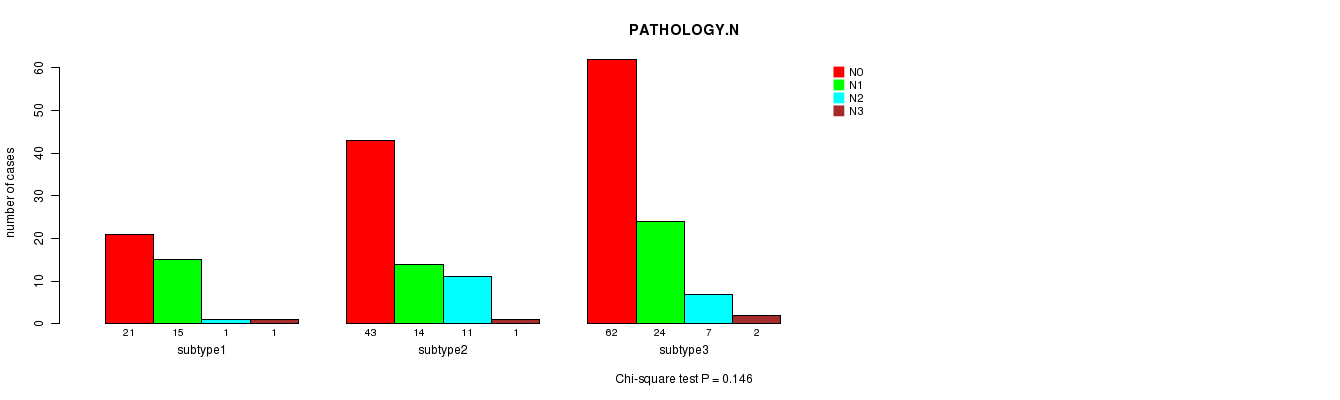
CNMF clustering analysis on sequencing-based miR expression data identified 3 subtypes that correlate to 'PATHOLOGY.N' and 'PATHOLOGICSPREAD(M)'.
-
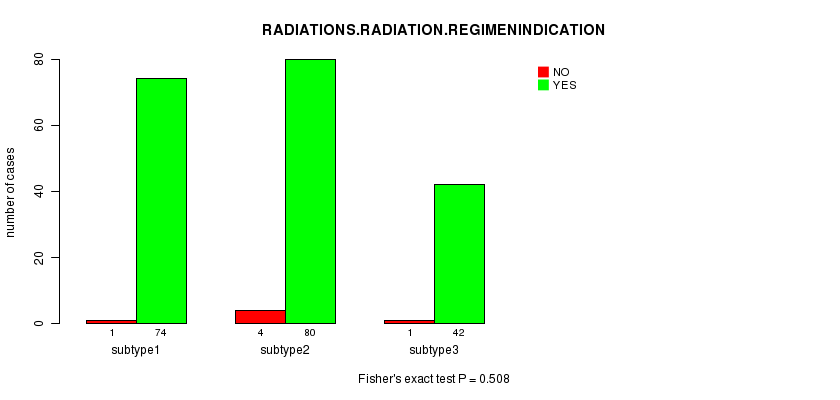
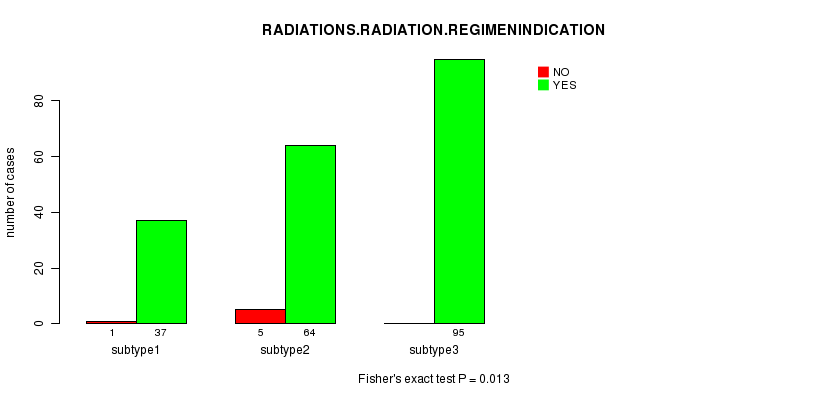
Consensus hierarchical clustering analysis on sequencing-based miR expression data identified 3 subtypes that correlate to 'PATHOLOGY.T' and 'RADIATIONS.RADIATION.REGIMENINDICATION'.
Table 1. Get Full Table Overview of the association between subtypes identified by 7 different clustering approaches and 10 clinical features. Shown in the table are P values from statistical tests. Thresholded by P value < 0.05, 14 significant findings detected.
|
Clinical Features |
Statistical Tests |
mRNA CNMF subtypes |
mRNA cHierClus subtypes |
METHLYATION CNMF |
RNAseq CNMF subtypes |
RNAseq cHierClus subtypes |
MIRseq CNMF subtypes |
MIRseq cHierClus subtypes |
| Time to Death | logrank test | 0.0442 | 0.0312 | 0.0264 | 0.0613 | 0.289 | 0.504 | 0.85 |
| AGE | ANOVA | 0.546 | 0.168 | 0.595 | 0.088 | 0.486 | 0.396 | 0.579 |
| GENDER | Fisher's exact test | 0.382 | 0.00872 | 0.108 | 0.0354 | 0.0434 | 0.938 | 0.312 |
| KARNOFSKY PERFORMANCE SCORE | ANOVA | 0.191 | 0.0891 | 0.192 | 0.387 | 0.324 | 0.336 | 0.463 |
| HISTOLOGICAL TYPE | Chi-square test | 0.355 | 0.587 | 0.309 | 0.317 | 0.35 | 0.421 | 0.367 |
| PATHOLOGY T | Chi-square test | 0.0029 | 0.000811 | 0.224 | 0.00695 | 0.0166 | 0.31 | 0.0281 |
| PATHOLOGY N | Chi-square test | 0.818 | 0.32 | 0.0712 | 0.424 | 0.912 | 0.014 | 0.146 |
| PATHOLOGICSPREAD(M) | Chi-square test | 0.146 | 0.323 | 0.122 | 0.53 | 0.455 | 0.0436 | 0.165 |
| RADIATIONS RADIATION REGIMENINDICATION | Fisher's exact test | 0.445 | 0.453 | 0.211 | 0.13 | 0.591 | 0.508 | 0.013 |
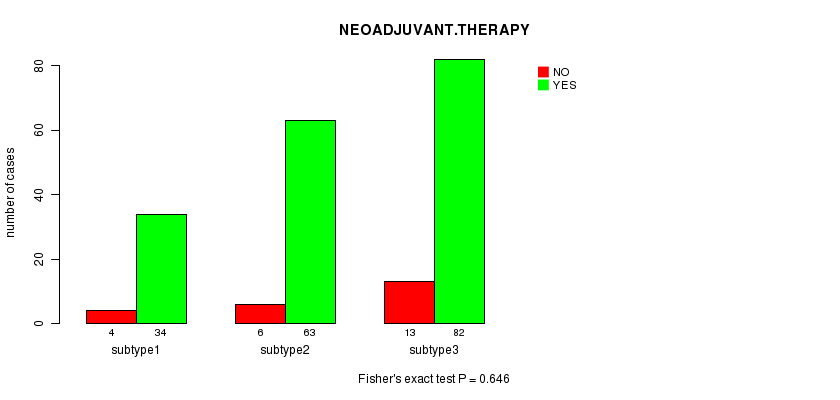
| NEOADJUVANT THERAPY | Fisher's exact test | 0.734 | 0.799 | 0.756 | 0.647 | 0.575 | 0.746 | 0.646 |
Table S1. Get Full Table Description of clustering approach #1: 'mRNA CNMF subtypes'
| Cluster Labels | 1 | 2 | 3 | 4 |
|---|---|---|---|---|
| Number of samples | 43 | 50 | 30 | 31 |
P value = 0.0442 (logrank test)
Table S2. Clustering Approach #1: 'mRNA CNMF subtypes' versus Clinical Feature #1: 'Time to Death'
| nPatients | nDeath | Duration Range (Median), Month | |
|---|---|---|---|
| ALL | 148 | 62 | 0.4 - 173.8 (18.2) |
| subtype1 | 42 | 16 | 0.4 - 122.4 (19.0) |
| subtype2 | 48 | 19 | 0.4 - 99.2 (24.5) |
| subtype3 | 28 | 16 | 0.4 - 82.2 (15.9) |
| subtype4 | 30 | 11 | 0.4 - 173.8 (11.8) |
Figure S1. Get High-res Image Clustering Approach #1: 'mRNA CNMF subtypes' versus Clinical Feature #1: 'Time to Death'

P value = 0.546 (ANOVA)
Table S3. Clustering Approach #1: 'mRNA CNMF subtypes' versus Clinical Feature #2: 'AGE'
| nPatients | Mean (Std.Dev) | |
|---|---|---|
| ALL | 152 | 66.5 (8.6) |
| subtype1 | 42 | 66.3 (7.6) |
| subtype2 | 49 | 66.6 (8.4) |
| subtype3 | 30 | 68.2 (8.6) |
| subtype4 | 31 | 65.0 (10.1) |
Figure S2. Get High-res Image Clustering Approach #1: 'mRNA CNMF subtypes' versus Clinical Feature #2: 'AGE'

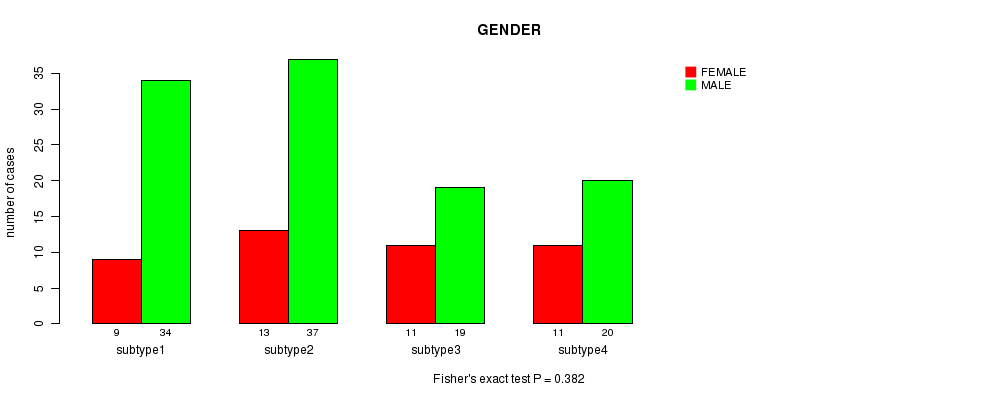
P value = 0.382 (Fisher's exact test)
Table S4. Clustering Approach #1: 'mRNA CNMF subtypes' versus Clinical Feature #3: 'GENDER'
| nPatients | FEMALE | MALE |
|---|---|---|
| ALL | 110 | 44 |
| subtype1 | 34 | 9 |
| subtype2 | 37 | 13 |
| subtype3 | 19 | 11 |
| subtype4 | 20 | 11 |
Figure S3. Get High-res Image Clustering Approach #1: 'mRNA CNMF subtypes' versus Clinical Feature #3: 'GENDER'
P value = 0.191 (ANOVA)
Table S5. Clustering Approach #1: 'mRNA CNMF subtypes' versus Clinical Feature #4: 'KARNOFSKY.PERFORMANCE.SCORE'
| nPatients | Mean (Std.Dev) | |
|---|---|---|
| ALL | 26 | 24.2 (38.5) |
| subtype1 | 4 | 0.0 (0.0) |
| subtype2 | 4 | 0.0 (0.0) |
| subtype3 | 9 | 31.1 (46.8) |
| subtype4 | 9 | 38.9 (39.5) |
Figure S4. Get High-res Image Clustering Approach #1: 'mRNA CNMF subtypes' versus Clinical Feature #4: 'KARNOFSKY.PERFORMANCE.SCORE'

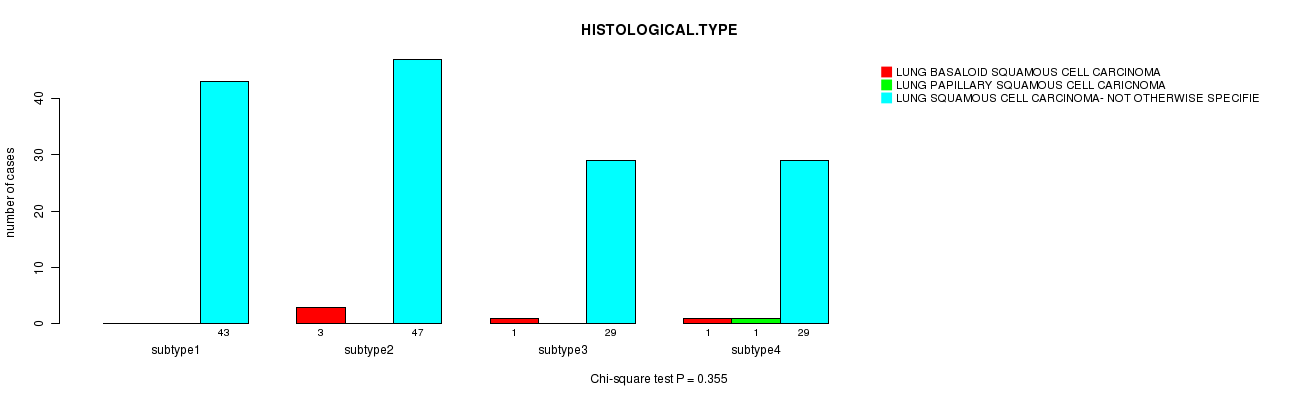
P value = 0.355 (Chi-square test)
Table S6. Clustering Approach #1: 'mRNA CNMF subtypes' versus Clinical Feature #5: 'HISTOLOGICAL.TYPE'
| nPatients | LUNG BASALOID SQUAMOUS CELL CARCINOMA | LUNG PAPILLARY SQUAMOUS CELL CARICNOMA | LUNG SQUAMOUS CELL CARCINOMA- NOT OTHERWISE SPECIFIED (NOS) |
|---|---|---|---|
| ALL | 5 | 1 | 148 |
| subtype1 | 0 | 0 | 43 |
| subtype2 | 3 | 0 | 47 |
| subtype3 | 1 | 0 | 29 |
| subtype4 | 1 | 1 | 29 |
Figure S5. Get High-res Image Clustering Approach #1: 'mRNA CNMF subtypes' versus Clinical Feature #5: 'HISTOLOGICAL.TYPE'
P value = 0.0029 (Chi-square test)
Table S7. Clustering Approach #1: 'mRNA CNMF subtypes' versus Clinical Feature #6: 'PATHOLOGY.T'
| nPatients | T1 | T2 | T3 | T4 |
|---|---|---|---|---|
| ALL | 30 | 100 | 12 | 12 |
| subtype1 | 5 | 31 | 6 | 1 |
| subtype2 | 4 | 39 | 1 | 6 |
| subtype3 | 11 | 16 | 2 | 1 |
| subtype4 | 10 | 14 | 3 | 4 |
Figure S6. Get High-res Image Clustering Approach #1: 'mRNA CNMF subtypes' versus Clinical Feature #6: 'PATHOLOGY.T'

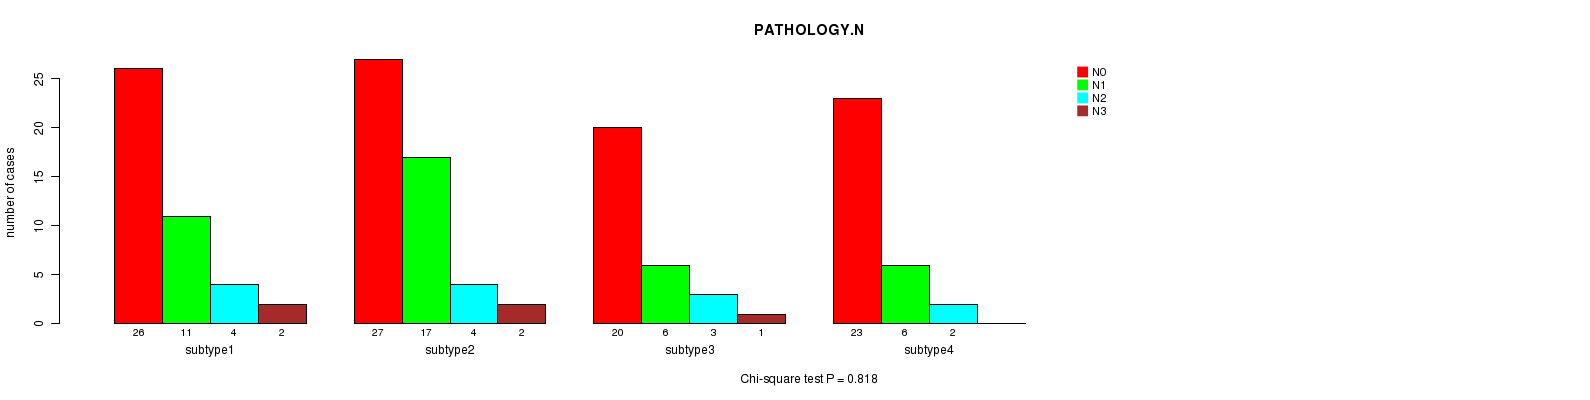
P value = 0.818 (Chi-square test)
Table S8. Clustering Approach #1: 'mRNA CNMF subtypes' versus Clinical Feature #7: 'PATHOLOGY.N'
| nPatients | N0 | N1 | N2 | N3 |
|---|---|---|---|---|
| ALL | 96 | 40 | 13 | 5 |
| subtype1 | 26 | 11 | 4 | 2 |
| subtype2 | 27 | 17 | 4 | 2 |
| subtype3 | 20 | 6 | 3 | 1 |
| subtype4 | 23 | 6 | 2 | 0 |
Figure S7. Get High-res Image Clustering Approach #1: 'mRNA CNMF subtypes' versus Clinical Feature #7: 'PATHOLOGY.N'
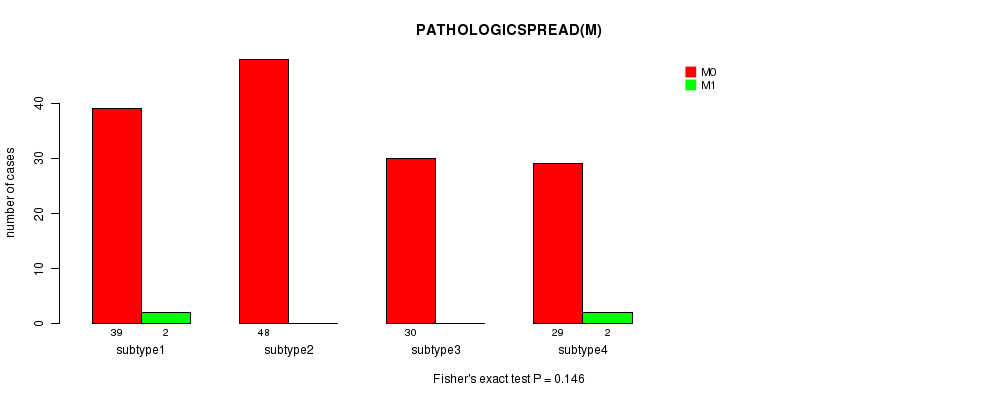
P value = 0.146 (Fisher's exact test)
Table S9. Clustering Approach #1: 'mRNA CNMF subtypes' versus Clinical Feature #8: 'PATHOLOGICSPREAD(M)'
| nPatients | M0 | M1 |
|---|---|---|
| ALL | 146 | 4 |
| subtype1 | 39 | 2 |
| subtype2 | 48 | 0 |
| subtype3 | 30 | 0 |
| subtype4 | 29 | 2 |
Figure S8. Get High-res Image Clustering Approach #1: 'mRNA CNMF subtypes' versus Clinical Feature #8: 'PATHOLOGICSPREAD(M)'
P value = 0.445 (Fisher's exact test)
Table S10. Clustering Approach #1: 'mRNA CNMF subtypes' versus Clinical Feature #9: 'RADIATIONS.RADIATION.REGIMENINDICATION'
| nPatients | NO | YES |
|---|---|---|
| ALL | 152 | 2 |
| subtype1 | 42 | 1 |
| subtype2 | 50 | 0 |
| subtype3 | 29 | 1 |
| subtype4 | 31 | 0 |
Figure S9. Get High-res Image Clustering Approach #1: 'mRNA CNMF subtypes' versus Clinical Feature #9: 'RADIATIONS.RADIATION.REGIMENINDICATION'

P value = 0.734 (Fisher's exact test)
Table S11. Clustering Approach #1: 'mRNA CNMF subtypes' versus Clinical Feature #10: 'NEOADJUVANT.THERAPY'
| nPatients | NO | YES |
|---|---|---|
| ALL | 141 | 13 |
| subtype1 | 39 | 4 |
| subtype2 | 45 | 5 |
| subtype3 | 27 | 3 |
| subtype4 | 30 | 1 |
Figure S10. Get High-res Image Clustering Approach #1: 'mRNA CNMF subtypes' versus Clinical Feature #10: 'NEOADJUVANT.THERAPY'

Table S12. Get Full Table Description of clustering approach #2: 'mRNA cHierClus subtypes'
| Cluster Labels | 1 | 2 | 3 |
|---|---|---|---|
| Number of samples | 28 | 54 | 72 |
P value = 0.0312 (logrank test)
Table S13. Clustering Approach #2: 'mRNA cHierClus subtypes' versus Clinical Feature #1: 'Time to Death'
| nPatients | nDeath | Duration Range (Median), Month | |
|---|---|---|---|
| ALL | 148 | 62 | 0.4 - 173.8 (18.2) |
| subtype1 | 27 | 7 | 0.4 - 173.8 (15.6) |
| subtype2 | 52 | 21 | 0.4 - 99.2 (23.6) |
| subtype3 | 69 | 34 | 0.4 - 122.4 (18.8) |
Figure S11. Get High-res Image Clustering Approach #2: 'mRNA cHierClus subtypes' versus Clinical Feature #1: 'Time to Death'

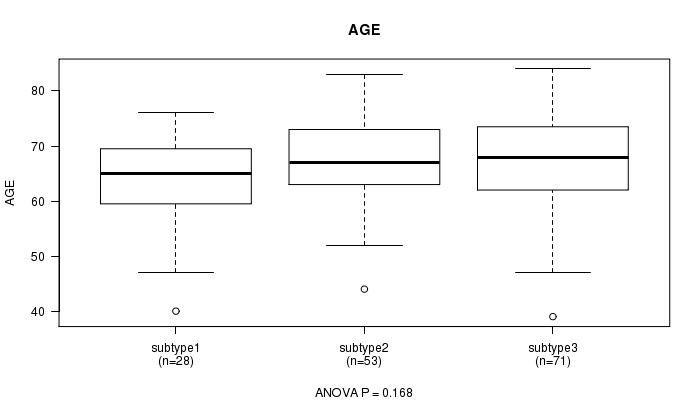
P value = 0.168 (ANOVA)
Table S14. Clustering Approach #2: 'mRNA cHierClus subtypes' versus Clinical Feature #2: 'AGE'
| nPatients | Mean (Std.Dev) | |
|---|---|---|
| ALL | 152 | 66.5 (8.6) |
| subtype1 | 28 | 63.9 (8.4) |
| subtype2 | 53 | 66.5 (7.9) |
| subtype3 | 71 | 67.5 (9.0) |
Figure S12. Get High-res Image Clustering Approach #2: 'mRNA cHierClus subtypes' versus Clinical Feature #2: 'AGE'
P value = 0.00872 (Fisher's exact test)
Table S15. Clustering Approach #2: 'mRNA cHierClus subtypes' versus Clinical Feature #3: 'GENDER'
| nPatients | FEMALE | MALE |
|---|---|---|
| ALL | 110 | 44 |
| subtype1 | 13 | 15 |
| subtype2 | 42 | 12 |
| subtype3 | 55 | 17 |
Figure S13. Get High-res Image Clustering Approach #2: 'mRNA cHierClus subtypes' versus Clinical Feature #3: 'GENDER'

P value = 0.0891 (ANOVA)
Table S16. Clustering Approach #2: 'mRNA cHierClus subtypes' versus Clinical Feature #4: 'KARNOFSKY.PERFORMANCE.SCORE'
| nPatients | Mean (Std.Dev) | |
|---|---|---|
| ALL | 26 | 24.2 (38.5) |
| subtype1 | 8 | 48.8 (42.6) |
| subtype2 | 5 | 10.0 (22.4) |
| subtype3 | 13 | 14.6 (35.7) |
Figure S14. Get High-res Image Clustering Approach #2: 'mRNA cHierClus subtypes' versus Clinical Feature #4: 'KARNOFSKY.PERFORMANCE.SCORE'

P value = 0.587 (Chi-square test)
Table S17. Clustering Approach #2: 'mRNA cHierClus subtypes' versus Clinical Feature #5: 'HISTOLOGICAL.TYPE'
| nPatients | LUNG BASALOID SQUAMOUS CELL CARCINOMA | LUNG PAPILLARY SQUAMOUS CELL CARICNOMA | LUNG SQUAMOUS CELL CARCINOMA- NOT OTHERWISE SPECIFIED (NOS) |
|---|---|---|---|
| ALL | 5 | 1 | 148 |
| subtype1 | 1 | 0 | 27 |
| subtype2 | 3 | 0 | 51 |
| subtype3 | 1 | 1 | 70 |
Figure S15. Get High-res Image Clustering Approach #2: 'mRNA cHierClus subtypes' versus Clinical Feature #5: 'HISTOLOGICAL.TYPE'

P value = 0.000811 (Chi-square test)
Table S18. Clustering Approach #2: 'mRNA cHierClus subtypes' versus Clinical Feature #6: 'PATHOLOGY.T'
| nPatients | T1 | T2 | T3 | T4 |
|---|---|---|---|---|
| ALL | 30 | 100 | 12 | 12 |
| subtype1 | 12 | 11 | 3 | 2 |
| subtype2 | 4 | 42 | 1 | 7 |
| subtype3 | 14 | 47 | 8 | 3 |
Figure S16. Get High-res Image Clustering Approach #2: 'mRNA cHierClus subtypes' versus Clinical Feature #6: 'PATHOLOGY.T'

P value = 0.32 (Chi-square test)
Table S19. Clustering Approach #2: 'mRNA cHierClus subtypes' versus Clinical Feature #7: 'PATHOLOGY.N'
| nPatients | N0 | N1 | N2 | N3 |
|---|---|---|---|---|
| ALL | 96 | 40 | 13 | 5 |
| subtype1 | 22 | 3 | 3 | 0 |
| subtype2 | 29 | 18 | 5 | 2 |
| subtype3 | 45 | 19 | 5 | 3 |
Figure S17. Get High-res Image Clustering Approach #2: 'mRNA cHierClus subtypes' versus Clinical Feature #7: 'PATHOLOGY.N'

P value = 0.323 (Fisher's exact test)
Table S20. Clustering Approach #2: 'mRNA cHierClus subtypes' versus Clinical Feature #8: 'PATHOLOGICSPREAD(M)'
| nPatients | M0 | M1 |
|---|---|---|
| ALL | 146 | 4 |
| subtype1 | 27 | 1 |
| subtype2 | 52 | 0 |
| subtype3 | 67 | 3 |
Figure S18. Get High-res Image Clustering Approach #2: 'mRNA cHierClus subtypes' versus Clinical Feature #8: 'PATHOLOGICSPREAD(M)'

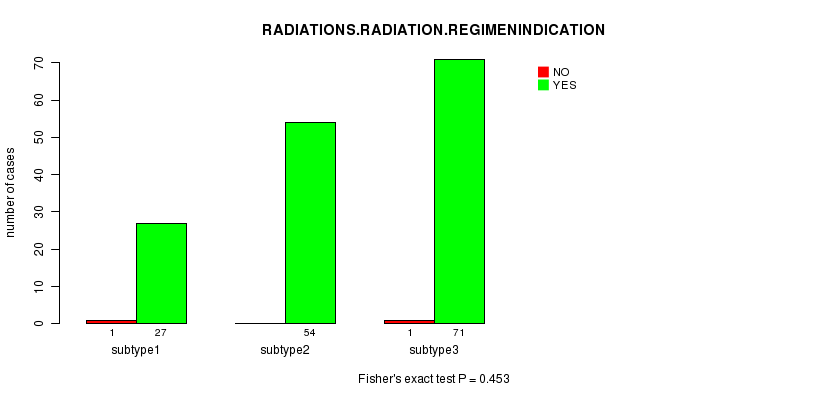
P value = 0.453 (Fisher's exact test)
Table S21. Clustering Approach #2: 'mRNA cHierClus subtypes' versus Clinical Feature #9: 'RADIATIONS.RADIATION.REGIMENINDICATION'
| nPatients | NO | YES |
|---|---|---|
| ALL | 152 | 2 |
| subtype1 | 27 | 1 |
| subtype2 | 54 | 0 |
| subtype3 | 71 | 1 |
Figure S19. Get High-res Image Clustering Approach #2: 'mRNA cHierClus subtypes' versus Clinical Feature #9: 'RADIATIONS.RADIATION.REGIMENINDICATION'
P value = 0.799 (Fisher's exact test)
Table S22. Clustering Approach #2: 'mRNA cHierClus subtypes' versus Clinical Feature #10: 'NEOADJUVANT.THERAPY'
| nPatients | NO | YES |
|---|---|---|
| ALL | 141 | 13 |
| subtype1 | 25 | 3 |
| subtype2 | 49 | 5 |
| subtype3 | 67 | 5 |
Figure S20. Get High-res Image Clustering Approach #2: 'mRNA cHierClus subtypes' versus Clinical Feature #10: 'NEOADJUVANT.THERAPY'
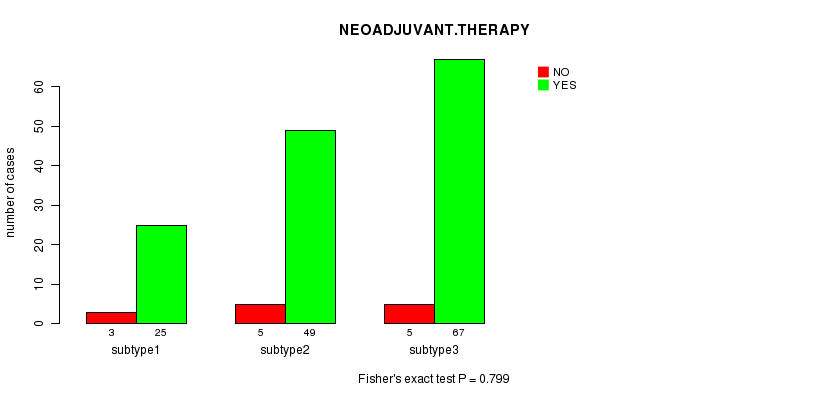
Table S23. Get Full Table Description of clustering approach #3: 'METHLYATION CNMF'
| Cluster Labels | 1 | 2 | 3 | 4 |
|---|---|---|---|---|
| Number of samples | 30 | 38 | 37 | 28 |
P value = 0.0264 (logrank test)
Table S24. Clustering Approach #3: 'METHLYATION CNMF' versus Clinical Feature #1: 'Time to Death'
| nPatients | nDeath | Duration Range (Median), Month | |
|---|---|---|---|
| ALL | 129 | 52 | 0.4 - 122.4 (16.8) |
| subtype1 | 30 | 11 | 0.4 - 122.4 (14.9) |
| subtype2 | 37 | 13 | 0.4 - 99.2 (24.1) |
| subtype3 | 34 | 17 | 0.4 - 115.6 (11.0) |
| subtype4 | 28 | 11 | 0.4 - 119.8 (17.2) |
Figure S21. Get High-res Image Clustering Approach #3: 'METHLYATION CNMF' versus Clinical Feature #1: 'Time to Death'
P value = 0.595 (ANOVA)
Table S25. Clustering Approach #3: 'METHLYATION CNMF' versus Clinical Feature #2: 'AGE'
| nPatients | Mean (Std.Dev) | |
|---|---|---|
| ALL | 133 | 66.5 (8.3) |
| subtype1 | 30 | 68.0 (8.3) |
| subtype2 | 38 | 65.7 (7.6) |
| subtype3 | 37 | 65.6 (9.1) |
| subtype4 | 28 | 67.1 (8.3) |
Figure S22. Get High-res Image Clustering Approach #3: 'METHLYATION CNMF' versus Clinical Feature #2: 'AGE'

P value = 0.108 (Fisher's exact test)
Table S26. Clustering Approach #3: 'METHLYATION CNMF' versus Clinical Feature #3: 'GENDER'
| nPatients | FEMALE | MALE |
|---|---|---|
| ALL | 99 | 34 |
| subtype1 | 27 | 3 |
| subtype2 | 28 | 10 |
| subtype3 | 26 | 11 |
| subtype4 | 18 | 10 |
Figure S23. Get High-res Image Clustering Approach #3: 'METHLYATION CNMF' versus Clinical Feature #3: 'GENDER'

P value = 0.192 (ANOVA)
Table S27. Clustering Approach #3: 'METHLYATION CNMF' versus Clinical Feature #4: 'KARNOFSKY.PERFORMANCE.SCORE'
| nPatients | Mean (Std.Dev) | |
|---|---|---|
| ALL | 22 | 24.5 (38.4) |
| subtype1 | 6 | 0.0 (0.0) |
| subtype2 | 2 | 25.0 (35.4) |
| subtype3 | 11 | 33.6 (46.7) |
| subtype4 | 3 | 40.0 (36.1) |
Figure S24. Get High-res Image Clustering Approach #3: 'METHLYATION CNMF' versus Clinical Feature #4: 'KARNOFSKY.PERFORMANCE.SCORE'

P value = 0.309 (Chi-square test)
Table S28. Clustering Approach #3: 'METHLYATION CNMF' versus Clinical Feature #5: 'HISTOLOGICAL.TYPE'
| nPatients | LUNG BASALOID SQUAMOUS CELL CARCINOMA | LUNG PAPILLARY SQUAMOUS CELL CARICNOMA | LUNG SQUAMOUS CELL CARCINOMA- NOT OTHERWISE SPECIFIED (NOS) |
|---|---|---|---|
| ALL | 3 | 1 | 129 |
| subtype1 | 0 | 0 | 30 |
| subtype2 | 2 | 0 | 36 |
| subtype3 | 0 | 0 | 37 |
| subtype4 | 1 | 1 | 26 |
Figure S25. Get High-res Image Clustering Approach #3: 'METHLYATION CNMF' versus Clinical Feature #5: 'HISTOLOGICAL.TYPE'

P value = 0.224 (Chi-square test)
Table S29. Clustering Approach #3: 'METHLYATION CNMF' versus Clinical Feature #6: 'PATHOLOGY.T'
| nPatients | T1 | T2 | T3 | T4 |
|---|---|---|---|---|
| ALL | 24 | 87 | 11 | 11 |
| subtype1 | 2 | 22 | 4 | 2 |
| subtype2 | 5 | 27 | 1 | 5 |
| subtype3 | 9 | 23 | 4 | 1 |
| subtype4 | 8 | 15 | 2 | 3 |
Figure S26. Get High-res Image Clustering Approach #3: 'METHLYATION CNMF' versus Clinical Feature #6: 'PATHOLOGY.T'

P value = 0.0712 (Chi-square test)
Table S30. Clustering Approach #3: 'METHLYATION CNMF' versus Clinical Feature #7: 'PATHOLOGY.N'
| nPatients | N0 | N1 | N2 | N3 |
|---|---|---|---|---|
| ALL | 84 | 34 | 10 | 5 |
| subtype1 | 13 | 12 | 4 | 1 |
| subtype2 | 21 | 13 | 2 | 2 |
| subtype3 | 30 | 5 | 2 | 0 |
| subtype4 | 20 | 4 | 2 | 2 |
Figure S27. Get High-res Image Clustering Approach #3: 'METHLYATION CNMF' versus Clinical Feature #7: 'PATHOLOGY.N'

P value = 0.122 (Fisher's exact test)
Table S31. Clustering Approach #3: 'METHLYATION CNMF' versus Clinical Feature #8: 'PATHOLOGICSPREAD(M)'
| nPatients | M0 | M1 |
|---|---|---|
| ALL | 126 | 3 |
| subtype1 | 27 | 2 |
| subtype2 | 36 | 0 |
| subtype3 | 37 | 0 |
| subtype4 | 26 | 1 |
Figure S28. Get High-res Image Clustering Approach #3: 'METHLYATION CNMF' versus Clinical Feature #8: 'PATHOLOGICSPREAD(M)'

P value = 0.211 (Fisher's exact test)
Table S32. Clustering Approach #3: 'METHLYATION CNMF' versus Clinical Feature #9: 'RADIATIONS.RADIATION.REGIMENINDICATION'
| nPatients | NO | YES |
|---|---|---|
| ALL | 132 | 1 |
| subtype1 | 30 | 0 |
| subtype2 | 38 | 0 |
| subtype3 | 37 | 0 |
| subtype4 | 27 | 1 |
Figure S29. Get High-res Image Clustering Approach #3: 'METHLYATION CNMF' versus Clinical Feature #9: 'RADIATIONS.RADIATION.REGIMENINDICATION'

P value = 0.756 (Fisher's exact test)
Table S33. Clustering Approach #3: 'METHLYATION CNMF' versus Clinical Feature #10: 'NEOADJUVANT.THERAPY'
| nPatients | NO | YES |
|---|---|---|
| ALL | 121 | 12 |
| subtype1 | 27 | 3 |
| subtype2 | 33 | 5 |
| subtype3 | 35 | 2 |
| subtype4 | 26 | 2 |
Figure S30. Get High-res Image Clustering Approach #3: 'METHLYATION CNMF' versus Clinical Feature #10: 'NEOADJUVANT.THERAPY'

Table S34. Get Full Table Description of clustering approach #4: 'RNAseq CNMF subtypes'
| Cluster Labels | 1 | 2 | 3 | 4 |
|---|---|---|---|---|
| Number of samples | 45 | 70 | 62 | 46 |
P value = 0.0613 (logrank test)
Table S35. Clustering Approach #4: 'RNAseq CNMF subtypes' versus Clinical Feature #1: 'Time to Death'
| nPatients | nDeath | Duration Range (Median), Month | |
|---|---|---|---|
| ALL | 207 | 88 | 0.1 - 173.8 (18.8) |
| subtype1 | 43 | 19 | 0.1 - 122.4 (14.1) |
| subtype2 | 65 | 25 | 0.4 - 141.3 (28.3) |
| subtype3 | 58 | 22 | 0.4 - 114.0 (8.3) |
| subtype4 | 41 | 22 | 0.6 - 173.8 (20.0) |
Figure S31. Get High-res Image Clustering Approach #4: 'RNAseq CNMF subtypes' versus Clinical Feature #1: 'Time to Death'

P value = 0.088 (ANOVA)
Table S36. Clustering Approach #4: 'RNAseq CNMF subtypes' versus Clinical Feature #2: 'AGE'
| nPatients | Mean (Std.Dev) | |
|---|---|---|
| ALL | 215 | 67.5 (8.4) |
| subtype1 | 43 | 66.7 (9.1) |
| subtype2 | 68 | 66.6 (8.0) |
| subtype3 | 60 | 69.9 (7.6) |
| subtype4 | 44 | 66.6 (9.1) |
Figure S32. Get High-res Image Clustering Approach #4: 'RNAseq CNMF subtypes' versus Clinical Feature #2: 'AGE'

P value = 0.0354 (Fisher's exact test)
Table S37. Clustering Approach #4: 'RNAseq CNMF subtypes' versus Clinical Feature #3: 'GENDER'
| nPatients | FEMALE | MALE |
|---|---|---|
| ALL | 164 | 59 |
| subtype1 | 38 | 7 |
| subtype2 | 56 | 14 |
| subtype3 | 41 | 21 |
| subtype4 | 29 | 17 |
Figure S33. Get High-res Image Clustering Approach #4: 'RNAseq CNMF subtypes' versus Clinical Feature #3: 'GENDER'

P value = 0.387 (ANOVA)
Table S38. Clustering Approach #4: 'RNAseq CNMF subtypes' versus Clinical Feature #4: 'KARNOFSKY.PERFORMANCE.SCORE'
| nPatients | Mean (Std.Dev) | |
|---|---|---|
| ALL | 44 | 17.7 (33.6) |
| subtype1 | 6 | 0.0 (0.0) |
| subtype2 | 9 | 10.0 (20.0) |
| subtype3 | 16 | 24.4 (38.5) |
| subtype4 | 13 | 23.1 (40.5) |
Figure S34. Get High-res Image Clustering Approach #4: 'RNAseq CNMF subtypes' versus Clinical Feature #4: 'KARNOFSKY.PERFORMANCE.SCORE'

P value = 0.317 (Chi-square test)
Table S39. Clustering Approach #4: 'RNAseq CNMF subtypes' versus Clinical Feature #5: 'HISTOLOGICAL.TYPE'
| nPatients | LUNG BASALOID SQUAMOUS CELL CARCINOMA | LUNG PAPILLARY SQUAMOUS CELL CARCINOMA | LUNG PAPILLARY SQUAMOUS CELL CARICNOMA | LUNG SQUAMOUS CELL CARCINOMA- NOT OTHERWISE SPECIFIED (NOS) |
|---|---|---|---|---|
| ALL | 6 | 1 | 1 | 215 |
| subtype1 | 0 | 0 | 1 | 44 |
| subtype2 | 3 | 1 | 0 | 66 |
| subtype3 | 3 | 0 | 0 | 59 |
| subtype4 | 0 | 0 | 0 | 46 |
Figure S35. Get High-res Image Clustering Approach #4: 'RNAseq CNMF subtypes' versus Clinical Feature #5: 'HISTOLOGICAL.TYPE'

P value = 0.00695 (Chi-square test)
Table S40. Clustering Approach #4: 'RNAseq CNMF subtypes' versus Clinical Feature #6: 'PATHOLOGY.T'
| nPatients | T1 | T2 | T3 | T4 |
|---|---|---|---|---|
| ALL | 52 | 135 | 23 | 13 |
| subtype1 | 6 | 29 | 8 | 2 |
| subtype2 | 10 | 47 | 7 | 6 |
| subtype3 | 21 | 35 | 1 | 5 |
| subtype4 | 15 | 24 | 7 | 0 |
Figure S36. Get High-res Image Clustering Approach #4: 'RNAseq CNMF subtypes' versus Clinical Feature #6: 'PATHOLOGY.T'

P value = 0.424 (Chi-square test)
Table S41. Clustering Approach #4: 'RNAseq CNMF subtypes' versus Clinical Feature #7: 'PATHOLOGY.N'
| nPatients | N0 | N1 | N2 | N3 |
|---|---|---|---|---|
| ALL | 144 | 55 | 19 | 5 |
| subtype1 | 27 | 11 | 5 | 2 |
| subtype2 | 43 | 20 | 5 | 2 |
| subtype3 | 40 | 18 | 3 | 1 |
| subtype4 | 34 | 6 | 6 | 0 |
Figure S37. Get High-res Image Clustering Approach #4: 'RNAseq CNMF subtypes' versus Clinical Feature #7: 'PATHOLOGY.N'

P value = 0.53 (Chi-square test)
Table S42. Clustering Approach #4: 'RNAseq CNMF subtypes' versus Clinical Feature #8: 'PATHOLOGICSPREAD(M)'
| nPatients | M0 | M1 | MX |
|---|---|---|---|
| ALL | 205 | 4 | 10 |
| subtype1 | 38 | 1 | 4 |
| subtype2 | 65 | 0 | 3 |
| subtype3 | 58 | 2 | 2 |
| subtype4 | 44 | 1 | 1 |
Figure S38. Get High-res Image Clustering Approach #4: 'RNAseq CNMF subtypes' versus Clinical Feature #8: 'PATHOLOGICSPREAD(M)'

P value = 0.13 (Fisher's exact test)
Table S43. Clustering Approach #4: 'RNAseq CNMF subtypes' versus Clinical Feature #9: 'RADIATIONS.RADIATION.REGIMENINDICATION'
| nPatients | NO | YES |
|---|---|---|
| ALL | 217 | 6 |
| subtype1 | 42 | 3 |
| subtype2 | 70 | 0 |
| subtype3 | 60 | 2 |
| subtype4 | 45 | 1 |
Figure S39. Get High-res Image Clustering Approach #4: 'RNAseq CNMF subtypes' versus Clinical Feature #9: 'RADIATIONS.RADIATION.REGIMENINDICATION'

P value = 0.647 (Fisher's exact test)
Table S44. Clustering Approach #4: 'RNAseq CNMF subtypes' versus Clinical Feature #10: 'NEOADJUVANT.THERAPY'
| nPatients | NO | YES |
|---|---|---|
| ALL | 202 | 21 |
| subtype1 | 39 | 6 |
| subtype2 | 64 | 6 |
| subtype3 | 58 | 4 |
| subtype4 | 41 | 5 |
Figure S40. Get High-res Image Clustering Approach #4: 'RNAseq CNMF subtypes' versus Clinical Feature #10: 'NEOADJUVANT.THERAPY'

Table S45. Get Full Table Description of clustering approach #5: 'RNAseq cHierClus subtypes'
| Cluster Labels | 1 | 2 | 3 |
|---|---|---|---|
| Number of samples | 78 | 81 | 64 |
P value = 0.289 (logrank test)
Table S46. Clustering Approach #5: 'RNAseq cHierClus subtypes' versus Clinical Feature #1: 'Time to Death'
| nPatients | nDeath | Duration Range (Median), Month | |
|---|---|---|---|
| ALL | 207 | 88 | 0.1 - 173.8 (18.8) |
| subtype1 | 73 | 30 | 0.4 - 173.8 (11.8) |
| subtype2 | 75 | 31 | 0.4 - 141.3 (24.9) |
| subtype3 | 59 | 27 | 0.1 - 122.4 (19.0) |
Figure S41. Get High-res Image Clustering Approach #5: 'RNAseq cHierClus subtypes' versus Clinical Feature #1: 'Time to Death'

P value = 0.486 (ANOVA)
Table S47. Clustering Approach #5: 'RNAseq cHierClus subtypes' versus Clinical Feature #2: 'AGE'
| nPatients | Mean (Std.Dev) | |
|---|---|---|
| ALL | 215 | 67.5 (8.4) |
| subtype1 | 75 | 68.4 (8.1) |
| subtype2 | 78 | 66.7 (8.0) |
| subtype3 | 62 | 67.5 (9.3) |
Figure S42. Get High-res Image Clustering Approach #5: 'RNAseq cHierClus subtypes' versus Clinical Feature #2: 'AGE'

P value = 0.0434 (Fisher's exact test)
Table S48. Clustering Approach #5: 'RNAseq cHierClus subtypes' versus Clinical Feature #3: 'GENDER'
| nPatients | FEMALE | MALE |
|---|---|---|
| ALL | 164 | 59 |
| subtype1 | 50 | 28 |
| subtype2 | 66 | 15 |
| subtype3 | 48 | 16 |
Figure S43. Get High-res Image Clustering Approach #5: 'RNAseq cHierClus subtypes' versus Clinical Feature #3: 'GENDER'
P value = 0.324 (ANOVA)
Table S49. Clustering Approach #5: 'RNAseq cHierClus subtypes' versus Clinical Feature #4: 'KARNOFSKY.PERFORMANCE.SCORE'
| nPatients | Mean (Std.Dev) | |
|---|---|---|
| ALL | 44 | 17.7 (33.6) |
| subtype1 | 19 | 25.3 (39.2) |
| subtype2 | 13 | 6.9 (17.0) |
| subtype3 | 12 | 17.5 (36.7) |
Figure S44. Get High-res Image Clustering Approach #5: 'RNAseq cHierClus subtypes' versus Clinical Feature #4: 'KARNOFSKY.PERFORMANCE.SCORE'

P value = 0.35 (Chi-square test)
Table S50. Clustering Approach #5: 'RNAseq cHierClus subtypes' versus Clinical Feature #5: 'HISTOLOGICAL.TYPE'
| nPatients | LUNG BASALOID SQUAMOUS CELL CARCINOMA | LUNG PAPILLARY SQUAMOUS CELL CARCINOMA | LUNG PAPILLARY SQUAMOUS CELL CARICNOMA | LUNG SQUAMOUS CELL CARCINOMA- NOT OTHERWISE SPECIFIED (NOS) |
|---|---|---|---|---|
| ALL | 6 | 1 | 1 | 215 |
| subtype1 | 3 | 0 | 0 | 75 |
| subtype2 | 3 | 1 | 0 | 77 |
| subtype3 | 0 | 0 | 1 | 63 |
Figure S45. Get High-res Image Clustering Approach #5: 'RNAseq cHierClus subtypes' versus Clinical Feature #5: 'HISTOLOGICAL.TYPE'

P value = 0.0166 (Chi-square test)
Table S51. Clustering Approach #5: 'RNAseq cHierClus subtypes' versus Clinical Feature #6: 'PATHOLOGY.T'
| nPatients | T1 | T2 | T3 | T4 |
|---|---|---|---|---|
| ALL | 52 | 135 | 23 | 13 |
| subtype1 | 27 | 42 | 4 | 5 |
| subtype2 | 14 | 54 | 7 | 6 |
| subtype3 | 11 | 39 | 12 | 2 |
Figure S46. Get High-res Image Clustering Approach #5: 'RNAseq cHierClus subtypes' versus Clinical Feature #6: 'PATHOLOGY.T'

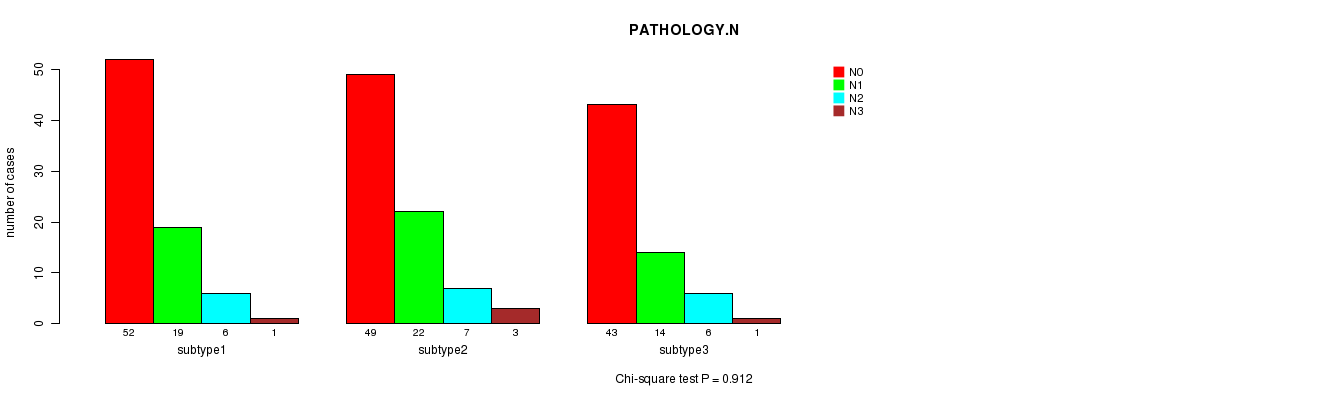
P value = 0.912 (Chi-square test)
Table S52. Clustering Approach #5: 'RNAseq cHierClus subtypes' versus Clinical Feature #7: 'PATHOLOGY.N'
| nPatients | N0 | N1 | N2 | N3 |
|---|---|---|---|---|
| ALL | 144 | 55 | 19 | 5 |
| subtype1 | 52 | 19 | 6 | 1 |
| subtype2 | 49 | 22 | 7 | 3 |
| subtype3 | 43 | 14 | 6 | 1 |
Figure S47. Get High-res Image Clustering Approach #5: 'RNAseq cHierClus subtypes' versus Clinical Feature #7: 'PATHOLOGY.N'
P value = 0.455 (Chi-square test)
Table S53. Clustering Approach #5: 'RNAseq cHierClus subtypes' versus Clinical Feature #8: 'PATHOLOGICSPREAD(M)'
| nPatients | M0 | M1 | MX |
|---|---|---|---|
| ALL | 205 | 4 | 10 |
| subtype1 | 74 | 2 | 2 |
| subtype2 | 75 | 0 | 4 |
| subtype3 | 56 | 2 | 4 |
Figure S48. Get High-res Image Clustering Approach #5: 'RNAseq cHierClus subtypes' versus Clinical Feature #8: 'PATHOLOGICSPREAD(M)'

P value = 0.591 (Fisher's exact test)
Table S54. Clustering Approach #5: 'RNAseq cHierClus subtypes' versus Clinical Feature #9: 'RADIATIONS.RADIATION.REGIMENINDICATION'
| nPatients | NO | YES |
|---|---|---|
| ALL | 217 | 6 |
| subtype1 | 75 | 3 |
| subtype2 | 80 | 1 |
| subtype3 | 62 | 2 |
Figure S49. Get High-res Image Clustering Approach #5: 'RNAseq cHierClus subtypes' versus Clinical Feature #9: 'RADIATIONS.RADIATION.REGIMENINDICATION'

P value = 0.575 (Fisher's exact test)
Table S55. Clustering Approach #5: 'RNAseq cHierClus subtypes' versus Clinical Feature #10: 'NEOADJUVANT.THERAPY'
| nPatients | NO | YES |
|---|---|---|
| ALL | 202 | 21 |
| subtype1 | 69 | 9 |
| subtype2 | 73 | 8 |
| subtype3 | 60 | 4 |
Figure S50. Get High-res Image Clustering Approach #5: 'RNAseq cHierClus subtypes' versus Clinical Feature #10: 'NEOADJUVANT.THERAPY'

Table S56. Get Full Table Description of clustering approach #6: 'MIRseq CNMF subtypes'
| Cluster Labels | 1 | 2 | 3 |
|---|---|---|---|
| Number of samples | 75 | 84 | 43 |
P value = 0.504 (logrank test)
Table S57. Clustering Approach #6: 'MIRseq CNMF subtypes' versus Clinical Feature #1: 'Time to Death'
| nPatients | nDeath | Duration Range (Median), Month | |
|---|---|---|---|
| ALL | 187 | 79 | 0.1 - 173.8 (18.8) |
| subtype1 | 67 | 24 | 0.1 - 114.0 (13.1) |
| subtype2 | 78 | 35 | 0.4 - 173.8 (20.8) |
| subtype3 | 42 | 20 | 0.4 - 141.3 (21.9) |
Figure S51. Get High-res Image Clustering Approach #6: 'MIRseq CNMF subtypes' versus Clinical Feature #1: 'Time to Death'
P value = 0.396 (ANOVA)
Table S58. Clustering Approach #6: 'MIRseq CNMF subtypes' versus Clinical Feature #2: 'AGE'
| nPatients | Mean (Std.Dev) | |
|---|---|---|
| ALL | 195 | 68.3 (8.3) |
| subtype1 | 71 | 69.0 (7.8) |
| subtype2 | 82 | 67.3 (9.2) |
| subtype3 | 42 | 69.0 (7.1) |
Figure S52. Get High-res Image Clustering Approach #6: 'MIRseq CNMF subtypes' versus Clinical Feature #2: 'AGE'

P value = 0.938 (Fisher's exact test)
Table S59. Clustering Approach #6: 'MIRseq CNMF subtypes' versus Clinical Feature #3: 'GENDER'
| nPatients | FEMALE | MALE |
|---|---|---|
| ALL | 146 | 56 |
| subtype1 | 53 | 22 |
| subtype2 | 61 | 23 |
| subtype3 | 32 | 11 |
Figure S53. Get High-res Image Clustering Approach #6: 'MIRseq CNMF subtypes' versus Clinical Feature #3: 'GENDER'

P value = 0.336 (ANOVA)
Table S60. Clustering Approach #6: 'MIRseq CNMF subtypes' versus Clinical Feature #4: 'KARNOFSKY.PERFORMANCE.SCORE'
| nPatients | Mean (Std.Dev) | |
|---|---|---|
| ALL | 39 | 16.2 (32.3) |
| subtype1 | 12 | 24.2 (40.1) |
| subtype2 | 21 | 16.2 (31.4) |
| subtype3 | 6 | 0.0 (0.0) |
Figure S54. Get High-res Image Clustering Approach #6: 'MIRseq CNMF subtypes' versus Clinical Feature #4: 'KARNOFSKY.PERFORMANCE.SCORE'

P value = 0.421 (Chi-square test)
Table S61. Clustering Approach #6: 'MIRseq CNMF subtypes' versus Clinical Feature #5: 'HISTOLOGICAL.TYPE'
| nPatients | LUNG BASALOID SQUAMOUS CELL CARCINOMA | LUNG PAPILLARY SQUAMOUS CELL CARCINOMA | LUNG PAPILLARY SQUAMOUS CELL CARICNOMA | LUNG SQUAMOUS CELL CARCINOMA- NOT OTHERWISE SPECIFIED (NOS) |
|---|---|---|---|---|
| ALL | 4 | 1 | 1 | 196 |
| subtype1 | 0 | 0 | 0 | 75 |
| subtype2 | 2 | 1 | 1 | 80 |
| subtype3 | 2 | 0 | 0 | 41 |
Figure S55. Get High-res Image Clustering Approach #6: 'MIRseq CNMF subtypes' versus Clinical Feature #5: 'HISTOLOGICAL.TYPE'

P value = 0.31 (Chi-square test)
Table S62. Clustering Approach #6: 'MIRseq CNMF subtypes' versus Clinical Feature #6: 'PATHOLOGY.T'
| nPatients | T1 | T2 | T3 | T4 |
|---|---|---|---|---|
| ALL | 44 | 126 | 20 | 12 |
| subtype1 | 13 | 52 | 6 | 4 |
| subtype2 | 22 | 48 | 11 | 3 |
| subtype3 | 9 | 26 | 3 | 5 |
Figure S56. Get High-res Image Clustering Approach #6: 'MIRseq CNMF subtypes' versus Clinical Feature #6: 'PATHOLOGY.T'

P value = 0.014 (Chi-square test)
Table S63. Clustering Approach #6: 'MIRseq CNMF subtypes' versus Clinical Feature #7: 'PATHOLOGY.N'
| nPatients | N0 | N1 | N2 | N3 |
|---|---|---|---|---|
| ALL | 126 | 53 | 19 | 4 |
| subtype1 | 54 | 16 | 4 | 1 |
| subtype2 | 49 | 20 | 14 | 1 |
| subtype3 | 23 | 17 | 1 | 2 |
Figure S57. Get High-res Image Clustering Approach #6: 'MIRseq CNMF subtypes' versus Clinical Feature #7: 'PATHOLOGY.N'
P value = 0.0436 (Chi-square test)
Table S64. Clustering Approach #6: 'MIRseq CNMF subtypes' versus Clinical Feature #8: 'PATHOLOGICSPREAD(M)'
| nPatients | M0 | M1 | MX |
|---|---|---|---|
| ALL | 185 | 3 | 10 |
| subtype1 | 64 | 2 | 8 |
| subtype2 | 81 | 1 | 1 |
| subtype3 | 40 | 0 | 1 |
Figure S58. Get High-res Image Clustering Approach #6: 'MIRseq CNMF subtypes' versus Clinical Feature #8: 'PATHOLOGICSPREAD(M)'

P value = 0.508 (Fisher's exact test)
Table S65. Clustering Approach #6: 'MIRseq CNMF subtypes' versus Clinical Feature #9: 'RADIATIONS.RADIATION.REGIMENINDICATION'
| nPatients | NO | YES |
|---|---|---|
| ALL | 196 | 6 |
| subtype1 | 74 | 1 |
| subtype2 | 80 | 4 |
| subtype3 | 42 | 1 |
Figure S59. Get High-res Image Clustering Approach #6: 'MIRseq CNMF subtypes' versus Clinical Feature #9: 'RADIATIONS.RADIATION.REGIMENINDICATION'
P value = 0.746 (Fisher's exact test)
Table S66. Clustering Approach #6: 'MIRseq CNMF subtypes' versus Clinical Feature #10: 'NEOADJUVANT.THERAPY'
| nPatients | NO | YES |
|---|---|---|
| ALL | 179 | 23 |
| subtype1 | 65 | 10 |
| subtype2 | 76 | 8 |
| subtype3 | 38 | 5 |
Figure S60. Get High-res Image Clustering Approach #6: 'MIRseq CNMF subtypes' versus Clinical Feature #10: 'NEOADJUVANT.THERAPY'
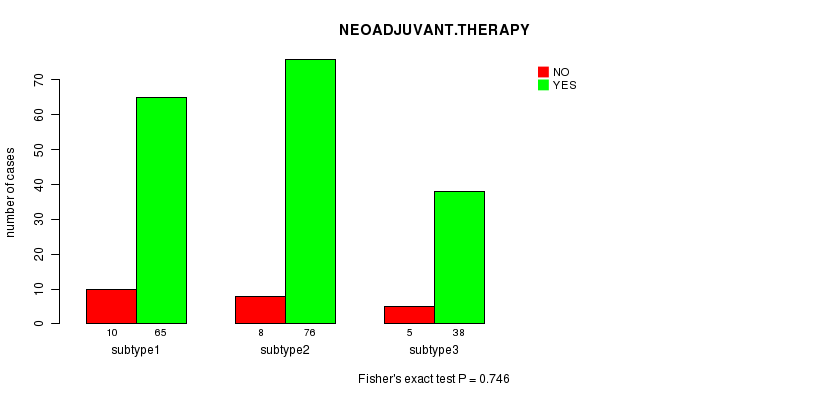
Table S67. Get Full Table Description of clustering approach #7: 'MIRseq cHierClus subtypes'
| Cluster Labels | 1 | 2 | 3 |
|---|---|---|---|
| Number of samples | 38 | 69 | 95 |
P value = 0.85 (logrank test)
Table S68. Clustering Approach #7: 'MIRseq cHierClus subtypes' versus Clinical Feature #1: 'Time to Death'
| nPatients | nDeath | Duration Range (Median), Month | |
|---|---|---|---|
| ALL | 187 | 79 | 0.1 - 173.8 (18.8) |
| subtype1 | 37 | 19 | 0.4 - 141.3 (23.0) |
| subtype2 | 65 | 28 | 0.4 - 122.4 (18.3) |
| subtype3 | 85 | 32 | 0.1 - 173.8 (16.8) |
Figure S61. Get High-res Image Clustering Approach #7: 'MIRseq cHierClus subtypes' versus Clinical Feature #1: 'Time to Death'

P value = 0.579 (ANOVA)
Table S69. Clustering Approach #7: 'MIRseq cHierClus subtypes' versus Clinical Feature #2: 'AGE'
| nPatients | Mean (Std.Dev) | |
|---|---|---|
| ALL | 195 | 68.3 (8.3) |
| subtype1 | 37 | 69.5 (7.1) |
| subtype2 | 68 | 68.4 (8.1) |
| subtype3 | 90 | 67.8 (8.9) |
Figure S62. Get High-res Image Clustering Approach #7: 'MIRseq cHierClus subtypes' versus Clinical Feature #2: 'AGE'

P value = 0.312 (Fisher's exact test)
Table S70. Clustering Approach #7: 'MIRseq cHierClus subtypes' versus Clinical Feature #3: 'GENDER'
| nPatients | FEMALE | MALE |
|---|---|---|
| ALL | 146 | 56 |
| subtype1 | 31 | 7 |
| subtype2 | 47 | 22 |
| subtype3 | 68 | 27 |
Figure S63. Get High-res Image Clustering Approach #7: 'MIRseq cHierClus subtypes' versus Clinical Feature #3: 'GENDER'

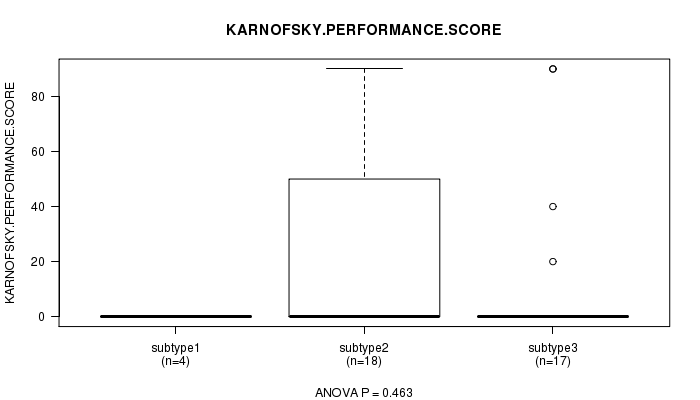
P value = 0.463 (ANOVA)
Table S71. Clustering Approach #7: 'MIRseq cHierClus subtypes' versus Clinical Feature #4: 'KARNOFSKY.PERFORMANCE.SCORE'
| nPatients | Mean (Std.Dev) | |
|---|---|---|
| ALL | 39 | 16.2 (32.3) |
| subtype1 | 4 | 0.0 (0.0) |
| subtype2 | 18 | 21.7 (37.0) |
| subtype3 | 17 | 14.1 (30.4) |
Figure S64. Get High-res Image Clustering Approach #7: 'MIRseq cHierClus subtypes' versus Clinical Feature #4: 'KARNOFSKY.PERFORMANCE.SCORE'
P value = 0.367 (Chi-square test)
Table S72. Clustering Approach #7: 'MIRseq cHierClus subtypes' versus Clinical Feature #5: 'HISTOLOGICAL.TYPE'
| nPatients | LUNG BASALOID SQUAMOUS CELL CARCINOMA | LUNG PAPILLARY SQUAMOUS CELL CARCINOMA | LUNG PAPILLARY SQUAMOUS CELL CARICNOMA | LUNG SQUAMOUS CELL CARCINOMA- NOT OTHERWISE SPECIFIED (NOS) |
|---|---|---|---|---|
| ALL | 4 | 1 | 1 | 196 |
| subtype1 | 2 | 0 | 0 | 36 |
| subtype2 | 2 | 0 | 0 | 67 |
| subtype3 | 0 | 1 | 1 | 93 |
Figure S65. Get High-res Image Clustering Approach #7: 'MIRseq cHierClus subtypes' versus Clinical Feature #5: 'HISTOLOGICAL.TYPE'

P value = 0.0281 (Chi-square test)
Table S73. Clustering Approach #7: 'MIRseq cHierClus subtypes' versus Clinical Feature #6: 'PATHOLOGY.T'
| nPatients | T1 | T2 | T3 | T4 |
|---|---|---|---|---|
| ALL | 44 | 126 | 20 | 12 |
| subtype1 | 8 | 21 | 3 | 6 |
| subtype2 | 19 | 37 | 10 | 3 |
| subtype3 | 17 | 68 | 7 | 3 |
Figure S66. Get High-res Image Clustering Approach #7: 'MIRseq cHierClus subtypes' versus Clinical Feature #6: 'PATHOLOGY.T'

P value = 0.146 (Chi-square test)
Table S74. Clustering Approach #7: 'MIRseq cHierClus subtypes' versus Clinical Feature #7: 'PATHOLOGY.N'
| nPatients | N0 | N1 | N2 | N3 |
|---|---|---|---|---|
| ALL | 126 | 53 | 19 | 4 |
| subtype1 | 21 | 15 | 1 | 1 |
| subtype2 | 43 | 14 | 11 | 1 |
| subtype3 | 62 | 24 | 7 | 2 |
Figure S67. Get High-res Image Clustering Approach #7: 'MIRseq cHierClus subtypes' versus Clinical Feature #7: 'PATHOLOGY.N'
P value = 0.165 (Chi-square test)
Table S75. Clustering Approach #7: 'MIRseq cHierClus subtypes' versus Clinical Feature #8: 'PATHOLOGICSPREAD(M)'
| nPatients | M0 | M1 | MX |
|---|---|---|---|
| ALL | 185 | 3 | 10 |
| subtype1 | 34 | 0 | 2 |
| subtype2 | 67 | 0 | 1 |
| subtype3 | 84 | 3 | 7 |
Figure S68. Get High-res Image Clustering Approach #7: 'MIRseq cHierClus subtypes' versus Clinical Feature #8: 'PATHOLOGICSPREAD(M)'

P value = 0.013 (Fisher's exact test)
Table S76. Clustering Approach #7: 'MIRseq cHierClus subtypes' versus Clinical Feature #9: 'RADIATIONS.RADIATION.REGIMENINDICATION'
| nPatients | NO | YES |
|---|---|---|
| ALL | 196 | 6 |
| subtype1 | 37 | 1 |
| subtype2 | 64 | 5 |
| subtype3 | 95 | 0 |
Figure S69. Get High-res Image Clustering Approach #7: 'MIRseq cHierClus subtypes' versus Clinical Feature #9: 'RADIATIONS.RADIATION.REGIMENINDICATION'
P value = 0.646 (Fisher's exact test)
Table S77. Clustering Approach #7: 'MIRseq cHierClus subtypes' versus Clinical Feature #10: 'NEOADJUVANT.THERAPY'
| nPatients | NO | YES |
|---|---|---|
| ALL | 179 | 23 |
| subtype1 | 34 | 4 |
| subtype2 | 63 | 6 |
| subtype3 | 82 | 13 |
Figure S70. Get High-res Image Clustering Approach #7: 'MIRseq cHierClus subtypes' versus Clinical Feature #10: 'NEOADJUVANT.THERAPY'
-
Cluster data file = LUSC.mergedcluster.txt
-
Clinical data file = LUSC.clin.merged.picked.txt
-
Number of patients = 229
-
Number of clustering approaches = 7
-
Number of selected clinical features = 10
-
Exclude small clusters that include fewer than K patients, K = 3
consensus non-negative matrix factorization clustering approach (Brunet et al. 2004)
Resampling-based clustering method (Monti et al. 2003)
For survival clinical features, the Kaplan-Meier survival curves of tumors with and without gene mutations were plotted and the statistical significance P values were estimated by logrank test (Bland and Altman 2004) using the 'survdiff' function in R
For continuous numerical clinical features, one-way analysis of variance (Howell 2002) was applied to compare the clinical values between tumor subtypes using 'anova' function in R
For binary clinical features, two-tailed Fisher's exact tests (Fisher 1922) were used to estimate the P values using the 'fisher.test' function in R
For multi-class clinical features (nominal or ordinal), Chi-square tests (Greenwood and Nikulin 1996) were used to estimate the P values using the 'chisq.test' function in R
This is an experimental feature. Location of data archives could not be determined.