This report serves to describe the mutational landscape and properties of a given individual set, as well as rank genes and genesets according to mutational significance. MutSig v1.5 was used to generate the results found in this report.
Working with individual set: PRAD.
Number of patients in set: 83
The input for this pipeline is a set of individuals with the following files associated for each:
1. An annotated .maf file describing the mutations called for the respective individual, and their properties.
2. A .wig file that contains information about the coverage of the sample.
Significantly mutated genes (q ≤ 0.1): 37
Mutations seen in COSMIC: 0
Significantly mutated genes in COSMIC territory: 0
Genes with clustered mutations (&le 3 aa apart): 1
Significantly mutated genesets: 8
Significantly mutated genesets: (excluding sig. mutated genes): 3
Table 1. Get Full Table Table representing breakdown of mutations by type.
| type | count |
|---|---|
| Frame_Shift_Del | 152 |
| Frame_Shift_Ins | 79 |
| In_Frame_Del | 51 |
| In_Frame_Ins | 12 |
| Missense_Mutation | 2364 |
| Nonsense_Mutation | 137 |
| Nonstop_Mutation | 1 |
| Silent | 1051 |
| Splice_Site | 77 |
| Translation_Start_Site | 9 |
| Total | 3933 |
Table 2. Get Full Table A breakdown of mutation rates per category discovered for this individual set.
| category | n | N | rate | rate_per_mb | relative_rate |
|---|---|---|---|---|---|
| A->T | 610 | 1231130036 | 5e-07 | 0.5 | 0.43 |
| C->(A/T) | 898 | 1294928235 | 6.9e-07 | 0.69 | 0.61 |
| A->(C/G) | 622 | 1231130036 | 5.1e-07 | 0.51 | 0.44 |
| C->G | 239 | 1294928235 | 1.8e-07 | 0.18 | 0.16 |
| indel+null | 508 | 2526058354 | 2e-07 | 0.2 | 0.18 |
| double_null | 5 | 2526058354 | 2e-09 | 0.002 | 0.0017 |
| Total | 2882 | 2526058354 | 1.1e-06 | 1.1 | 1 |
The x axis represents the samples. The y axis represents the exons, one row per exon, and they are sorted by average coverage across samples. For exons with exactly the same average coverage, they are sorted next by the %GC of the exon. (The secondary sort is especially useful for the zero-coverage exons at the bottom).
Figure 1.
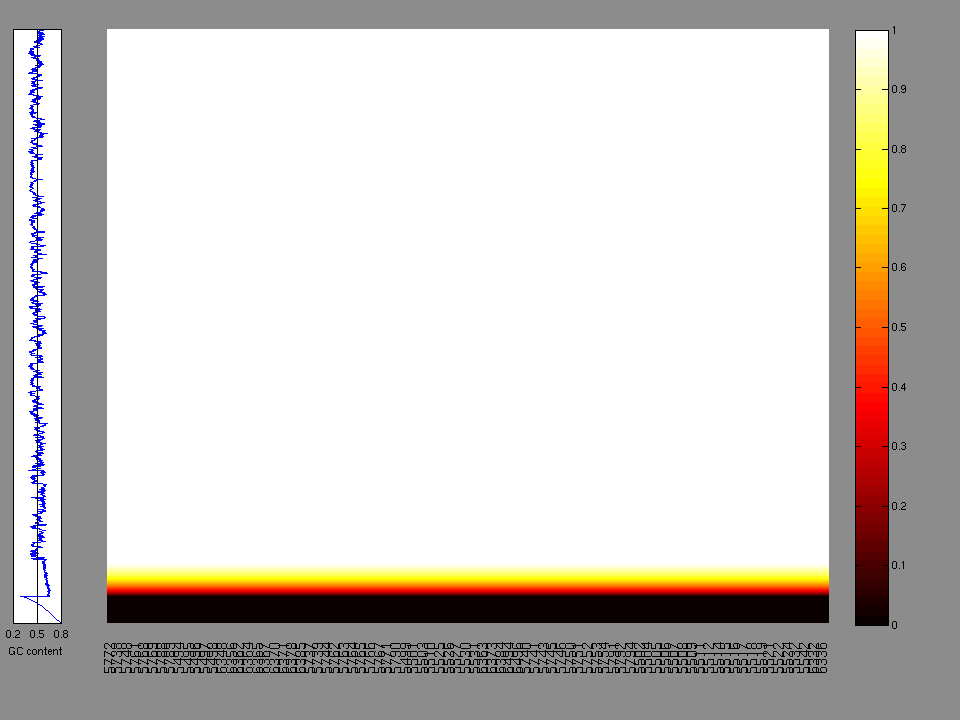
Figure 2.
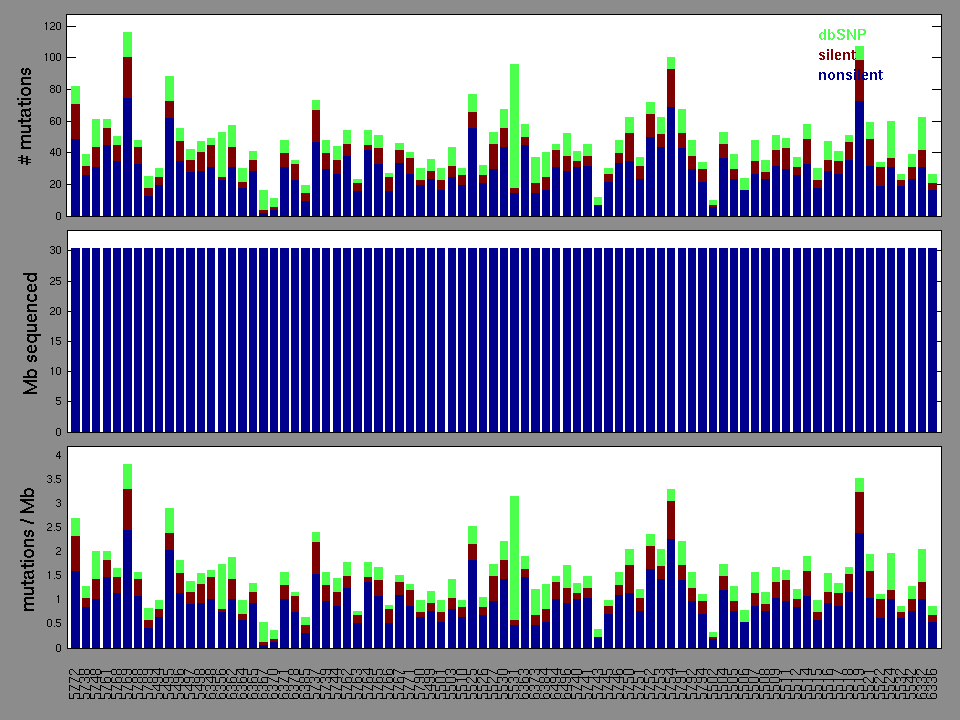
Table 3. Get Full Table A Ranked List of Significantly Mutated Genes. Number of significant genes found: 37. Number of genes displayed: 35
| rank | gene | description | N | n | npat | nsite | nsil | n1 | n2 | n3 | n4 | n5 | n6 | p | q |
|---|---|---|---|---|---|---|---|---|---|---|---|---|---|---|---|
| 1 | NKX3-1 | NK3 homeobox 1 | 50049 | 5 | 5 | 5 | 0 | 0 | 0 | 4 | 0 | 1 | 0 | 3.2e-11 | 5.8e-07 |
| 2 | MUC4 | mucin 4, cell surface associated | 541492 | 11 | 10 | 7 | 1 | 4 | 2 | 5 | 0 | 0 | 0 | 2.7e-10 | 2.5e-06 |
| 3 | FRG1 | FSHD region gene 1 | 67479 | 6 | 5 | 4 | 0 | 3 | 1 | 1 | 0 | 1 | 0 | 1.2e-09 | 7.4e-06 |
| 4 | SCAI | 158447 | 5 | 5 | 2 | 0 | 0 | 4 | 0 | 1 | 0 | 0 | 2.6e-07 | 0.0012 | |
| 5 | PRIM2 | primase, DNA, polypeptide 2 (58kDa) | 124915 | 4 | 4 | 2 | 4 | 0 | 1 | 0 | 0 | 3 | 0 | 4.4e-07 | 0.0014 |
| 6 | C9orf150 | chromosome 9 open reading frame 150 | 48721 | 3 | 3 | 1 | 0 | 0 | 0 | 0 | 0 | 3 | 0 | 4.8e-07 | 0.0014 |
| 7 | CDC27 | cell division cycle 27 homolog (S. cerevisiae) | 213227 | 6 | 5 | 6 | 6 | 0 | 5 | 0 | 0 | 1 | 0 | 6.7e-07 | 0.0017 |
| 8 | SPOP | speckle-type POZ protein | 96363 | 4 | 4 | 3 | 0 | 0 | 0 | 4 | 0 | 0 | 0 | 8.6e-07 | 0.0019 |
| 9 | ZNF98 | zinc finger protein 98 (F7175) | 143507 | 4 | 4 | 4 | 0 | 0 | 1 | 1 | 1 | 1 | 0 | 1.8e-06 | 0.0036 |
| 10 | LILRB3 | leukocyte immunoglobulin-like receptor, subfamily B (with TM and ITIM domains), member 3 | 121678 | 4 | 4 | 2 | 0 | 0 | 0 | 4 | 0 | 0 | 0 | 3e-06 | 0.0054 |
| 11 | TP53 | tumor protein p53 | 106406 | 4 | 4 | 4 | 0 | 1 | 2 | 0 | 0 | 1 | 0 | 3.4e-06 | 0.0055 |
| 12 | SLITRK4 | SLIT and NTRK-like family, member 4 | 208994 | 3 | 3 | 2 | 0 | 0 | 0 | 0 | 0 | 3 | 0 | 9.3e-06 | 0.014 |
| 13 | LRIT2 | leucine-rich repeat, immunoglobulin-like and transmembrane domains 2 | 138195 | 4 | 4 | 3 | 0 | 2 | 2 | 0 | 0 | 0 | 0 | 0.000013 | 0.017 |
| 14 | FCGBP | Fc fragment of IgG binding protein | 979151 | 7 | 7 | 5 | 1 | 1 | 1 | 4 | 1 | 0 | 0 | 0.000013 | 0.017 |
| 15 | NOTCH2NL | Notch homolog 2 (Drosophila) N-terminal like | 60341 | 3 | 3 | 2 | 0 | 0 | 1 | 2 | 0 | 0 | 0 | 0.000015 | 0.018 |
| 16 | PDE4DIP | phosphodiesterase 4D interacting protein (myomegalin) | 344367 | 5 | 5 | 4 | 1 | 1 | 0 | 3 | 0 | 1 | 0 | 0.000018 | 0.02 |
| 17 | ZNF492 | zinc finger protein 492 | 133464 | 4 | 4 | 3 | 0 | 3 | 1 | 0 | 0 | 0 | 0 | 0.000019 | 0.02 |
| 18 | ZNF99 | zinc finger protein 99 | 260869 | 4 | 4 | 4 | 3 | 0 | 1 | 1 | 1 | 1 | 0 | 2e-05 | 0.02 |
| 19 | ETV3 | ets variant gene 3 | 36852 | 2 | 2 | 2 | 0 | 0 | 0 | 1 | 0 | 1 | 0 | 0.000025 | 0.024 |
| 20 | TPTE2 | transmembrane phosphoinositide 3-phosphatase and tensin homolog 2 | 136867 | 3 | 3 | 3 | 0 | 0 | 1 | 1 | 0 | 1 | 0 | 0.000032 | 0.028 |
| 21 | TTLL11 | tubulin tyrosine ligase-like family, member 11 | 84079 | 3 | 3 | 3 | 0 | 0 | 2 | 0 | 0 | 1 | 0 | 0.000033 | 0.028 |
| 22 | PRR21 | 55859 | 3 | 3 | 3 | 0 | 1 | 1 | 1 | 0 | 0 | 0 | 0.000035 | 0.028 | |
| 23 | FIP1L1 | FIP1 like 1 (S. cerevisiae) | 156704 | 3 | 3 | 1 | 0 | 0 | 0 | 0 | 0 | 3 | 0 | 0.000036 | 0.028 |
| 24 | AIM2 | absent in melanoma 2 | 87316 | 3 | 3 | 3 | 0 | 0 | 1 | 0 | 1 | 1 | 0 | 0.000044 | 0.033 |
| 25 | CROCC | ciliary rootlet coiled-coil, rootletin | 319965 | 4 | 4 | 2 | 1 | 0 | 4 | 0 | 0 | 0 | 0 | 0.000048 | 0.035 |
| 26 | BBS9 | Bardet-Biedl syndrome 9 | 228416 | 3 | 3 | 2 | 0 | 0 | 0 | 1 | 0 | 2 | 0 | 0.000059 | 0.041 |
| 27 | CTNNAL1 | catenin (cadherin-associated protein), alpha-like 1 | 177288 | 3 | 3 | 2 | 0 | 0 | 1 | 0 | 0 | 2 | 0 | 0.000063 | 0.042 |
| 28 | OR6N1 | olfactory receptor, family 6, subfamily N, member 1 | 78269 | 3 | 3 | 2 | 0 | 1 | 0 | 0 | 2 | 0 | 0 | 0.000075 | 0.049 |
| 29 | ATF7IP | activating transcription factor 7 interacting protein | 321127 | 3 | 3 | 3 | 0 | 0 | 0 | 2 | 0 | 1 | 0 | 0.0001 | 0.064 |
| 30 | CRIPAK | cysteine-rich PAK1 inhibitor | 111552 | 3 | 3 | 3 | 1 | 1 | 1 | 1 | 0 | 0 | 0 | 0.00011 | 0.066 |
| 31 | TAL2 | T-cell acute lymphocytic leukemia 2 | 27473 | 2 | 2 | 2 | 0 | 0 | 0 | 1 | 1 | 0 | 0 | 0.00011 | 0.066 |
| 32 | ESCO1 | establishment of cohesion 1 homolog 1 (S. cerevisiae) | 212397 | 3 | 3 | 3 | 0 | 0 | 0 | 0 | 1 | 2 | 0 | 0.00013 | 0.069 |
| 33 | KRT25 | keratin 25 | 114955 | 3 | 3 | 3 | 0 | 0 | 2 | 0 | 0 | 1 | 0 | 0.00013 | 0.069 |
| 34 | PIP5K1C | phosphatidylinositol-4-phosphate 5-kinase, type I, gamma | 164423 | 3 | 3 | 3 | 0 | 1 | 1 | 0 | 0 | 1 | 0 | 0.00013 | 0.069 |
| 35 | RCBTB2 | regulator of chromosome condensation (RCC1) and BTB (POZ) domain containing protein 2 | 141432 | 3 | 3 | 2 | 0 | 1 | 2 | 0 | 0 | 0 | 0 | 0.00018 | 0.093 |
Note:
N - number of sequenced bases in this gene across the individual set.
n - number of (nonsilent) mutations in this gene across the individual set.
npat - number of patients (individuals) with at least one nonsilent mutation.
nsite - number of unique sites having a non-silent mutation.
nsil - number of silent mutations in this gene across the individual set.
n1 - number of nonsilent mutations of type: A->T .
n2 - number of nonsilent mutations of type: C->(A/T) .
n3 - number of nonsilent mutations of type: A->(C/G) .
n4 - number of nonsilent mutations of type: C->G .
n5 - number of nonsilent mutations of type: indel+null .
null - mutation category that includes nonsense, frameshift, splice-site mutations
p_classic = p-value for the observed amount of nonsilent mutations being elevated in this gene
p_ns_s = p-value for the observed nonsilent/silent ratio being elevated in this gene
p = p-value (overall)
q = q-value, False Discovery Rate (Benjamini-Hochberg procedure)
In this analysis, COSMIC is used as a filter to increase power by restricting the territory of each gene. Cosmic version: v48.
Table 4. Get Full Table Significantly mutated genes (COSMIC territory only). To access the database please go to: COSMIC. Number of significant genes found: 0. Number of genes displayed: 10
| rank | gene | description | n | cos | n_cos | N_cos | cos_ev | p | q |
|---|---|---|---|---|---|---|---|---|---|
| 1 | A4GNT | alpha-1,4-N-acetylglucosaminyltransferase | 0 | 0 | 0 | 0 | 0 | 1 | 1 |
| 2 | AACS | acetoacetyl-CoA synthetase | 0 | 0 | 0 | 0 | 0 | 1 | 1 |
| 3 | ABCA9 | ATP-binding cassette, sub-family A (ABC1), member 9 | 0 | 0 | 0 | 0 | 0 | 1 | 1 |
| 4 | ABCC10 | ATP-binding cassette, sub-family C (CFTR/MRP), member 10 | 1 | 0 | 0 | 0 | 0 | 1 | 1 |
| 5 | ABCF2 | ATP-binding cassette, sub-family F (GCN20), member 2 | 0 | 0 | 0 | 0 | 0 | 1 | 1 |
| 6 | ABHD2 | abhydrolase domain containing 2 | 1 | 0 | 0 | 0 | 0 | 1 | 1 |
| 7 | ABHD4 | abhydrolase domain containing 4 | 0 | 0 | 0 | 0 | 0 | 1 | 1 |
| 8 | ACADS | acyl-Coenzyme A dehydrogenase, C-2 to C-3 short chain | 1 | 0 | 0 | 0 | 0 | 1 | 1 |
| 9 | ACOT11 | acyl-CoA thioesterase 11 | 0 | 0 | 0 | 0 | 0 | 1 | 1 |
| 10 | ACRBP | acrosin binding protein | 0 | 0 | 0 | 0 | 0 | 1 | 1 |
Note:
n - number of (nonsilent) mutations in this gene across the individual set.
cos = number of unique mutated sites in this gene in COSMIC
n_cos = overlap between n and cos.
N_cos = number of individuals times cos.
cos_ev = total evidence: number of reports in COSMIC for mutations seen in this gene.
p = p-value for seeing the observed amount of overlap in this gene)
q = q-value, False Discovery Rate (Benjamini-Hochberg procedure)
Table 5. Get Full Table Genes with Clustered Mutations
| num | gene | desc | n | mindist | npairs3 | npairs12 |
|---|---|---|---|---|---|---|
| 694 | FANCD2 | Fanconi anemia, complementation group D2 | 2 | 0 | 1 | 1 |
| 1 | A2BP1 | 2 | Inf | 0 | 0 | |
| 5 | ABCA4 | ATP-binding cassette, sub-family A (ABC1), member 4 | 2 | Inf | 0 | 0 |
| 7 | ABCB1 | ATP-binding cassette, sub-family B (MDR/TAP), member 1 | 2 | Inf | 0 | 0 |
| 10 | ABCC11 | ATP-binding cassette, sub-family C (CFTR/MRP), member 11 | 2 | Inf | 0 | 0 |
| 19 | ACAN | aggrecan | 2 | Inf | 0 | 0 |
| 42 | ADAM29 | ADAM metallopeptidase domain 29 | 2 | Inf | 0 | 0 |
| 44 | ADAMTS13 | ADAM metallopeptidase with thrombospondin type 1 motif, 13 | 2 | Inf | 0 | 0 |
| 49 | ADAMTSL1 | ADAMTS-like 1 | 2 | Inf | 0 | 0 |
| 54 | ADNP | activity-dependent neuroprotector homeobox | 2 | Inf | 0 | 0 |
Note:
n - number of mutations in this gene in the individual set.
mindist - distance (in aa) between closest pair of mutations in this gene
npairs3 - how many pairs of mutations are within 3 aa of each other.
npairs12 - how many pairs of mutations are within 12 aa of each other.
Table 6. Get Full Table A Ranked List of Significantly Mutated Genesets. (Source: MSigDB GSEA Cannonical Pathway Set).Number of significant genesets found: 8. Number of genesets displayed: 10
| rank | geneset | description | genes | N_genes | mut_tally | N | n | npat | nsite | nsil | n1 | n2 | n3 | n4 | n5 | n6 | p | q |
|---|---|---|---|---|---|---|---|---|---|---|---|---|---|---|---|---|---|---|
| 1 | HSA04310_WNT_SIGNALING_PATHWAY | Genes involved in Wnt signaling pathway | APC, APC2, AXIN1, AXIN2, BTRC, CACYBP, CAMK2A, CAMK2B, CAMK2D, CAMK2G, CCND1, CCND2, CCND3, CER1, CHD8, CHP, CREBBP, CSNK1A1, CSNK1A1L, CSNK1E, CSNK2A1, CSNK2A2, CSNK2B, CTBP1, CTBP2, CTNNB1, CTNNBIP1, CUL1, CXXC4, DAAM1, DAAM2, DKK1, DKK2, DKK4, DVL1, DVL2, DVL3, EP300, FBXW11, FOSL1, FRAT1, FRAT2, FZD1, FZD10, FZD2, FZD3, FZD4, FZD5, FZD6, FZD7, FZD8, FZD9, GSK3B, JUN, LEF1, LOC652788, LRP5, LRP6, MAP3K7, MAPK10, MAPK8, MAPK9, MMP7, MYC, NFAT5, NFATC1, NFATC2, NFATC3, NFATC4, NKD1, NKD2, NLK, PLCB1, PLCB2, PLCB3, PLCB4, PORCN, PPARD, PPP2CA, PPP2CB, PPP2R1A, PPP2R1B, PPP2R2A, PPP2R2B, PPP2R2C, PPP3CA, PPP3CB, PPP3CC, PPP3R1, PPP3R2, PRICKLE1, PRICKLE2, PRKACA, PRKACB, PRKACG, PRKCA, PRKCB1, PRKCG, PRKX, PRKY, PSEN1, RAC1, RAC2, RAC3, RBX1, RHOA, ROCK1, ROCK2, RUVBL1, SENP2, SFRP1, SFRP2, SFRP4, SFRP5, SIAH1, SKP1, SMAD2, SMAD3, SMAD4, SOX17, TBL1X, TBL1XR1, TBL1Y, TCF7, TCF7L1, TCF7L2, TP53, VANGL1, VANGL2, WIF1, WNT1, WNT10A, WNT10B, WNT11, WNT16, WNT2, WNT2B, WNT3, WNT3A, WNT4, WNT5A, WNT5B, WNT6, WNT7A, WNT7B, WNT8A, WNT8B, WNT9A, WNT9B | 144 | CACYBP(1), CHP(1), CSNK1A1L(1), CTNNB1(3), DAAM2(2), DKK2(1), DVL2(1), FZD1(1), FZD2(4), FZD4(2), FZD5(1), FZD6(1), FZD9(1), LEF1(1), LRP6(1), PPARD(1), PPP2R2B(1), PPP2R2C(1), PRICKLE2(1), PSEN1(1), RAC1(1), ROCK1(1), SFRP2(1), SMAD3(1), SOX17(1), TBL1XR1(2), TCF7L2(1), TP53(4), WNT1(1), WNT10B(1), WNT11(2), WNT2(1), WNT5A(1), WNT9A(1) | 20782868 | 46 | 34 | 45 | 17 | 7 | 17 | 7 | 3 | 12 | 0 | 5.7e-08 | 0.000035 |
| 2 | SA_G1_AND_S_PHASES | Cdk2, 4, and 6 bind cyclin D in G1, while cdk2/cyclin E promotes the G1/S transition. | ARF1, ARF3, CCND1, CDK2, CDK4, CDKN1A, CDKN1B, CDKN2A, CFL1, E2F1, E2F2, MDM2, NXT1, PRB1, TP53 | 15 | CDKN1B(2), PRB1(2), TP53(4) | 1017580 | 8 | 8 | 8 | 0 | 1 | 2 | 2 | 0 | 3 | 0 | 5.1e-06 | 0.0016 |
| 3 | WNT_SIGNALING | Wnt signaling genes | APC, ARHA, AXIN1, C2orf31, CCND1, CCND2, CCND3, CSNK1E, CSNK1E, LOC400927, CTNNB1, DIPA, DVL1, DVL2, DVL3, FBXW2, FOSL1, FRAT1, FZD1, FZD10, FZD2, FZD3, FZD5, FZD6, FZD7, FZD8, FZD9, GSK3B, JUN, LDLR, MAPK10, MAPK9, MYC, PAFAH1B1, PLAU, PPP2R5C, PPP2R5E, PRKCA, PRKCB1, PRKCD, PRKCE, PRKCG, PRKCH, PRKCI, PRKCM, PRKCQ, PRKCZ, PRKD1, RAC1, RHOA, SFRP4, TCF7, WNT1, WNT10A, WNT10B, WNT11, WNT16, WNT2, WNT2B, WNT3, WNT4, WNT5A, WNT5B, WNT6, WNT7A, WNT7B | 58 | CTNNB1(3), DVL2(1), FZD1(1), FZD2(4), FZD5(1), FZD6(1), FZD9(1), LDLR(1), PLAU(1), PPP2R5E(1), RAC1(1), WNT1(1), WNT10B(1), WNT11(2), WNT2(1), WNT5A(1) | 7614586 | 22 | 17 | 21 | 6 | 3 | 6 | 4 | 4 | 5 | 0 | 0.000018 | 0.0036 |
| 4 | SA_REG_CASCADE_OF_CYCLIN_EXPR | Expression of cyclins regulates progression through the cell cycle by activating cyclin-dependent kinases. | CCNA1, CCNA2, CCND1, CCNE1, CCNE2, CDK2, CDK4, CDKN1B, CDKN2A, E2F1, E2F2, E2F4, PRB1 | 13 | CCNA1(1), CCNE2(1), CDKN1B(2), PRB1(2) | 1096762 | 6 | 6 | 6 | 0 | 1 | 0 | 3 | 0 | 2 | 0 | 0.0005 | 0.072 |
| 5 | PLK3PATHWAY | Active Plk3 phosphorylates CDC25c, blocking the G2/M transition, and phosphorylates p53 to induce apoptosis. | ATM, ATR, CDC25C, CHEK1, CHEK2, CNK, TP53, YWHAH | 7 | ATM(2), CHEK2(2), TP53(4) | 2002126 | 8 | 8 | 7 | 0 | 1 | 3 | 1 | 2 | 1 | 0 | 0.00059 | 0.072 |
| 6 | HSA04916_MELANOGENESIS | Genes involved in melanogenesis | ADCY1, ADCY2, ADCY3, ADCY4, ADCY5, ADCY6, ADCY7, ADCY8, ADCY9, ASIP, CALM1, CALM2, CALM3, CALML3, CALML6, CAMK2A, CAMK2B, CAMK2D, CAMK2G, CREB1, CREB3, CREB3L1, CREB3L2, CREB3L3, CREB3L4, CREBBP, CTNNB1, DCT, DVL1, DVL2, DVL3, EDN1, EDNRB, EP300, FZD1, FZD10, FZD2, FZD3, FZD4, FZD5, FZD6, FZD7, FZD8, FZD9, GNAI1, GNAI2, GNAI3, GNAO1, GNAQ, GNAS, GSK3B, HRAS, KIT, KITLG, KRAS, LEF1, LOC652788, MAP2K1, MAP2K2, MAPK1, MAPK3, MC1R, MITF, NRAS, PLCB1, PLCB2, PLCB3, PLCB4, POMC, PRKACA, PRKACB, PRKACG, PRKCA, PRKCB1, PRKCG, PRKX, PRKY, RAF1, TCF7, TCF7L1, TCF7L2, TYR, TYRP1, WNT1, WNT10A, WNT10B, WNT11, WNT16, WNT2, WNT2B, WNT3, WNT3A, WNT4, WNT5A, WNT5B, WNT6, WNT7A, WNT7B, WNT8A, WNT8B, WNT9A, WNT9B | 99 | ADCY6(1), ADCY9(1), CALML6(1), CTNNB1(3), DVL2(1), FZD1(1), FZD2(4), FZD4(2), FZD5(1), FZD6(1), FZD9(1), GNAQ(1), LEF1(1), TCF7L2(1), WNT1(1), WNT10B(1), WNT11(2), WNT2(1), WNT5A(1), WNT9A(1) | 13939850 | 27 | 21 | 26 | 15 | 5 | 9 | 3 | 3 | 7 | 0 | 0.00081 | 0.083 |
| 7 | HSA00564_GLYCEROPHOSPHOLIPID_METABOLISM | Genes involved in glycerophospholipid metabolism | ACHE, AGPAT1, AGPAT2, AGPAT3, AGPAT4, AGPAT6, ARD1A, CDIPT, CDS1, CDS2, CHAT, CHKA, CHKB, CHPT1, CRLS1, DGKA, DGKB, DGKD, DGKE, DGKG, DGKH, DGKI, DGKQ, DGKZ, ESCO1, ESCO2, ETNK1, ETNK2, GNPAT, GPAM, GPD1, GPD1L, GPD2, LCAT, LYCAT, LYPLA1, LYPLA2, LYPLA3, MYST3, MYST4, NAT5, NAT6, PCYT1A, PCYT1B, PEMT, PHOSPHO1, PISD, PLA2G10, PLA2G12A, PLA2G12B, PLA2G1B, PLA2G2A, PLA2G2D, PLA2G2E, PLA2G2F, PLA2G3, PLA2G4A, PLA2G5, PLA2G6, PLD1, PLD2, PNPLA3, PPAP2A, PPAP2B, PPAP2C, PTDSS1, PTDSS2, SH3GLB1 | 64 | AGPAT2(1), AGPAT3(1), DGKD(1), DGKI(1), DGKQ(2), ESCO1(3), GNPAT(1), MYST3(1), PLA2G2A(1), PLA2G4A(1), PLA2G5(1), PLD1(1), PTDSS1(1) | 8437614 | 16 | 15 | 16 | 2 | 2 | 3 | 4 | 3 | 4 | 0 | 0.0012 | 0.1 |
| 8 | STAT3PATHWAY | The STAT transcription factors are phosphorylated and activated by JAK kinases in response to cytokine signaling. | FRAP1, JAK1, JAK2, JAK3, MAPK1, MAPK3, STAT3, TYK2 | 7 | JAK1(3), STAT3(2), TYK2(1) | 1521473 | 6 | 5 | 6 | 1 | 1 | 1 | 1 | 1 | 2 | 0 | 0.0013 | 0.1 |
| 9 | P53HYPOXIAPATHWAY | Hypoxia induces p53 accumulation and consequent apoptosis with p53-mediated cell cycle arrest, which is present under conditions of DNA damage. | ABCB1, AKT1, ATM, BAX, CDKN1A, CPB2, CSNK1A1, CSNK1D, FHL2, GADD45A, HIC1, HIF1A, HSPA1A, HSPCA, IGFBP3, MAPK8, MDM2, NFKBIB, NQO1, TP53 | 19 | ABCB1(2), AKT1(1), ATM(2), TP53(4) | 2646704 | 9 | 9 | 9 | 0 | 2 | 4 | 1 | 1 | 1 | 0 | 0.0021 | 0.14 |
| 10 | G1PATHWAY | CDK4/6-cyclin D and CDK2-cyclin E phosphorylate Rb, which allows the transcription of genes needed for the G1/S cell cycle transition. | ABL1, ATM, ATR, CCNA1, CCND1, CCNE1, CDC2, CDC25A, CDK2, CDK4, CDK6, CDKN1A, CDKN1B, CDKN2A, CDKN2B, DHFR, E2F1, GSK3B, HDAC1, MADH3, MADH4, RB1, SKP2, TFDP1, TGFB1, TGFB2, TGFB3, TP53 | 25 | ATM(2), CCNA1(1), CDKN1B(2), DHFR(1), TP53(4) | 3767619 | 10 | 10 | 10 | 0 | 2 | 3 | 1 | 0 | 4 | 0 | 0.0025 | 0.15 |
Table 7. Get Full Table A Ranked List of Significantly Mutated Genesets (Excluding Significantly Mutated Genes). Number of significant genesets found: 3. Number of genesets displayed: 10
| rank | geneset | description | genes | N_genes | mut_tally | N | n | npat | nsite | nsil | n1 | n2 | n3 | n4 | n5 | n6 | p | q |
|---|---|---|---|---|---|---|---|---|---|---|---|---|---|---|---|---|---|---|
| 1 | HSA04310_WNT_SIGNALING_PATHWAY | Genes involved in Wnt signaling pathway | APC, APC2, AXIN1, AXIN2, BTRC, CACYBP, CAMK2A, CAMK2B, CAMK2D, CAMK2G, CCND1, CCND2, CCND3, CER1, CHD8, CHP, CREBBP, CSNK1A1, CSNK1A1L, CSNK1E, CSNK2A1, CSNK2A2, CSNK2B, CTBP1, CTBP2, CTNNB1, CTNNBIP1, CUL1, CXXC4, DAAM1, DAAM2, DKK1, DKK2, DKK4, DVL1, DVL2, DVL3, EP300, FBXW11, FOSL1, FRAT1, FRAT2, FZD1, FZD10, FZD2, FZD3, FZD4, FZD5, FZD6, FZD7, FZD8, FZD9, GSK3B, JUN, LEF1, LOC652788, LRP5, LRP6, MAP3K7, MAPK10, MAPK8, MAPK9, MMP7, MYC, NFAT5, NFATC1, NFATC2, NFATC3, NFATC4, NKD1, NKD2, NLK, PLCB1, PLCB2, PLCB3, PLCB4, PORCN, PPARD, PPP2CA, PPP2CB, PPP2R1A, PPP2R1B, PPP2R2A, PPP2R2B, PPP2R2C, PPP3CA, PPP3CB, PPP3CC, PPP3R1, PPP3R2, PRICKLE1, PRICKLE2, PRKACA, PRKACB, PRKACG, PRKCA, PRKCB1, PRKCG, PRKX, PRKY, PSEN1, RAC1, RAC2, RAC3, RBX1, RHOA, ROCK1, ROCK2, RUVBL1, SENP2, SFRP1, SFRP2, SFRP4, SFRP5, SIAH1, SKP1, SMAD2, SMAD3, SMAD4, SOX17, TBL1X, TBL1XR1, TBL1Y, TCF7, TCF7L1, TCF7L2, TP53, VANGL1, VANGL2, WIF1, WNT1, WNT10A, WNT10B, WNT11, WNT16, WNT2, WNT2B, WNT3, WNT3A, WNT4, WNT5A, WNT5B, WNT6, WNT7A, WNT7B, WNT8A, WNT8B, WNT9A, WNT9B | 143 | CACYBP(1), CHP(1), CSNK1A1L(1), CTNNB1(3), DAAM2(2), DKK2(1), DVL2(1), FZD1(1), FZD2(4), FZD4(2), FZD5(1), FZD6(1), FZD9(1), LEF1(1), LRP6(1), PPARD(1), PPP2R2B(1), PPP2R2C(1), PRICKLE2(1), PSEN1(1), RAC1(1), ROCK1(1), SFRP2(1), SMAD3(1), SOX17(1), TBL1XR1(2), TCF7L2(1), WNT1(1), WNT10B(1), WNT11(2), WNT2(1), WNT5A(1), WNT9A(1) | 20676462 | 42 | 32 | 41 | 17 | 6 | 15 | 7 | 3 | 11 | 0 | 4.6e-07 | 0.00029 |
| 2 | WNT_SIGNALING | Wnt signaling genes | APC, ARHA, AXIN1, C2orf31, CCND1, CCND2, CCND3, CSNK1E, CSNK1E, LOC400927, CTNNB1, DIPA, DVL1, DVL2, DVL3, FBXW2, FOSL1, FRAT1, FZD1, FZD10, FZD2, FZD3, FZD5, FZD6, FZD7, FZD8, FZD9, GSK3B, JUN, LDLR, MAPK10, MAPK9, MYC, PAFAH1B1, PLAU, PPP2R5C, PPP2R5E, PRKCA, PRKCB1, PRKCD, PRKCE, PRKCG, PRKCH, PRKCI, PRKCM, PRKCQ, PRKCZ, PRKD1, RAC1, RHOA, SFRP4, TCF7, WNT1, WNT10A, WNT10B, WNT11, WNT16, WNT2, WNT2B, WNT3, WNT4, WNT5A, WNT5B, WNT6, WNT7A, WNT7B | 58 | CTNNB1(3), DVL2(1), FZD1(1), FZD2(4), FZD5(1), FZD6(1), FZD9(1), LDLR(1), PLAU(1), PPP2R5E(1), RAC1(1), WNT1(1), WNT10B(1), WNT11(2), WNT2(1), WNT5A(1) | 7614586 | 22 | 17 | 21 | 6 | 3 | 6 | 4 | 4 | 5 | 0 | 0.000018 | 0.0055 |
| 3 | SA_REG_CASCADE_OF_CYCLIN_EXPR | Expression of cyclins regulates progression through the cell cycle by activating cyclin-dependent kinases. | CCNA1, CCNA2, CCND1, CCNE1, CCNE2, CDK2, CDK4, CDKN1B, CDKN2A, E2F1, E2F2, E2F4, PRB1 | 13 | CCNA1(1), CCNE2(1), CDKN1B(2), PRB1(2) | 1096762 | 6 | 6 | 6 | 0 | 1 | 0 | 3 | 0 | 2 | 0 | 0.0005 | 0.1 |
| 4 | HSA04916_MELANOGENESIS | Genes involved in melanogenesis | ADCY1, ADCY2, ADCY3, ADCY4, ADCY5, ADCY6, ADCY7, ADCY8, ADCY9, ASIP, CALM1, CALM2, CALM3, CALML3, CALML6, CAMK2A, CAMK2B, CAMK2D, CAMK2G, CREB1, CREB3, CREB3L1, CREB3L2, CREB3L3, CREB3L4, CREBBP, CTNNB1, DCT, DVL1, DVL2, DVL3, EDN1, EDNRB, EP300, FZD1, FZD10, FZD2, FZD3, FZD4, FZD5, FZD6, FZD7, FZD8, FZD9, GNAI1, GNAI2, GNAI3, GNAO1, GNAQ, GNAS, GSK3B, HRAS, KIT, KITLG, KRAS, LEF1, LOC652788, MAP2K1, MAP2K2, MAPK1, MAPK3, MC1R, MITF, NRAS, PLCB1, PLCB2, PLCB3, PLCB4, POMC, PRKACA, PRKACB, PRKACG, PRKCA, PRKCB1, PRKCG, PRKX, PRKY, RAF1, TCF7, TCF7L1, TCF7L2, TYR, TYRP1, WNT1, WNT10A, WNT10B, WNT11, WNT16, WNT2, WNT2B, WNT3, WNT3A, WNT4, WNT5A, WNT5B, WNT6, WNT7A, WNT7B, WNT8A, WNT8B, WNT9A, WNT9B | 99 | ADCY6(1), ADCY9(1), CALML6(1), CTNNB1(3), DVL2(1), FZD1(1), FZD2(4), FZD4(2), FZD5(1), FZD6(1), FZD9(1), GNAQ(1), LEF1(1), TCF7L2(1), WNT1(1), WNT10B(1), WNT11(2), WNT2(1), WNT5A(1), WNT9A(1) | 13939850 | 27 | 21 | 26 | 15 | 5 | 9 | 3 | 3 | 7 | 0 | 0.00081 | 0.12 |
| 5 | STAT3PATHWAY | The STAT transcription factors are phosphorylated and activated by JAK kinases in response to cytokine signaling. | FRAP1, JAK1, JAK2, JAK3, MAPK1, MAPK3, STAT3, TYK2 | 7 | JAK1(3), STAT3(2), TYK2(1) | 1521473 | 6 | 5 | 6 | 1 | 1 | 1 | 1 | 1 | 2 | 0 | 0.0013 | 0.16 |
| 6 | HSA00830_RETINOL_METABOLISM | Genes involved in retinol metabolism | ALDH1A1, ALDH1A2, BCMO1, RDH5 | 4 | ALDH1A2(1), BCMO1(2) | 483724 | 3 | 3 | 2 | 0 | 0 | 0 | 1 | 2 | 0 | 0 | 0.003 | 0.3 |
| 7 | HSA04080_NEUROACTIVE_LIGAND_RECEPTOR_INTERACTION | Genes involved in neuroactive ligand-receptor interaction | ADCYAP1R1, ADORA1, ADORA2A, ADORA2B, ADORA3, ADRA1A, ADRA1B, ADRA2A, ADRA2B, ADRA2C, ADRB1, ADRB2, ADRB3, AGTR1, AGTR2, AGTRL1, AVPR1A, AVPR1B, AVPR2, BDKRB1, BDKRB2, BRS3, C3AR1, C5AR1, CALCR, CALCRL, CCKAR, CCKBR, CGA, CHRM1, CHRM2, CHRM3, CHRM4, CHRM5, CNR1, CNR2, CRHR1, CRHR2, CTSG, CYSLTR1, CYSLTR2, DRD1, DRD2, DRD3, DRD4, DRD5, EDG1, EDG2, EDG3, EDG4, EDG5, EDG6, EDG7, EDG8, EDNRA, EDNRB, F2, F2R, F2RL1, F2RL2, F2RL3, FPR1, FPRL1, FPRL2, FSHB, FSHR, GABBR1, GABBR2, GABRA1, GABRA2, GABRA3, GABRA4, GABRA5, GABRA6, GABRB1, GABRB2, GABRB3, GABRD, GABRE, GABRG1, GABRG2, GABRG3, GABRP, GABRQ, GABRR1, GABRR2, GALR1, GALR2, GALR3, GCGR, GH1, GH2, GHR, GHRHR, GHSR, GIPR, GLP1R, GLP2R, GLRA1, GLRA2, GLRA3, GLRB, GNRHR, GPR156, GPR23, GPR35, GPR50, GPR63, GPR83, GRIA1, GRIA2, GRIA3, GRIA4, GRID1, GRID2, GRIK1, GRIK2, GRIK3, GRIK4, GRIK5, GRIN1, GRIN2A, GRIN2B, GRIN2C, GRIN2D, GRIN3A, GRIN3B, GRM1, GRM2, GRM3, GRM4, GRM5, GRM6, GRM7, GRM8, GRPR, GZMA, HCRTR1, HCRTR2, HRH1, HRH2, HRH3, HRH4, HTR1A, HTR1B, HTR1D, HTR1E, HTR1F, HTR2A, HTR2B, HTR2C, HTR4, HTR5A, HTR6, HTR7, KISS1R, LEP, LEPR, LHB, LHCGR, LTB4R, LTB4R2, MAS1, MC1R, MC2R, MC3R, MC4R, MC5R, MCHR1, MCHR2, MLNR, MTNR1A, MTNR1B, NMBR, NMUR1, NMUR2, NPBWR1, NPBWR2, NPFFR1, NPFFR2, NPY1R, NPY2R, NPY5R, NR3C1, NTSR1, NTSR2, OPRD1, OPRK1, OPRL1, OPRM1, OXTR, P2RX1, P2RX2, P2RX3, P2RX4, P2RX5, P2RX7, P2RXL1, P2RY1, P2RY10, P2RY11, P2RY13, P2RY14, P2RY2, P2RY4, P2RY5, P2RY6, P2RY8, PARD3, PPYR1, PRL, PRLHR, PRLR, PRSS1, PRSS2, PRSS3, PTAFR, PTGDR, PTGER1, PTGER2, PTGER3, PTGER4, PTGFR, PTGIR, PTH2R, PTHR1, RXFP1, RXFP2, SCTR, SSTR1, SSTR2, SSTR3, SSTR4, SSTR5, TAAR1, TAAR2, TAAR5, TAAR6, TAAR8, TAAR9, TACR1, TACR2, TACR3, TBXA2R, THRA, THRB, TRHR, TRPV1, TSHB, TSHR, TSPO, UTS2R, VIPR1, VIPR2 | 237 | ADRA2A(1), AGTR1(1), AVPR1A(1), CHRM4(1), DRD5(1), GABRE(2), GABRG1(2), GABRQ(1), GABRR1(1), GABRR2(2), GHR(1), GLP2R(1), GLRA2(1), GRIA1(1), GRIA4(1), GRID1(1), GRID2(3), GRIK1(1), GRIK4(1), GRIN2A(1), GRIN3B(1), GRM1(1), GRM4(1), GRM5(2), GRM7(2), GZMA(1), HTR5A(1), MTNR1A(1), P2RX5(1), P2RY1(1), PRSS3(1), PTGER2(1), RXFP1(1), SSTR2(1), TACR3(1), TBXA2R(1) | 28288807 | 43 | 36 | 42 | 14 | 15 | 17 | 1 | 3 | 7 | 0 | 0.0046 | 0.36 |
| 8 | STRIATED_MUSCLE_CONTRACTION | ACTA1, ACTA2, ACTC, ACTN2, ACTN3, ACTN4, C9orf97, DES, DES, FAM48A, DMD, MYBPC1, MYBPC2, MYBPC3, MYH3, MYH6, MYH6, MYH7, MYH8, MYL1, MYL2, MYL3, MYL4, MYL9, MYOM1, NEB, TCAP, TMOD1, TNNC2, TNNI1, TNNI2, TNNI3, TNNT1, TNNT2, TNNT3, TPM1, TPM2, TPM3, TPM4, TPM4, TTN, VIM | 37 | DMD(1), MYBPC1(1), MYBPC2(1), MYBPC3(1), MYH6(2), MYH7(1), MYH8(1), MYL1(1), NEB(2), TTN(18) | 17519972 | 29 | 27 | 28 | 1 | 7 | 8 | 5 | 5 | 4 | 0 | 0.0047 | 0.36 | |
| 9 | SA_G1_AND_S_PHASES | Cdk2, 4, and 6 bind cyclin D in G1, while cdk2/cyclin E promotes the G1/S transition. | ARF1, ARF3, CCND1, CDK2, CDK4, CDKN1A, CDKN1B, CDKN2A, CFL1, E2F1, E2F2, MDM2, NXT1, PRB1, TP53 | 14 | CDKN1B(2), PRB1(2) | 911174 | 4 | 4 | 4 | 0 | 0 | 0 | 2 | 0 | 2 | 0 | 0.0053 | 0.36 |
| 10 | SMALL_LIGAND_GPCRS | C9orf47, CNR1, CNR2, DNMT1, EDG1, EDG2, EDG5, EDG6, MTNR1A, MTNR1B, PTAFR, PTGDR, PTGER1, PTGER2, PTGER4, PTGFR, PTGIR, TBXA2R | 14 | DNMT1(2), MTNR1A(1), PTGER2(1), TBXA2R(1) | 1476736 | 5 | 5 | 5 | 0 | 0 | 2 | 0 | 2 | 1 | 0 | 0.0063 | 0.36 |
In brief, we tabulate the number of mutations and the number of covered bases for each gene. The counts are broken down by mutation context category: four context categories that are discovered by MutSig, and one for indel and 'null' mutations, which include indels, nonsense mutations, splice-site mutations, and non-stop (read-through) mutations. For each gene, we calculate the probability of seeing the observed constellation of mutations, i.e. the product P1 x P2 x ... x Pm, or a more extreme one, given the background mutation rates calculated across the dataset.[1]
This is an experimental feature. The full results of the analysis summarized in this report can be downloaded from the TCGA Data Coordination Center.