This pipeline computes the correlation between significant arm-level copy number variations (cnvs) and selected clinical features.
Testing the association between copy number variation 48 arm-level results and 7 clinical features across 75 patients, 3 significant findings detected with Q value < 0.25.
-
1q gain cnv correlated to 'Time to Death'.
-
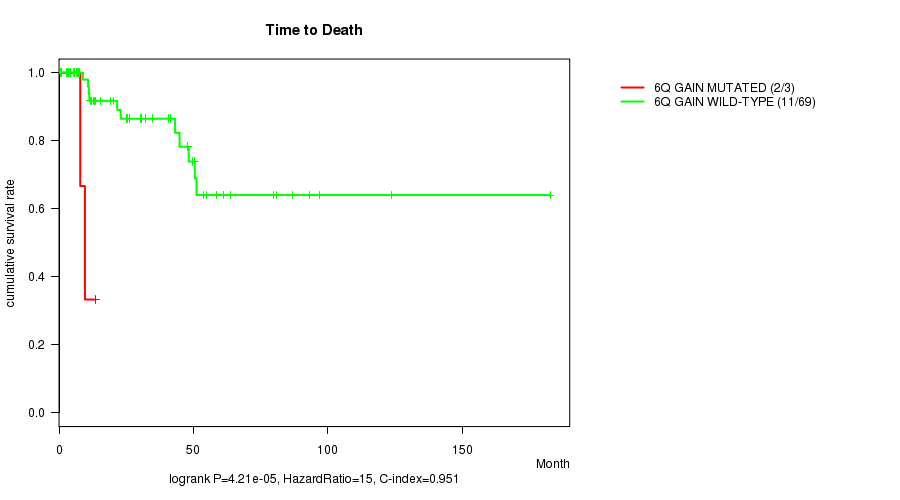
6q gain cnv correlated to 'Time to Death'.
-
17p gain cnv correlated to 'PATHOLOGY.T'.
Table 1. Get Full Table Overview of the association between significant copy number variation of 48 arm-level results and 7 clinical features. Shown in the table are P values (Q values). Thresholded by Q value < 0.25, 3 significant findings detected.
|
Clinical Features |
Time to Death |
AGE | GENDER |
KARNOFSKY PERFORMANCE SCORE |
PATHOLOGY T |
PATHOLOGY N |
PATHOLOGICSPREAD(M) | ||
| nCNV (%) | nWild-Type | logrank test | t-test | Fisher's exact test | t-test | Fisher's exact test | Fisher's exact test | Fisher's exact test | |
| 1q gain | 6 (8%) | 69 |
0.000488 (0.139) |
0.276 (1.00) |
1 (1.00) |
0.00462 (1.00) |
1 (1.00) |
0.0952 (1.00) |
|
| 6q gain | 3 (4%) | 72 |
4.21e-05 (0.0121) |
0.23 (1.00) |
0.551 (1.00) |
0.708 (1.00) |
0.0302 (1.00) |
||
| 17p gain | 34 (45%) | 41 |
0.517 (1.00) |
0.374 (1.00) |
0.0207 (1.00) |
0.423 (1.00) |
0.00037 (0.106) |
0.396 (1.00) |
0.493 (1.00) |
| 2p gain | 10 (13%) | 65 |
0.25 (1.00) |
0.249 (1.00) |
1 (1.00) |
0.495 (1.00) |
0.888 (1.00) |
0.311 (1.00) |
0.0158 (1.00) |
| 2q gain | 11 (15%) | 64 |
0.339 (1.00) |
0.294 (1.00) |
1 (1.00) |
0.495 (1.00) |
1 (1.00) |
0.639 (1.00) |
0.0421 (1.00) |
| 3p gain | 20 (27%) | 55 |
0.47 (1.00) |
0.856 (1.00) |
0.152 (1.00) |
0.0315 (1.00) |
0.553 (1.00) |
||
| 3q gain | 22 (29%) | 53 |
0.323 (1.00) |
0.898 (1.00) |
0.0928 (1.00) |
0.0656 (1.00) |
1 (1.00) |
0.356 (1.00) |
|
| 4p gain | 4 (5%) | 71 |
0.114 (1.00) |
0.0312 (1.00) |
1 (1.00) |
0.441 (1.00) |
0.583 (1.00) |
0.0202 (1.00) |
|
| 4q gain | 3 (4%) | 72 |
0.667 (1.00) |
0.027 (1.00) |
1 (1.00) |
0.496 (1.00) |
|||
| 5p gain | 8 (11%) | 67 |
0.634 (1.00) |
0.11 (1.00) |
0.223 (1.00) |
0.04 (1.00) |
1 (1.00) |
0.485 (1.00) |
|
| 5q gain | 9 (12%) | 66 |
0.165 (1.00) |
0.29 (1.00) |
0.435 (1.00) |
0.124 (1.00) |
0.655 (1.00) |
0.671 (1.00) |
|
| 6p gain | 4 (5%) | 71 |
0.0959 (1.00) |
0.312 (1.00) |
0.314 (1.00) |
0.335 (1.00) |
0.583 (1.00) |
0.0292 (1.00) |
|
| 7p gain | 38 (51%) | 37 |
0.482 (1.00) |
0.579 (1.00) |
0.133 (1.00) |
0.399 (1.00) |
0.051 (1.00) |
1 (1.00) |
0.71 (1.00) |
| 7q gain | 38 (51%) | 37 |
0.219 (1.00) |
0.847 (1.00) |
0.318 (1.00) |
0.357 (1.00) |
0.051 (1.00) |
0.686 (1.00) |
0.42 (1.00) |
| 8p gain | 4 (5%) | 71 |
0.508 (1.00) |
0.517 (1.00) |
1 (1.00) |
0.335 (1.00) |
0.583 (1.00) |
1 (1.00) |
|
| 8q gain | 7 (9%) | 68 |
0.0107 (1.00) |
0.702 (1.00) |
0.412 (1.00) |
0.03 (1.00) |
0.372 (1.00) |
0.485 (1.00) |
|
| 10p gain | 3 (4%) | 72 |
1 (1.00) |
0.496 (1.00) |
|||||
| 12p gain | 22 (29%) | 53 |
0.82 (1.00) |
0.615 (1.00) |
0.265 (1.00) |
0.717 (1.00) |
0.67 (1.00) |
0.077 (1.00) |
|
| 12q gain | 22 (29%) | 53 |
0.82 (1.00) |
0.615 (1.00) |
0.265 (1.00) |
0.717 (1.00) |
0.67 (1.00) |
0.077 (1.00) |
|
| 13q gain | 10 (13%) | 65 |
0.649 (1.00) |
0.295 (1.00) |
1 (1.00) |
0.399 (1.00) |
0.447 (1.00) |
0.42 (1.00) |
|
| 16p gain | 34 (45%) | 41 |
0.847 (1.00) |
0.419 (1.00) |
0.0207 (1.00) |
0.357 (1.00) |
0.764 (1.00) |
1 (1.00) |
0.915 (1.00) |
| 16q gain | 30 (40%) | 45 |
0.0714 (1.00) |
0.528 (1.00) |
0.07 (1.00) |
0.399 (1.00) |
0.402 (1.00) |
0.396 (1.00) |
0.169 (1.00) |
| 17q gain | 45 (60%) | 30 |
0.668 (1.00) |
0.673 (1.00) |
0.123 (1.00) |
0.48 (1.00) |
1 (1.00) |
0.379 (1.00) |
|
| 18p gain | 6 (8%) | 69 |
0.277 (1.00) |
0.522 (1.00) |
0.664 (1.00) |
0.495 (1.00) |
1 (1.00) |
0.378 (1.00) |
|
| 18q gain | 4 (5%) | 71 |
0.574 (1.00) |
0.513 (1.00) |
1 (1.00) |
0.781 (1.00) |
0.639 (1.00) |
||
| 20p gain | 20 (27%) | 55 |
0.462 (1.00) |
0.104 (1.00) |
0.777 (1.00) |
0.462 (1.00) |
0.378 (1.00) |
0.655 (1.00) |
0.728 (1.00) |
| 20q gain | 22 (29%) | 53 |
0.462 (1.00) |
0.211 (1.00) |
1 (1.00) |
0.462 (1.00) |
0.348 (1.00) |
0.655 (1.00) |
0.906 (1.00) |
| 1p loss | 7 (9%) | 68 |
0.619 (1.00) |
0.736 (1.00) |
1 (1.00) |
0.531 (1.00) |
0.623 (1.00) |
||
| 3p loss | 5 (7%) | 70 |
0.273 (1.00) |
0.096 (1.00) |
0.313 (1.00) |
0.3 (1.00) |
1 (1.00) |
0.378 (1.00) |
|
| 4p loss | 5 (7%) | 70 |
0.168 (1.00) |
0.0966 (1.00) |
0.147 (1.00) |
0.235 (1.00) |
1 (1.00) |
1 (1.00) |
|
| 4q loss | 5 (7%) | 70 |
0.762 (1.00) |
0.567 (1.00) |
0.627 (1.00) |
0.677 (1.00) |
1 (1.00) |
||
| 5p loss | 4 (5%) | 71 |
0.000961 (0.273) |
0.181 (1.00) |
0.576 (1.00) |
0.0778 (1.00) |
0.0873 (1.00) |
0.183 (1.00) |
|
| 5q loss | 3 (4%) | 72 |
0.659 (1.00) |
0.00881 (1.00) |
1 (1.00) |
0.0849 (1.00) |
0.583 (1.00) |
0.1 (1.00) |
|
| 6p loss | 7 (9%) | 68 |
0.0267 (1.00) |
0.685 (1.00) |
0.184 (1.00) |
0.317 (1.00) |
0.531 (1.00) |
1 (1.00) |
0.802 (1.00) |
| 6q loss | 9 (12%) | 66 |
0.36 (1.00) |
0.729 (1.00) |
0.0159 (1.00) |
0.317 (1.00) |
0.417 (1.00) |
0.6 (1.00) |
1 (1.00) |
| 9p loss | 10 (13%) | 65 |
0.0938 (1.00) |
0.451 (1.00) |
0.00538 (1.00) |
0.416 (1.00) |
0.264 (1.00) |
1 (1.00) |
0.364 (1.00) |
| 9q loss | 11 (15%) | 64 |
0.156 (1.00) |
0.624 (1.00) |
0.0711 (1.00) |
0.416 (1.00) |
0.426 (1.00) |
1 (1.00) |
0.641 (1.00) |
| 10q loss | 4 (5%) | 71 |
0.00303 (0.858) |
0.741 (1.00) |
1 (1.00) |
0.335 (1.00) |
0.296 (1.00) |
||
| 11p loss | 6 (8%) | 69 |
0.157 (1.00) |
0.159 (1.00) |
0.664 (1.00) |
0.155 (1.00) |
0.323 (1.00) |
||
| 11q loss | 7 (9%) | 68 |
0.0196 (1.00) |
0.198 (1.00) |
1 (1.00) |
0.03 (1.00) |
1 (1.00) |
0.623 (1.00) |
|
| 13q loss | 5 (7%) | 70 |
0.0222 (1.00) |
0.334 (1.00) |
0.024 (1.00) |
0.235 (1.00) |
0.583 (1.00) |
1 (1.00) |
|
| 14q loss | 13 (17%) | 62 |
0.507 (1.00) |
0.733 (1.00) |
0.507 (1.00) |
0.416 (1.00) |
0.616 (1.00) |
0.67 (1.00) |
0.418 (1.00) |
| 15q loss | 6 (8%) | 69 |
0.0652 (1.00) |
0.462 (1.00) |
0.351 (1.00) |
0.386 (1.00) |
1 (1.00) |
1 (1.00) |
|
| 17p loss | 3 (4%) | 72 |
0.204 (1.00) |
0.0849 (1.00) |
0.1 (1.00) |
||||
| 18p loss | 9 (12%) | 66 |
0.00507 (1.00) |
0.734 (1.00) |
1 (1.00) |
0.124 (1.00) |
0.639 (1.00) |
0.266 (1.00) |
|
| 18q loss | 10 (13%) | 65 |
0.00507 (1.00) |
0.734 (1.00) |
1 (1.00) |
0.0584 (1.00) |
0.639 (1.00) |
0.291 (1.00) |
|
| 21q loss | 10 (13%) | 65 |
0.149 (1.00) |
0.368 (1.00) |
1 (1.00) |
0.79 (1.00) |
1 (1.00) |
0.862 (1.00) |
|
| 22q loss | 15 (20%) | 60 |
0.731 (1.00) |
0.54 (1.00) |
0.12 (1.00) |
0.423 (1.00) |
0.0791 (1.00) |
1 (1.00) |
0.133 (1.00) |
P value = 0.000488 (logrank test), Q value = 0.14
Table S1. Gene #1: '1q gain mutation analysis' versus Clinical Feature #1: 'Time to Death'
| nPatients | nDeath | Duration Range (Median), Month | |
|---|---|---|---|
| ALL | 72 | 13 | 0.5 - 182.7 (19.7) |
| 1Q GAIN MUTATED | 6 | 2 | 0.9 - 25.4 (7.8) |
| 1Q GAIN WILD-TYPE | 66 | 11 | 0.5 - 182.7 (22.3) |
Figure S1. Get High-res Image Gene #1: '1q gain mutation analysis' versus Clinical Feature #1: 'Time to Death'

P value = 4.21e-05 (logrank test), Q value = 0.012
Table S2. Gene #11: '6q gain mutation analysis' versus Clinical Feature #1: 'Time to Death'
| nPatients | nDeath | Duration Range (Median), Month | |
|---|---|---|---|
| ALL | 72 | 13 | 0.5 - 182.7 (19.7) |
| 6Q GAIN MUTATED | 3 | 2 | 7.9 - 13.6 (9.6) |
| 6Q GAIN WILD-TYPE | 69 | 11 | 0.5 - 182.7 (21.6) |
Figure S2. Get High-res Image Gene #11: '6q gain mutation analysis' versus Clinical Feature #1: 'Time to Death'
P value = 0.00037 (Fisher's exact test), Q value = 0.11
Table S3. Gene #22: '17p gain mutation analysis' versus Clinical Feature #5: 'PATHOLOGY.T'
| nPatients | T1 | T2 | T3+T4 |
|---|---|---|---|
| ALL | 38 | 9 | 28 |
| 17P GAIN MUTATED | 22 | 7 | 5 |
| 17P GAIN WILD-TYPE | 16 | 2 | 23 |
Figure S3. Get High-res Image Gene #22: '17p gain mutation analysis' versus Clinical Feature #5: 'PATHOLOGY.T'

-
Mutation data file = broad_values_by_arm.mutsig.cluster.txt
-
Clinical data file = KIRP.clin.merged.picked.txt
-
Number of patients = 75
-
Number of significantly arm-level cnvs = 48
-
Number of selected clinical features = 7
-
Exclude genes that fewer than K tumors have mutations, K = 3
For survival clinical features, the Kaplan-Meier survival curves of tumors with and without gene mutations were plotted and the statistical significance P values were estimated by logrank test (Bland and Altman 2004) using the 'survdiff' function in R
For continuous numerical clinical features, two-tailed Student's t test with unequal variance (Lehmann and Romano 2005) was applied to compare the clinical values between tumors with and without gene mutations using 't.test' function in R
For binary or multi-class clinical features (nominal or ordinal), two-tailed Fisher's exact tests (Fisher 1922) were used to estimate the P values using the 'fisher.test' function in R
For multiple hypothesis correction, Q value is the False Discovery Rate (FDR) analogue of the P value (Benjamini and Hochberg 1995), defined as the minimum FDR at which the test may be called significant. We used the 'Benjamini and Hochberg' method of 'p.adjust' function in R to convert P values into Q values.
This is an experimental feature. The full results of the analysis summarized in this report can be downloaded from the TCGA Data Coordination Center.