This pipeline computes the correlation between significant arm-level copy number variations (cnvs) and selected clinical features.
Testing the association between copy number variation 77 arm-level results and 10 clinical features across 265 patients, 3 significant findings detected with Q value < 0.25.
-
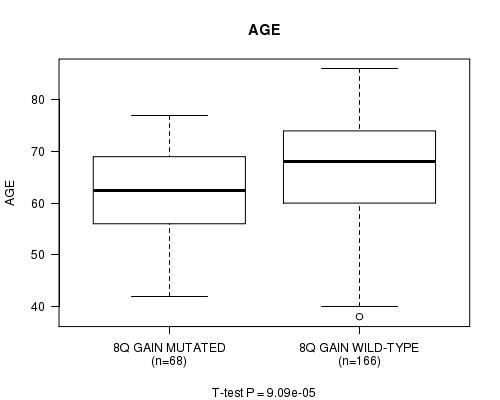
8q gain cnv correlated to 'AGE'.
-
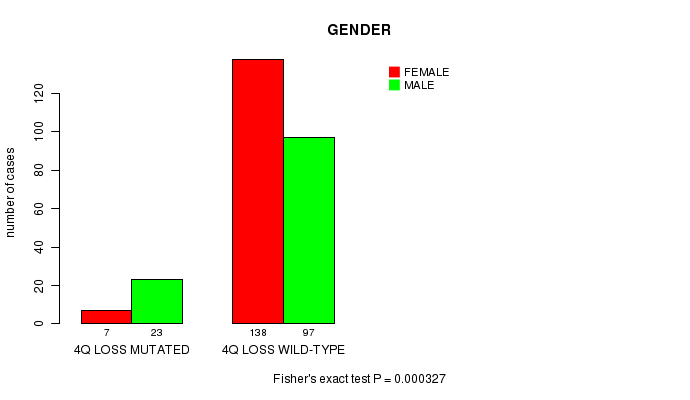
4q loss cnv correlated to 'GENDER'.
-
7q loss cnv correlated to 'HISTOLOGICAL.TYPE'.
Table 1. Get Full Table Overview of the association between significant copy number variation of 77 arm-level results and 10 clinical features. Shown in the table are P values (Q values). Thresholded by Q value < 0.25, 3 significant findings detected.
|
Clinical Features |
Time to Death |
AGE | GENDER |
KARNOFSKY PERFORMANCE SCORE |
HISTOLOGICAL TYPE |
PATHOLOGY T |
PATHOLOGY N |
PATHOLOGICSPREAD(M) |
RADIATIONS RADIATION REGIMENINDICATION |
NEOADJUVANT THERAPY |
||
| nCNV (%) | nWild-Type | logrank test | t-test | Fisher's exact test | t-test | Chi-square test | Fisher's exact test | Fisher's exact test | Fisher's exact test | Fisher's exact test | Fisher's exact test | |
| 8q gain | 79 (30%) | 186 |
0.882 (1.00) |
9.09e-05 (0.0664) |
1 (1.00) |
0.413 (1.00) |
0.632 (1.00) |
0.457 (1.00) |
0.199 (1.00) |
0.248 (1.00) |
0.761 (1.00) |
0.852 (1.00) |
| 4q loss | 30 (11%) | 235 |
0.744 (1.00) |
0.0657 (1.00) |
0.000327 (0.238) |
0.926 (1.00) |
0.713 (1.00) |
0.064 (1.00) |
0.0988 (1.00) |
0.578 (1.00) |
0.171 (1.00) |
0.42 (1.00) |
| 7q loss | 13 (5%) | 252 |
0.355 (1.00) |
0.72 (1.00) |
0.777 (1.00) |
3.91e-05 (0.0286) |
0.908 (1.00) |
0.925 (1.00) |
0.745 (1.00) |
1 (1.00) |
0.699 (1.00) |
|
| 1p gain | 42 (16%) | 223 |
0.94 (1.00) |
0.00869 (1.00) |
1 (1.00) |
0.68 (1.00) |
0.806 (1.00) |
0.585 (1.00) |
0.0255 (1.00) |
0.287 (1.00) |
0.699 (1.00) |
0.643 (1.00) |
| 1q gain | 111 (42%) | 154 |
0.875 (1.00) |
0.878 (1.00) |
0.533 (1.00) |
0.51 (1.00) |
0.331 (1.00) |
0.717 (1.00) |
0.0377 (1.00) |
0.34 (1.00) |
0.779 (1.00) |
0.488 (1.00) |
| 2p gain | 39 (15%) | 226 |
0.101 (1.00) |
0.0543 (1.00) |
0.081 (1.00) |
0.343 (1.00) |
0.902 (1.00) |
0.146 (1.00) |
0.942 (1.00) |
0.195 (1.00) |
0.415 (1.00) |
1 (1.00) |
| 2q gain | 28 (11%) | 237 |
0.041 (1.00) |
0.442 (1.00) |
0.423 (1.00) |
0.238 (1.00) |
0.573 (1.00) |
0.854 (1.00) |
0.393 (1.00) |
1 (1.00) |
0.588 (1.00) |
|
| 3p gain | 9 (3%) | 256 |
0.343 (1.00) |
0.675 (1.00) |
1 (1.00) |
0.157 (1.00) |
0.0526 (1.00) |
0.356 (1.00) |
0.431 (1.00) |
0.369 (1.00) |
1 (1.00) |
|
| 3q gain | 22 (8%) | 243 |
0.195 (1.00) |
0.486 (1.00) |
1 (1.00) |
0.202 (1.00) |
1 (1.00) |
0.551 (1.00) |
0.913 (1.00) |
0.294 (1.00) |
1 (1.00) |
|
| 4p gain | 19 (7%) | 246 |
0.884 (1.00) |
0.138 (1.00) |
1 (1.00) |
0.934 (1.00) |
0.342 (1.00) |
0.556 (1.00) |
0.119 (1.00) |
1 (1.00) |
0.747 (1.00) |
|
| 4q gain | 8 (3%) | 257 |
0.581 (1.00) |
0.469 (1.00) |
0.474 (1.00) |
1 (1.00) |
0.111 (1.00) |
0.754 (1.00) |
0.438 (1.00) |
0.335 (1.00) |
1 (1.00) |
|
| 5p gain | 116 (44%) | 149 |
0.192 (1.00) |
0.07 (1.00) |
0.711 (1.00) |
0.935 (1.00) |
0.316 (1.00) |
0.489 (1.00) |
0.984 (1.00) |
0.922 (1.00) |
0.569 (1.00) |
1 (1.00) |
| 5q gain | 35 (13%) | 230 |
0.613 (1.00) |
0.84 (1.00) |
0.363 (1.00) |
0.803 (1.00) |
0.691 (1.00) |
0.934 (1.00) |
0.692 (1.00) |
0.39 (1.00) |
0.202 (1.00) |
|
| 6p gain | 44 (17%) | 221 |
0.879 (1.00) |
0.401 (1.00) |
0.408 (1.00) |
0.928 (1.00) |
0.378 (1.00) |
0.969 (1.00) |
0.292 (1.00) |
0.127 (1.00) |
1 (1.00) |
0.163 (1.00) |
| 6q gain | 12 (5%) | 253 |
0.701 (1.00) |
0.306 (1.00) |
0.071 (1.00) |
0.991 (1.00) |
0.947 (1.00) |
0.764 (1.00) |
0.299 (1.00) |
1 (1.00) |
0.699 (1.00) |
|
| 7p gain | 92 (35%) | 173 |
0.439 (1.00) |
0.136 (1.00) |
0.897 (1.00) |
0.395 (1.00) |
0.483 (1.00) |
0.677 (1.00) |
0.0164 (1.00) |
0.862 (1.00) |
1 (1.00) |
1 (1.00) |
| 7q gain | 65 (25%) | 200 |
0.978 (1.00) |
0.00103 (0.748) |
0.477 (1.00) |
0.75 (1.00) |
0.67 (1.00) |
0.697 (1.00) |
0.0426 (1.00) |
0.198 (1.00) |
0.0923 (1.00) |
0.69 (1.00) |
| 8p gain | 29 (11%) | 236 |
0.361 (1.00) |
0.00904 (1.00) |
0.323 (1.00) |
0.543 (1.00) |
0.21 (1.00) |
0.804 (1.00) |
0.435 (1.00) |
0.199 (1.00) |
0.641 (1.00) |
0.408 (1.00) |
| 9p gain | 5 (2%) | 260 |
0.21 (1.00) |
0.853 (1.00) |
0.179 (1.00) |
0.999 (1.00) |
0.208 (1.00) |
0.825 (1.00) |
1 (1.00) |
1 (1.00) |
1 (1.00) |
|
| 9q gain | 4 (2%) | 261 |
0.0589 (1.00) |
0.338 (1.00) |
1 (1.00) |
1 (1.00) |
0.383 (1.00) |
1 (1.00) |
1 (1.00) |
1 (1.00) |
1 (1.00) |
|
| 10p gain | 31 (12%) | 234 |
0.84 (1.00) |
0.85 (1.00) |
0.337 (1.00) |
0.0799 (1.00) |
0.478 (1.00) |
0.235 (1.00) |
1 (1.00) |
0.375 (1.00) |
1 (1.00) |
|
| 10q gain | 16 (6%) | 249 |
0.822 (1.00) |
0.432 (1.00) |
0.441 (1.00) |
0.0757 (1.00) |
0.613 (1.00) |
0.282 (1.00) |
0.804 (1.00) |
1 (1.00) |
1 (1.00) |
|
| 11p gain | 20 (8%) | 245 |
0.4 (1.00) |
0.238 (1.00) |
0.484 (1.00) |
0.658 (1.00) |
0.461 (1.00) |
0.215 (1.00) |
0.192 (1.00) |
0.682 (1.00) |
0.256 (1.00) |
0.199 (1.00) |
| 11q gain | 28 (11%) | 237 |
0.335 (1.00) |
0.00603 (1.00) |
0.229 (1.00) |
0.658 (1.00) |
0.818 (1.00) |
0.765 (1.00) |
0.921 (1.00) |
0.406 (1.00) |
0.635 (1.00) |
0.588 (1.00) |
| 12p gain | 39 (15%) | 226 |
0.56 (1.00) |
0.17 (1.00) |
0.487 (1.00) |
0.775 (1.00) |
0.0226 (1.00) |
0.224 (1.00) |
0.62 (1.00) |
1 (1.00) |
0.628 (1.00) |
|
| 12q gain | 30 (11%) | 235 |
0.914 (1.00) |
0.0163 (1.00) |
1 (1.00) |
0.713 (1.00) |
0.0378 (1.00) |
0.143 (1.00) |
0.114 (1.00) |
1 (1.00) |
0.42 (1.00) |
|
| 13q gain | 17 (6%) | 248 |
0.948 (1.00) |
0.835 (1.00) |
0.617 (1.00) |
0.00592 (1.00) |
0.233 (1.00) |
0.281 (1.00) |
0.119 (1.00) |
0.586 (1.00) |
0.728 (1.00) |
|
| 14q gain | 36 (14%) | 229 |
0.589 (1.00) |
0.429 (1.00) |
0.281 (1.00) |
0.451 (1.00) |
0.101 (1.00) |
0.761 (1.00) |
0.0886 (1.00) |
0.71 (1.00) |
0.226 (1.00) |
0.619 (1.00) |
| 15q gain | 9 (3%) | 256 |
0.319 (1.00) |
0.126 (1.00) |
0.518 (1.00) |
0.333 (1.00) |
0.742 (1.00) |
0.376 (1.00) |
0.0611 (1.00) |
1 (1.00) |
1 (1.00) |
|
| 16p gain | 37 (14%) | 228 |
0.943 (1.00) |
0.0619 (1.00) |
1 (1.00) |
0.286 (1.00) |
0.834 (1.00) |
0.853 (1.00) |
0.937 (1.00) |
0.52 (1.00) |
0.7 (1.00) |
0.224 (1.00) |
| 16q gain | 20 (8%) | 245 |
0.678 (1.00) |
0.12 (1.00) |
0.816 (1.00) |
0.811 (1.00) |
0.922 (1.00) |
0.43 (1.00) |
1 (1.00) |
0.608 (1.00) |
1 (1.00) |
|
| 17p gain | 19 (7%) | 246 |
0.441 (1.00) |
0.219 (1.00) |
0.339 (1.00) |
0.653 (1.00) |
0.476 (1.00) |
0.178 (1.00) |
0.713 (1.00) |
1 (1.00) |
0.237 (1.00) |
0.747 (1.00) |
| 17q gain | 51 (19%) | 214 |
0.521 (1.00) |
0.0643 (1.00) |
0.876 (1.00) |
0.526 (1.00) |
0.124 (1.00) |
0.0609 (1.00) |
0.883 (1.00) |
0.548 (1.00) |
0.284 (1.00) |
1 (1.00) |
| 18p gain | 22 (8%) | 243 |
0.501 (1.00) |
0.363 (1.00) |
1 (1.00) |
0.283 (1.00) |
0.771 (1.00) |
0.887 (1.00) |
1 (1.00) |
0.419 (1.00) |
0.0823 (1.00) |
0.754 (1.00) |
| 18q gain | 14 (5%) | 251 |
0.403 (1.00) |
0.0792 (1.00) |
0.787 (1.00) |
0.96 (1.00) |
0.00268 (1.00) |
0.644 (1.00) |
0.744 (1.00) |
0.676 (1.00) |
0.514 (1.00) |
0.239 (1.00) |
| 19p gain | 6 (2%) | 259 |
0.532 (1.00) |
0.0675 (1.00) |
0.692 (1.00) |
1 (1.00) |
0.726 (1.00) |
0.245 (1.00) |
0.369 (1.00) |
1 (1.00) |
1 (1.00) |
|
| 19q gain | 18 (7%) | 247 |
0.197 (1.00) |
0.00165 (1.00) |
0.807 (1.00) |
0.968 (1.00) |
0.939 (1.00) |
0.0712 (1.00) |
0.182 (1.00) |
1 (1.00) |
0.326 (1.00) |
|
| 20p gain | 32 (12%) | 233 |
0.849 (1.00) |
0.247 (1.00) |
0.576 (1.00) |
0.371 (1.00) |
0.646 (1.00) |
0.669 (1.00) |
0.51 (1.00) |
0.933 (1.00) |
0.197 (1.00) |
0.0608 (1.00) |
| 20q gain | 40 (15%) | 225 |
0.196 (1.00) |
0.113 (1.00) |
0.12 (1.00) |
0.379 (1.00) |
0.359 (1.00) |
0.67 (1.00) |
0.693 (1.00) |
0.699 (1.00) |
0.472 (1.00) |
|
| 21q gain | 27 (10%) | 238 |
0.567 (1.00) |
0.546 (1.00) |
0.103 (1.00) |
0.477 (1.00) |
0.642 (1.00) |
0.6 (1.00) |
0.301 (1.00) |
1 (1.00) |
0.15 (1.00) |
|
| 22q gain | 12 (5%) | 253 |
0.184 (1.00) |
0.527 (1.00) |
1 (1.00) |
0.119 (1.00) |
0.152 (1.00) |
0.105 (1.00) |
0.187 (1.00) |
0.46 (1.00) |
0.399 (1.00) |
|
| 1p loss | 29 (11%) | 236 |
0.83 (1.00) |
0.186 (1.00) |
0.323 (1.00) |
0.879 (1.00) |
0.841 (1.00) |
0.537 (1.00) |
0.0731 (1.00) |
0.641 (1.00) |
1 (1.00) |
|
| 1q loss | 10 (4%) | 255 |
0.76 (1.00) |
0.79 (1.00) |
0.193 (1.00) |
0.427 (1.00) |
0.371 (1.00) |
0.262 (1.00) |
1 (1.00) |
0.401 (1.00) |
1 (1.00) |
|
| 2p loss | 3 (1%) | 262 |
0.0257 (1.00) |
1 (1.00) |
0.998 (1.00) |
0.482 (1.00) |
1 (1.00) |
0.149 (1.00) |
1 (1.00) |
0.389 (1.00) |
||
| 3p loss | 50 (19%) | 215 |
0.402 (1.00) |
0.418 (1.00) |
1 (1.00) |
0.013 (1.00) |
0.684 (1.00) |
0.536 (1.00) |
0.246 (1.00) |
0.115 (1.00) |
0.716 (1.00) |
0.279 (1.00) |
| 3q loss | 32 (12%) | 233 |
0.794 (1.00) |
0.403 (1.00) |
0.351 (1.00) |
0.0394 (1.00) |
0.76 (1.00) |
0.929 (1.00) |
0.0967 (1.00) |
0.573 (1.00) |
1 (1.00) |
1 (1.00) |
| 4p loss | 33 (12%) | 232 |
0.875 (1.00) |
0.0363 (1.00) |
0.026 (1.00) |
0.926 (1.00) |
0.0516 (1.00) |
0.839 (1.00) |
0.594 (1.00) |
0.733 (1.00) |
0.669 (1.00) |
0.0639 (1.00) |
| 5p loss | 8 (3%) | 257 |
0.21 (1.00) |
0.173 (1.00) |
0.732 (1.00) |
0.992 (1.00) |
0.00864 (1.00) |
0.332 (1.00) |
0.148 (1.00) |
1 (1.00) |
0.611 (1.00) |
|
| 5q loss | 46 (17%) | 219 |
0.256 (1.00) |
0.293 (1.00) |
0.105 (1.00) |
0.73 (1.00) |
0.42 (1.00) |
0.866 (1.00) |
0.0293 (1.00) |
0.909 (1.00) |
0.477 (1.00) |
0.822 (1.00) |
| 6p loss | 31 (12%) | 234 |
0.77 (1.00) |
0.349 (1.00) |
0.565 (1.00) |
0.0207 (1.00) |
0.958 (1.00) |
0.863 (1.00) |
0.124 (1.00) |
0.578 (1.00) |
0.184 (1.00) |
1 (1.00) |
| 6q loss | 63 (24%) | 202 |
0.879 (1.00) |
0.714 (1.00) |
0.147 (1.00) |
0.0207 (1.00) |
0.515 (1.00) |
0.803 (1.00) |
0.233 (1.00) |
0.218 (1.00) |
0.515 (1.00) |
0.688 (1.00) |
| 7p loss | 11 (4%) | 254 |
0.57 (1.00) |
0.43 (1.00) |
1 (1.00) |
0.148 (1.00) |
0.745 (1.00) |
1 (1.00) |
0.575 (1.00) |
0.431 (1.00) |
0.674 (1.00) |
|
| 8p loss | 78 (29%) | 187 |
0.725 (1.00) |
0.741 (1.00) |
0.893 (1.00) |
0.175 (1.00) |
0.238 (1.00) |
0.241 (1.00) |
0.678 (1.00) |
0.541 (1.00) |
0.534 (1.00) |
0.452 (1.00) |
| 8q loss | 13 (5%) | 252 |
0.368 (1.00) |
0.591 (1.00) |
1 (1.00) |
0.00062 (0.451) |
0.731 (1.00) |
0.495 (1.00) |
1 (1.00) |
1 (1.00) |
1 (1.00) |
|
| 9p loss | 83 (31%) | 182 |
0.127 (1.00) |
0.192 (1.00) |
0.287 (1.00) |
0.833 (1.00) |
0.652 (1.00) |
0.94 (1.00) |
0.0486 (1.00) |
0.496 (1.00) |
1 (1.00) |
1 (1.00) |
| 9q loss | 69 (26%) | 196 |
0.301 (1.00) |
0.616 (1.00) |
0.888 (1.00) |
0.982 (1.00) |
0.801 (1.00) |
0.603 (1.00) |
0.142 (1.00) |
1 (1.00) |
0.524 (1.00) |
0.116 (1.00) |
| 10p loss | 31 (12%) | 234 |
0.122 (1.00) |
0.211 (1.00) |
0.0572 (1.00) |
0.00324 (1.00) |
0.984 (1.00) |
0.359 (1.00) |
0.0396 (1.00) |
1 (1.00) |
1 (1.00) |
|
| 10q loss | 26 (10%) | 239 |
0.879 (1.00) |
0.0392 (1.00) |
0.837 (1.00) |
0.00658 (1.00) |
0.56 (1.00) |
0.0775 (1.00) |
0.74 (1.00) |
1 (1.00) |
1 (1.00) |
|
| 11p loss | 23 (9%) | 242 |
0.994 (1.00) |
0.0409 (1.00) |
0.129 (1.00) |
0.632 (1.00) |
0.472 (1.00) |
0.954 (1.00) |
0.122 (1.00) |
0.014 (1.00) |
1 (1.00) |
0.761 (1.00) |
| 11q loss | 18 (7%) | 247 |
0.46 (1.00) |
0.913 (1.00) |
0.631 (1.00) |
0.379 (1.00) |
0.675 (1.00) |
0.886 (1.00) |
0.459 (1.00) |
0.0554 (1.00) |
0.218 (1.00) |
0.163 (1.00) |
| 12p loss | 27 (10%) | 238 |
0.622 (1.00) |
0.785 (1.00) |
0.686 (1.00) |
0.928 (1.00) |
0.086 (1.00) |
0.66 (1.00) |
0.586 (1.00) |
0.93 (1.00) |
1 (1.00) |
1 (1.00) |
| 12q loss | 19 (7%) | 246 |
0.758 (1.00) |
0.147 (1.00) |
0.816 (1.00) |
0.0015 (1.00) |
0.548 (1.00) |
0.603 (1.00) |
1 (1.00) |
0.608 (1.00) |
0.747 (1.00) |
|
| 13q loss | 60 (23%) | 205 |
0.729 (1.00) |
0.139 (1.00) |
0.883 (1.00) |
0.0194 (1.00) |
0.0771 (1.00) |
0.903 (1.00) |
0.111 (1.00) |
0.219 (1.00) |
0.499 (1.00) |
0.418 (1.00) |
| 14q loss | 28 (11%) | 237 |
0.548 (1.00) |
0.494 (1.00) |
0.229 (1.00) |
0.73 (1.00) |
0.33 (1.00) |
0.773 (1.00) |
0.596 (1.00) |
0.75 (1.00) |
0.147 (1.00) |
0.399 (1.00) |
| 15q loss | 57 (22%) | 208 |
0.536 (1.00) |
0.131 (1.00) |
0.454 (1.00) |
0.00887 (1.00) |
0.0498 (1.00) |
0.569 (1.00) |
0.935 (1.00) |
0.922 (1.00) |
0.741 (1.00) |
0.305 (1.00) |
| 16p loss | 29 (11%) | 236 |
0.62 (1.00) |
0.143 (1.00) |
0.844 (1.00) |
0.273 (1.00) |
0.893 (1.00) |
0.787 (1.00) |
0.0276 (1.00) |
0.159 (1.00) |
0.589 (1.00) |
|
| 16q loss | 37 (14%) | 228 |
0.372 (1.00) |
0.479 (1.00) |
0.86 (1.00) |
0.273 (1.00) |
0.0783 (1.00) |
0.344 (1.00) |
0.0813 (1.00) |
0.401 (1.00) |
0.621 (1.00) |
|
| 17p loss | 68 (26%) | 197 |
0.984 (1.00) |
0.221 (1.00) |
0.673 (1.00) |
0.819 (1.00) |
0.503 (1.00) |
0.58 (1.00) |
0.251 (1.00) |
0.19 (1.00) |
0.525 (1.00) |
0.556 (1.00) |
| 17q loss | 13 (5%) | 252 |
0.753 (1.00) |
0.59 (1.00) |
0.577 (1.00) |
0.279 (1.00) |
0.531 (1.00) |
0.791 (1.00) |
0.652 (1.00) |
0.488 (1.00) |
0.115 (1.00) |
|
| 18p loss | 49 (18%) | 216 |
0.204 (1.00) |
0.0337 (1.00) |
1 (1.00) |
0.00667 (1.00) |
0.92 (1.00) |
0.464 (1.00) |
0.111 (1.00) |
0.0125 (1.00) |
0.473 (1.00) |
1 (1.00) |
| 18q loss | 72 (27%) | 193 |
0.0941 (1.00) |
0.247 (1.00) |
0.782 (1.00) |
0.833 (1.00) |
0.345 (1.00) |
0.176 (1.00) |
0.286 (1.00) |
0.219 (1.00) |
0.524 (1.00) |
0.701 (1.00) |
| 19p loss | 83 (31%) | 182 |
0.00781 (1.00) |
0.742 (1.00) |
0.00134 (0.973) |
0.833 (1.00) |
0.241 (1.00) |
0.033 (1.00) |
0.0715 (1.00) |
0.0924 (1.00) |
1 (1.00) |
0.267 (1.00) |
| 19q loss | 44 (17%) | 221 |
0.116 (1.00) |
0.369 (1.00) |
0.048 (1.00) |
0.0903 (1.00) |
0.184 (1.00) |
0.161 (1.00) |
0.0471 (1.00) |
0.458 (1.00) |
1 (1.00) |
|
| 20p loss | 37 (14%) | 228 |
0.0217 (1.00) |
0.125 (1.00) |
1 (1.00) |
0.251 (1.00) |
0.398 (1.00) |
0.128 (1.00) |
0.113 (1.00) |
1 (1.00) |
1 (1.00) |
|
| 20q loss | 20 (8%) | 245 |
0.189 (1.00) |
0.359 (1.00) |
0.649 (1.00) |
0.573 (1.00) |
0.425 (1.00) |
0.853 (1.00) |
0.127 (1.00) |
0.608 (1.00) |
0.327 (1.00) |
|
| 21q loss | 38 (14%) | 227 |
0.61 (1.00) |
0.951 (1.00) |
0.0216 (1.00) |
0.0869 (1.00) |
0.54 (1.00) |
0.781 (1.00) |
0.687 (1.00) |
1 (1.00) |
1 (1.00) |
|
| 22q loss | 60 (23%) | 205 |
0.748 (1.00) |
0.148 (1.00) |
0.055 (1.00) |
0.655 (1.00) |
0.743 (1.00) |
0.898 (1.00) |
0.674 (1.00) |
0.504 (1.00) |
0.499 (1.00) |
0.838 (1.00) |
P value = 9.09e-05 (t-test), Q value = 0.066
Table S1. Gene #16: '8q gain mutation analysis' versus Clinical Feature #2: 'AGE'
| nPatients | Mean (Std.Dev) | |
|---|---|---|
| ALL | 234 | 65.2 (9.8) |
| 8Q GAIN MUTATED | 68 | 61.5 (8.7) |
| 8Q GAIN WILD-TYPE | 166 | 66.7 (9.8) |
Figure S1. Get High-res Image Gene #16: '8q gain mutation analysis' versus Clinical Feature #2: 'AGE'
P value = 0.000327 (Fisher's exact test), Q value = 0.24
Table S2. Gene #46: '4q loss mutation analysis' versus Clinical Feature #3: 'GENDER'
| nPatients | FEMALE | MALE |
|---|---|---|
| ALL | 145 | 120 |
| 4Q LOSS MUTATED | 7 | 23 |
| 4Q LOSS WILD-TYPE | 138 | 97 |
Figure S2. Get High-res Image Gene #46: '4q loss mutation analysis' versus Clinical Feature #3: 'GENDER'
P value = 3.91e-05 (Chi-square test), Q value = 0.029
Table S3. Gene #52: '7q loss mutation analysis' versus Clinical Feature #5: 'HISTOLOGICAL.TYPE'
| nPatients | LUNG ACINAR ADENOCARCINOMA | LUNG ADENOCARCINOMA MIXED SUBTYPE | LUNG ADENOCARCINOMA- NOT OTHERWISE SPECIFIED (NOS) | LUNG BRONCHIOLOALVEOLAR CARCINOMA MUCINOUS | LUNG BRONCHIOLOALVEOLAR CARCINOMA NONMUCINOUS | LUNG CLEAR CELL ADENOCARCINOMA | LUNG MICROPAPILLARY ADENOCARCINOMA | LUNG MUCINOUS ADENOCARCINOMA | LUNG PAPILLARY ADENOCARCINOMA | LUNG SOLID PATTERN PREDOMINANT ADENOCARCINOMA | MUCINOUS (COLLOID) ADENOCARCINOMA |
|---|---|---|---|---|---|---|---|---|---|---|---|
| ALL | 3 | 60 | 171 | 3 | 8 | 2 | 2 | 2 | 10 | 1 | 3 |
| 7Q LOSS MUTATED | 0 | 0 | 9 | 0 | 0 | 1 | 0 | 0 | 1 | 0 | 2 |
| 7Q LOSS WILD-TYPE | 3 | 60 | 162 | 3 | 8 | 1 | 2 | 2 | 9 | 1 | 1 |
Figure S3. Get High-res Image Gene #52: '7q loss mutation analysis' versus Clinical Feature #5: 'HISTOLOGICAL.TYPE'

-
Mutation data file = broad_values_by_arm.mutsig.cluster.txt
-
Clinical data file = LUAD.clin.merged.picked.txt
-
Number of patients = 265
-
Number of significantly arm-level cnvs = 77
-
Number of selected clinical features = 10
-
Exclude genes that fewer than K tumors have mutations, K = 3
For survival clinical features, the Kaplan-Meier survival curves of tumors with and without gene mutations were plotted and the statistical significance P values were estimated by logrank test (Bland and Altman 2004) using the 'survdiff' function in R
For continuous numerical clinical features, two-tailed Student's t test with unequal variance (Lehmann and Romano 2005) was applied to compare the clinical values between tumors with and without gene mutations using 't.test' function in R
For binary or multi-class clinical features (nominal or ordinal), two-tailed Fisher's exact tests (Fisher 1922) were used to estimate the P values using the 'fisher.test' function in R
For multi-class clinical features (nominal or ordinal), Chi-square tests (Greenwood and Nikulin 1996) were used to estimate the P values using the 'chisq.test' function in R
For multiple hypothesis correction, Q value is the False Discovery Rate (FDR) analogue of the P value (Benjamini and Hochberg 1995), defined as the minimum FDR at which the test may be called significant. We used the 'Benjamini and Hochberg' method of 'p.adjust' function in R to convert P values into Q values.
This is an experimental feature. The full results of the analysis summarized in this report can be downloaded from the TCGA Data Coordination Center.