This pipeline uses various statistical tests to identify genes whose promoter methylation levels correlated to selected clinical features.
Testing the association between 20236 genes and 3 clinical features across 124 samples, statistically thresholded by Q value < 0.05, 2 clinical features related to at least one genes.
-
42 genes correlated to 'RADIATIONS.RADIATION.REGIMENINDICATION'.
-
NBPF9 , TAAR2 , HLA-DRB1 , LXN , GFM1 , ...
-
223 genes correlated to 'NEOADJUVANT.THERAPY'.
-
SMG7 , KIAA1009 , EIF4E2 , ISCA1 , KIAA0753 , ...
-
No genes correlated to 'AGE'
Complete statistical result table is provided in Supplement Table 1
Table 1. Get Full Table This table shows the clinical features, statistical methods used, and the number of genes that are significantly associated with each clinical feature at Q value < 0.05.
| Clinical feature | Statistical test | Significant genes | Associated with | Associated with | ||
|---|---|---|---|---|---|---|
| AGE | Spearman correlation test | N=0 | ||||
| RADIATIONS RADIATION REGIMENINDICATION | t test | N=42 | yes | N=16 | no | N=26 |
| NEOADJUVANT THERAPY | t test | N=223 | yes | N=181 | no | N=42 |
Table S1. Basic characteristics of clinical feature: 'AGE'
| AGE | Mean (SD) | 61.19 (6.6) |
| Significant markers | N = 0 |
42 genes related to 'RADIATIONS.RADIATION.REGIMENINDICATION'.
Table S2. Basic characteristics of clinical feature: 'RADIATIONS.RADIATION.REGIMENINDICATION'
| RADIATIONS.RADIATION.REGIMENINDICATION | Labels | N |
| NO | 5 | |
| YES | 119 | |
| Significant markers | N = 42 | |
| Higher in YES | 16 | |
| Higher in NO | 26 |
Table S3. Get Full Table List of top 10 genes differentially expressed by 'RADIATIONS.RADIATION.REGIMENINDICATION'
| T(pos if higher in 'YES') | ttestP | Q | AUC | |
|---|---|---|---|---|
| NBPF9 | 8.4 | 8.213e-12 | 1.66e-07 | 0.8218 |
| TAAR2 | -7.23 | 5.635e-11 | 1.14e-06 | 0.7277 |
| HLA-DRB1 | 7.22 | 5.764e-11 | 1.17e-06 | 0.6874 |
| LXN | 6.91 | 2.788e-10 | 5.64e-06 | 0.8336 |
| GFM1 | 6.88 | 3.031e-10 | 6.13e-06 | 0.8689 |
| MIR1243 | -6.49 | 3e-09 | 6.07e-05 | 0.7294 |
| SNORD113-6 | -6.44 | 3.401e-09 | 6.88e-05 | 0.7277 |
| ATP6V1G3 | -6.54 | 4.901e-09 | 9.91e-05 | 0.7748 |
| HIST1H3C | 6.53 | 6.164e-09 | 0.000125 | 0.6958 |
| MIR376B | -6.38 | 8.724e-09 | 0.000176 | 0.7681 |
Figure S1. Get High-res Image As an example, this figure shows the association of NBPF9 to 'RADIATIONS.RADIATION.REGIMENINDICATION'. P value = 8.21e-12 with T-test analysis.

Table S4. Basic characteristics of clinical feature: 'NEOADJUVANT.THERAPY'
| NEOADJUVANT.THERAPY | Labels | N |
| NO | 4 | |
| YES | 120 | |
| Significant markers | N = 223 | |
| Higher in YES | 181 | |
| Higher in NO | 42 |
Table S5. Get Full Table List of top 10 genes differentially expressed by 'NEOADJUVANT.THERAPY'
| T(pos if higher in 'YES') | ttestP | Q | AUC | |
|---|---|---|---|---|
| SMG7 | 12.34 | 4.342e-23 | 8.79e-19 | 0.9187 |
| KIAA1009 | 12.69 | 5e-23 | 1.01e-18 | 0.8646 |
| EIF4E2 | 11.99 | 6.064e-21 | 1.23e-16 | 0.8792 |
| ISCA1 | 11.57 | 1.997e-19 | 4.04e-15 | 0.8771 |
| KIAA0753 | 12.26 | 2.353e-19 | 4.76e-15 | 0.9333 |
| CDKL1 | 10.54 | 7.227e-19 | 1.46e-14 | 0.9125 |
| KIF15 | 10.68 | 2.296e-18 | 4.65e-14 | 0.8792 |
| POMT2 | 10.78 | 3.012e-18 | 6.09e-14 | 0.8771 |
| C21ORF129 | -10.76 | 6.138e-18 | 1.24e-13 | 0.8562 |
| NCRNA00112 | -10.76 | 6.138e-18 | 1.24e-13 | 0.8562 |
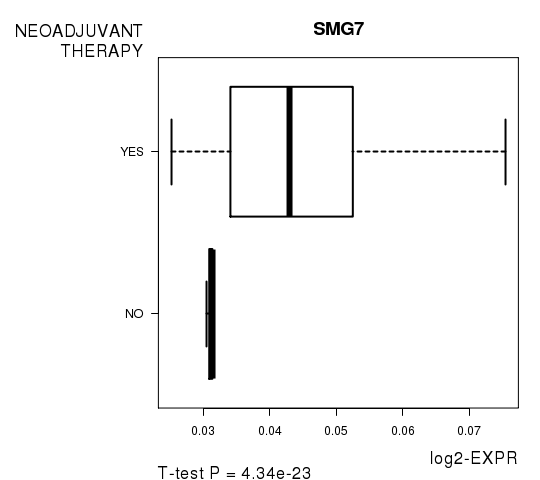
Figure S2. Get High-res Image As an example, this figure shows the association of SMG7 to 'NEOADJUVANT.THERAPY'. P value = 4.34e-23 with T-test analysis.
-
Expresson data file = PRAD.meth.for_correlation.filtered_data.txt
-
Clinical data file = PRAD.clin.merged.picked.txt
-
Number of patients = 124
-
Number of genes = 20236
-
Number of clinical features = 3
For continuous numerical clinical features, Spearman's rank correlation coefficients (Spearman 1904) and two-tailed P values were estimated using 'cor.test' function in R
For two-class clinical features, two-tailed Student's t test with unequal variance (Lehmann and Romano 2005) was applied to compare the log2-expression levels between the two clinical classes using 't.test' function in R
For multiple hypothesis correction, Q value is the False Discovery Rate (FDR) analogue of the P value (Benjamini and Hochberg 1995), defined as the minimum FDR at which the test may be called significant. We used the 'Benjamini and Hochberg' method of 'p.adjust' function in R to convert P values into Q values.
This is an experimental feature. The full results of the analysis summarized in this report can be downloaded from the TCGA Data Coordination Center.