This pipeline uses various statistical tests to identify genes whose promoter methylation levels correlated to selected clinical features.
Testing the association between 17460 genes and 8 clinical features across 283 samples, statistically thresholded by Q value < 0.05, 7 clinical features related to at least one genes.
-
2 genes correlated to 'Time to Death'.
-
ZNF266 , HES7
-
4 genes correlated to 'AGE'.
-
SLC35D3 , XKR6 , DES , HAND1
-
8 genes correlated to 'GENDER'.
-
KIF4B , LOC96610 , FH , FRG1B , SLC22A3 , ...
-
5 genes correlated to 'PATHOLOGY.N'.
-
SLC47A2 , ESRRA , AVPI1 , FGD2 , TMCO4
-
1 gene correlated to 'TUMOR.STAGE'.
-
LOC400657
-
2 genes correlated to 'RADIATIONS.RADIATION.REGIMENINDICATION'.
-
ZCCHC17 , NEAT1
-
4 genes correlated to 'NEOADJUVANT.THERAPY'.
-
ASRGL1 , ZCCHC17 , NEAT1 , BMP6
-
No genes correlated to 'PATHOLOGY.T'
Complete statistical result table is provided in Supplement Table 1
Table 1. Get Full Table This table shows the clinical features, statistical methods used, and the number of genes that are significantly associated with each clinical feature at Q value < 0.05.
| Clinical feature | Statistical test | Significant genes | Associated with | Associated with | ||
|---|---|---|---|---|---|---|
| Time to Death | Cox regression test | N=2 | shorter survival | N=2 | longer survival | N=0 |
| AGE | Spearman correlation test | N=4 | older | N=4 | younger | N=0 |
| GENDER | t test | N=8 | male | N=5 | female | N=3 |
| PATHOLOGY T | Spearman correlation test | N=0 | ||||
| PATHOLOGY N | Spearman correlation test | N=5 | higher pN | N=5 | lower pN | N=0 |
| TUMOR STAGE | Spearman correlation test | N=1 | higher stage | N=1 | lower stage | N=0 |
| RADIATIONS RADIATION REGIMENINDICATION | t test | N=2 | yes | N=1 | no | N=1 |
| NEOADJUVANT THERAPY | t test | N=4 | yes | N=3 | no | N=1 |
Table S1. Basic characteristics of clinical feature: 'Time to Death'
| Time to Death | Duration (Months) | 0.1-210.9 (median=14.8) |
| censored | N = 164 | |
| death | N = 116 | |
| Significant markers | N = 2 | |
| associated with shorter survival | 2 | |
| associated with longer survival | 0 |
Table S2. Get Full Table List of 2 genes significantly associated with 'Time to Death' by Cox regression test
| HazardRatio | Wald_P | Q | C_index | |
|---|---|---|---|---|
| ZNF266 | 6001 | 7.762e-07 | 0.014 | 0.606 |
| HES7 | 101 | 2.298e-06 | 0.04 | 0.522 |
Figure S1. Get High-res Image As an example, this figure shows the association of ZNF266 to 'Time to Death'. four curves present the cumulative survival rates of 4 quartile subsets of patients. P value = 7.76e-07 with univariate Cox regression analysis using continuous log-2 expression values.
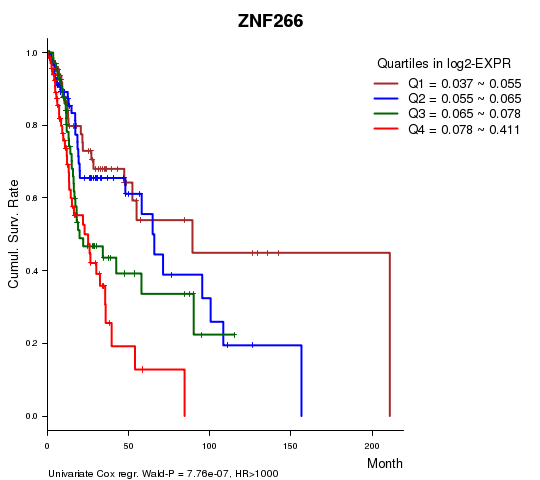
Table S3. Basic characteristics of clinical feature: 'AGE'
| AGE | Mean (SD) | 61.38 (12) |
| Significant markers | N = 4 | |
| pos. correlated | 4 | |
| neg. correlated | 0 |
Table S4. Get Full Table List of 4 genes significantly correlated to 'AGE' by Spearman correlation test
| SpearmanCorr | corrP | Q | |
|---|---|---|---|
| SLC35D3 | 0.3014 | 2.369e-07 | 0.00414 |
| XKR6 | 0.2843 | 1.161e-06 | 0.0203 |
| DES | 0.2803 | 1.667e-06 | 0.0291 |
| HAND1 | 0.2781 | 2.025e-06 | 0.0353 |
Figure S2. Get High-res Image As an example, this figure shows the association of SLC35D3 to 'AGE'. P value = 2.37e-07 with Spearman correlation analysis. The straight line presents the best linear regression.
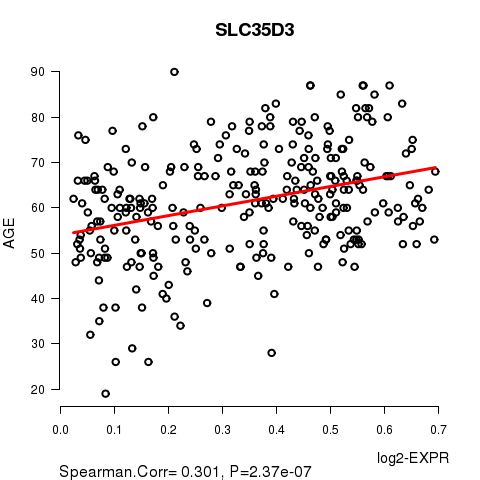
Table S5. Basic characteristics of clinical feature: 'GENDER'
| GENDER | Labels | N |
| FEMALE | 78 | |
| MALE | 205 | |
| Significant markers | N = 8 | |
| Higher in MALE | 5 | |
| Higher in FEMALE | 3 |
Table S6. Get Full Table List of 8 genes differentially expressed by 'GENDER'
| T(pos if higher in 'MALE') | ttestP | Q | AUC | |
|---|---|---|---|---|
| KIF4B | -10.87 | 4.768e-20 | 8.32e-16 | 0.8499 |
| LOC96610 | 7.33 | 1.097e-11 | 1.92e-07 | 0.7691 |
| FH | 6.68 | 7e-10 | 1.22e-05 | 0.7549 |
| FRG1B | -6.64 | 1.55e-09 | 2.71e-05 | 0.7637 |
| SLC22A3 | 5.21 | 3.752e-07 | 0.00655 | 0.5934 |
| TMEM232 | -5.28 | 5.434e-07 | 0.00948 | 0.7019 |
| NLRP2 | 5.04 | 1.474e-06 | 0.0257 | 0.6957 |
| TTC21A | 4.88 | 1.933e-06 | 0.0337 | 0.6335 |
Figure S3. Get High-res Image As an example, this figure shows the association of KIF4B to 'GENDER'. P value = 4.77e-20 with T-test analysis.
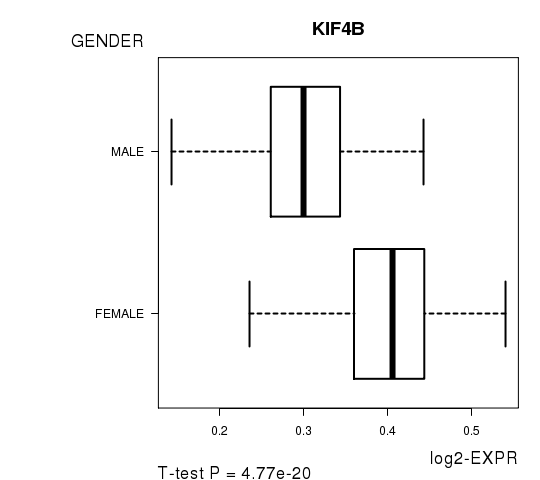
Table S7. Basic characteristics of clinical feature: 'PATHOLOGY.T'
| PATHOLOGY.T | Mean (SD) | 2.93 (1) |
| N | ||
| T1 | 20 | |
| T2 | 75 | |
| T3 | 57 | |
| T4 | 98 | |
| Significant markers | N = 0 |
Table S8. Basic characteristics of clinical feature: 'PATHOLOGY.N'
| PATHOLOGY.N | Mean (SD) | 1.03 (0.96) |
| N | ||
| N0 | 94 | |
| N1 | 31 | |
| N2 | 93 | |
| N3 | 4 | |
| Significant markers | N = 5 | |
| pos. correlated | 5 | |
| neg. correlated | 0 |
Table S9. Get Full Table List of 5 genes significantly correlated to 'PATHOLOGY.N' by Spearman correlation test
| SpearmanCorr | corrP | Q | |
|---|---|---|---|
| SLC47A2 | 0.3503 | 8.254e-08 | 0.00144 |
| ESRRA | 0.3181 | 1.305e-06 | 0.0228 |
| AVPI1 | 0.3141 | 1.795e-06 | 0.0313 |
| FGD2 | 0.3138 | 1.845e-06 | 0.0322 |
| TMCO4 | 0.3095 | 2.592e-06 | 0.0453 |
Figure S4. Get High-res Image As an example, this figure shows the association of SLC47A2 to 'PATHOLOGY.N'. P value = 8.25e-08 with Spearman correlation analysis.
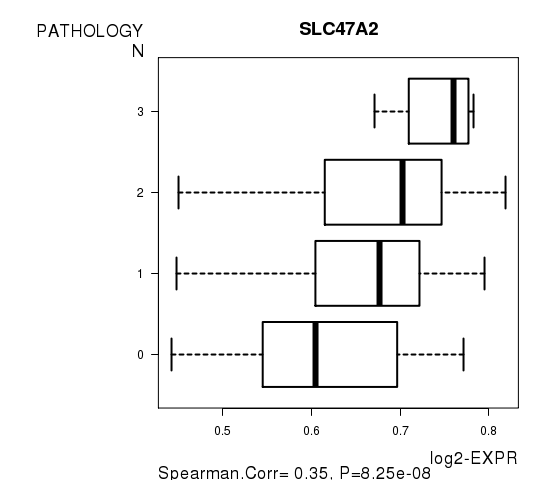
Table S10. Basic characteristics of clinical feature: 'TUMOR.STAGE'
| TUMOR.STAGE | Mean (SD) | 3.3 (0.97) |
| N | ||
| Stage 1 | 14 | |
| Stage 2 | 46 | |
| Stage 3 | 38 | |
| Stage 4 | 147 | |
| Significant markers | N = 1 | |
| pos. correlated | 1 | |
| neg. correlated | 0 |
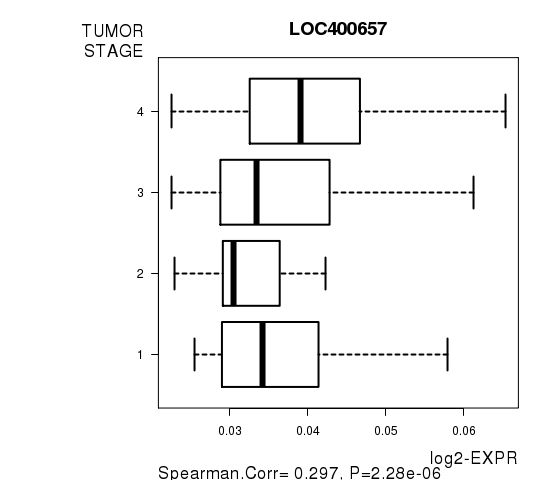
Table S11. Get Full Table List of one gene significantly correlated to 'TUMOR.STAGE' by Spearman correlation test
| SpearmanCorr | corrP | Q | |
|---|---|---|---|
| LOC400657 | 0.2967 | 2.28e-06 | 0.0398 |
Figure S5. Get High-res Image As an example, this figure shows the association of LOC400657 to 'TUMOR.STAGE'. P value = 2.28e-06 with Spearman correlation analysis.
2 genes related to 'RADIATIONS.RADIATION.REGIMENINDICATION'.
Table S12. Basic characteristics of clinical feature: 'RADIATIONS.RADIATION.REGIMENINDICATION'
| RADIATIONS.RADIATION.REGIMENINDICATION | Labels | N |
| NO | 75 | |
| YES | 208 | |
| Significant markers | N = 2 | |
| Higher in YES | 1 | |
| Higher in NO | 1 |
Table S13. Get Full Table List of 2 genes differentially expressed by 'RADIATIONS.RADIATION.REGIMENINDICATION'
| T(pos if higher in 'YES') | ttestP | Q | AUC | |
|---|---|---|---|---|
| ZCCHC17 | -5.43 | 2.816e-07 | 0.00492 | 0.7006 |
| NEAT1 | 5.23 | 4.465e-07 | 0.00779 | 0.6804 |
Figure S6. Get High-res Image As an example, this figure shows the association of ZCCHC17 to 'RADIATIONS.RADIATION.REGIMENINDICATION'. P value = 2.82e-07 with T-test analysis.
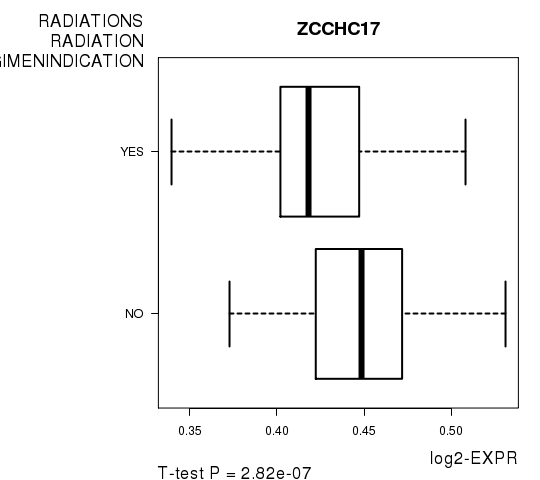
Table S14. Basic characteristics of clinical feature: 'NEOADJUVANT.THERAPY'
| NEOADJUVANT.THERAPY | Labels | N |
| NO | 45 | |
| YES | 238 | |
| Significant markers | N = 4 | |
| Higher in YES | 3 | |
| Higher in NO | 1 |
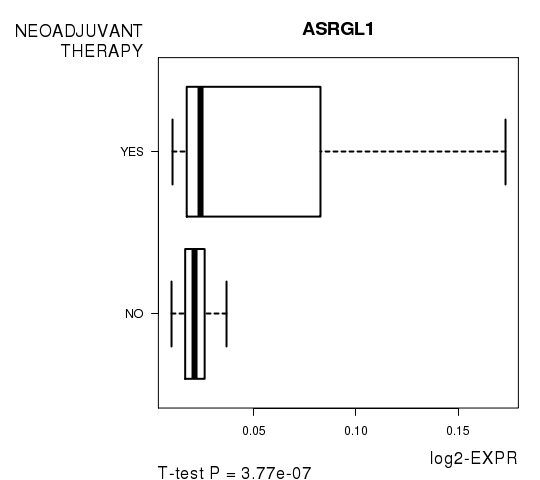
Table S15. Get Full Table List of 4 genes differentially expressed by 'NEOADJUVANT.THERAPY'
| T(pos if higher in 'YES') | ttestP | Q | AUC | |
|---|---|---|---|---|
| ASRGL1 | 5.25 | 3.773e-07 | 0.00659 | 0.5968 |
| ZCCHC17 | -5.39 | 1.22e-06 | 0.0213 | 0.7387 |
| NEAT1 | 5.14 | 1.599e-06 | 0.0279 | 0.7016 |
| BMP6 | 4.88 | 1.895e-06 | 0.0331 | 0.5849 |
Figure S7. Get High-res Image As an example, this figure shows the association of ASRGL1 to 'NEOADJUVANT.THERAPY'. P value = 3.77e-07 with T-test analysis.
-
Expresson data file = HNSC.meth.for_correlation.filtered_data.txt
-
Clinical data file = HNSC.clin.merged.picked.txt
-
Number of patients = 283
-
Number of genes = 17460
-
Number of clinical features = 8
For survival clinical features, Wald's test in univariate Cox regression analysis with proportional hazards model (Andersen and Gill 1982) was used to estimate the P values using the 'coxph' function in R. Kaplan-Meier survival curves were plot using the four quartile subgroups of patients based on expression levels
For continuous numerical clinical features, Spearman's rank correlation coefficients (Spearman 1904) and two-tailed P values were estimated using 'cor.test' function in R
For two-class clinical features, two-tailed Student's t test with unequal variance (Lehmann and Romano 2005) was applied to compare the log2-expression levels between the two clinical classes using 't.test' function in R
For multiple hypothesis correction, Q value is the False Discovery Rate (FDR) analogue of the P value (Benjamini and Hochberg 1995), defined as the minimum FDR at which the test may be called significant. We used the 'Benjamini and Hochberg' method of 'p.adjust' function in R to convert P values into Q values.
This is an experimental feature. The full results of the analysis summarized in this report can be downloaded from the TCGA Data Coordination Center.