(primary solid tumor cohort)
This report serves to describe the mutational landscape and properties of a given individual set, as well as rank genes and genesets according to mutational significance. MutSig vS2N was used to generate the results found in this report.
-
Working with individual set: LGG-TP
The input for this pipeline is a set of individuals with the following files associated for each:
-
An annotated .maf file describing the mutations called for the respective individual, and their properties.
-
A .wig file that contains information about the coverage of the sample.
-
MAF used for this analysis:LGG-TP.final_analysis_set.maf
-
Significantly mutated genes (q ≤ 0.1): 47
Column Descriptions:
-
N = number of sequenced bases in this gene across the individual set
-
nnon = number of (nonsilent) mutations in this gene across the individual set
-
nnull = number of (nonsilent) null mutations in this gene across the individual set
-
nflank = number of noncoding mutations from this gene's flanking region, across the individual set
-
nsil = number of silent mutations in this gene across the individual set
-
p = p-value (overall)
-
q = q-value, False Discovery Rate (Benjamini-Hochberg procedure)
Table 1. Get Full Table A Ranked List of Significantly Mutated Genes. Number of significant genes found: 47. Number of genes displayed: 35. Click on a gene name to display its stick figure depicting the distribution of mutations and mutation types across the chosen gene (this feature may not be available for all significant genes).
| gene | N | nflank | nsil | nnon | nnull | p | q |
|---|---|---|---|---|---|---|---|
| IDH1 | 27200 | 0 | 0 | 131 | 0 | 0 | 0 |
| ZNF860 | 340 | 0 | 0 | 6 | 0 | 0 | 0 |
| TP53 | 21420 | 0 | 2 | 116 | 19 | 1e-194 | 6.4e-191 |
| ATRX | 163540 | 0 | 2 | 82 | 65 | 2.8e-187 | 1.3e-183 |
| FUBP1 | 32640 | 0 | 2 | 19 | 16 | 7.6e-175 | 2.9e-171 |
| ARID1A | 98940 | 0 | 0 | 14 | 12 | 5.1e-109 | 1.6e-105 |
| CIC | 58310 | 0 | 0 | 40 | 18 | 3.4e-64 | 9.1e-61 |
| NOTCH1 | 88570 | 0 | 2 | 25 | 11 | 1.2e-33 | 2.9e-30 |
| MUC7 | 17340 | 0 | 0 | 8 | 0 | 2.8e-27 | 5.8e-24 |
| NF1 | 253810 | 0 | 1 | 21 | 15 | 8.4e-25 | 1.6e-21 |
| TCF12 | 41480 | 0 | 0 | 6 | 6 | 1.8e-24 | 3.1e-21 |
| PIK3R1 | 50150 | 0 | 1 | 13 | 7 | 4.8e-22 | 7.5e-19 |
| ARID2 | 103020 | 0 | 0 | 12 | 2 | 3.6e-18 | 5.3e-15 |
| IL32 | 10030 | 0 | 0 | 4 | 4 | 4.5e-16 | 6e-13 |
| AHNAK | 342210 | 0 | 4 | 17 | 0 | 2.6e-14 | 3.2e-11 |
| PTEN | 27370 | 0 | 0 | 8 | 3 | 4.5e-12 | 5.3e-09 |
| FERMT3 | 40290 | 0 | 0 | 5 | 0 | 3.3e-11 | 3.6e-08 |
| DOCK5 | 107610 | 0 | 0 | 8 | 1 | 1.3e-10 | 1.4e-07 |
| TPM1 | 22440 | 0 | 0 | 5 | 1 | 3.3e-10 | 3.3e-07 |
| NIPBL | 176630 | 0 | 0 | 10 | 7 | 2.7e-09 | 2.6e-06 |
| MLL3 | 274890 | 0 | 1 | 12 | 1 | 1.2e-08 | 0.000011 |
| HEATR5B | 116280 | 0 | 0 | 8 | 2 | 5.2e-08 | 0.000045 |
| DMXL1 | 184960 | 0 | 0 | 12 | 5 | 6.6e-08 | 0.000054 |
| ZNF318 | 120530 | 0 | 0 | 8 | 2 | 9.4e-08 | 0.000074 |
| MCCC2 | 31450 | 0 | 0 | 5 | 1 | 1.7e-07 | 0.00013 |
| C2orf71 | 63240 | 0 | 0 | 6 | 0 | 2.9e-07 | 0.00021 |
| SLTM | 59670 | 0 | 0 | 7 | 3 | 2.9e-07 | 0.00021 |
| IQGAP1 | 105230 | 0 | 1 | 9 | 1 | 3.1e-07 | 0.00021 |
| ZNF57 | 34510 | 0 | 0 | 7 | 0 | 9.9e-07 | 0.00064 |
| EGFR | 77690 | 0 | 0 | 10 | 1 | 1.3e-06 | 0.0008 |
| CELSR2 | 136340 | 0 | 2 | 9 | 0 | 4.4e-06 | 0.0027 |
| NLRP1 | 77690 | 0 | 1 | 6 | 1 | 4.8e-06 | 0.0028 |
| PIK3CA | 71570 | 0 | 0 | 15 | 3 | 7.8e-06 | 0.0045 |
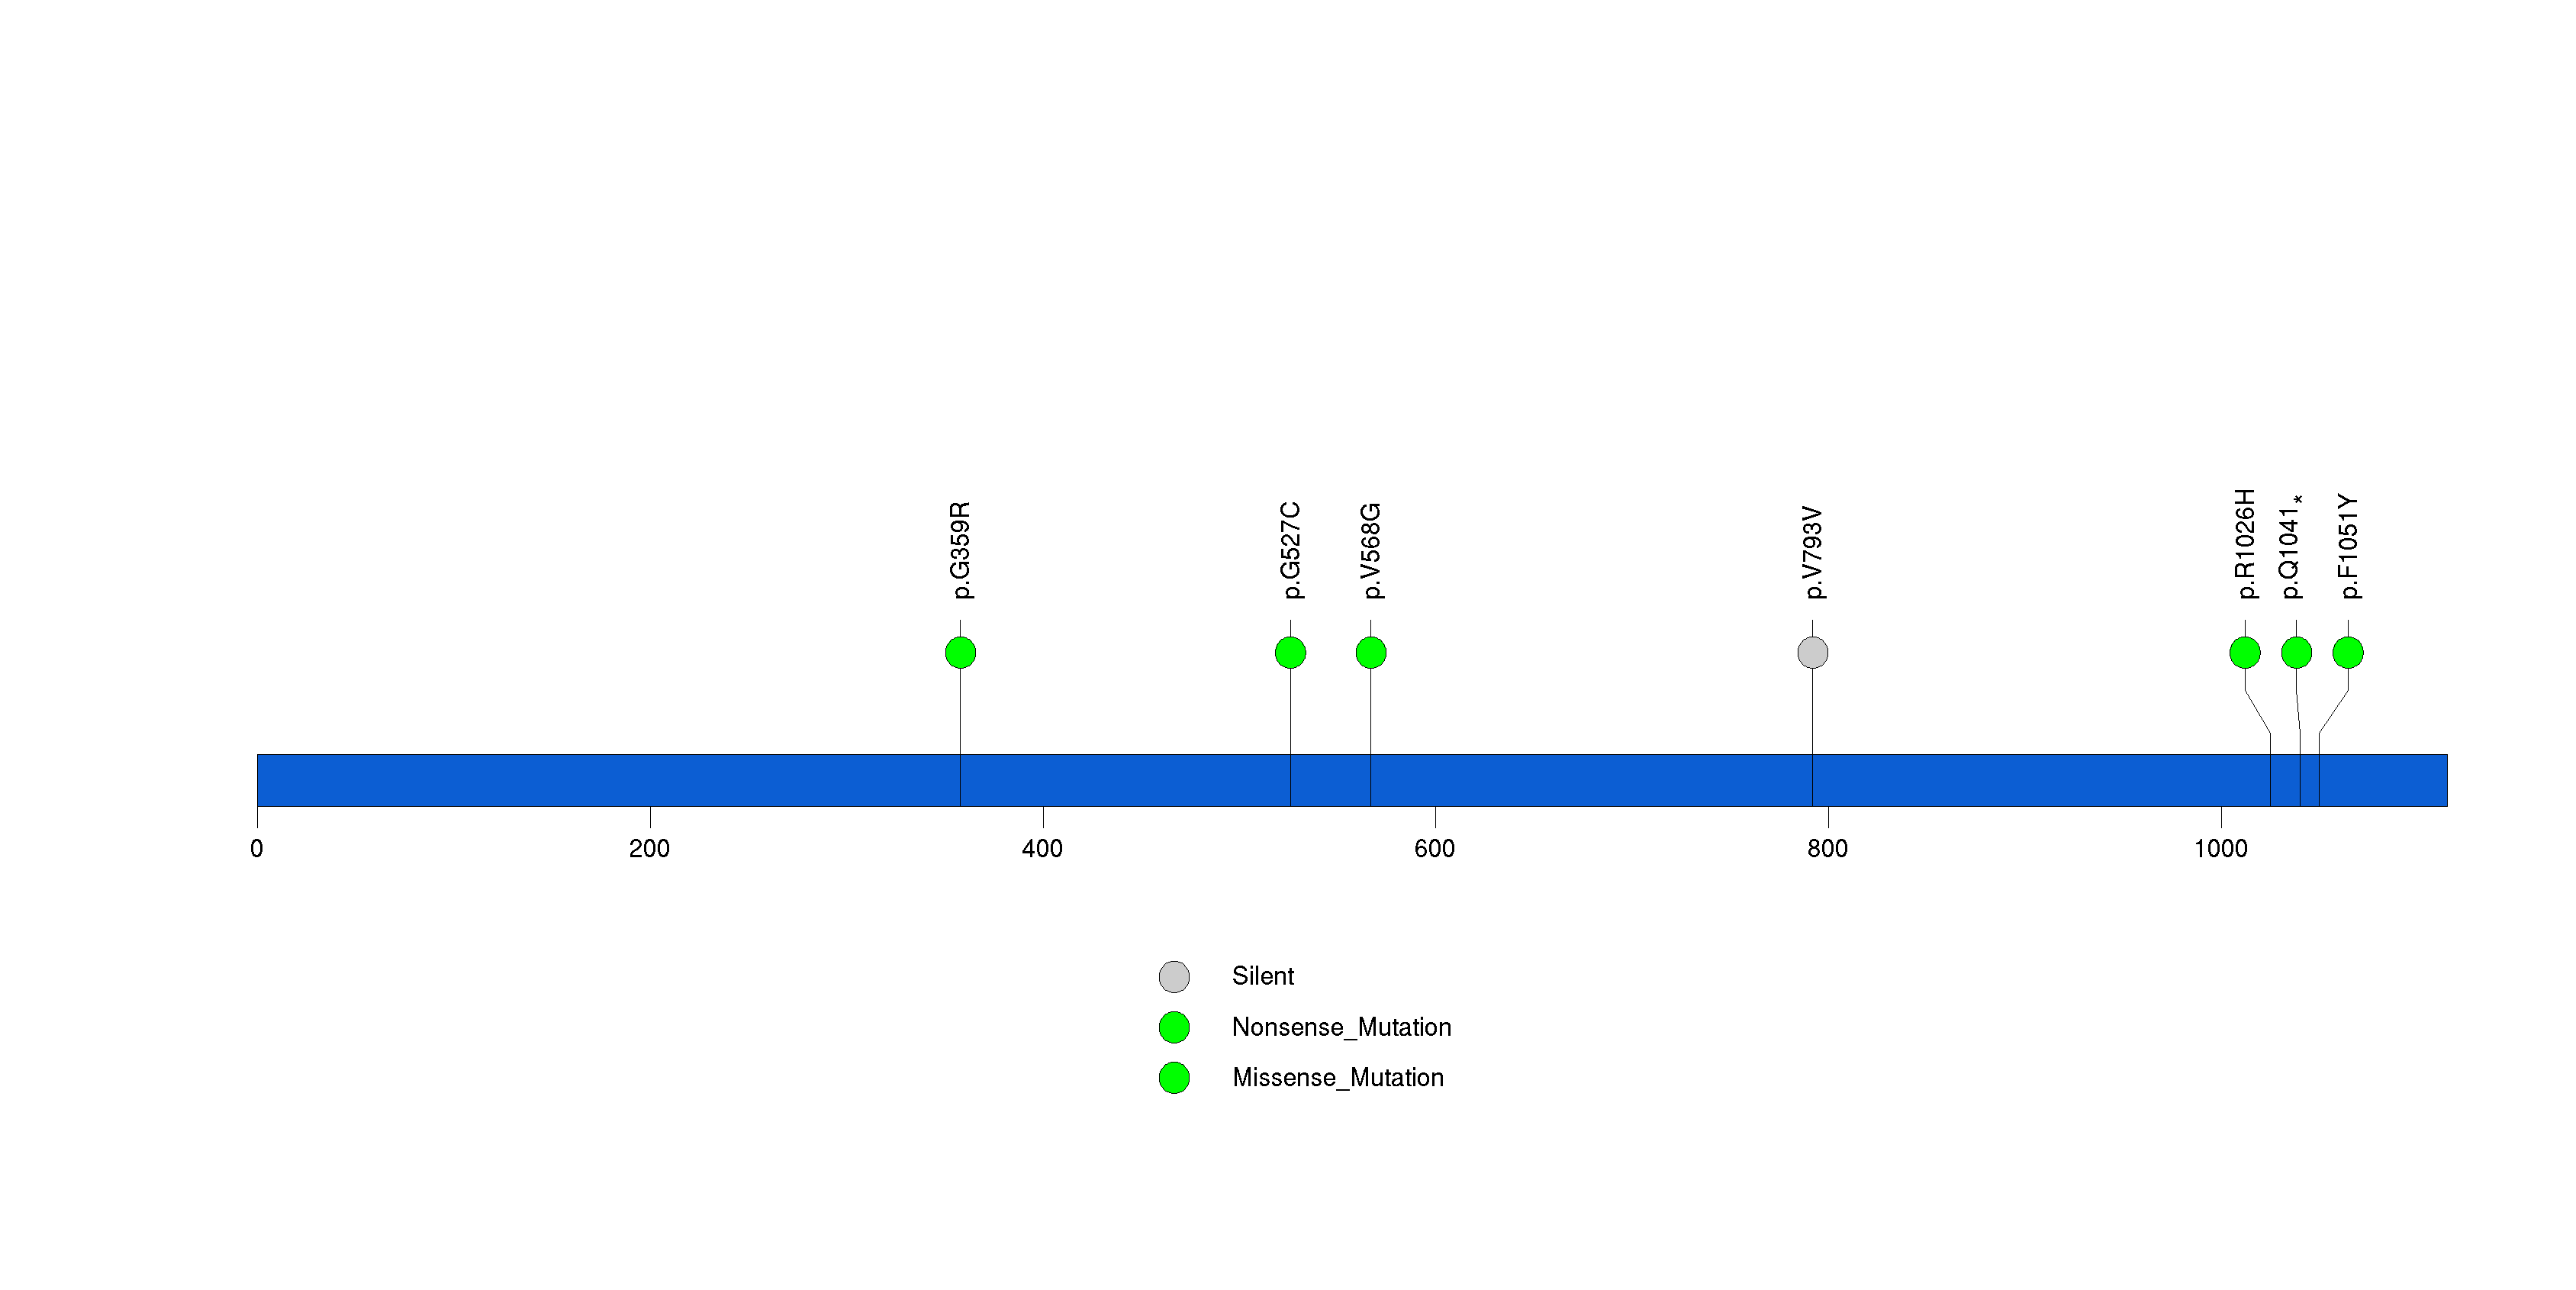
| PTPRH | 60520 | 0 | 1 | 6 | 1 | 0.000013 | 0.0067 |
| PRKDC | 219810 | 0 | 2 | 9 | 2 | 0.000013 | 0.0067 |
Figure S1. This figure depicts the distribution of mutations and mutation types across the IDH1 significant gene.
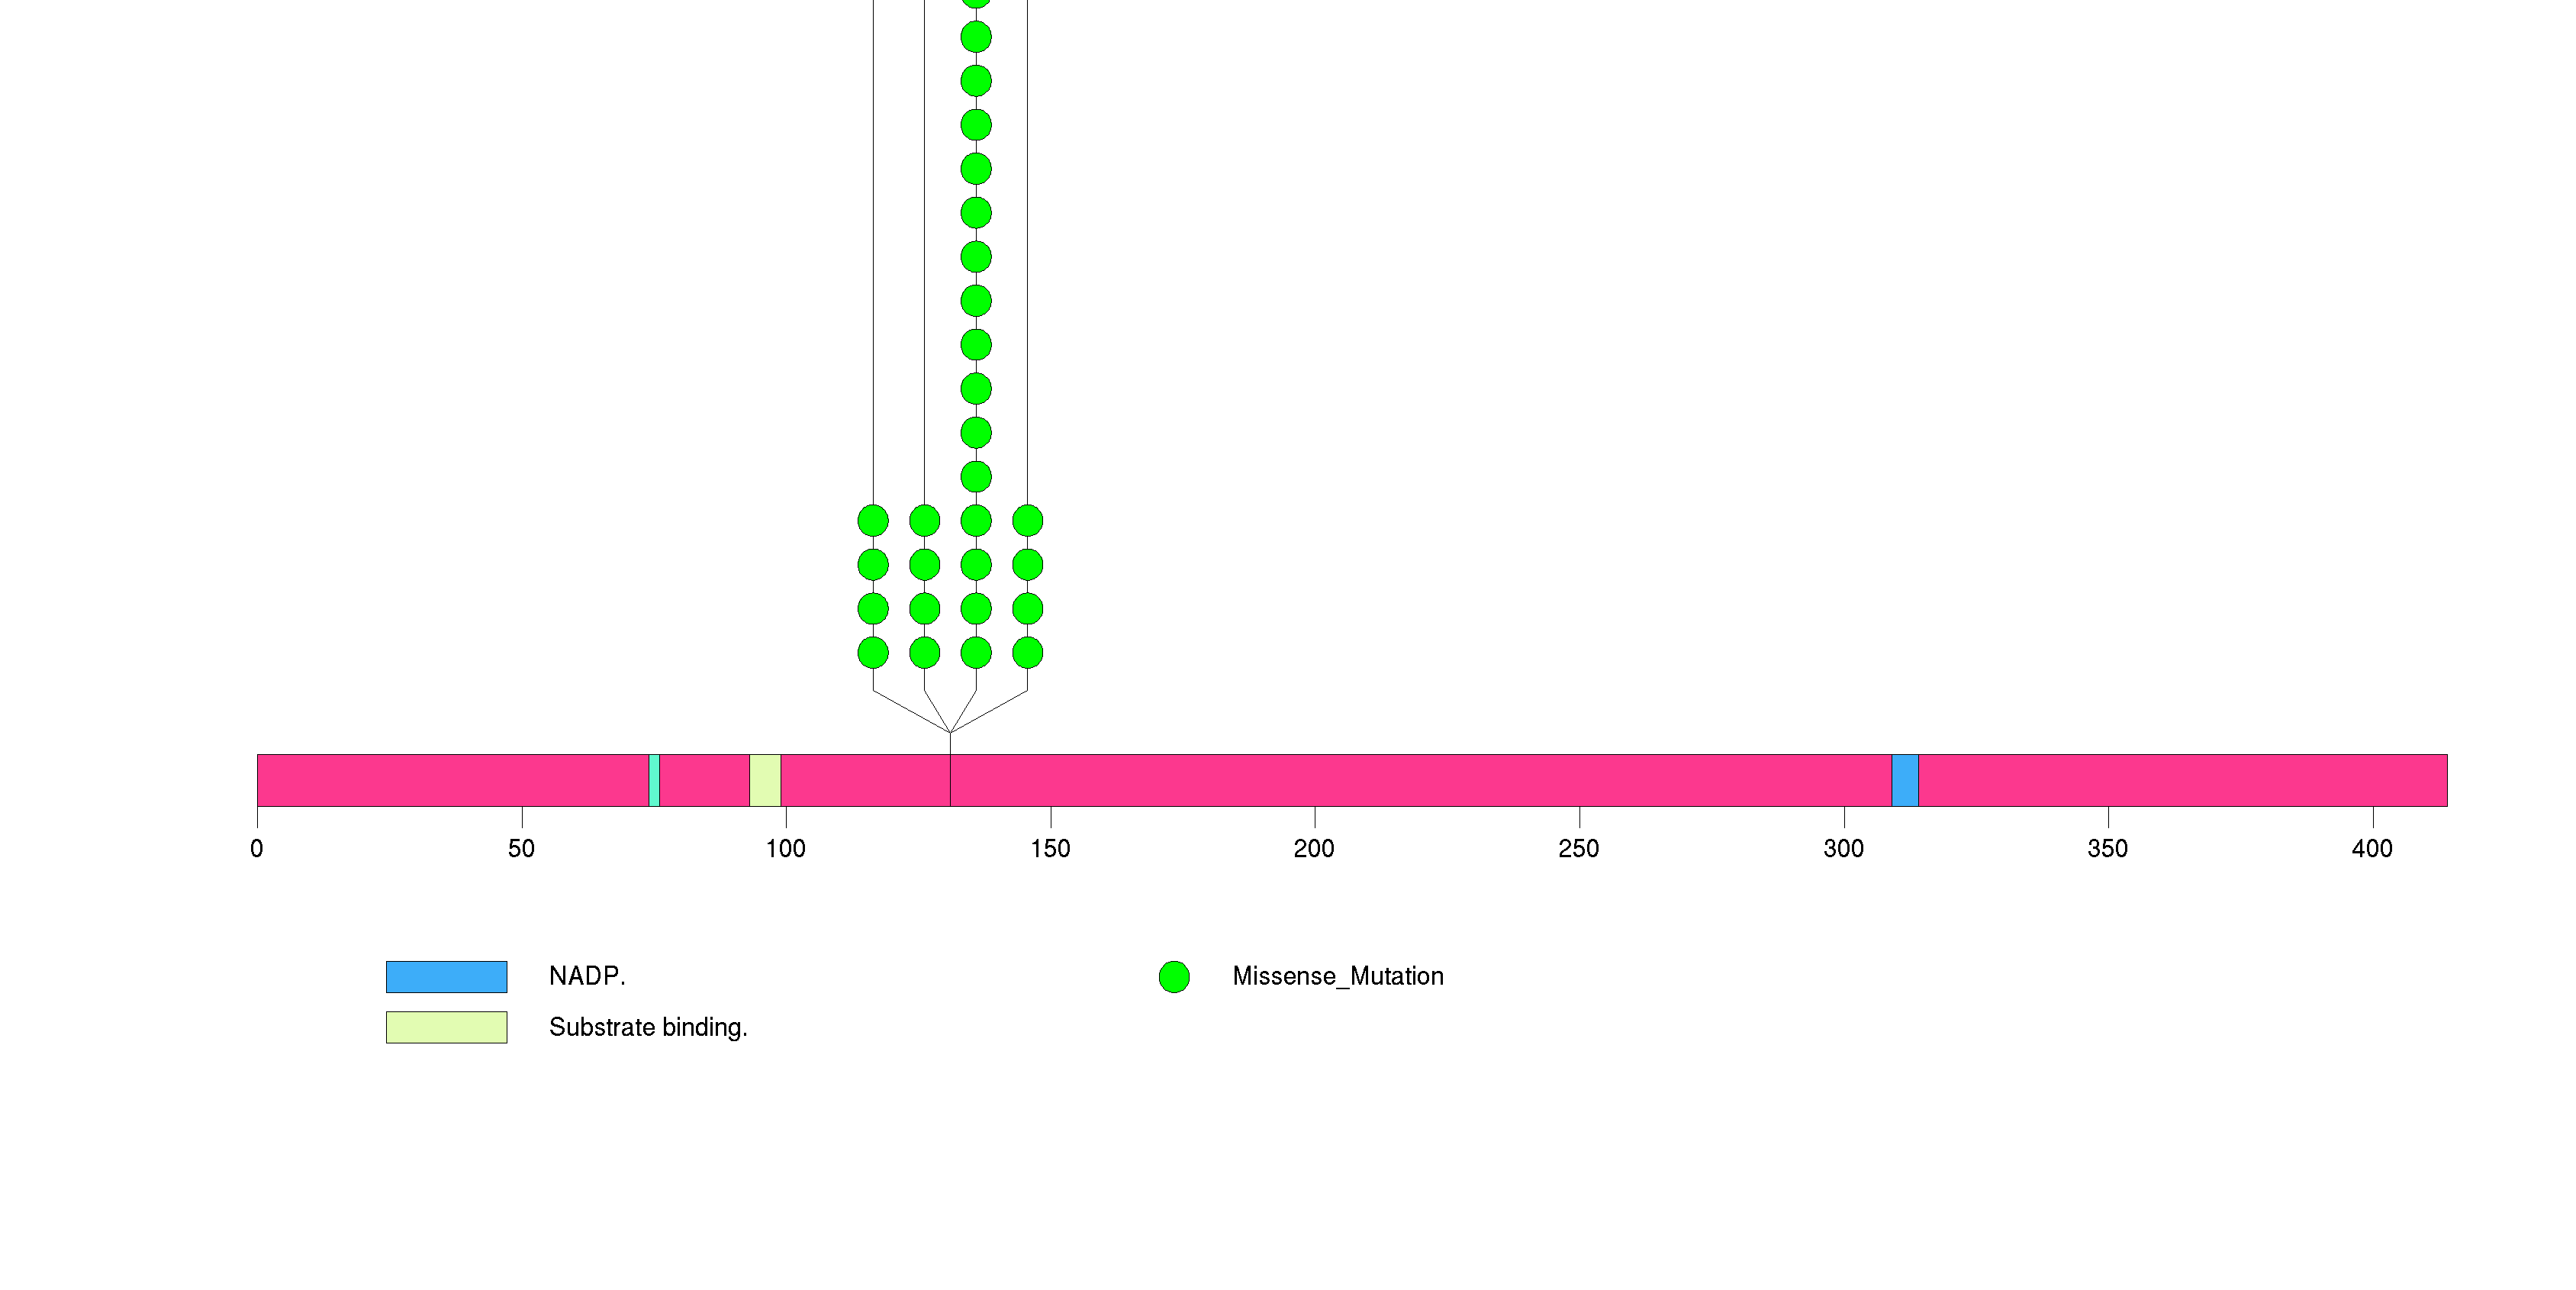
Figure S2. This figure depicts the distribution of mutations and mutation types across the ZNF860 significant gene.
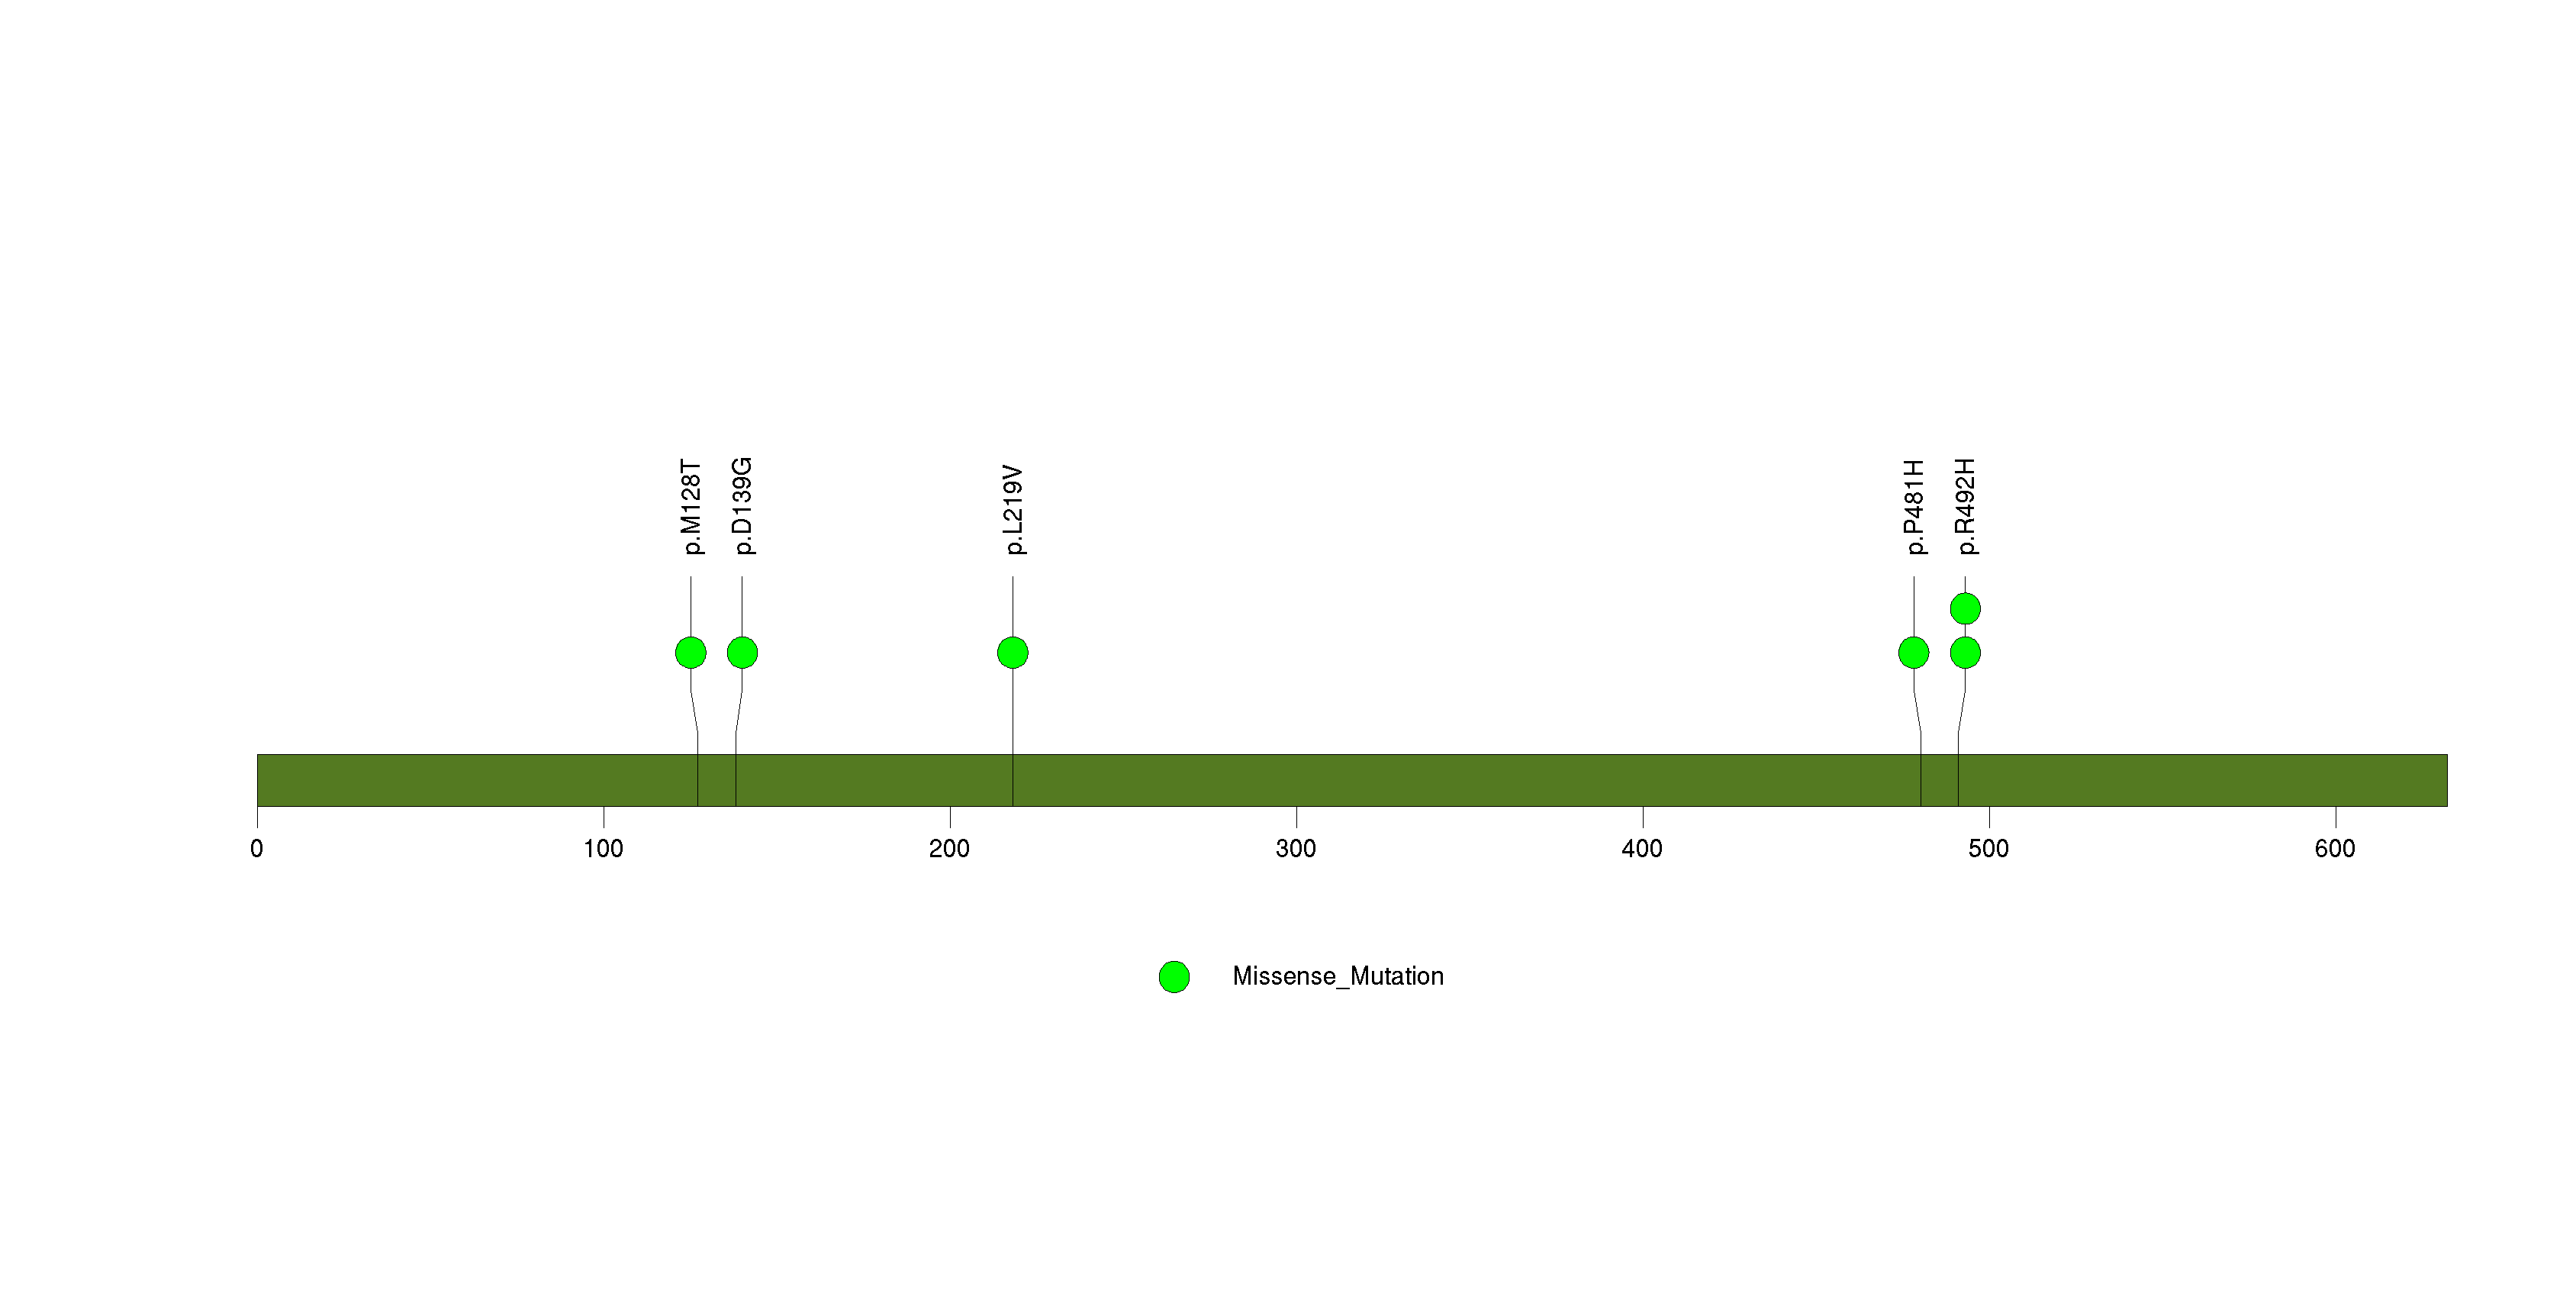
Figure S3. This figure depicts the distribution of mutations and mutation types across the TP53 significant gene.
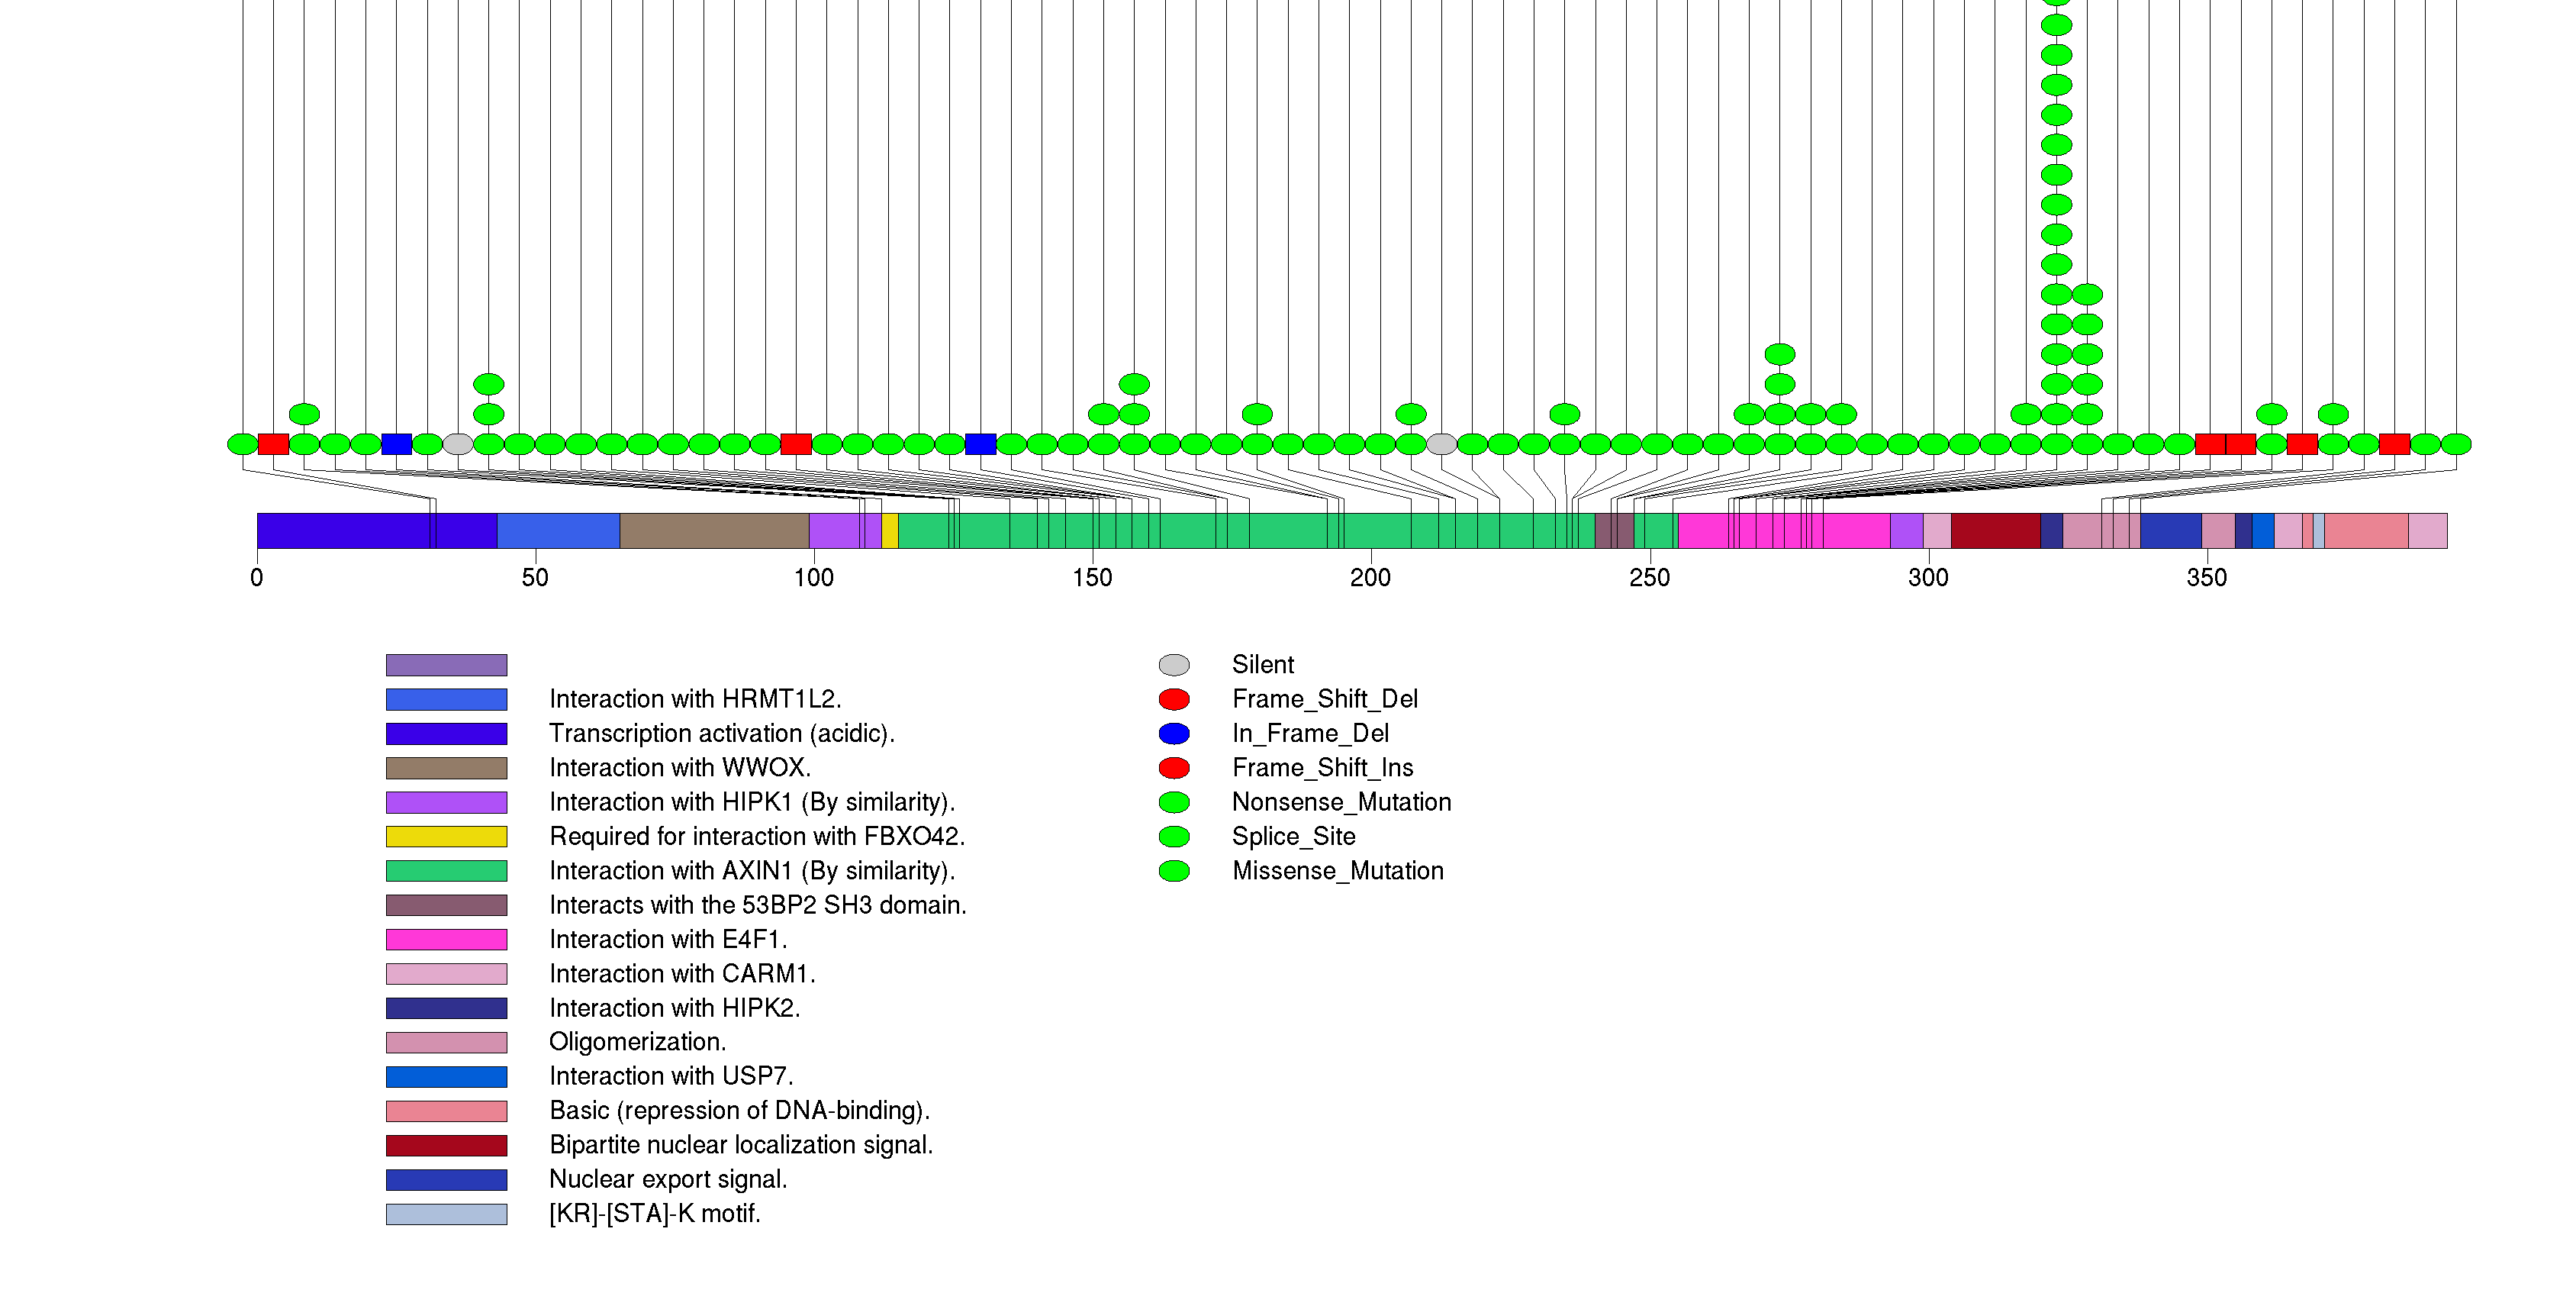
Figure S4. This figure depicts the distribution of mutations and mutation types across the ATRX significant gene.
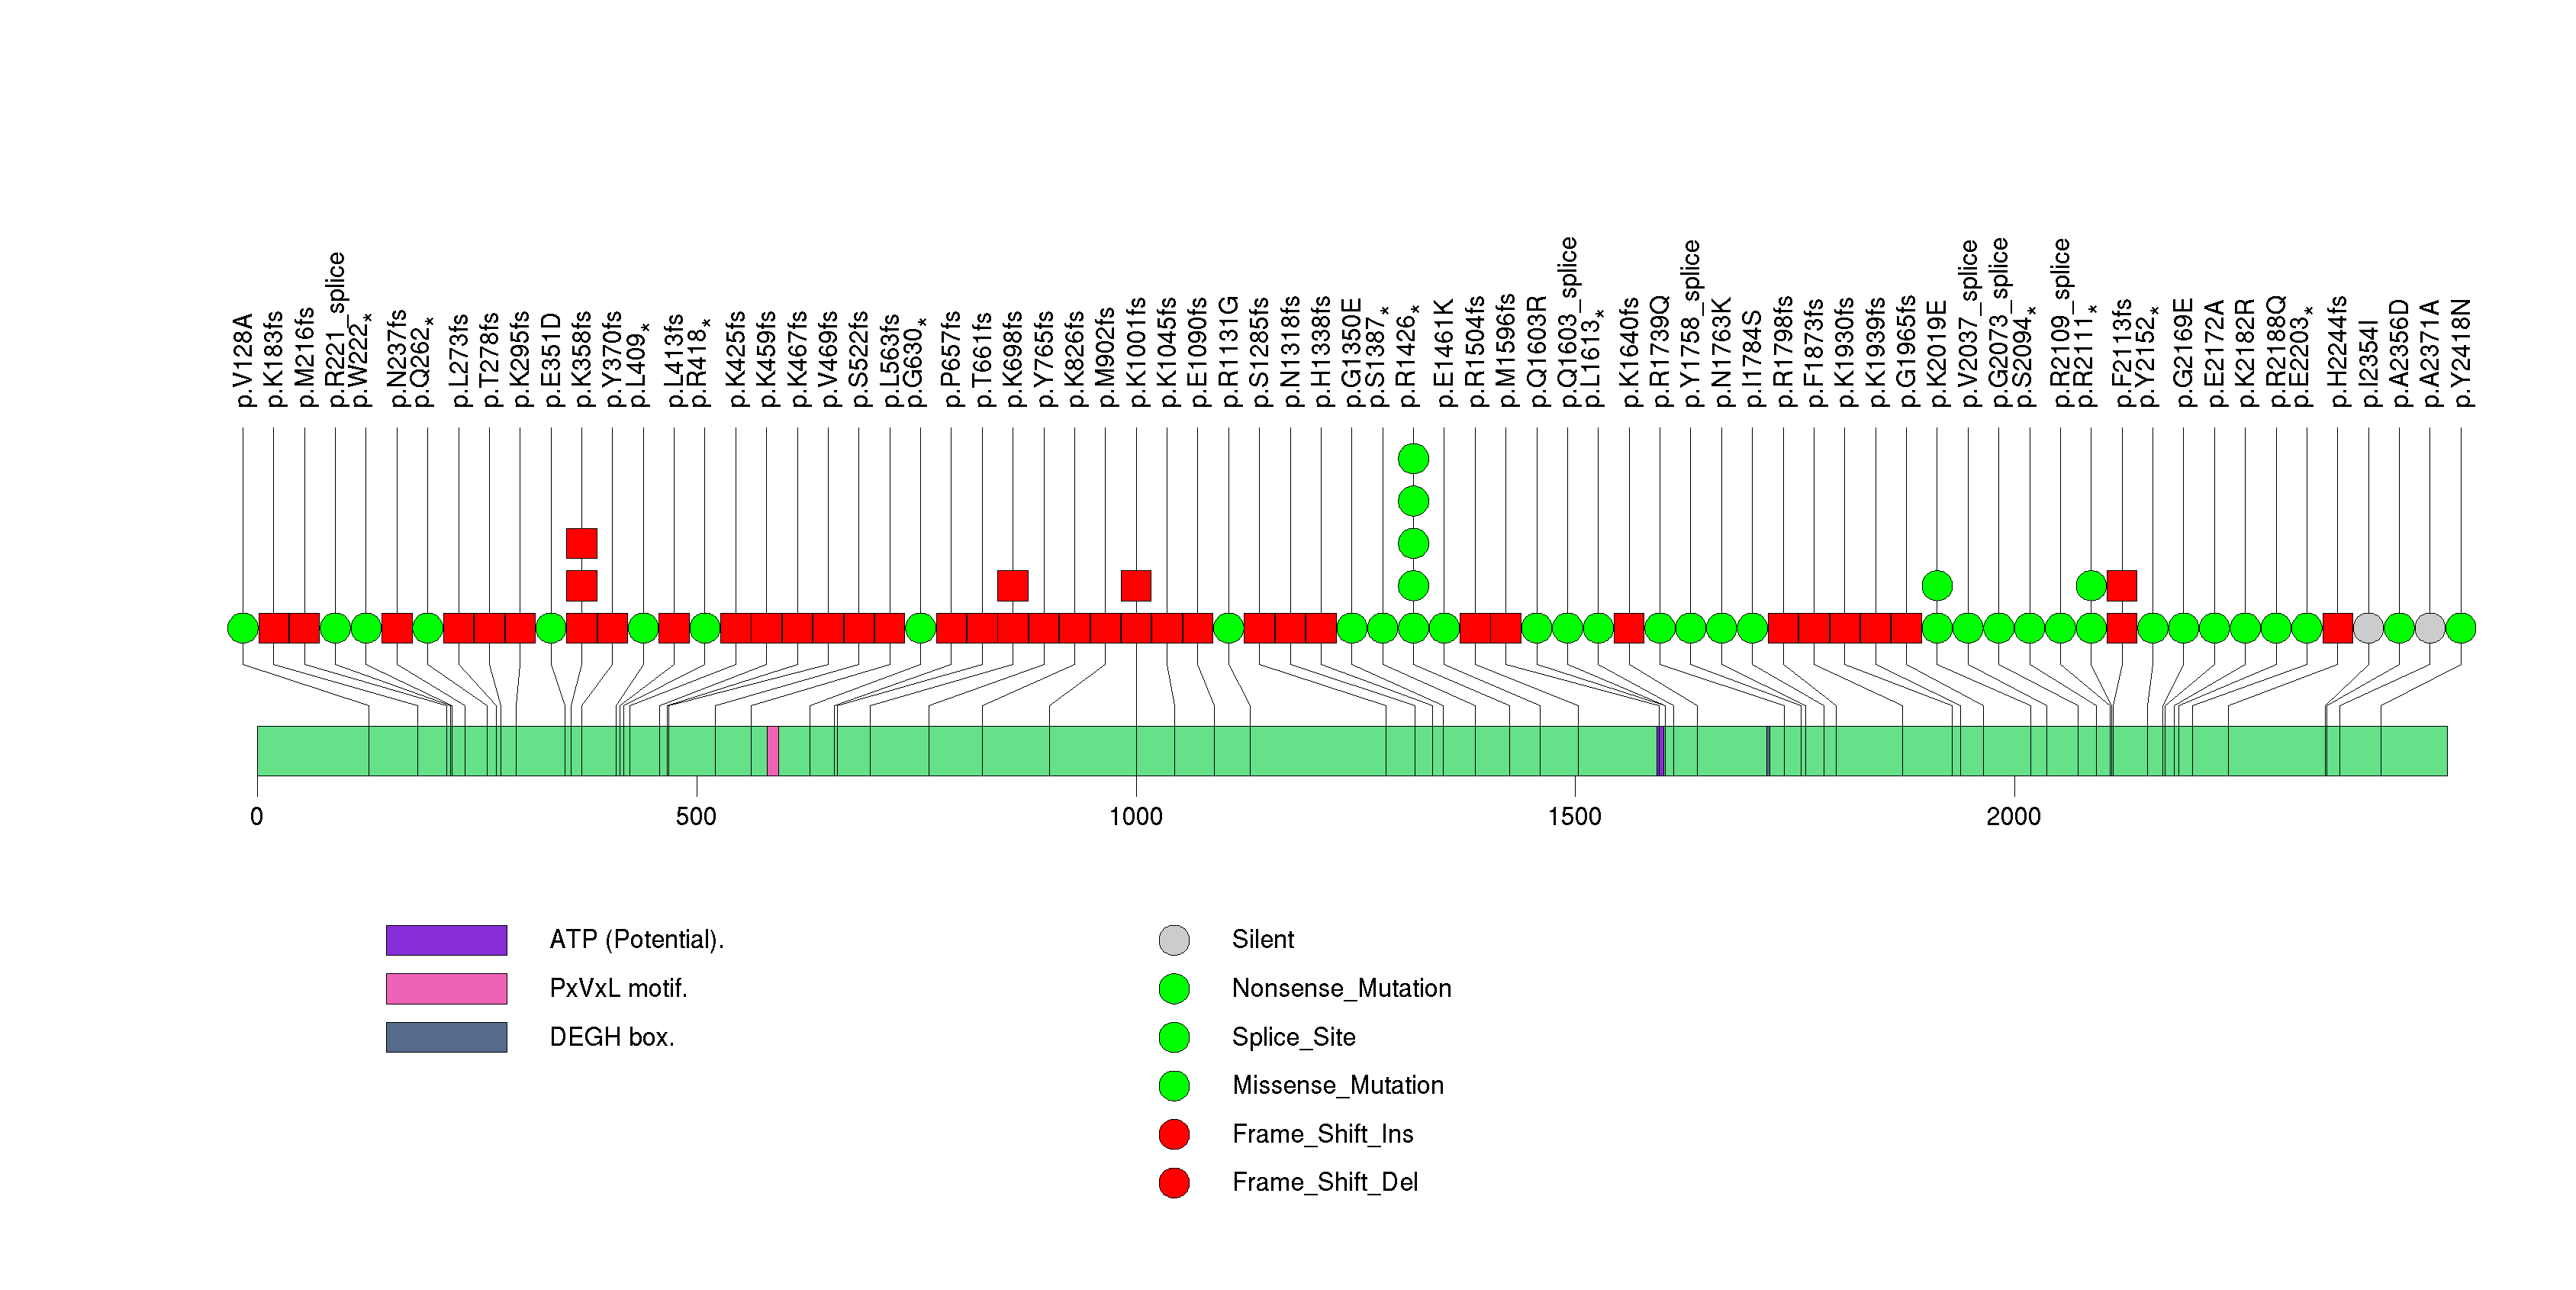
Figure S5. This figure depicts the distribution of mutations and mutation types across the FUBP1 significant gene.
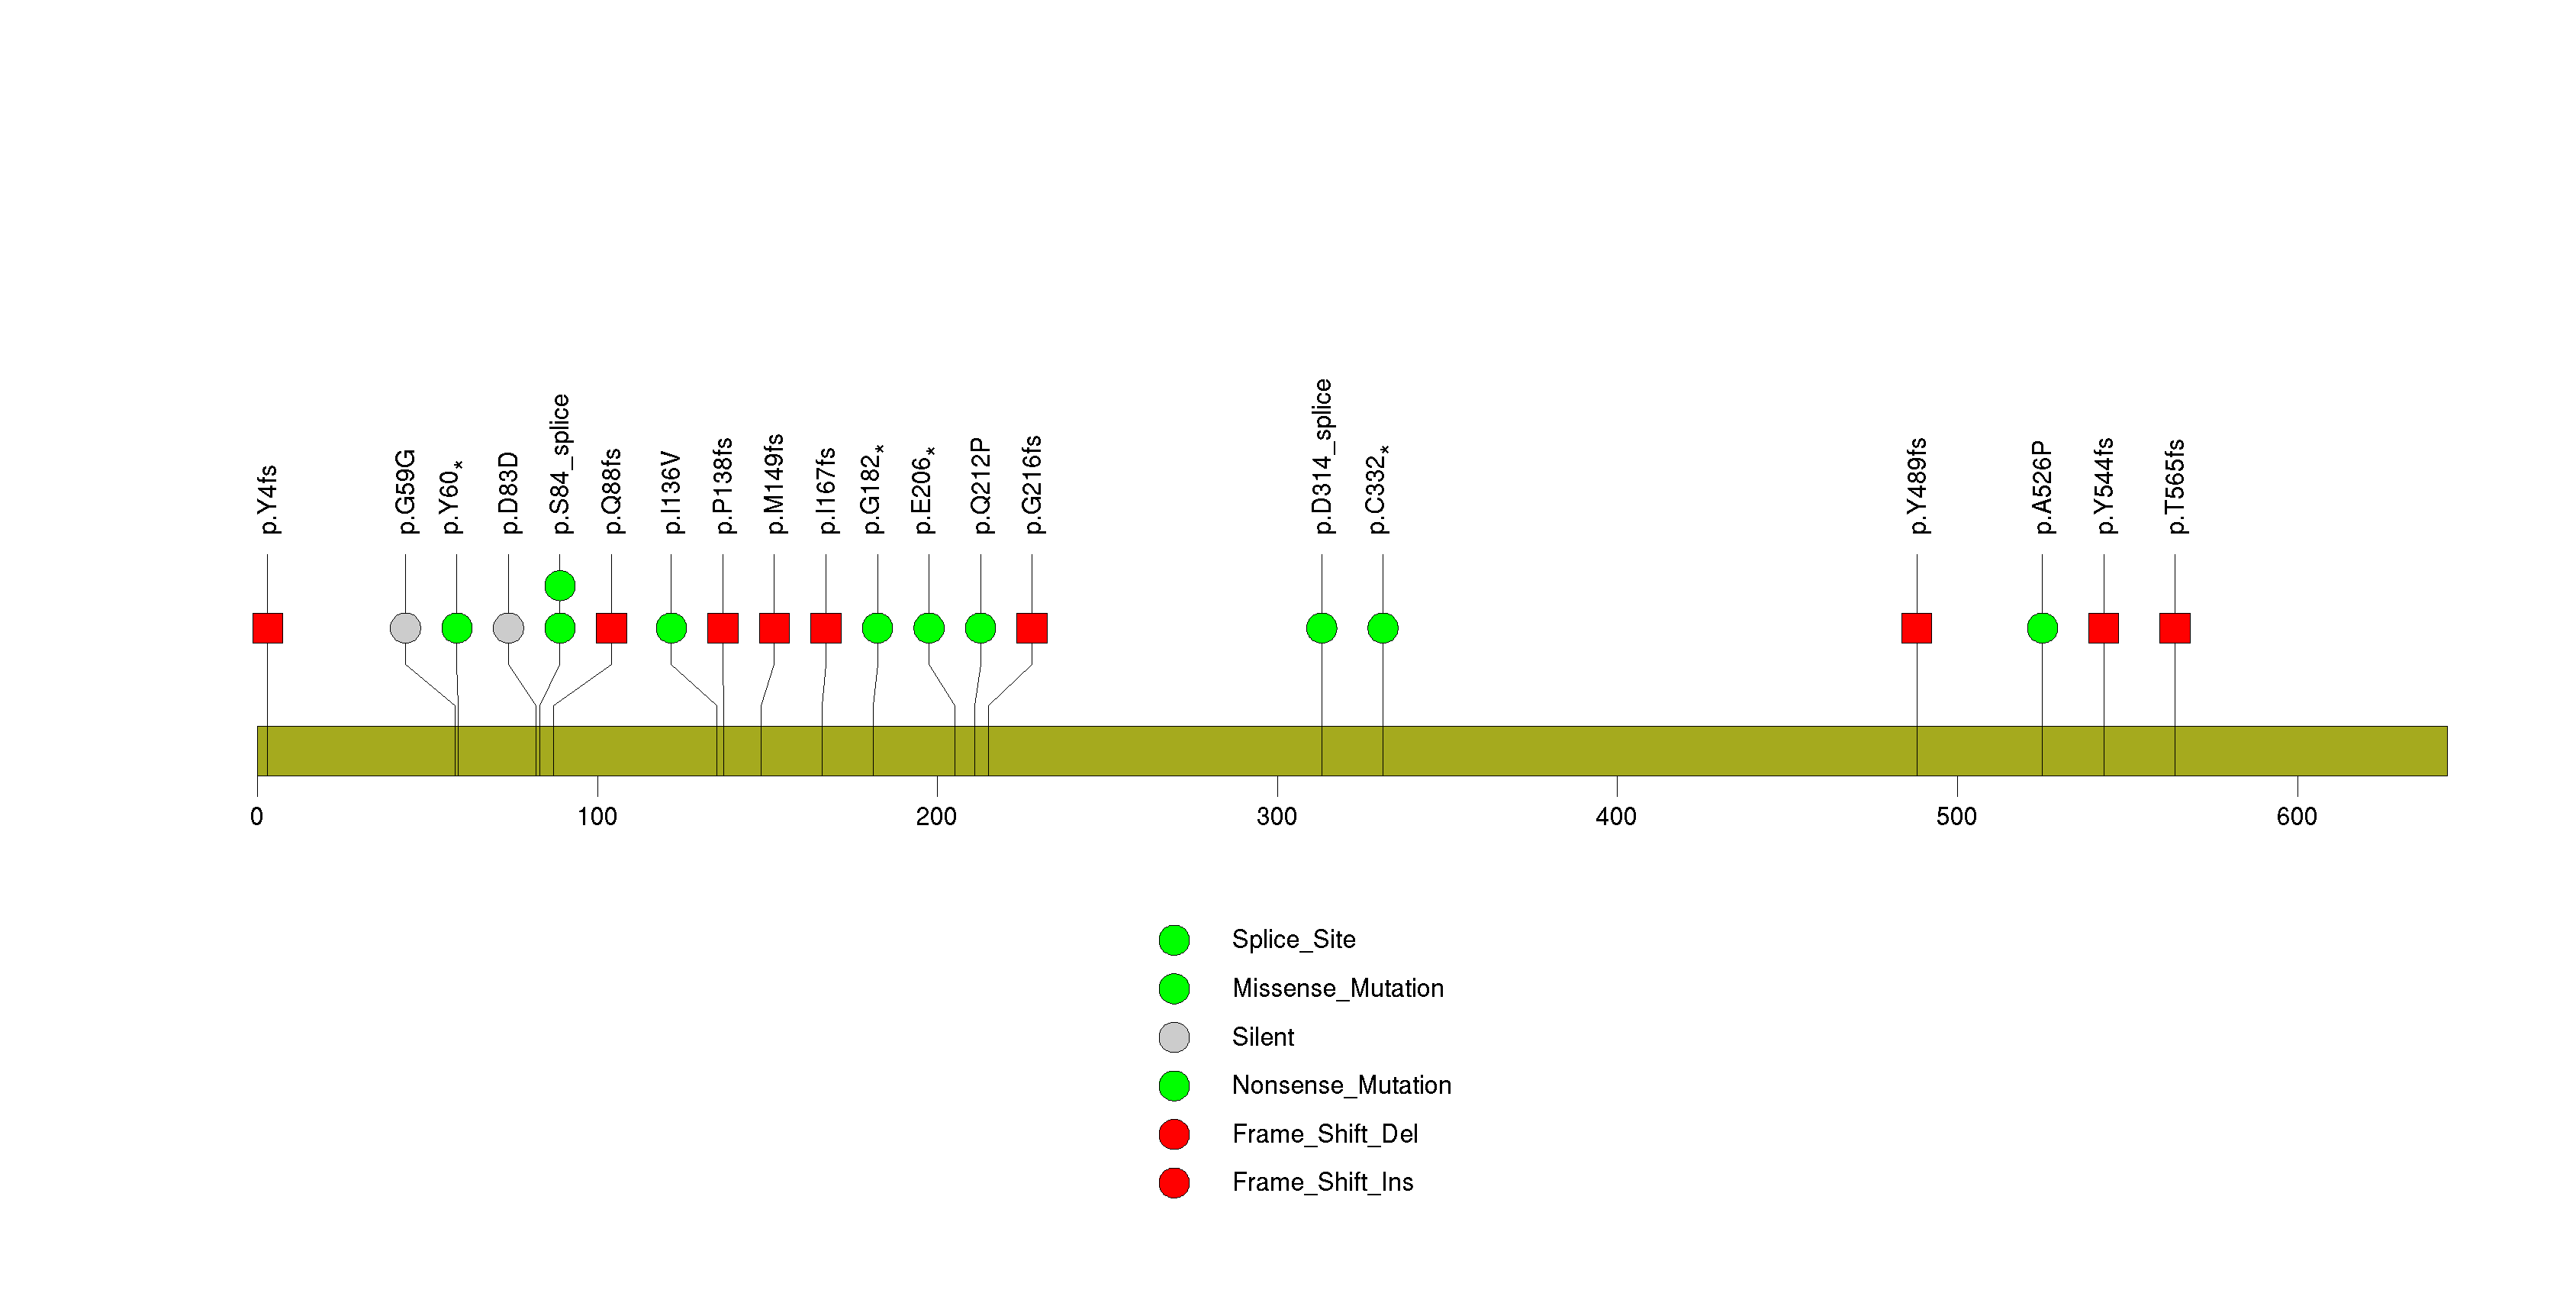
Figure S6. This figure depicts the distribution of mutations and mutation types across the ARID1A significant gene.
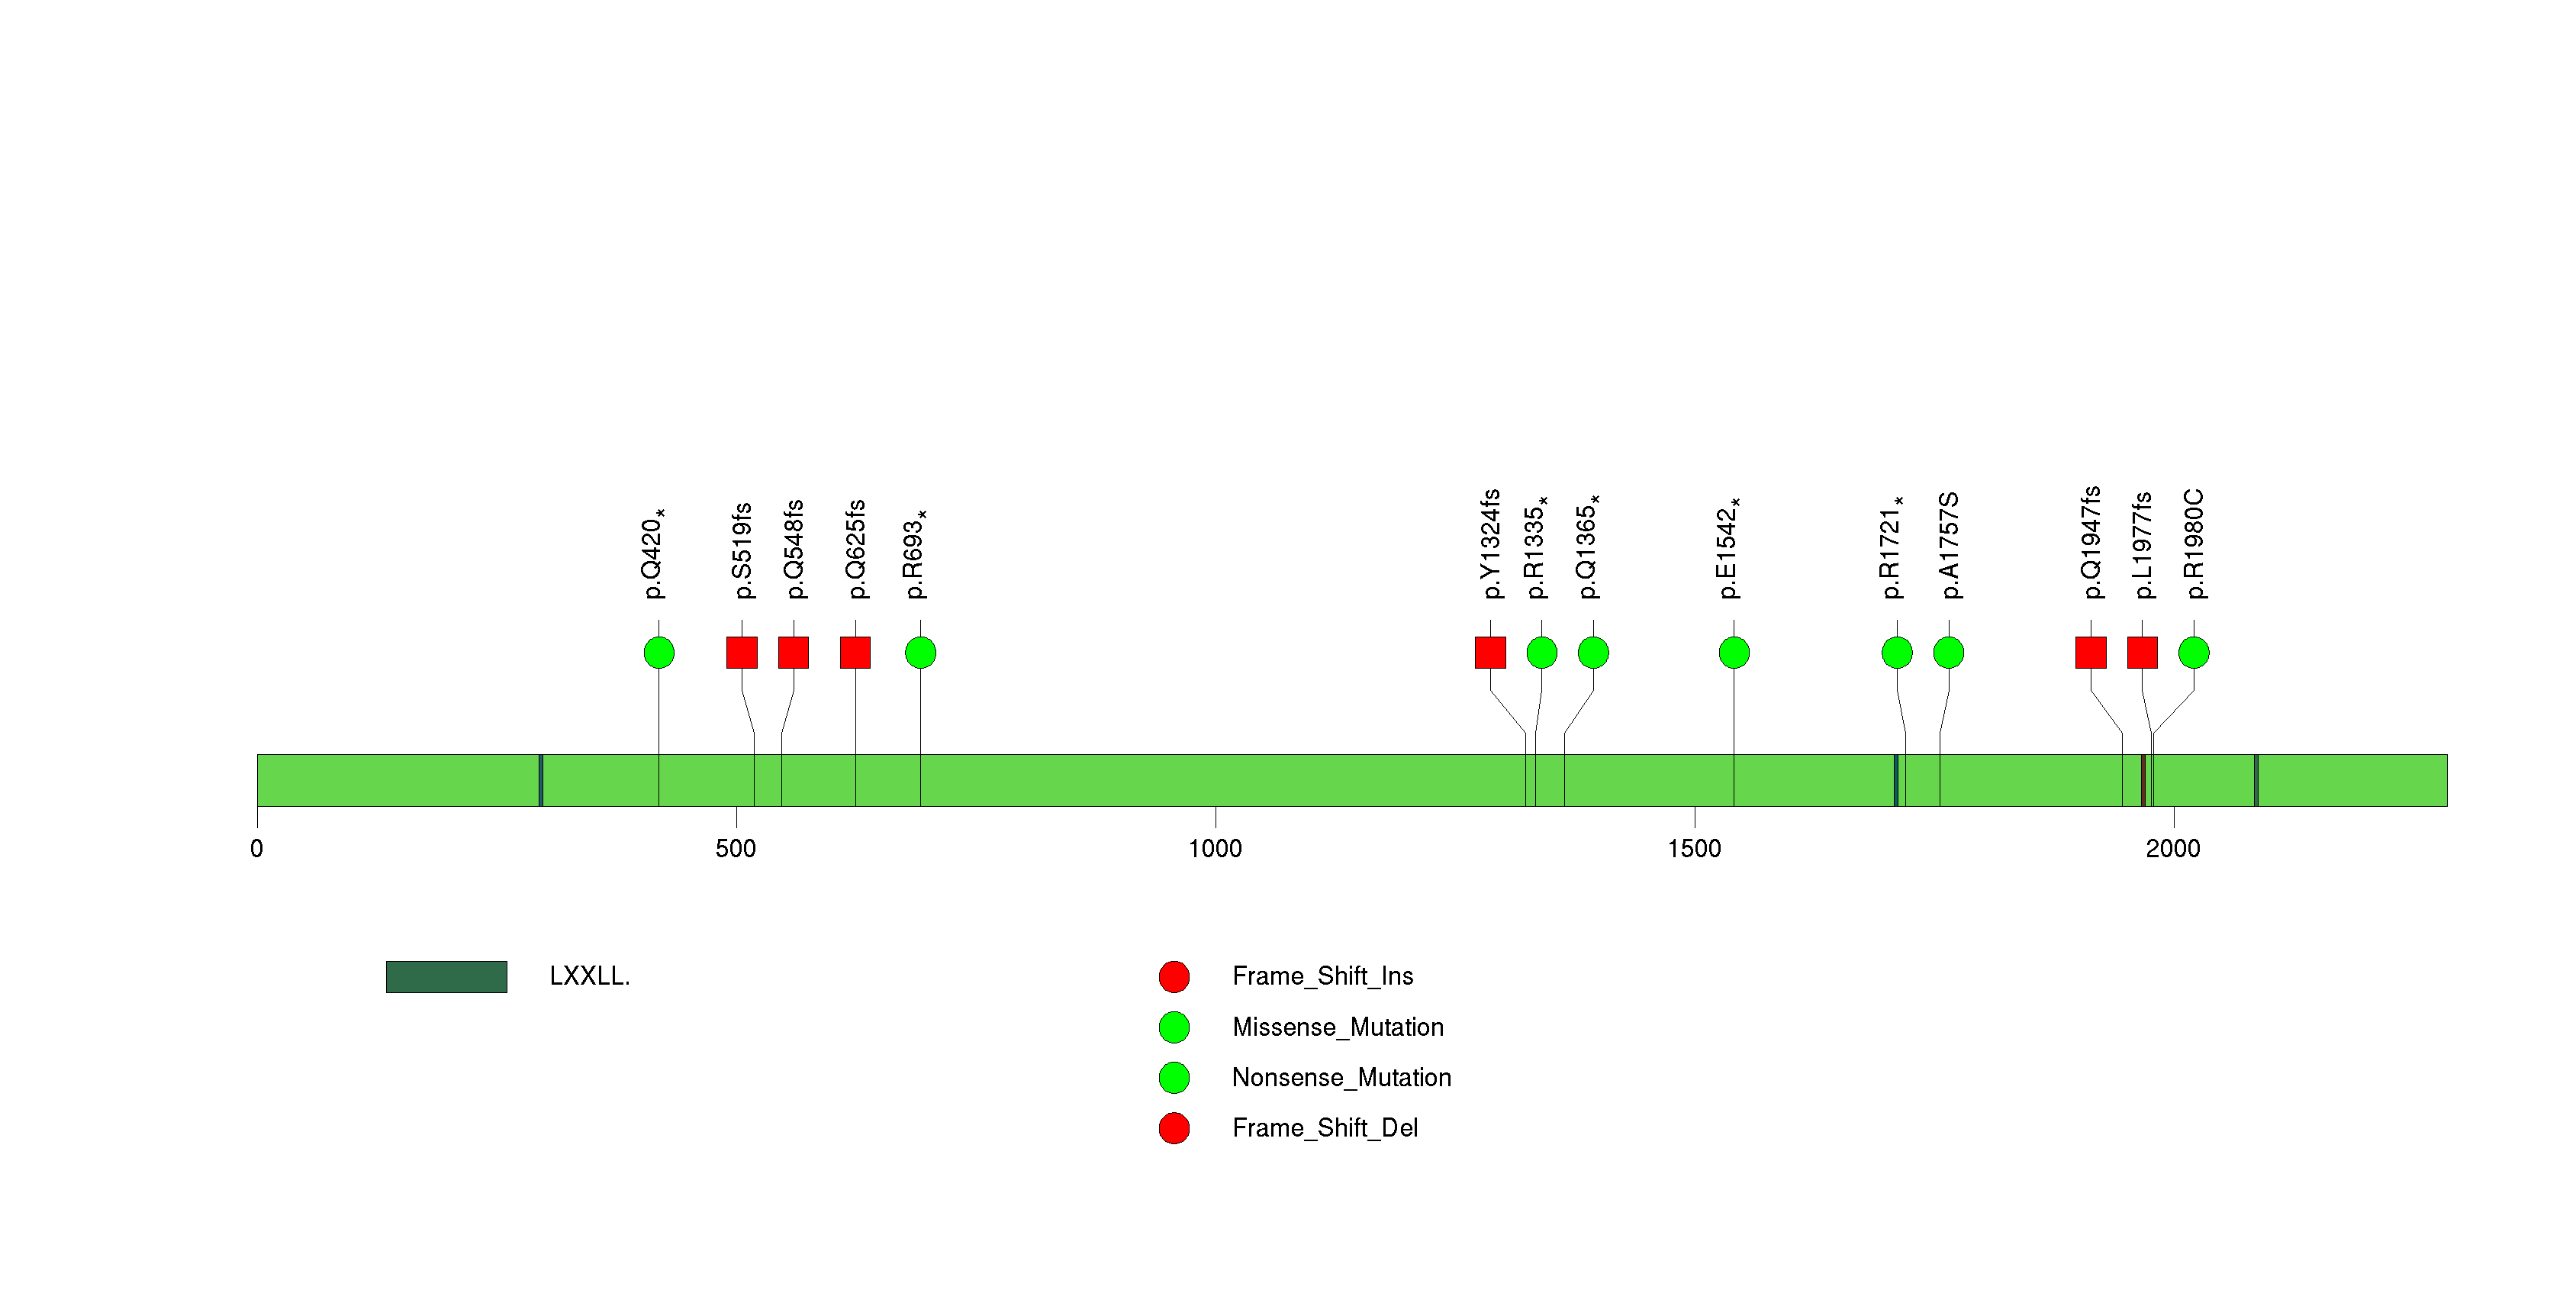
Figure S7. This figure depicts the distribution of mutations and mutation types across the CIC significant gene.
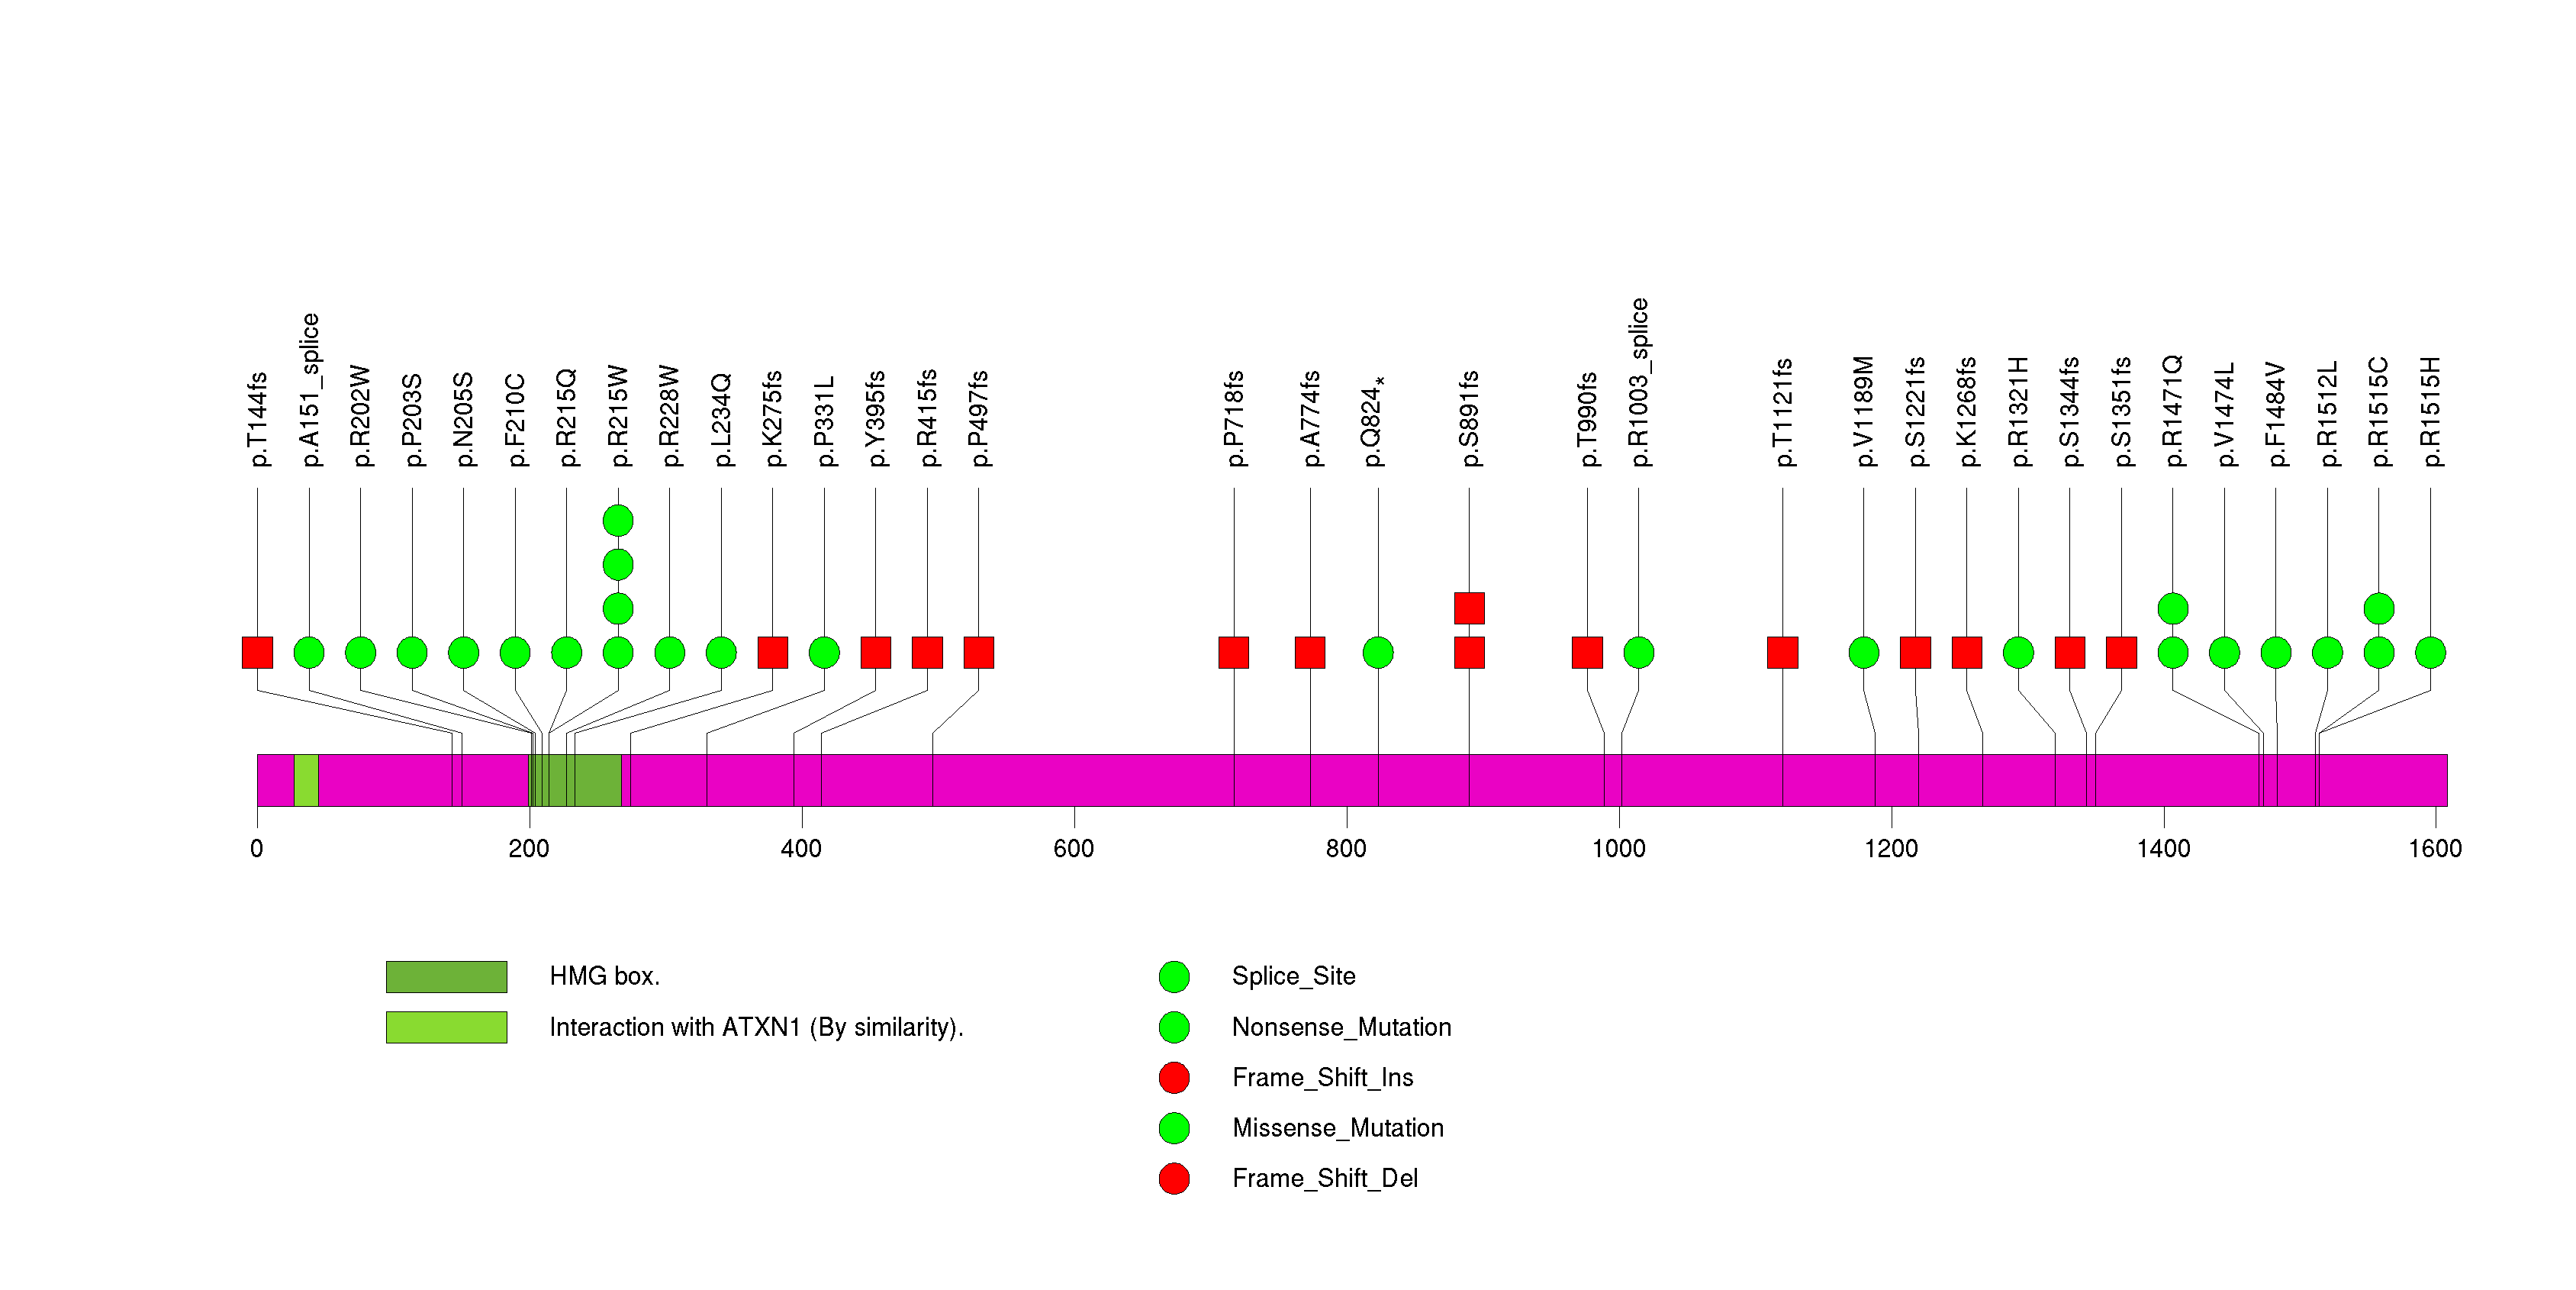
Figure S8. This figure depicts the distribution of mutations and mutation types across the NOTCH1 significant gene.
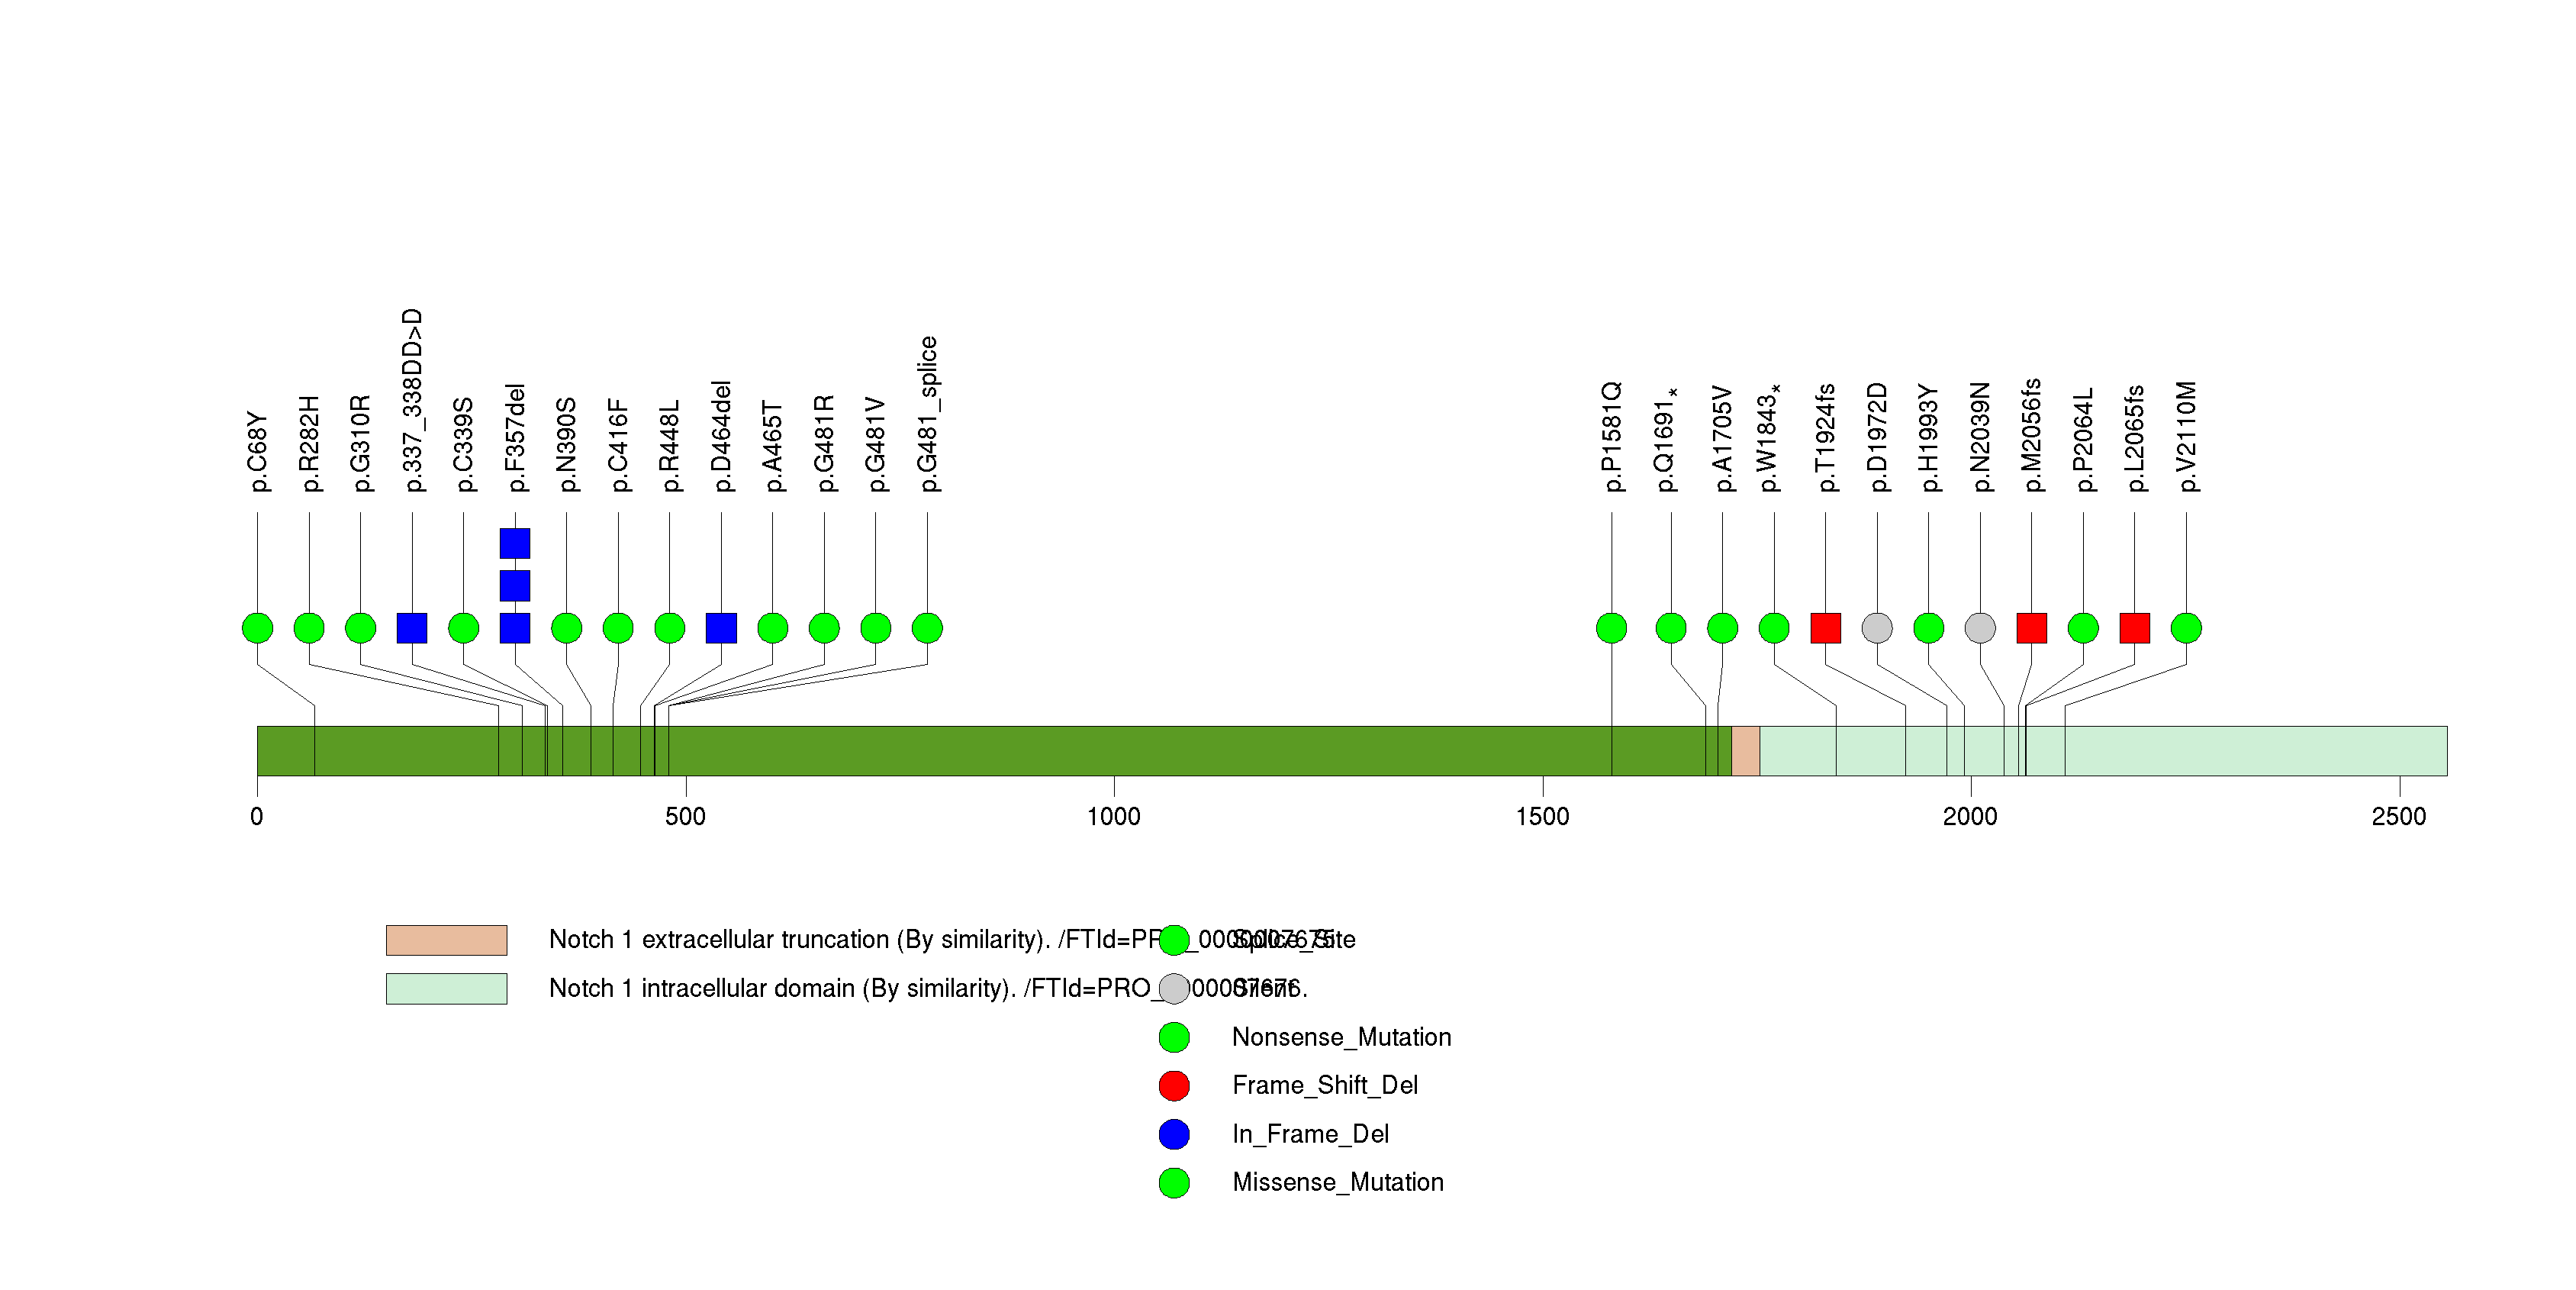
Figure S9. This figure depicts the distribution of mutations and mutation types across the MUC7 significant gene.
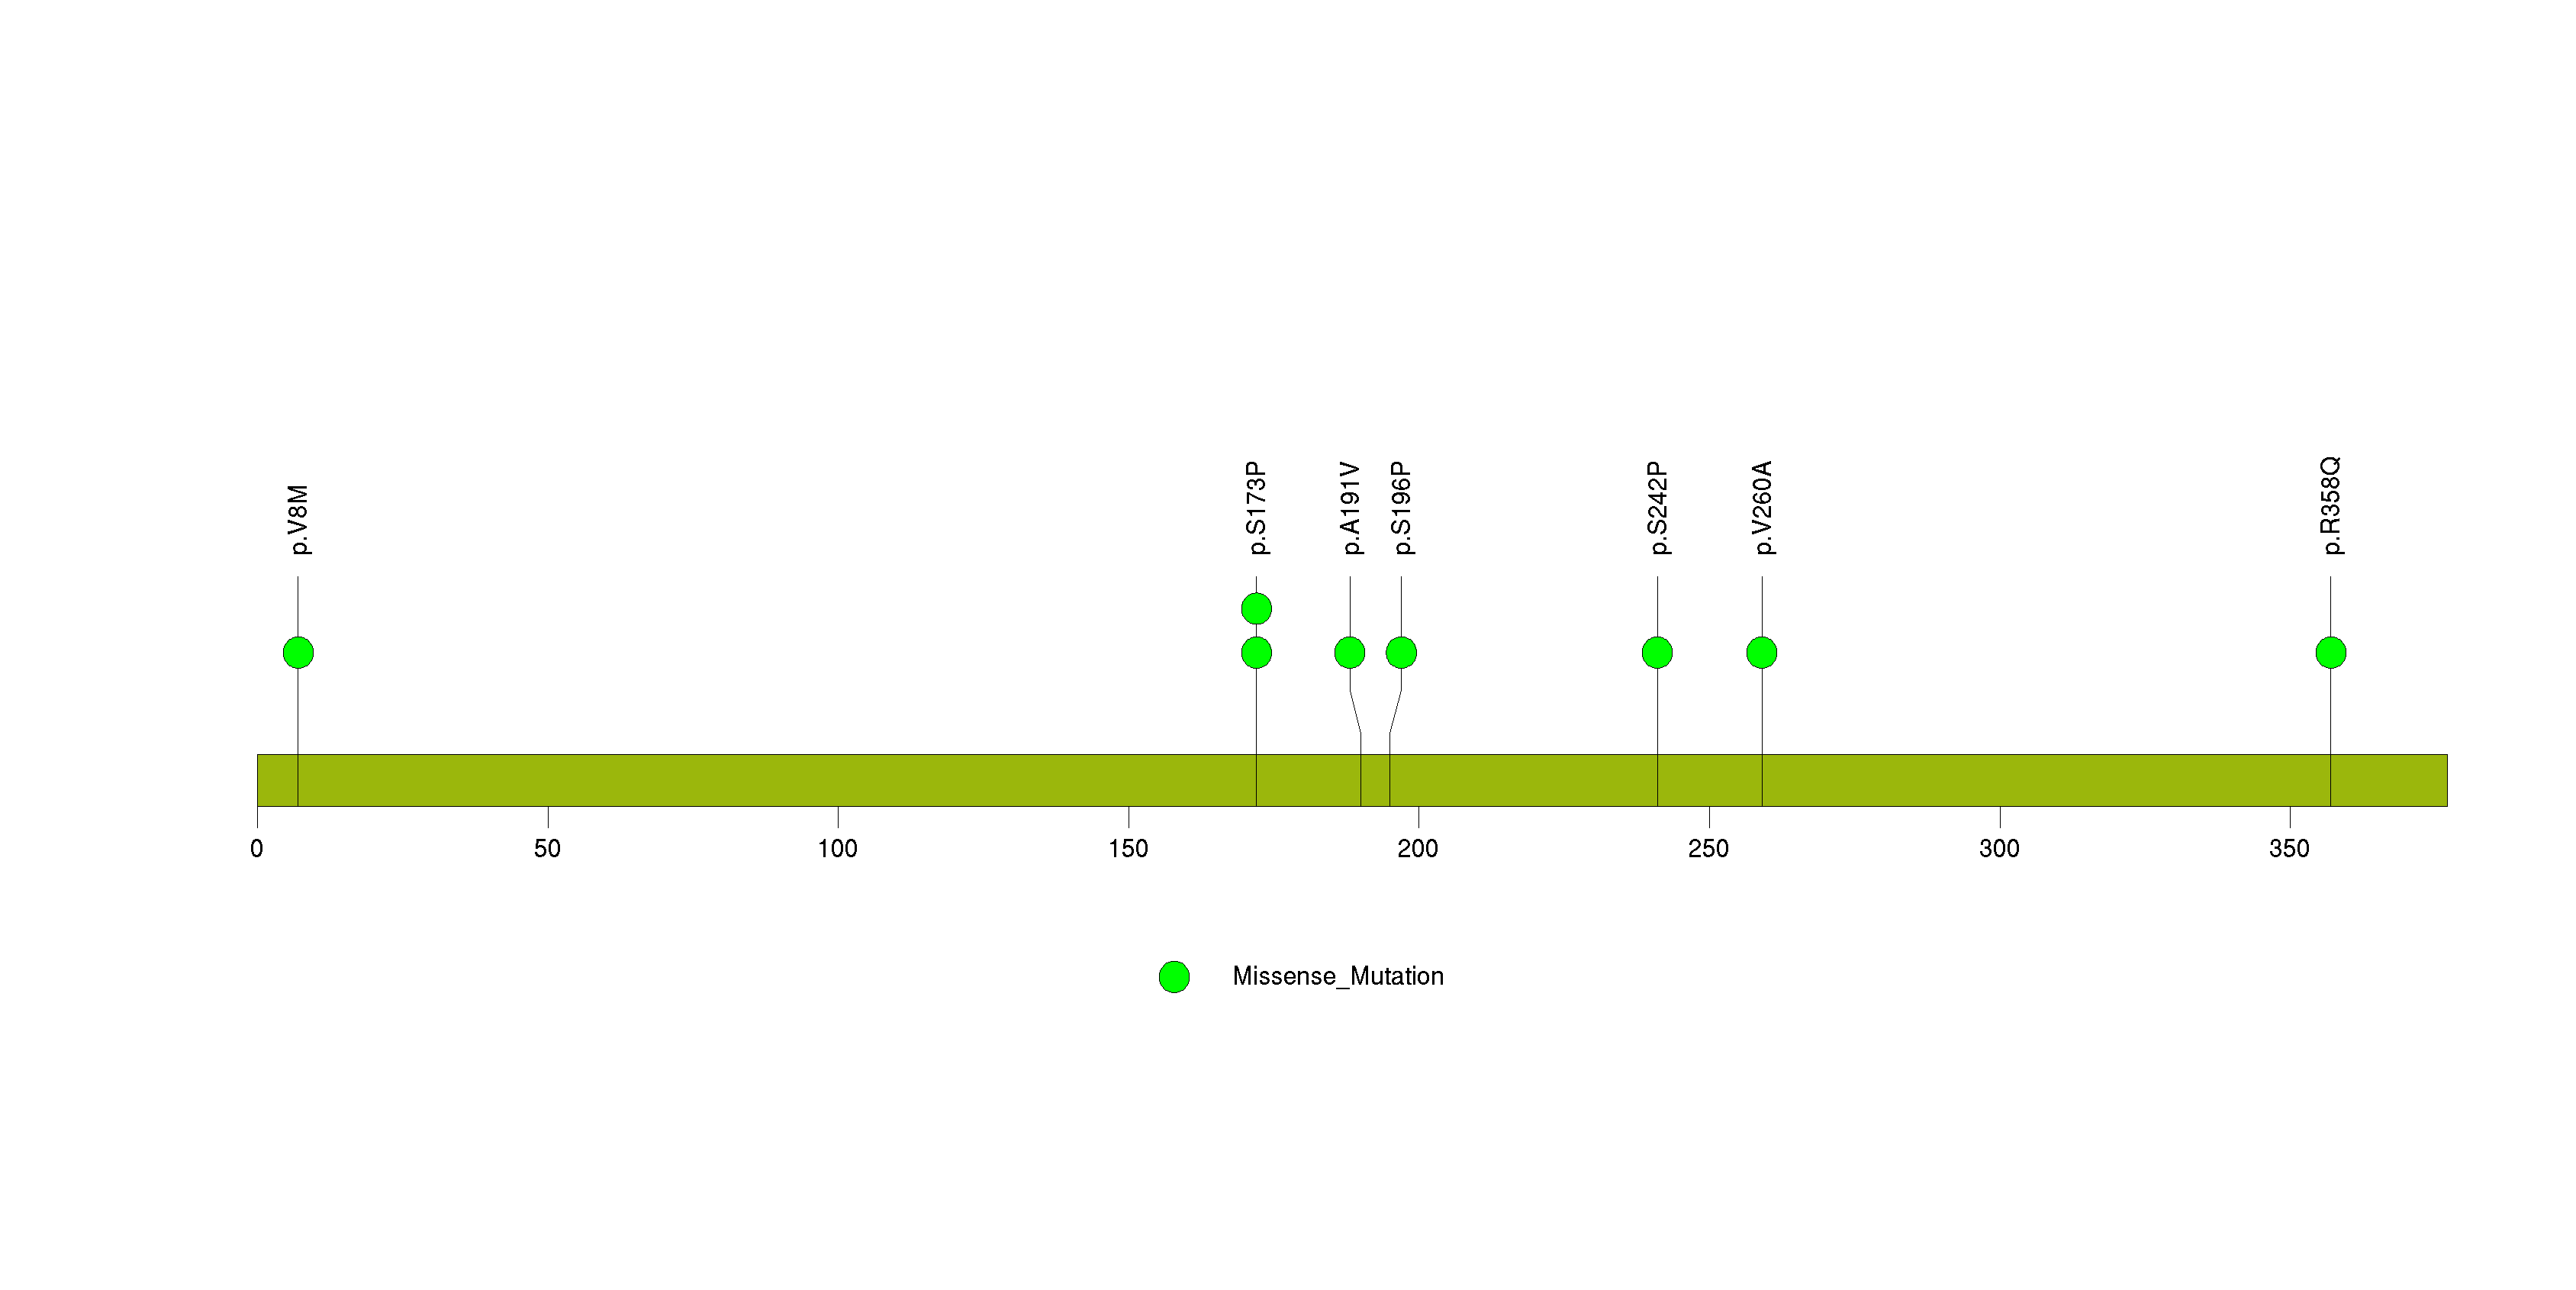
Figure S10. This figure depicts the distribution of mutations and mutation types across the NF1 significant gene.
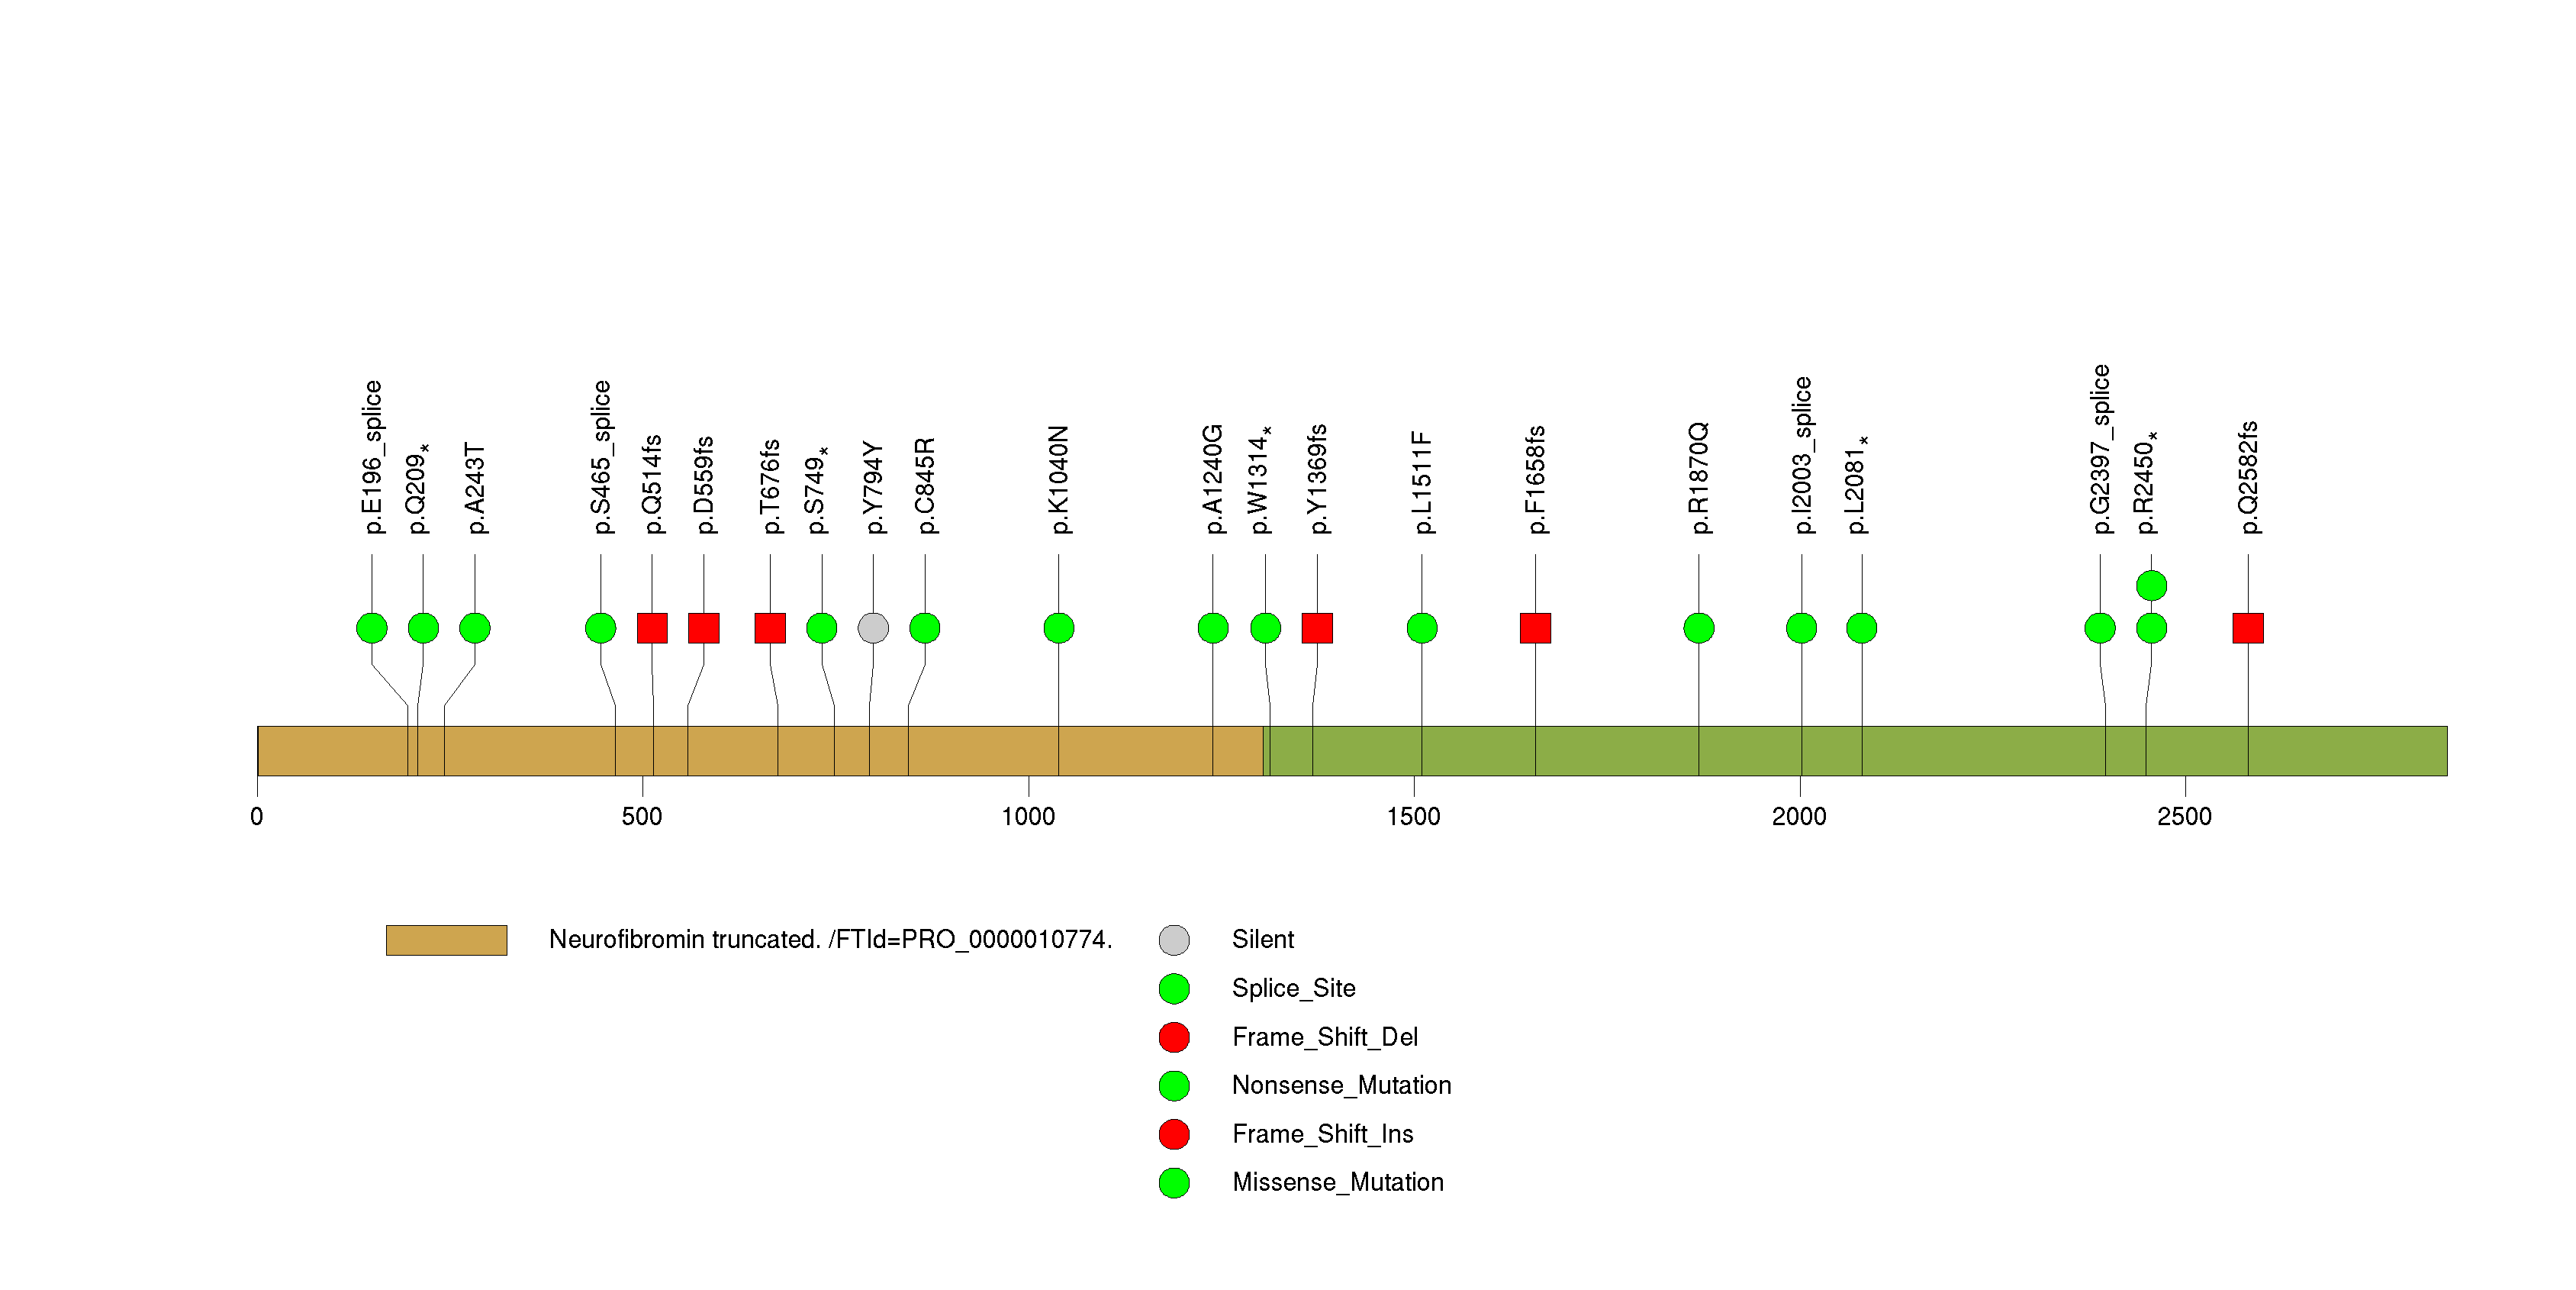
Figure S11. This figure depicts the distribution of mutations and mutation types across the TCF12 significant gene.
Figure S12. This figure depicts the distribution of mutations and mutation types across the PIK3R1 significant gene.
Figure S13. This figure depicts the distribution of mutations and mutation types across the ARID2 significant gene.
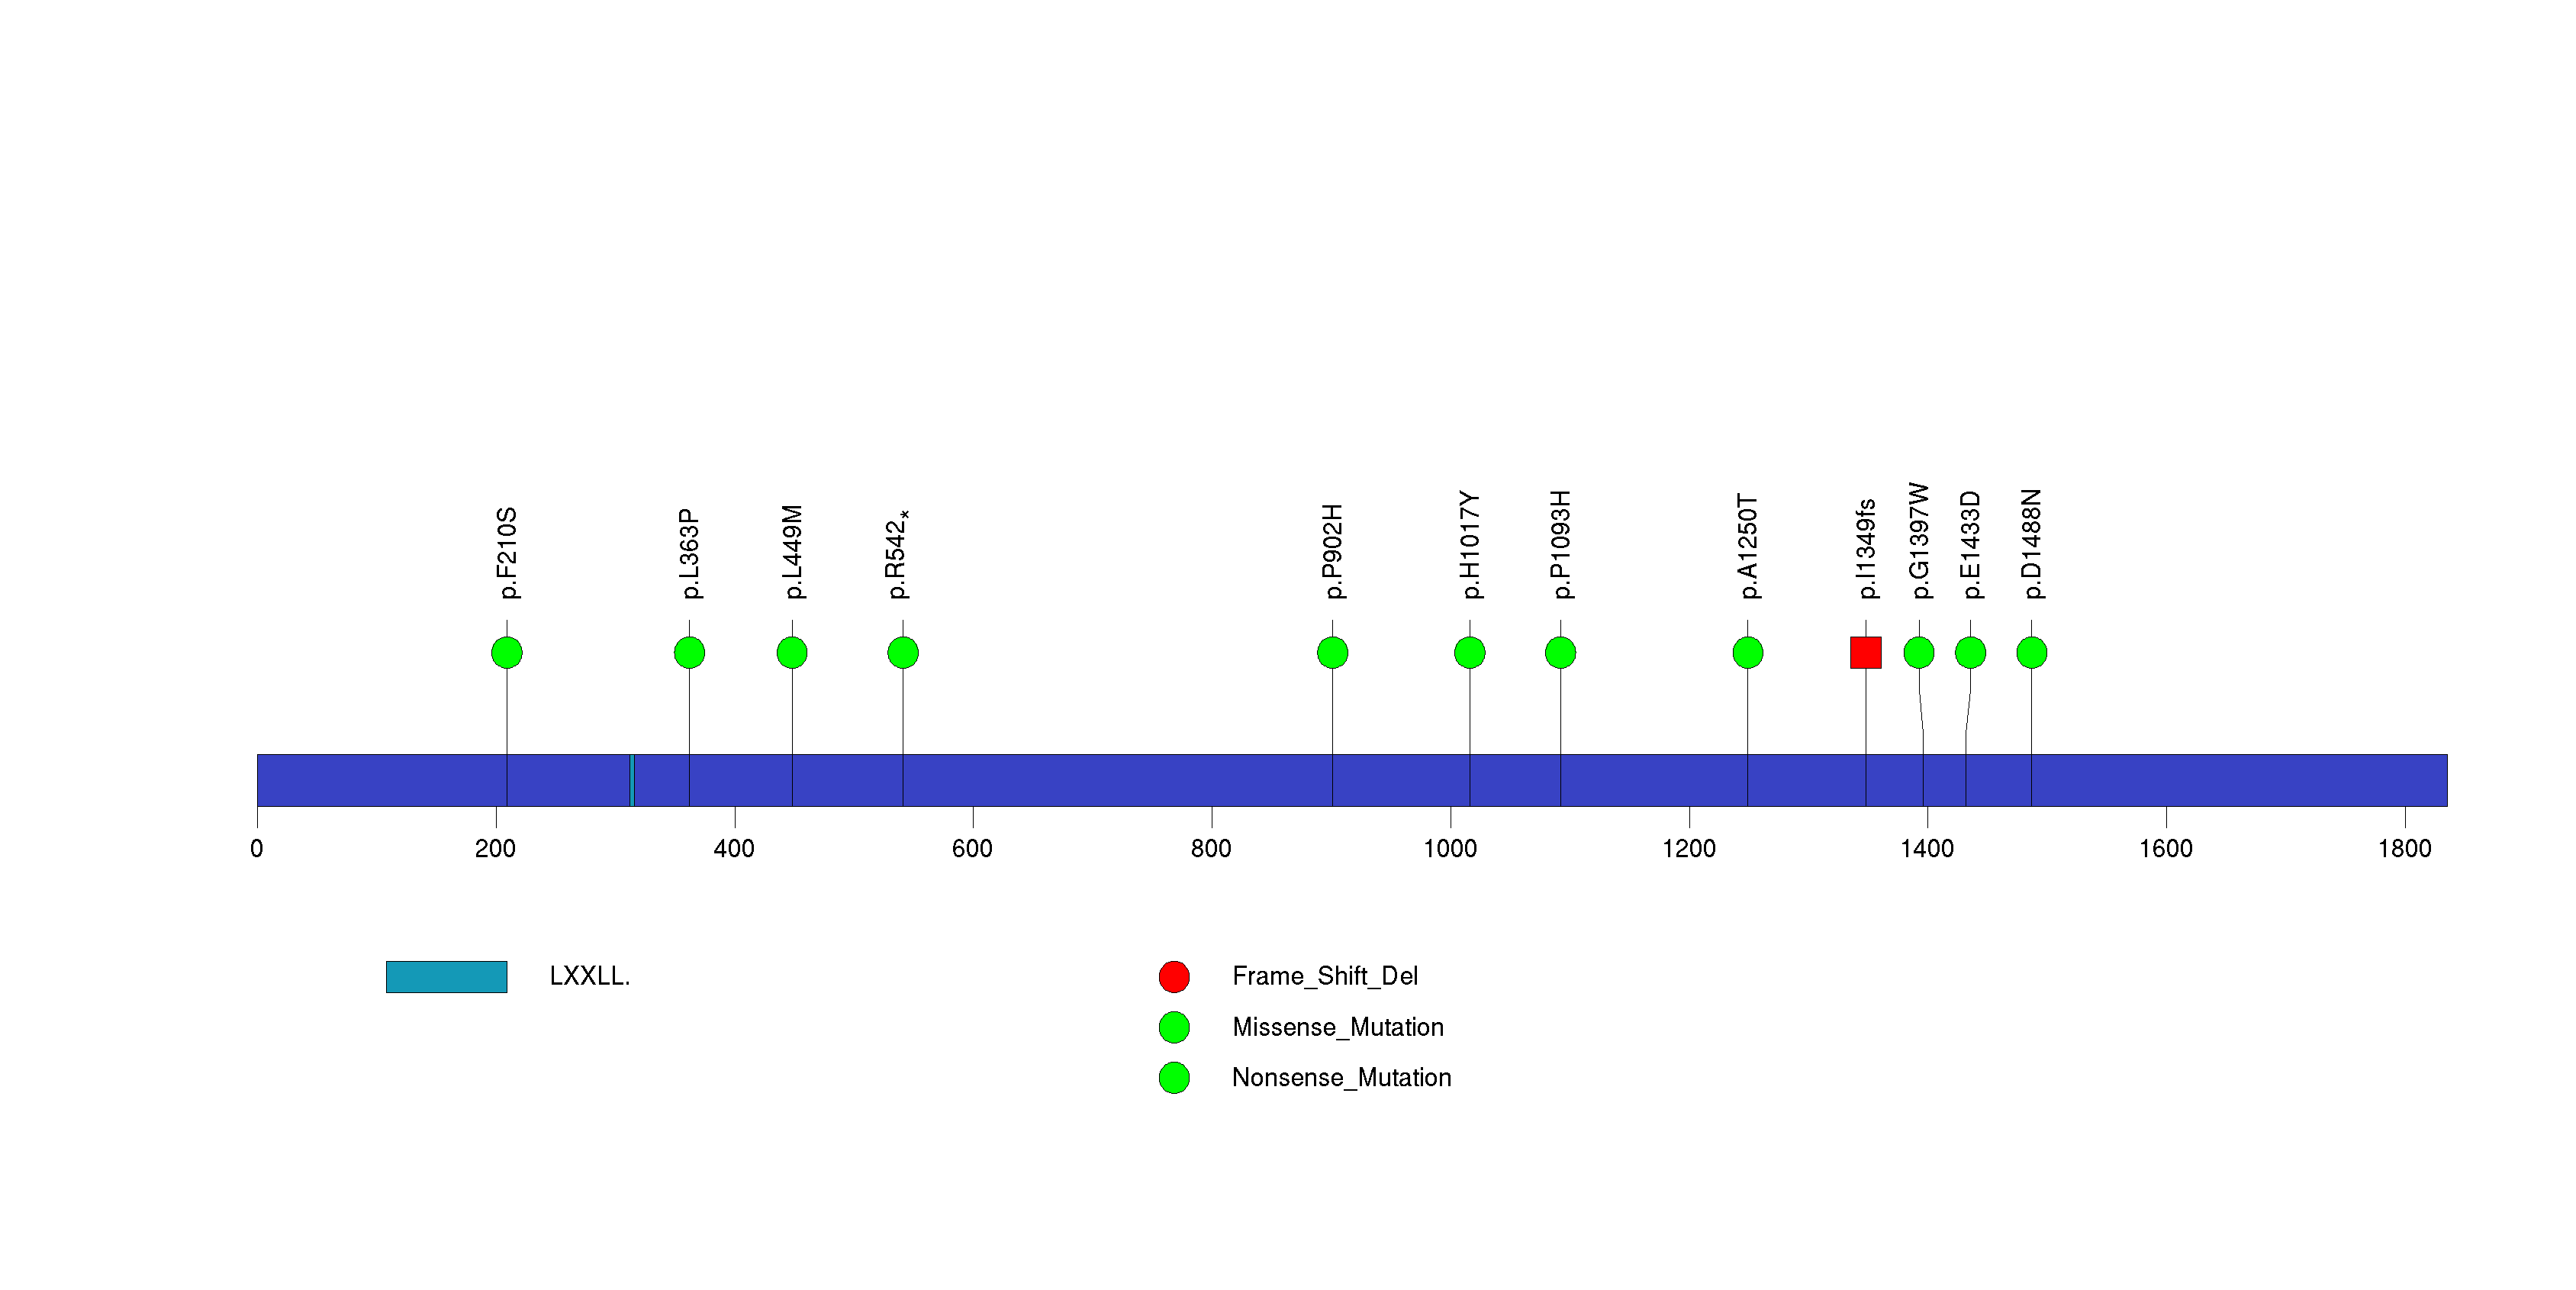
Figure S14. This figure depicts the distribution of mutations and mutation types across the IL32 significant gene.
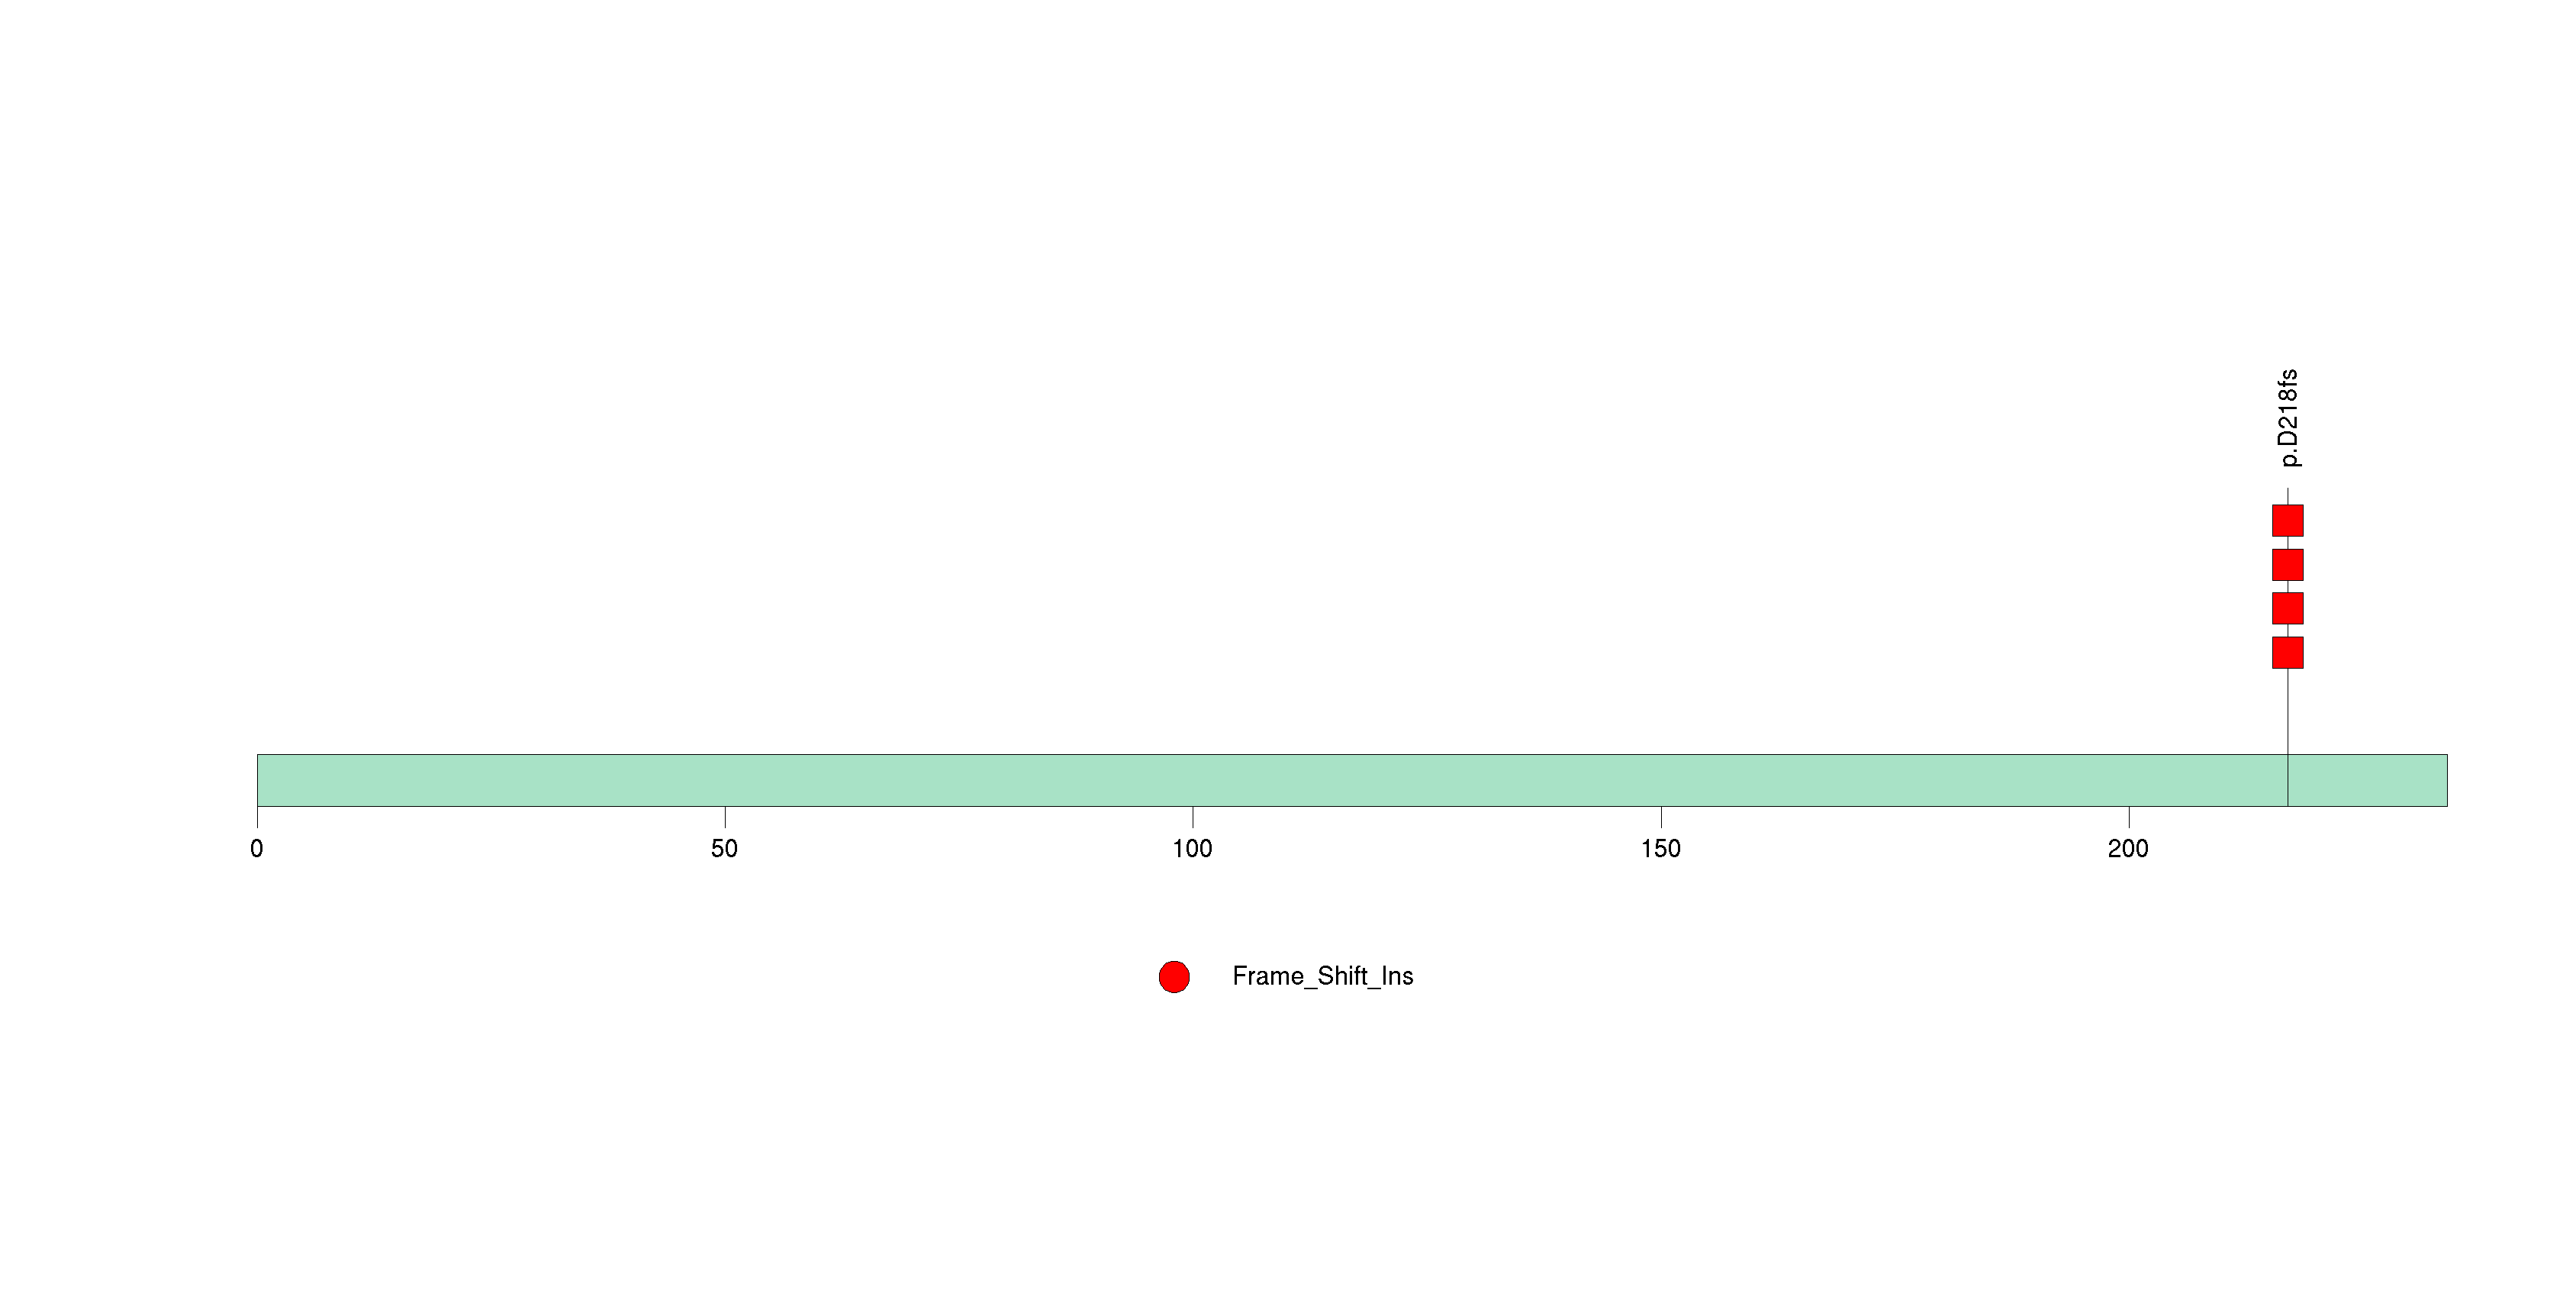
Figure S15. This figure depicts the distribution of mutations and mutation types across the AHNAK significant gene.
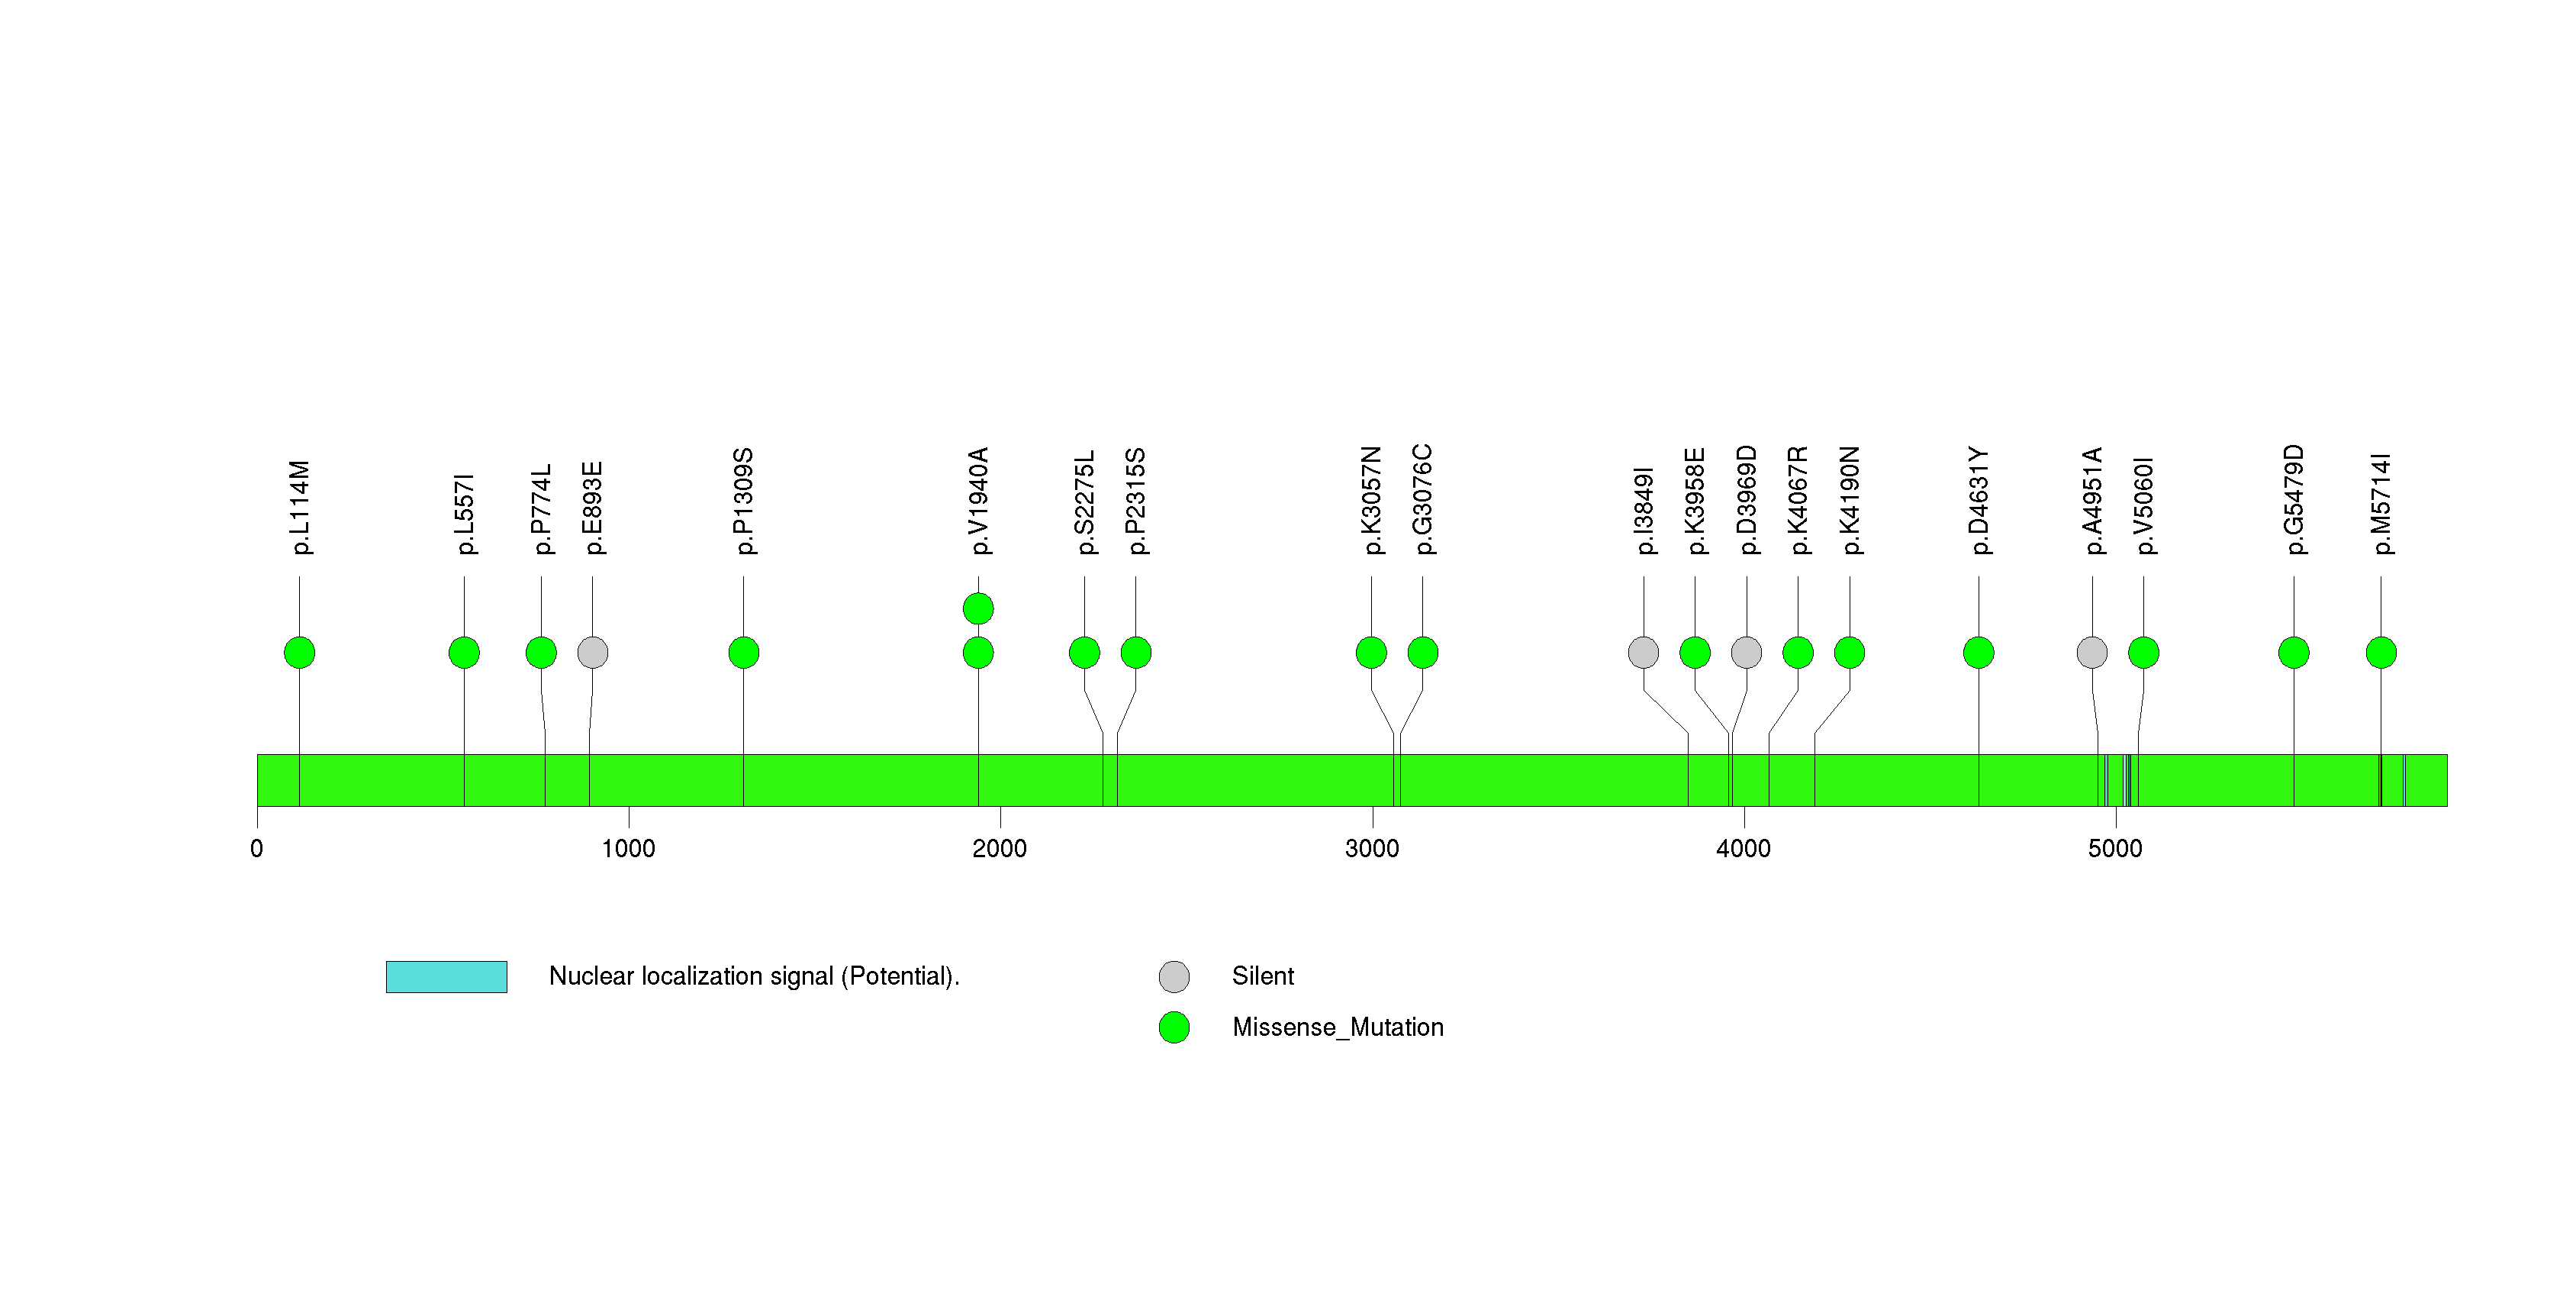
Figure S16. This figure depicts the distribution of mutations and mutation types across the PTEN significant gene.
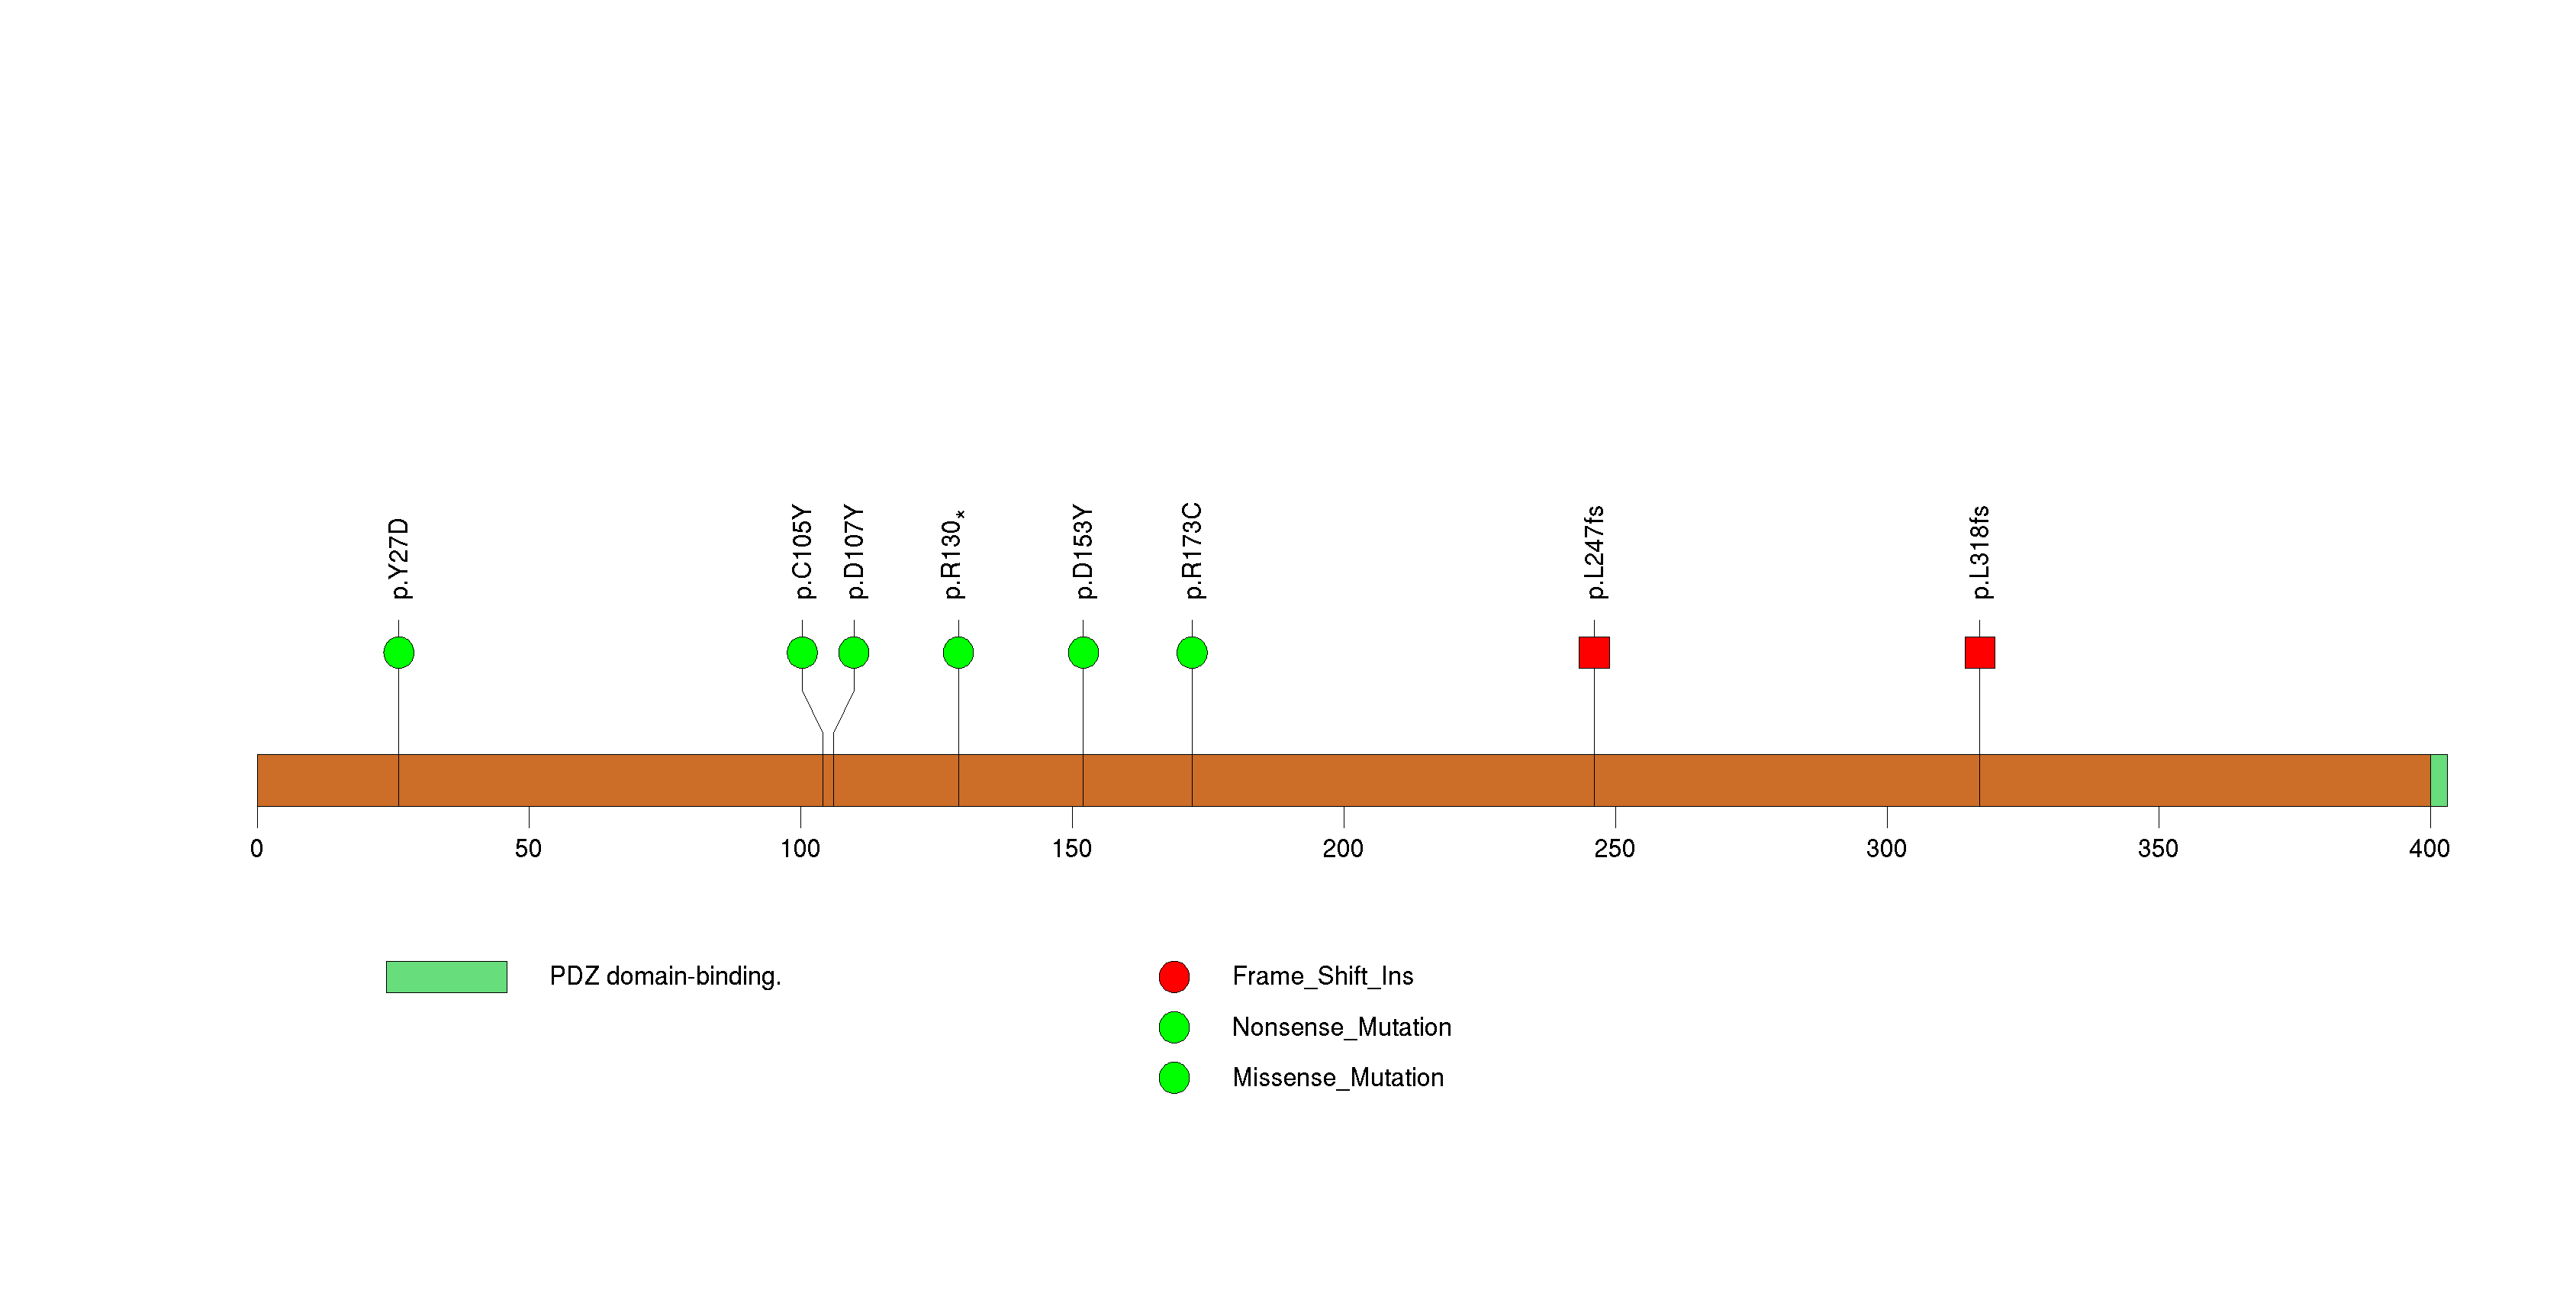
Figure S17. This figure depicts the distribution of mutations and mutation types across the FERMT3 significant gene.
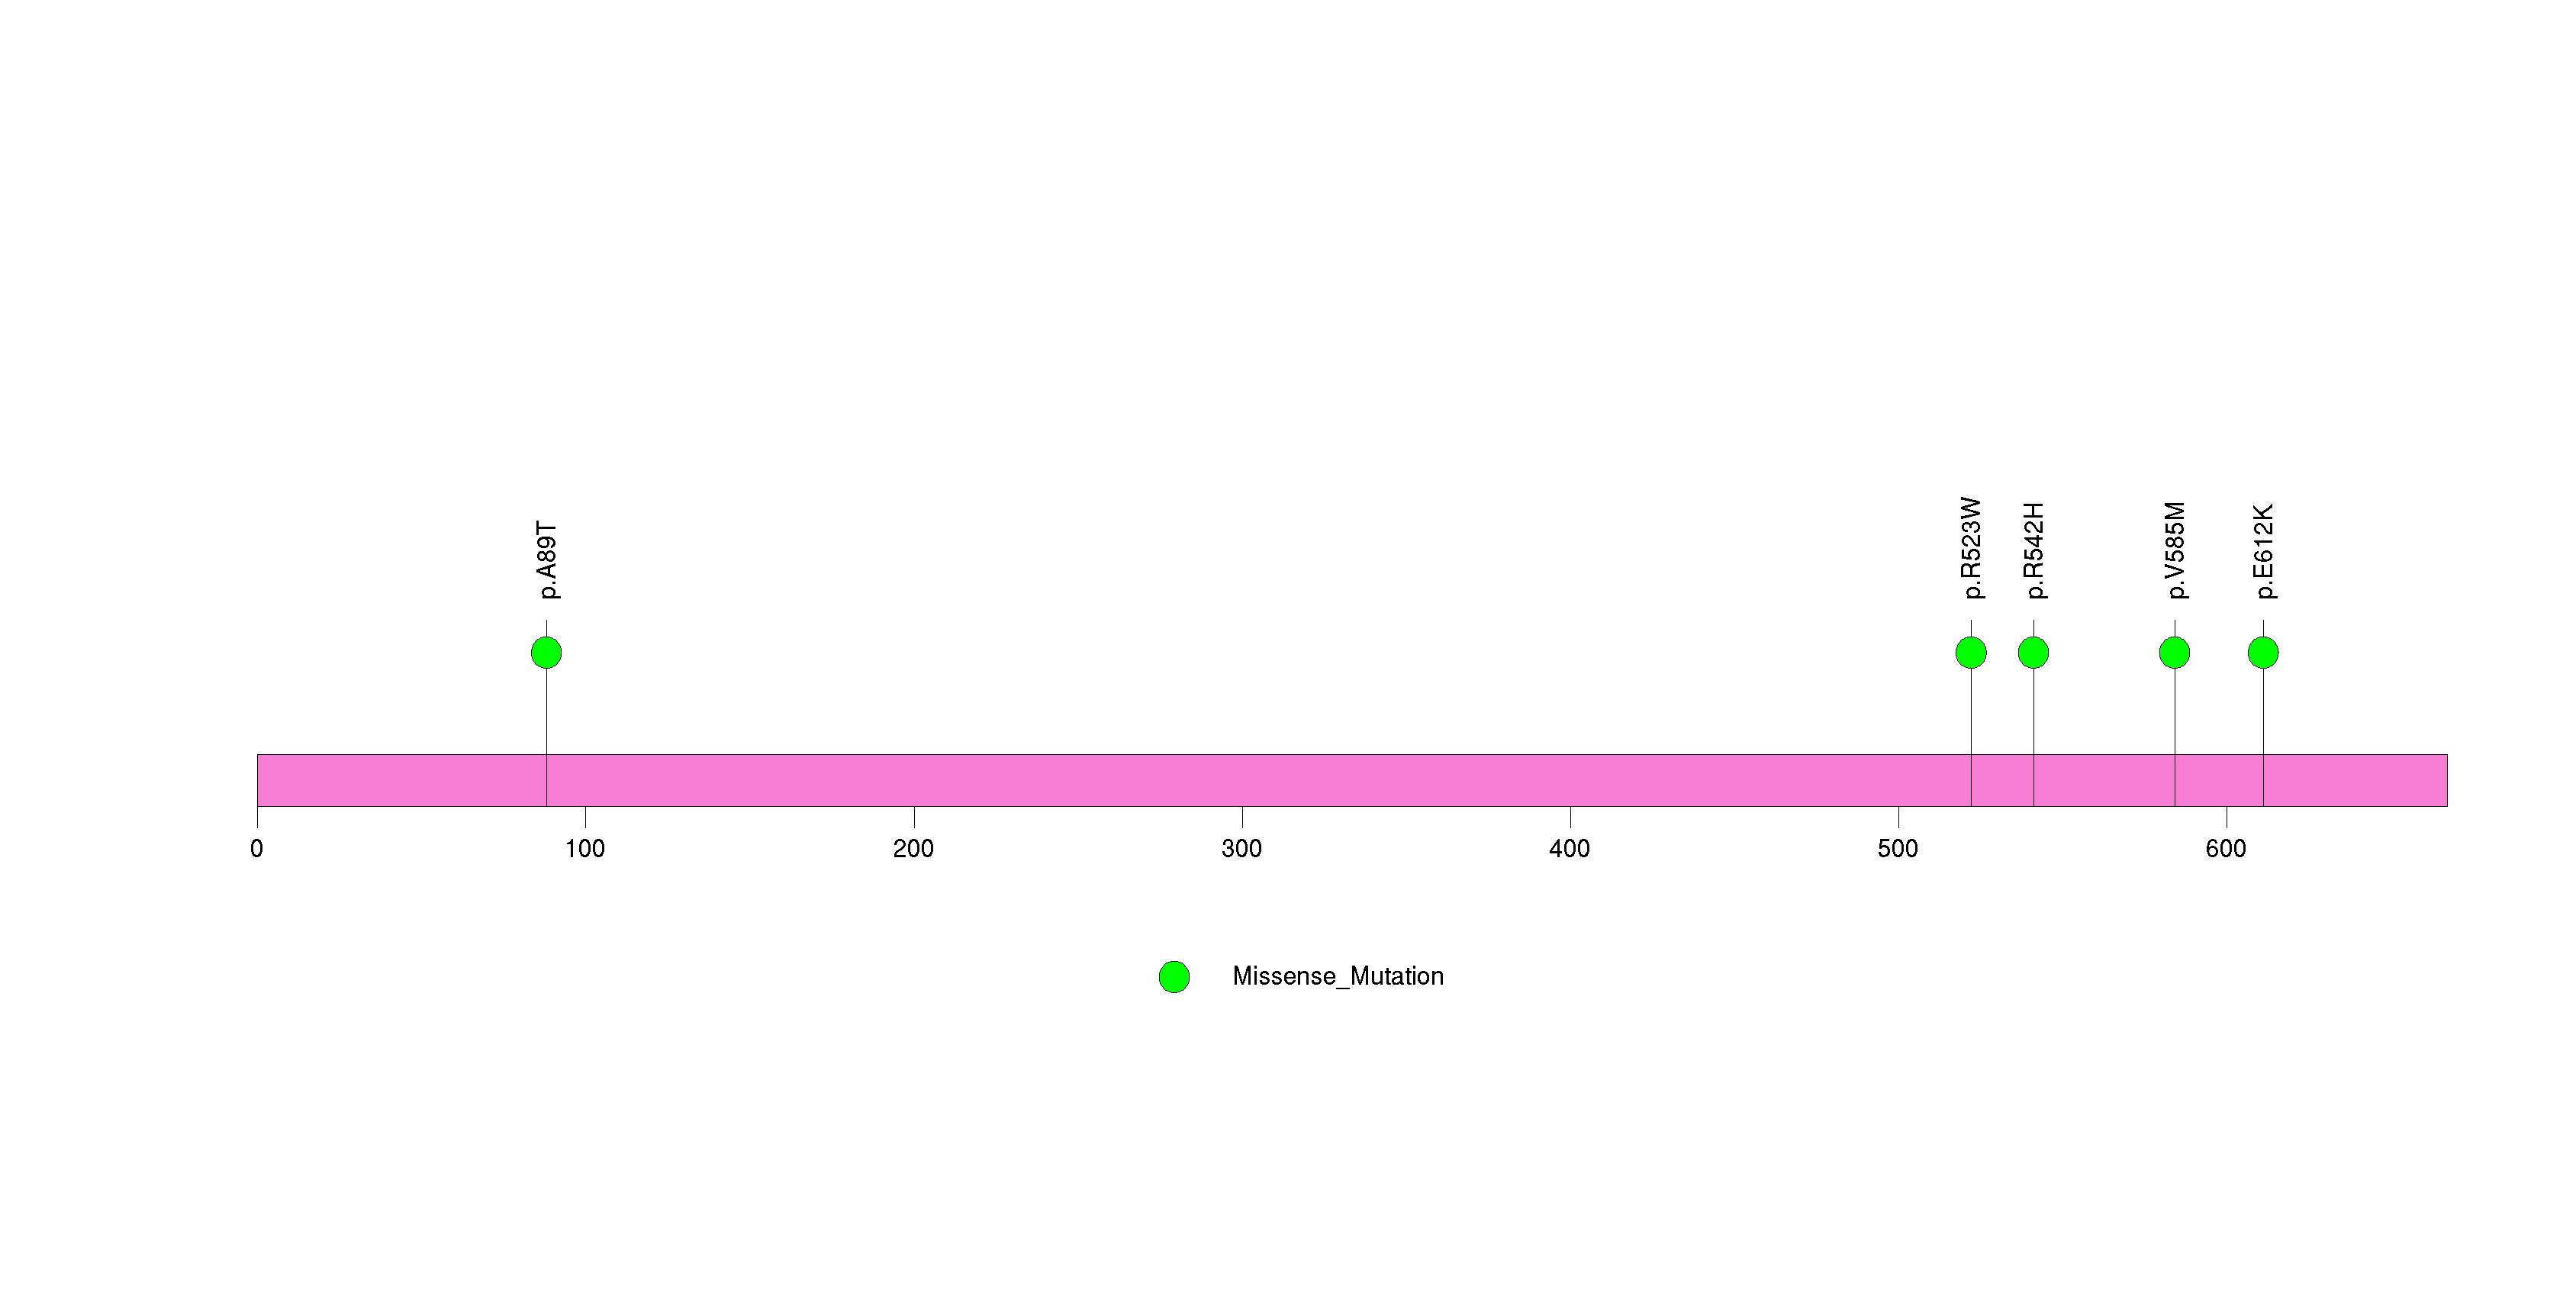
Figure S18. This figure depicts the distribution of mutations and mutation types across the DOCK5 significant gene.
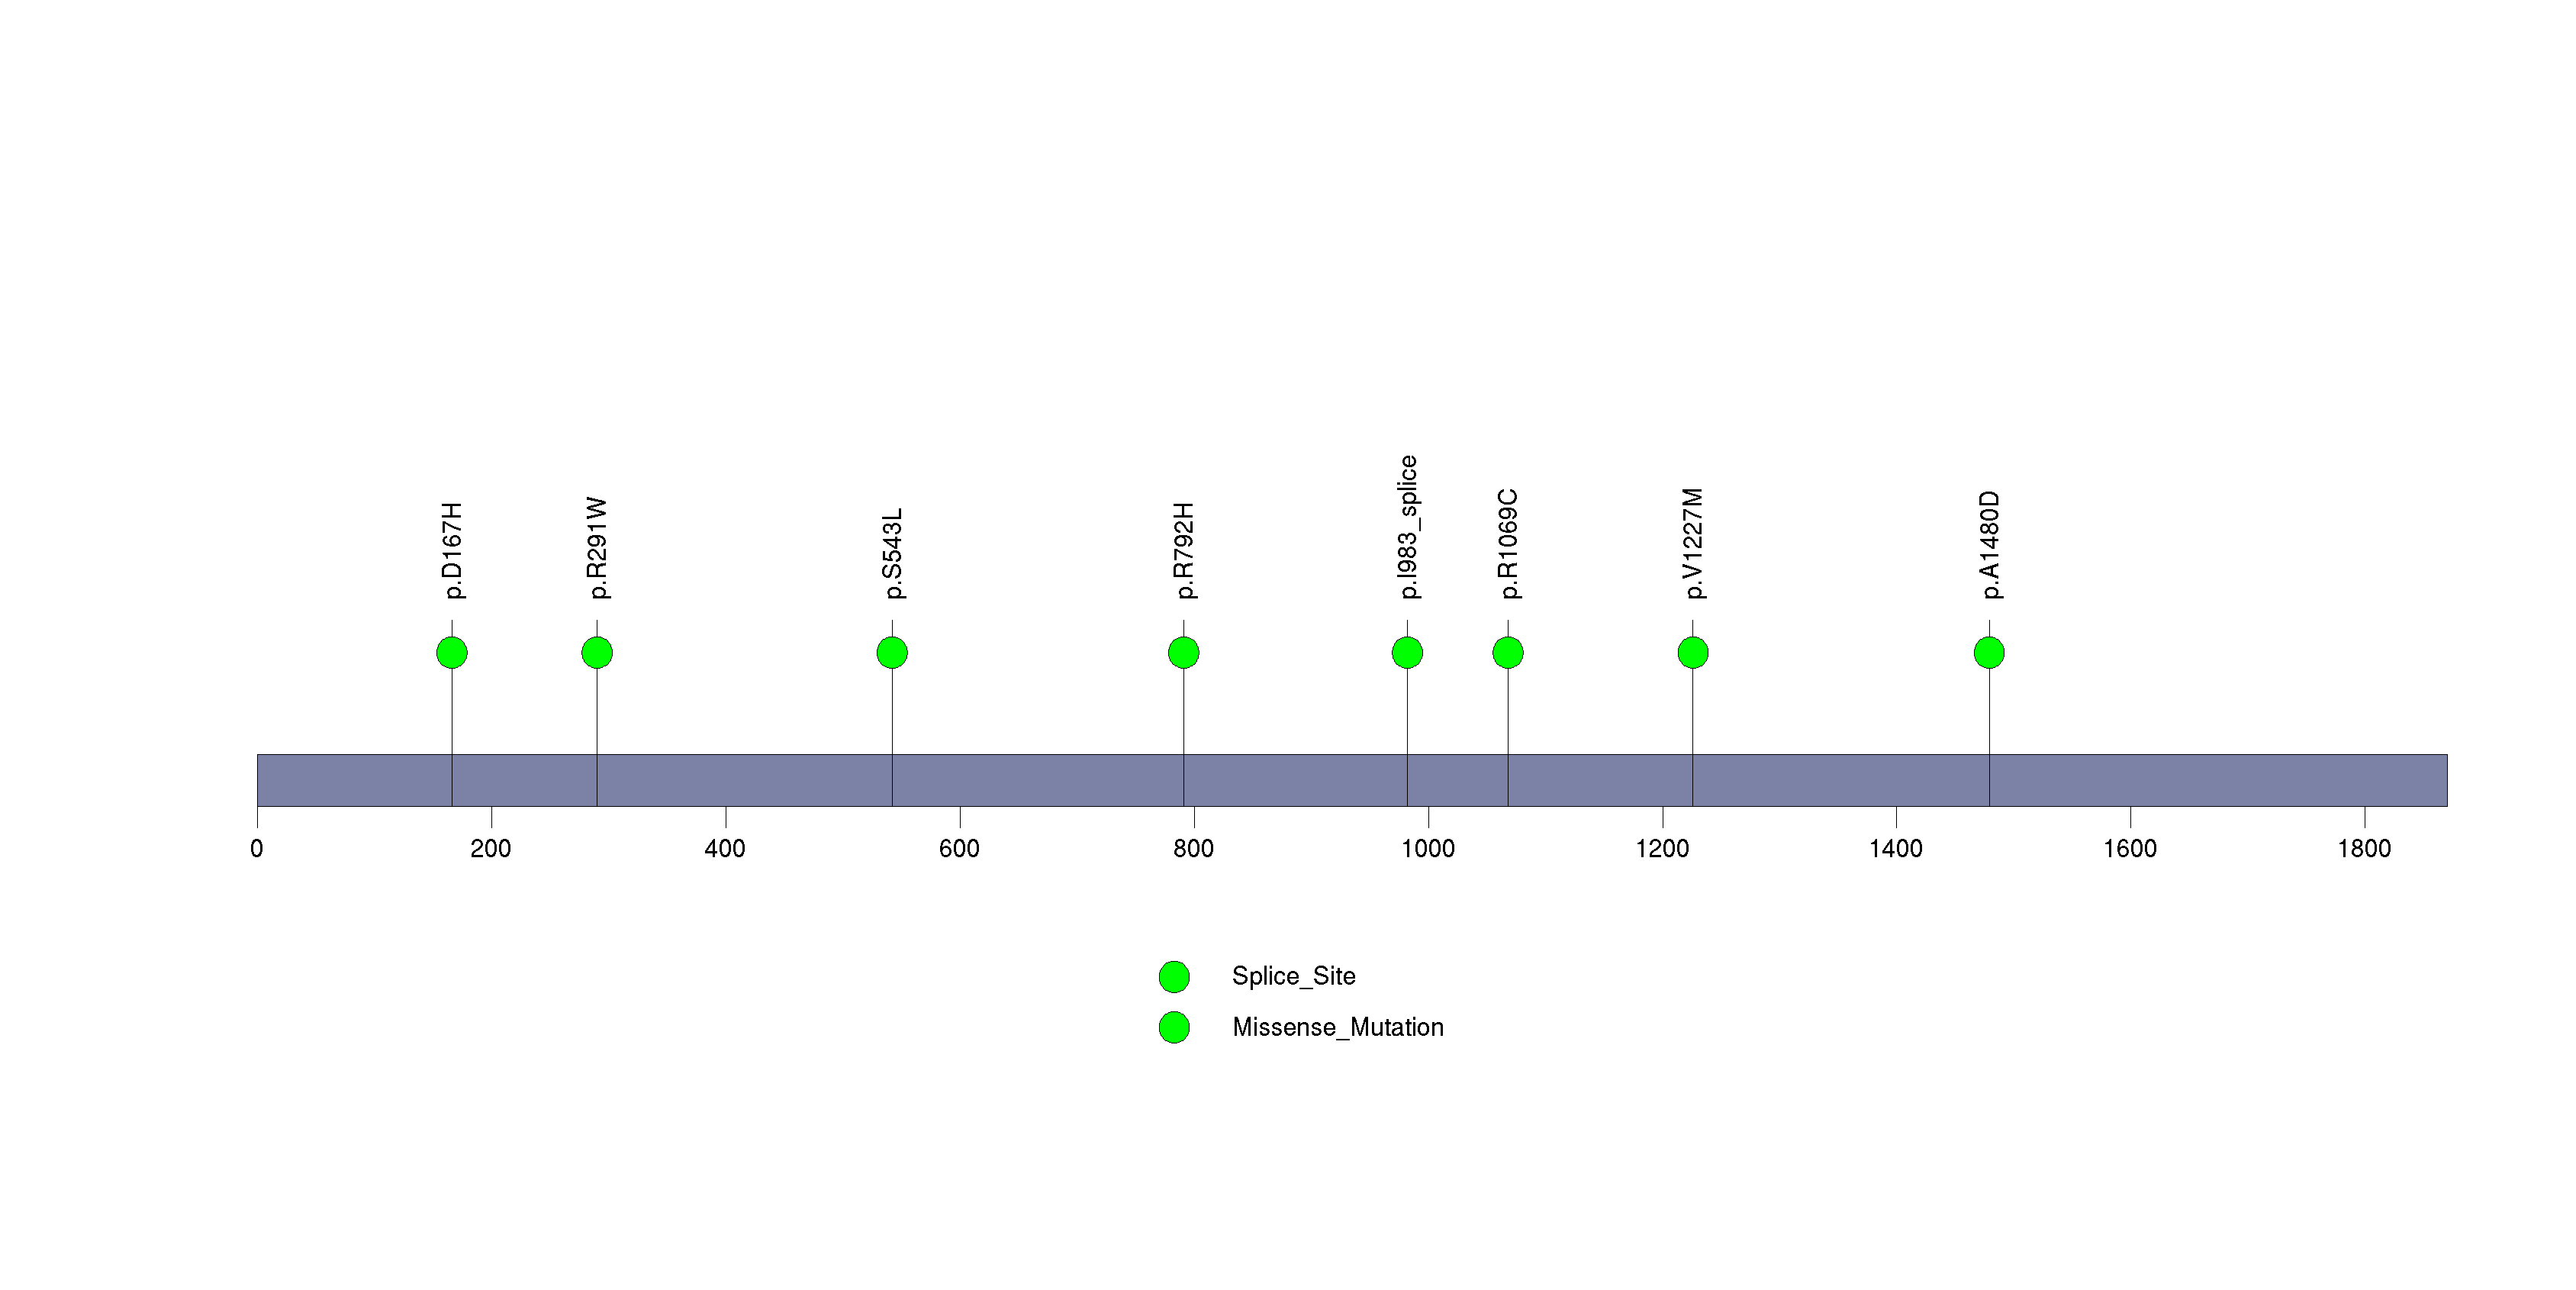
Figure S19. This figure depicts the distribution of mutations and mutation types across the TPM1 significant gene.
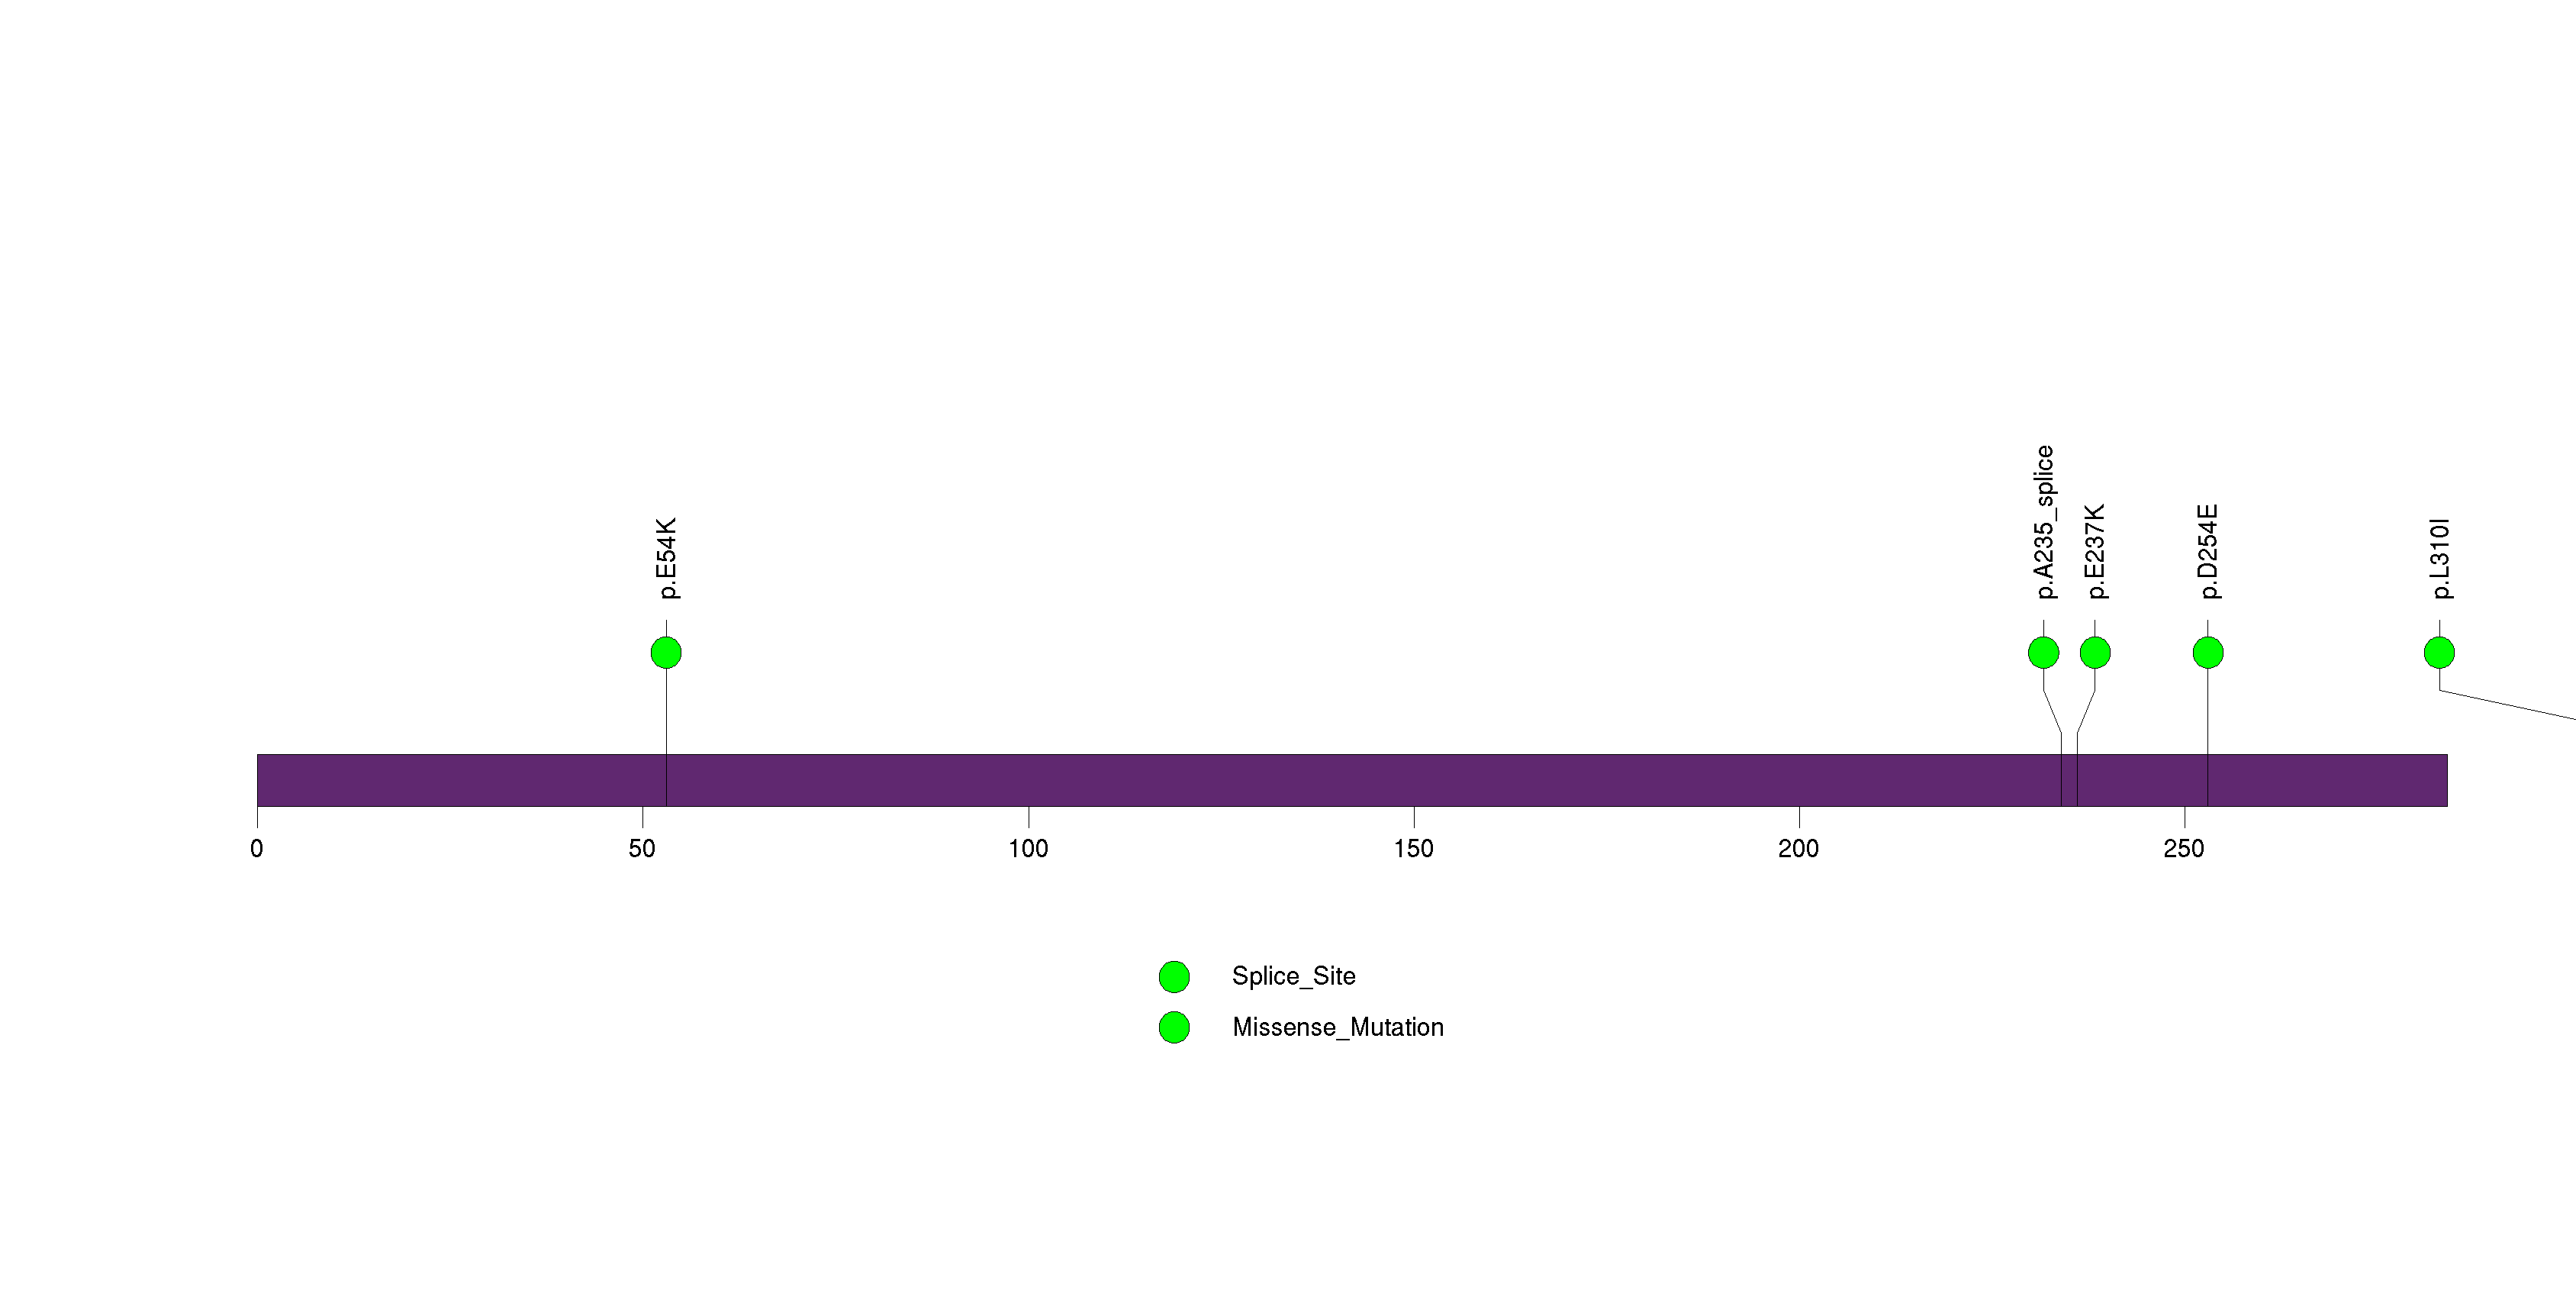
Figure S20. This figure depicts the distribution of mutations and mutation types across the NIPBL significant gene.
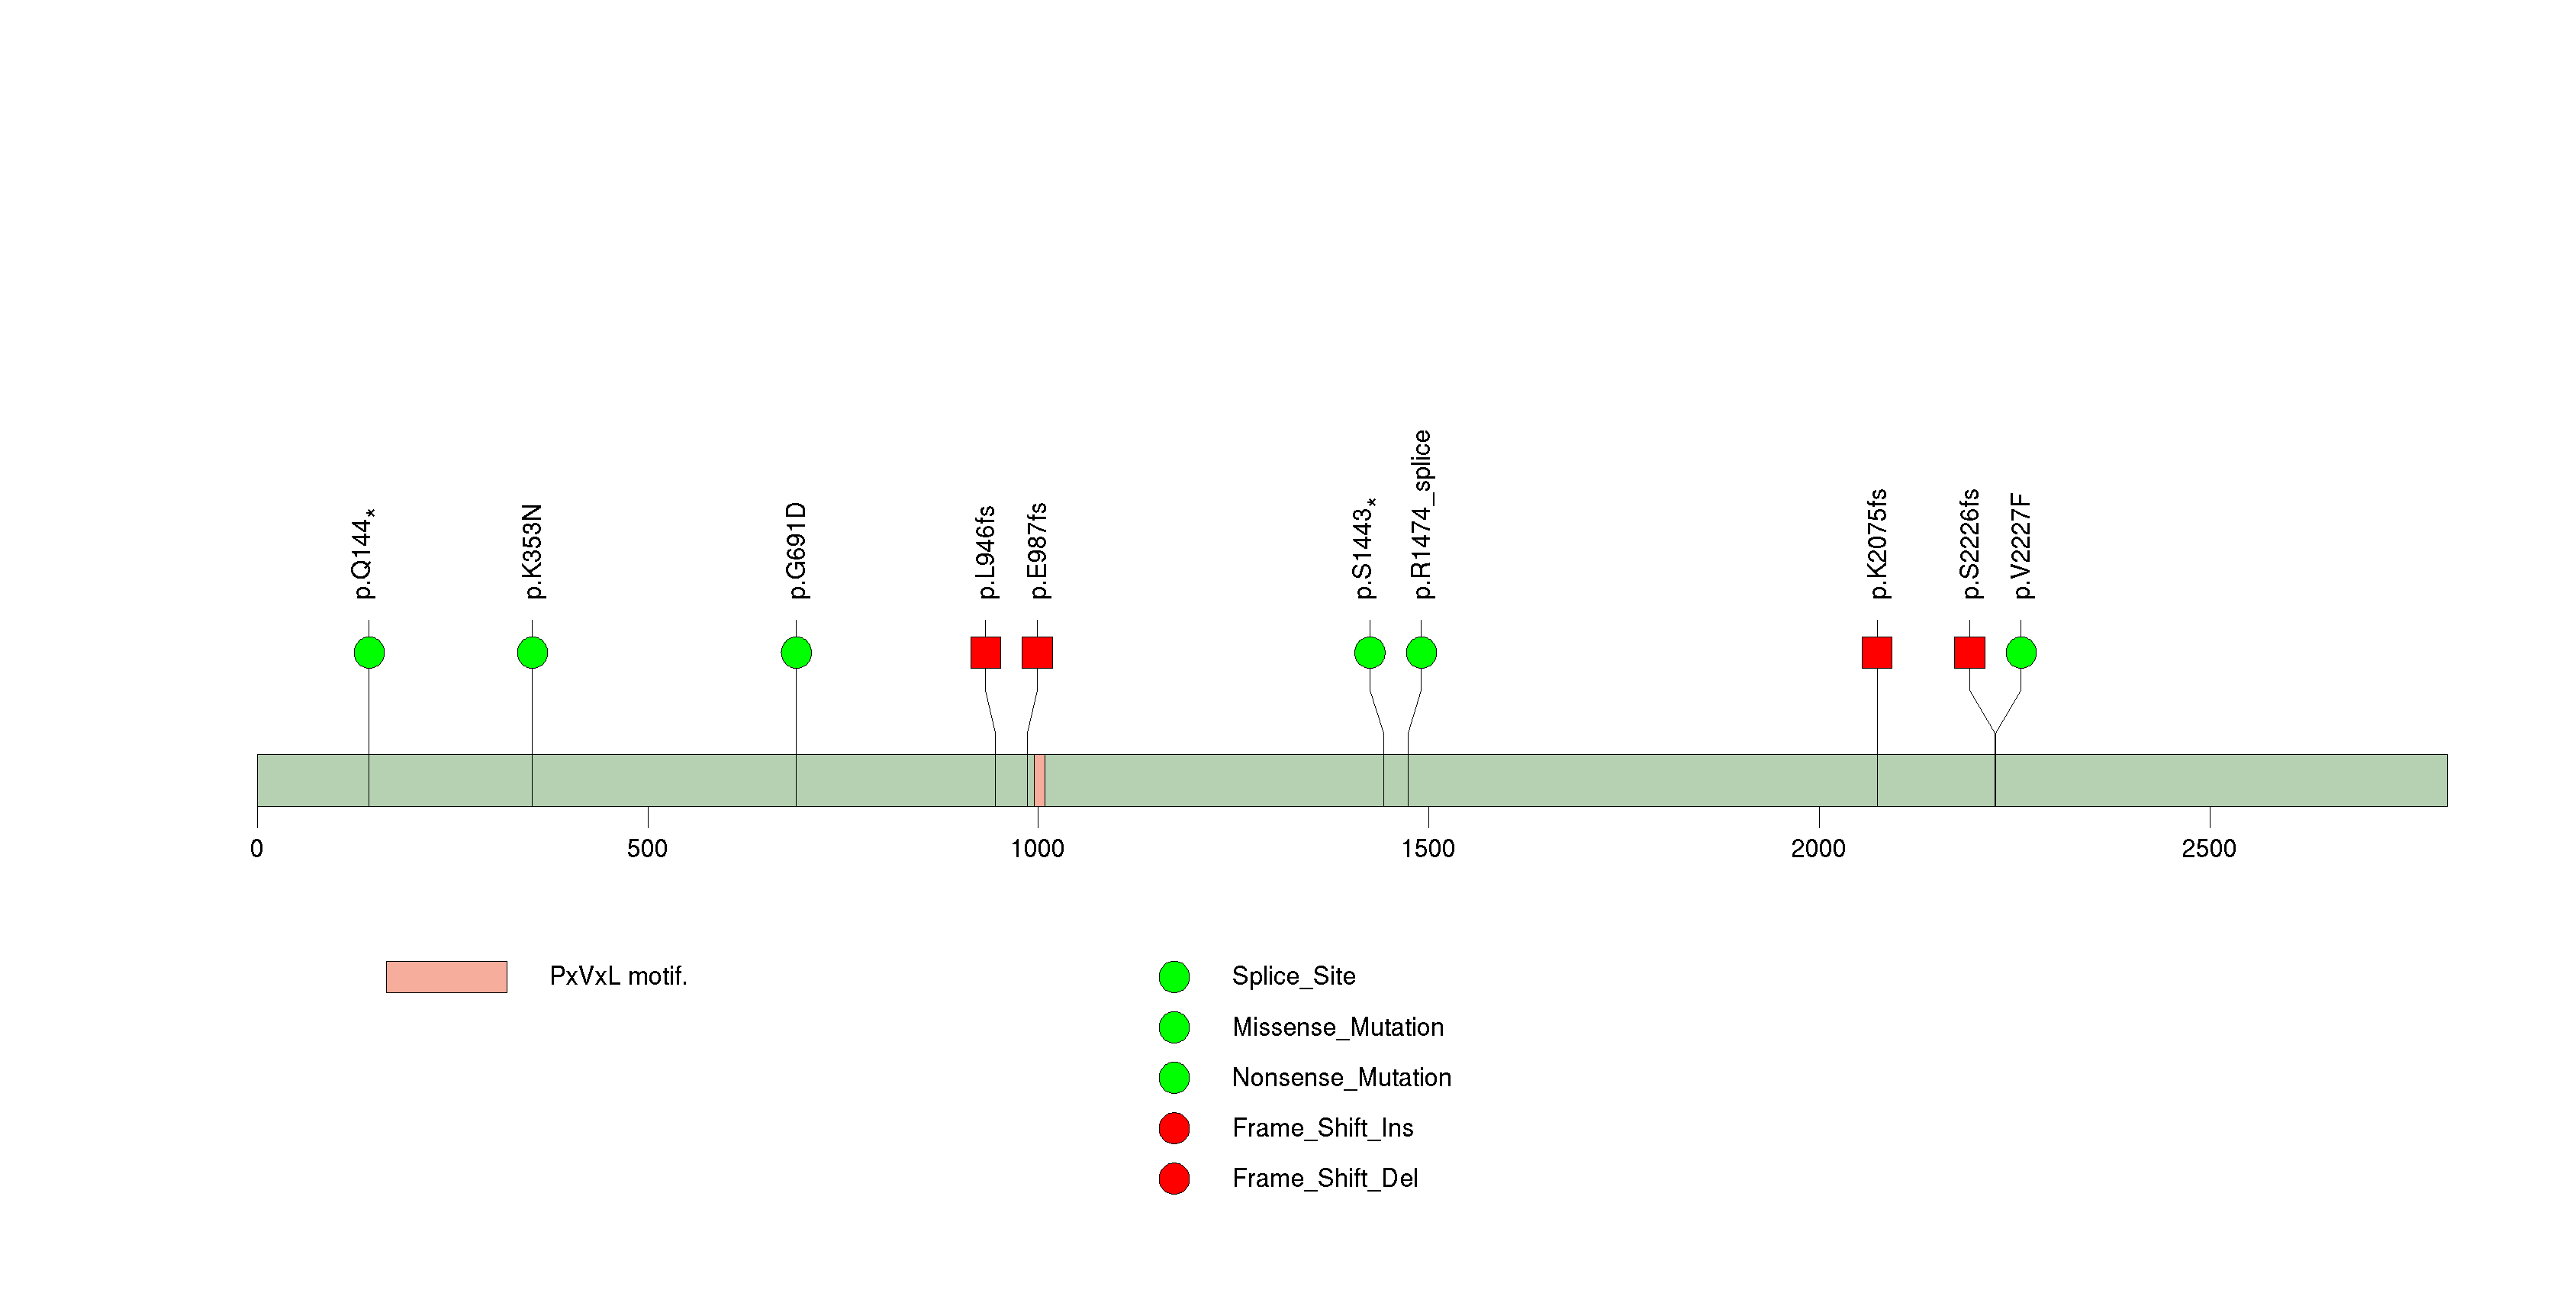
Figure S21. This figure depicts the distribution of mutations and mutation types across the MLL3 significant gene.
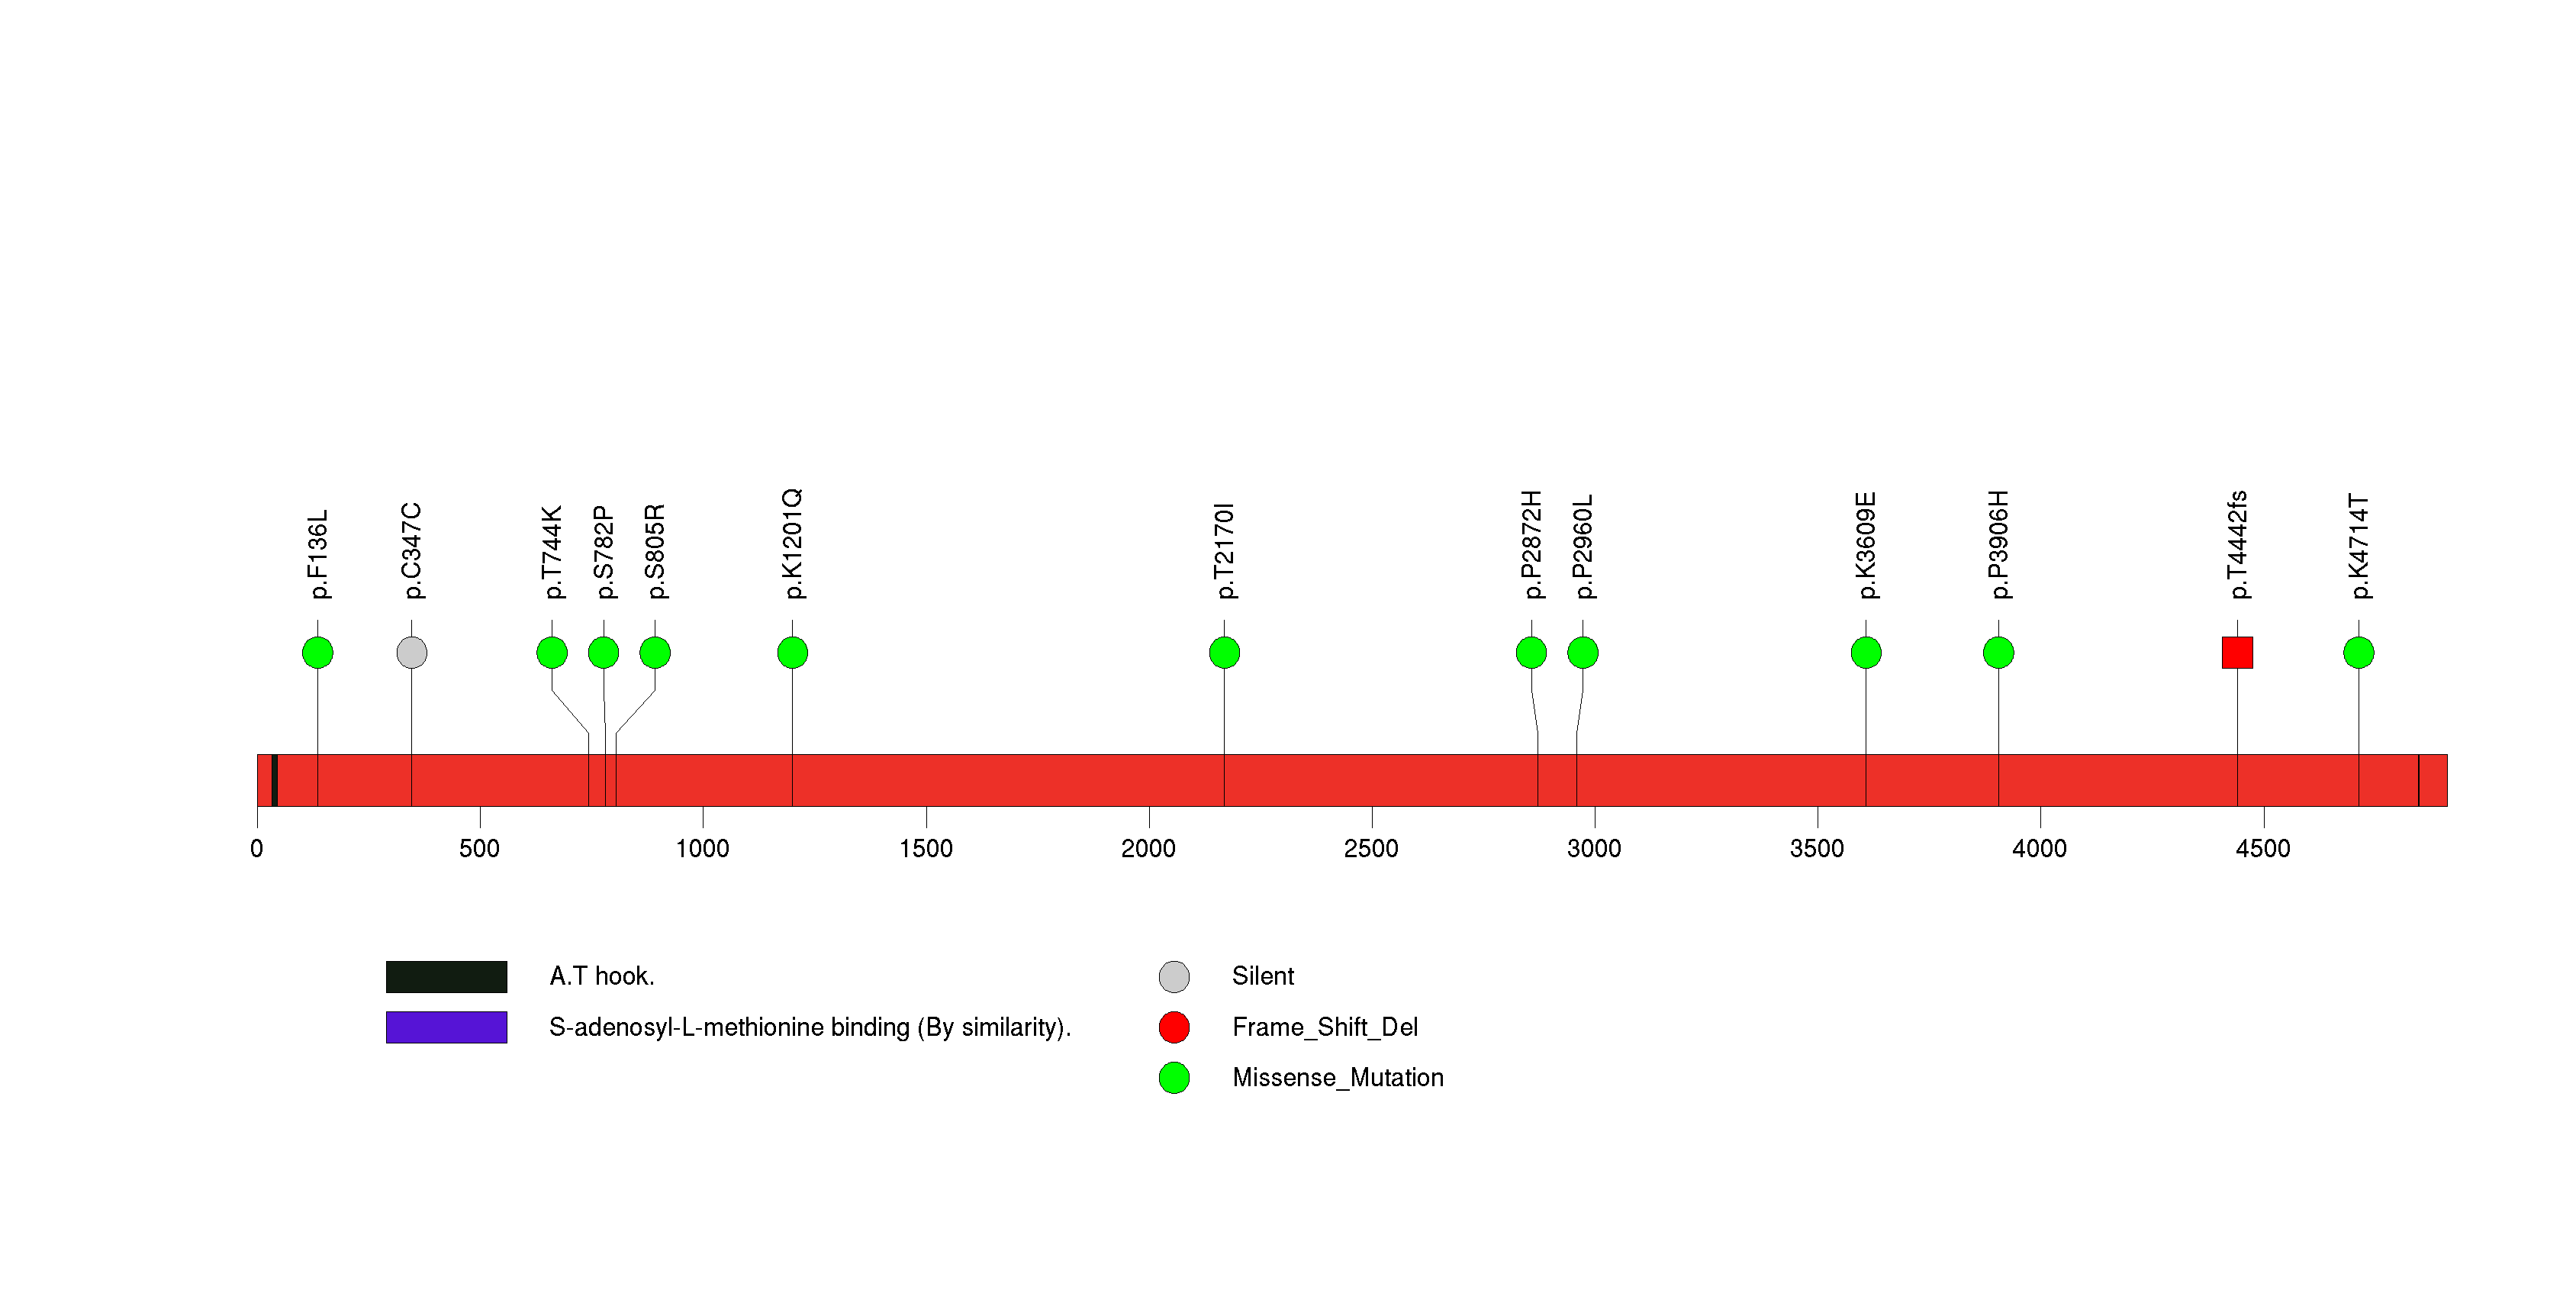
Figure S22. This figure depicts the distribution of mutations and mutation types across the HEATR5B significant gene.
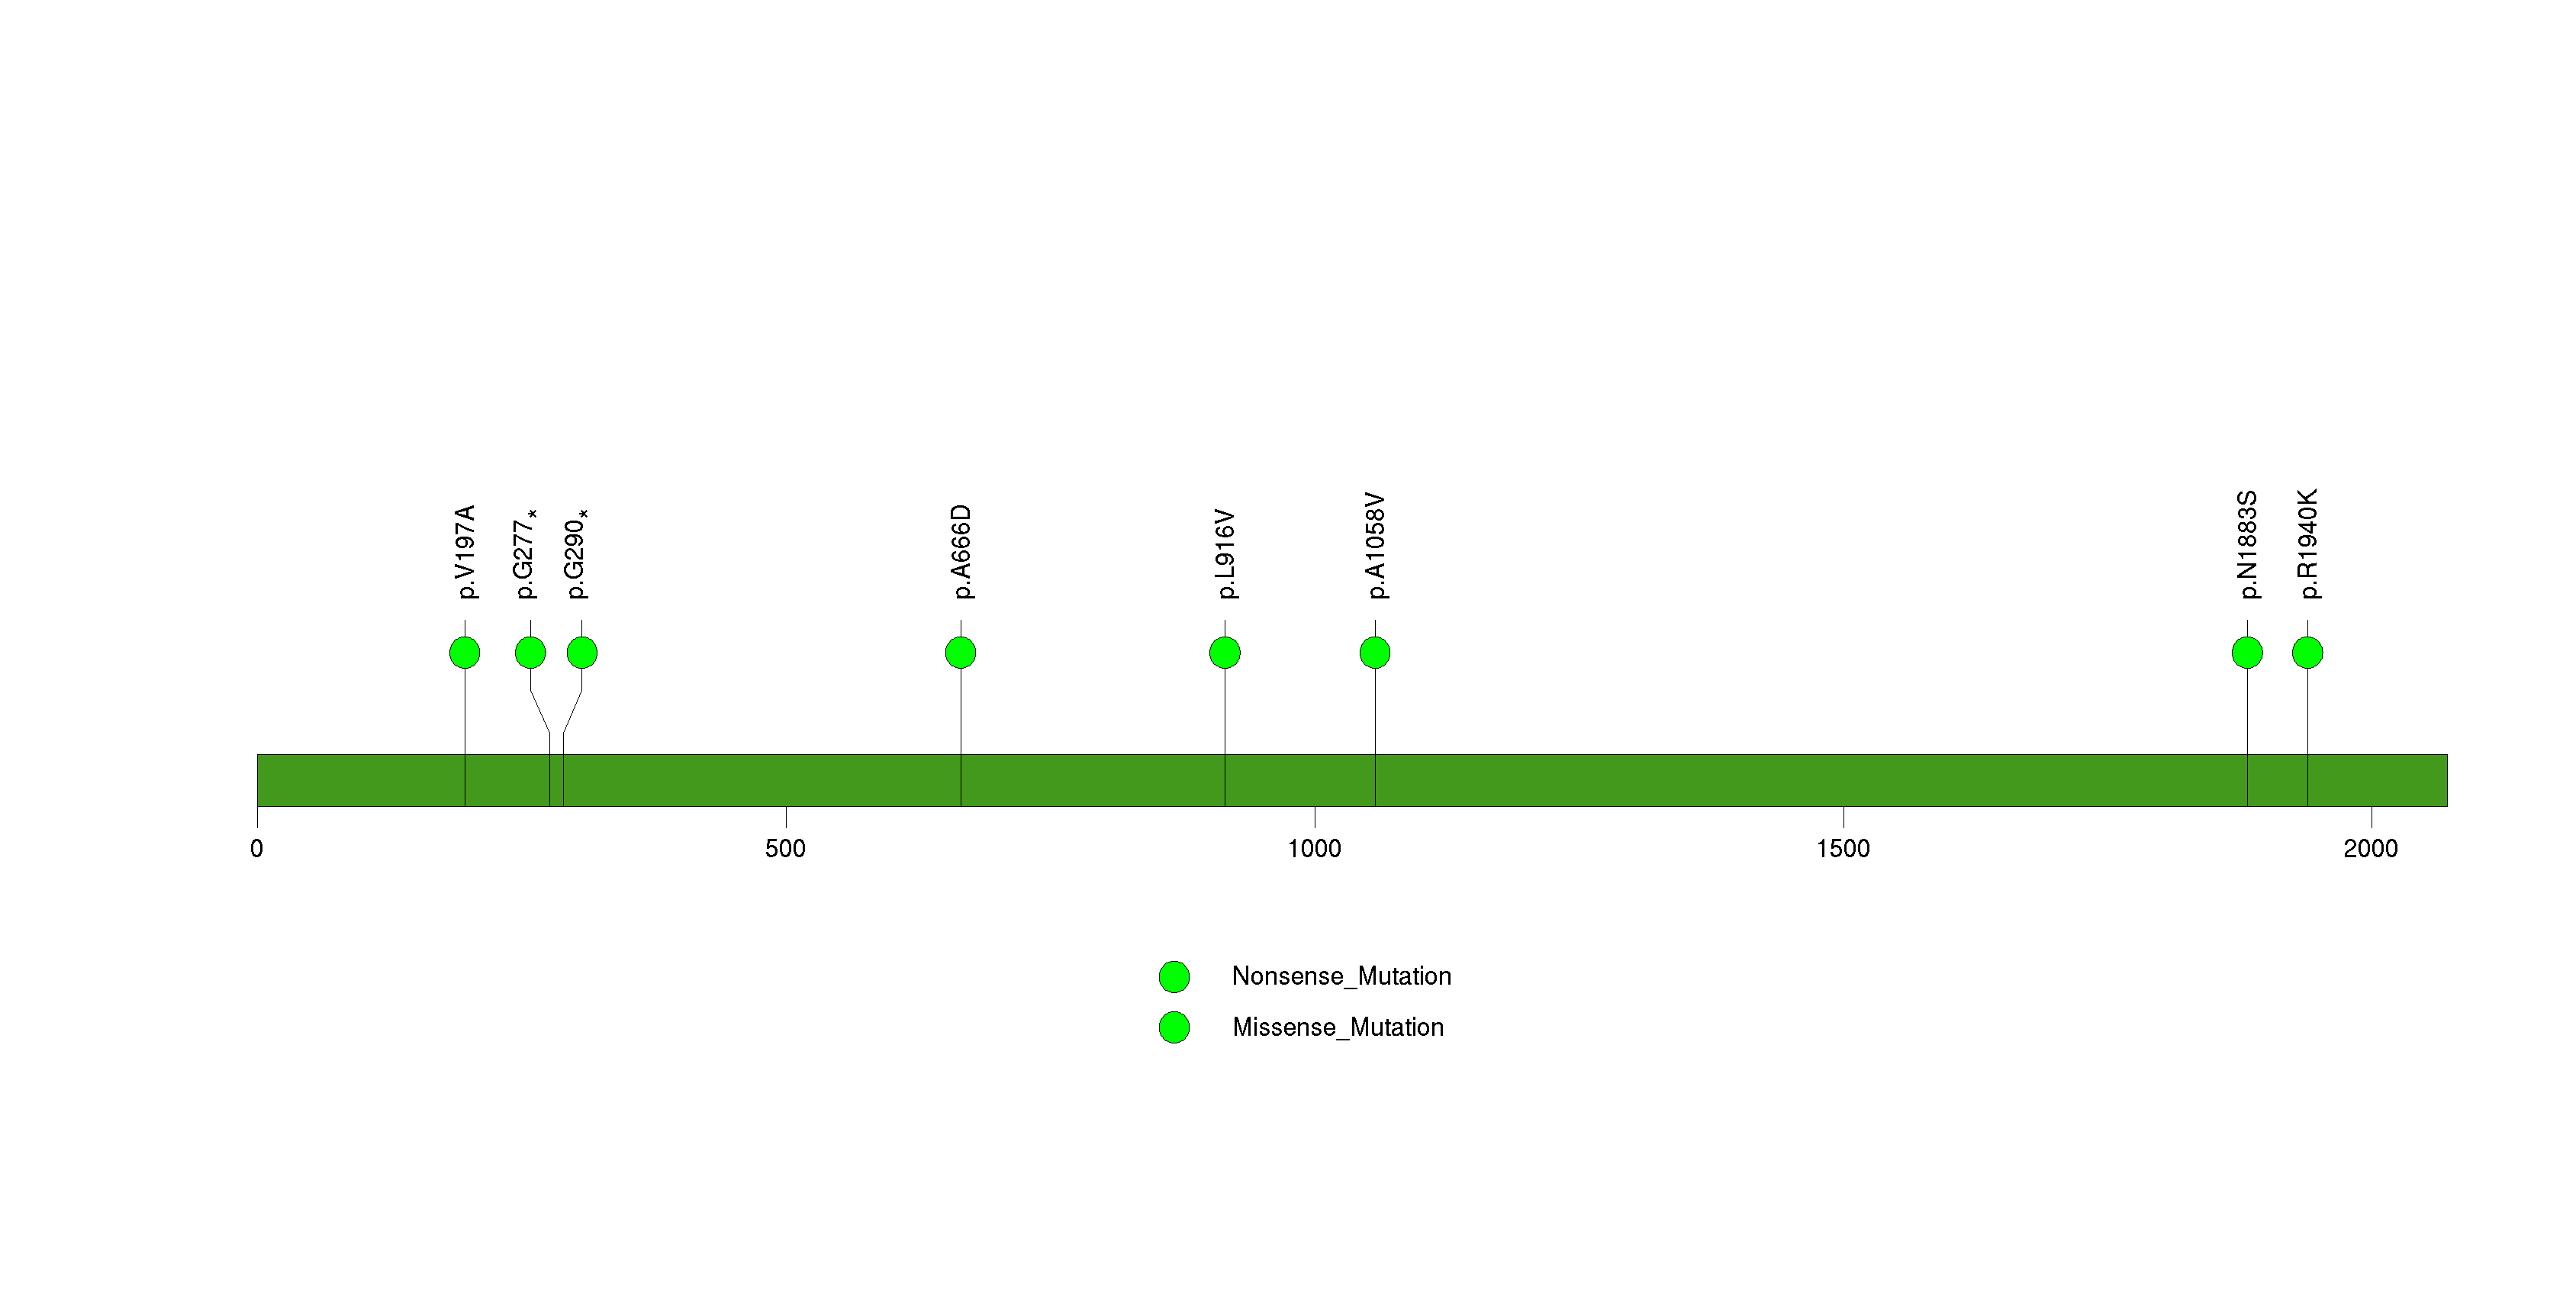
Figure S23. This figure depicts the distribution of mutations and mutation types across the DMXL1 significant gene.
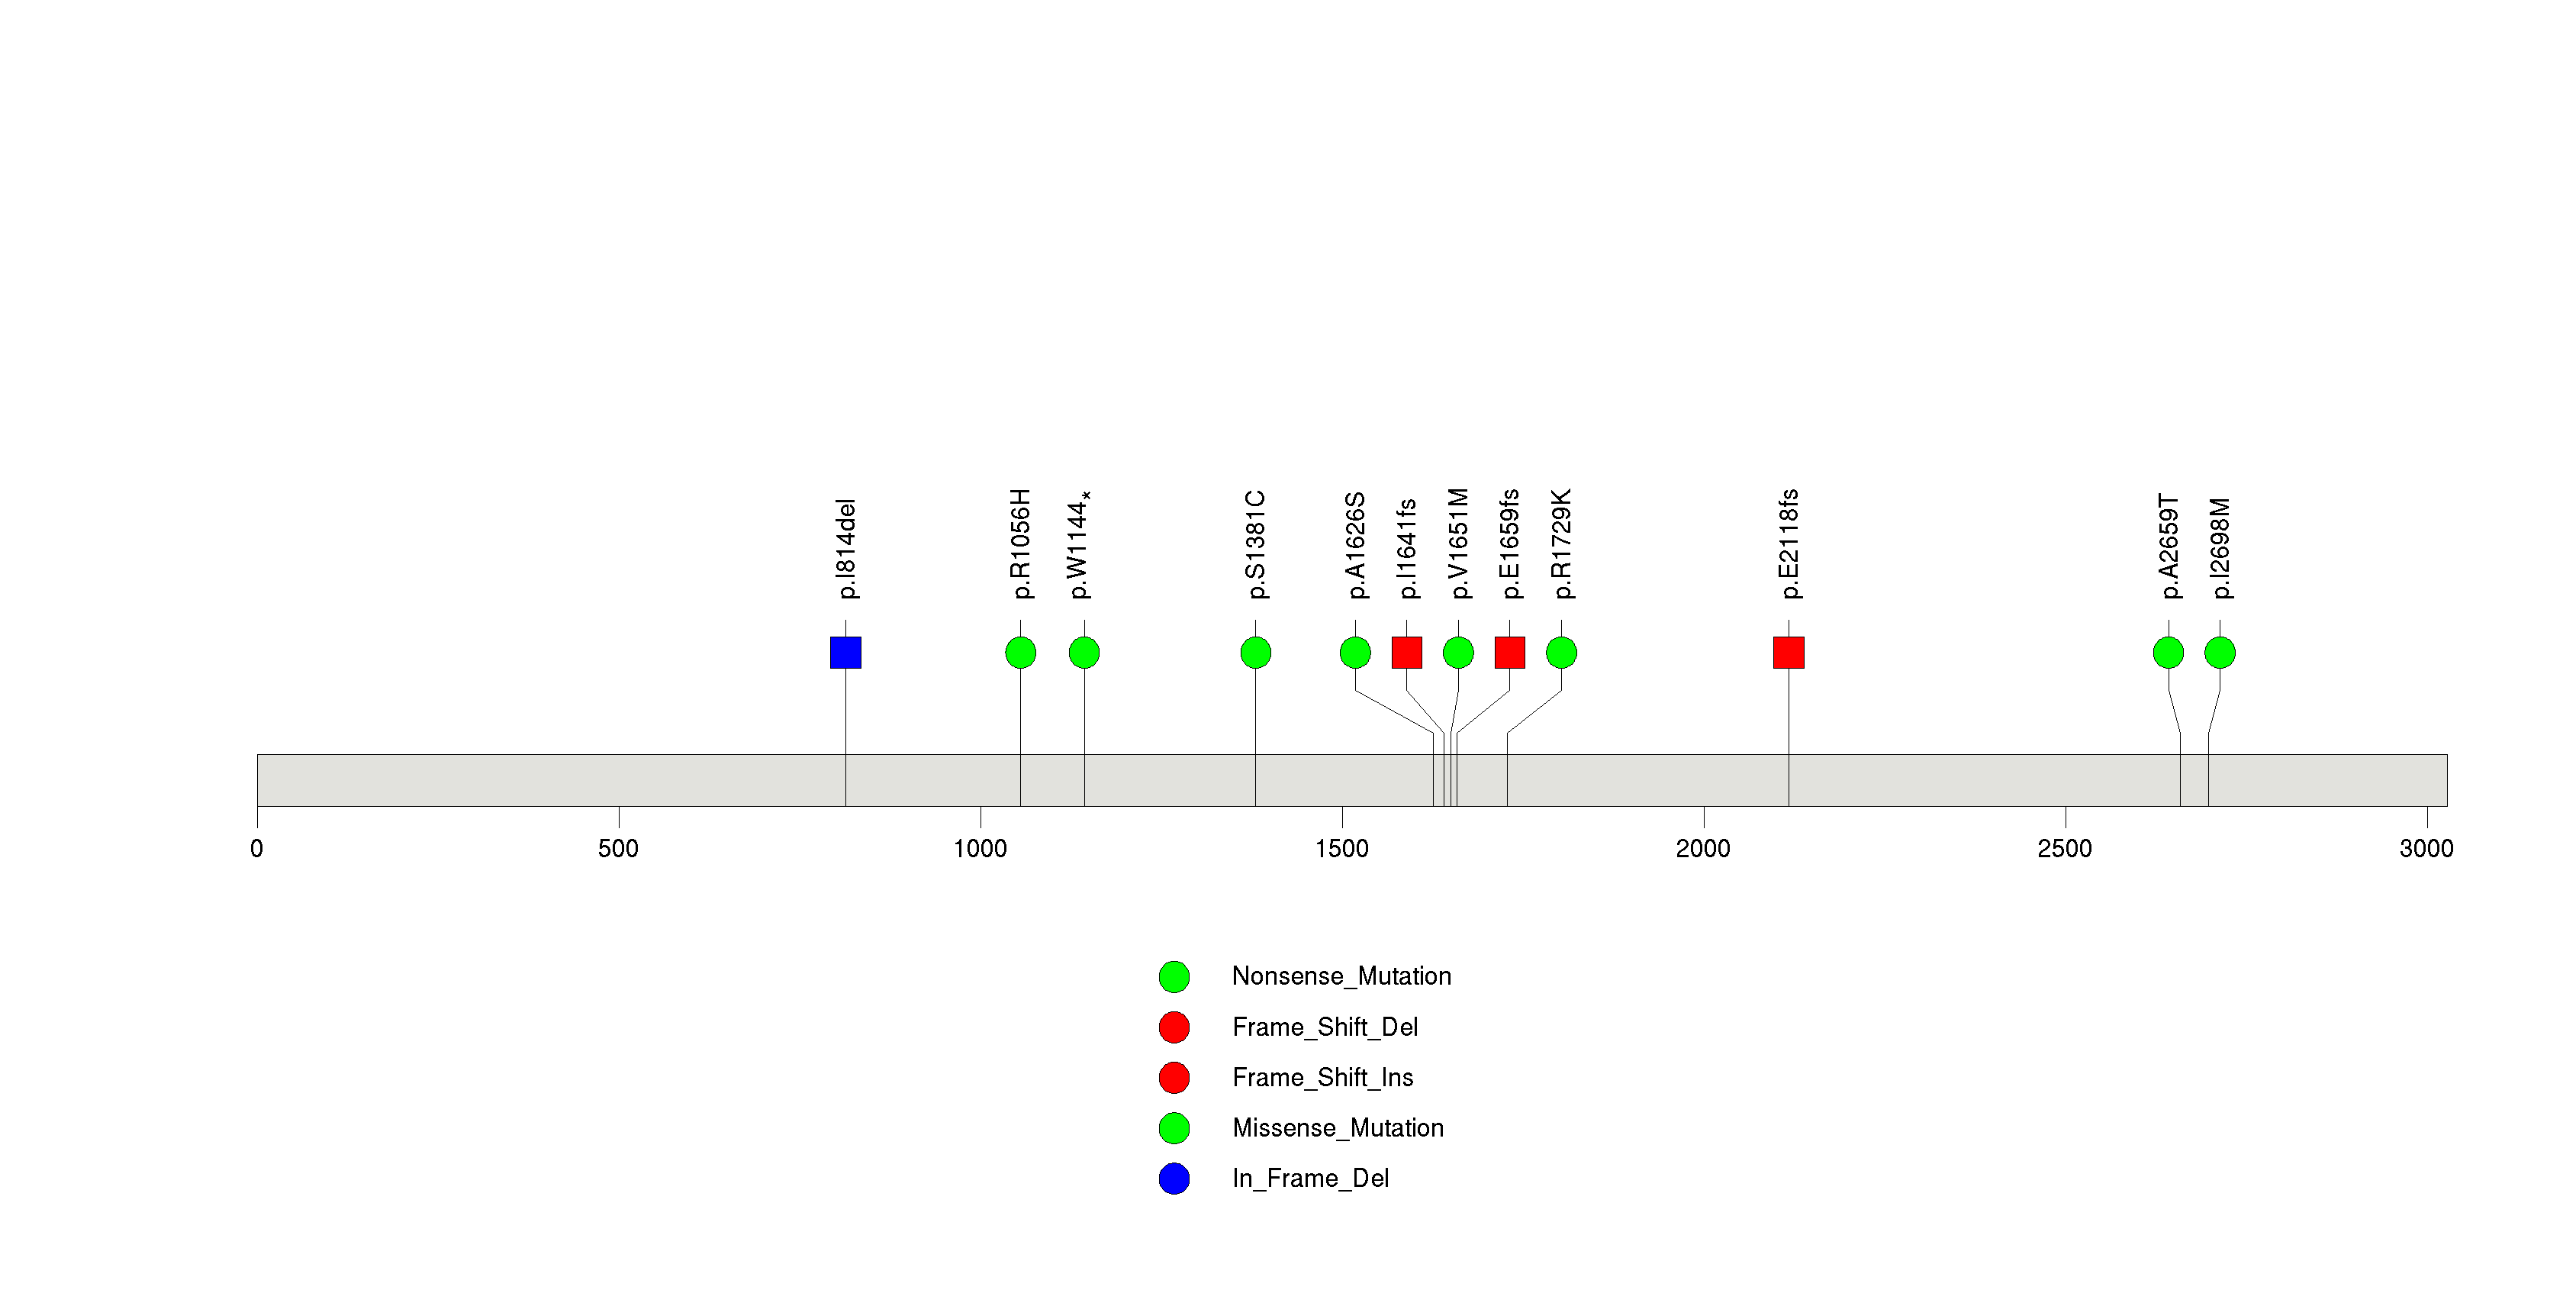
Figure S24. This figure depicts the distribution of mutations and mutation types across the ZNF318 significant gene.
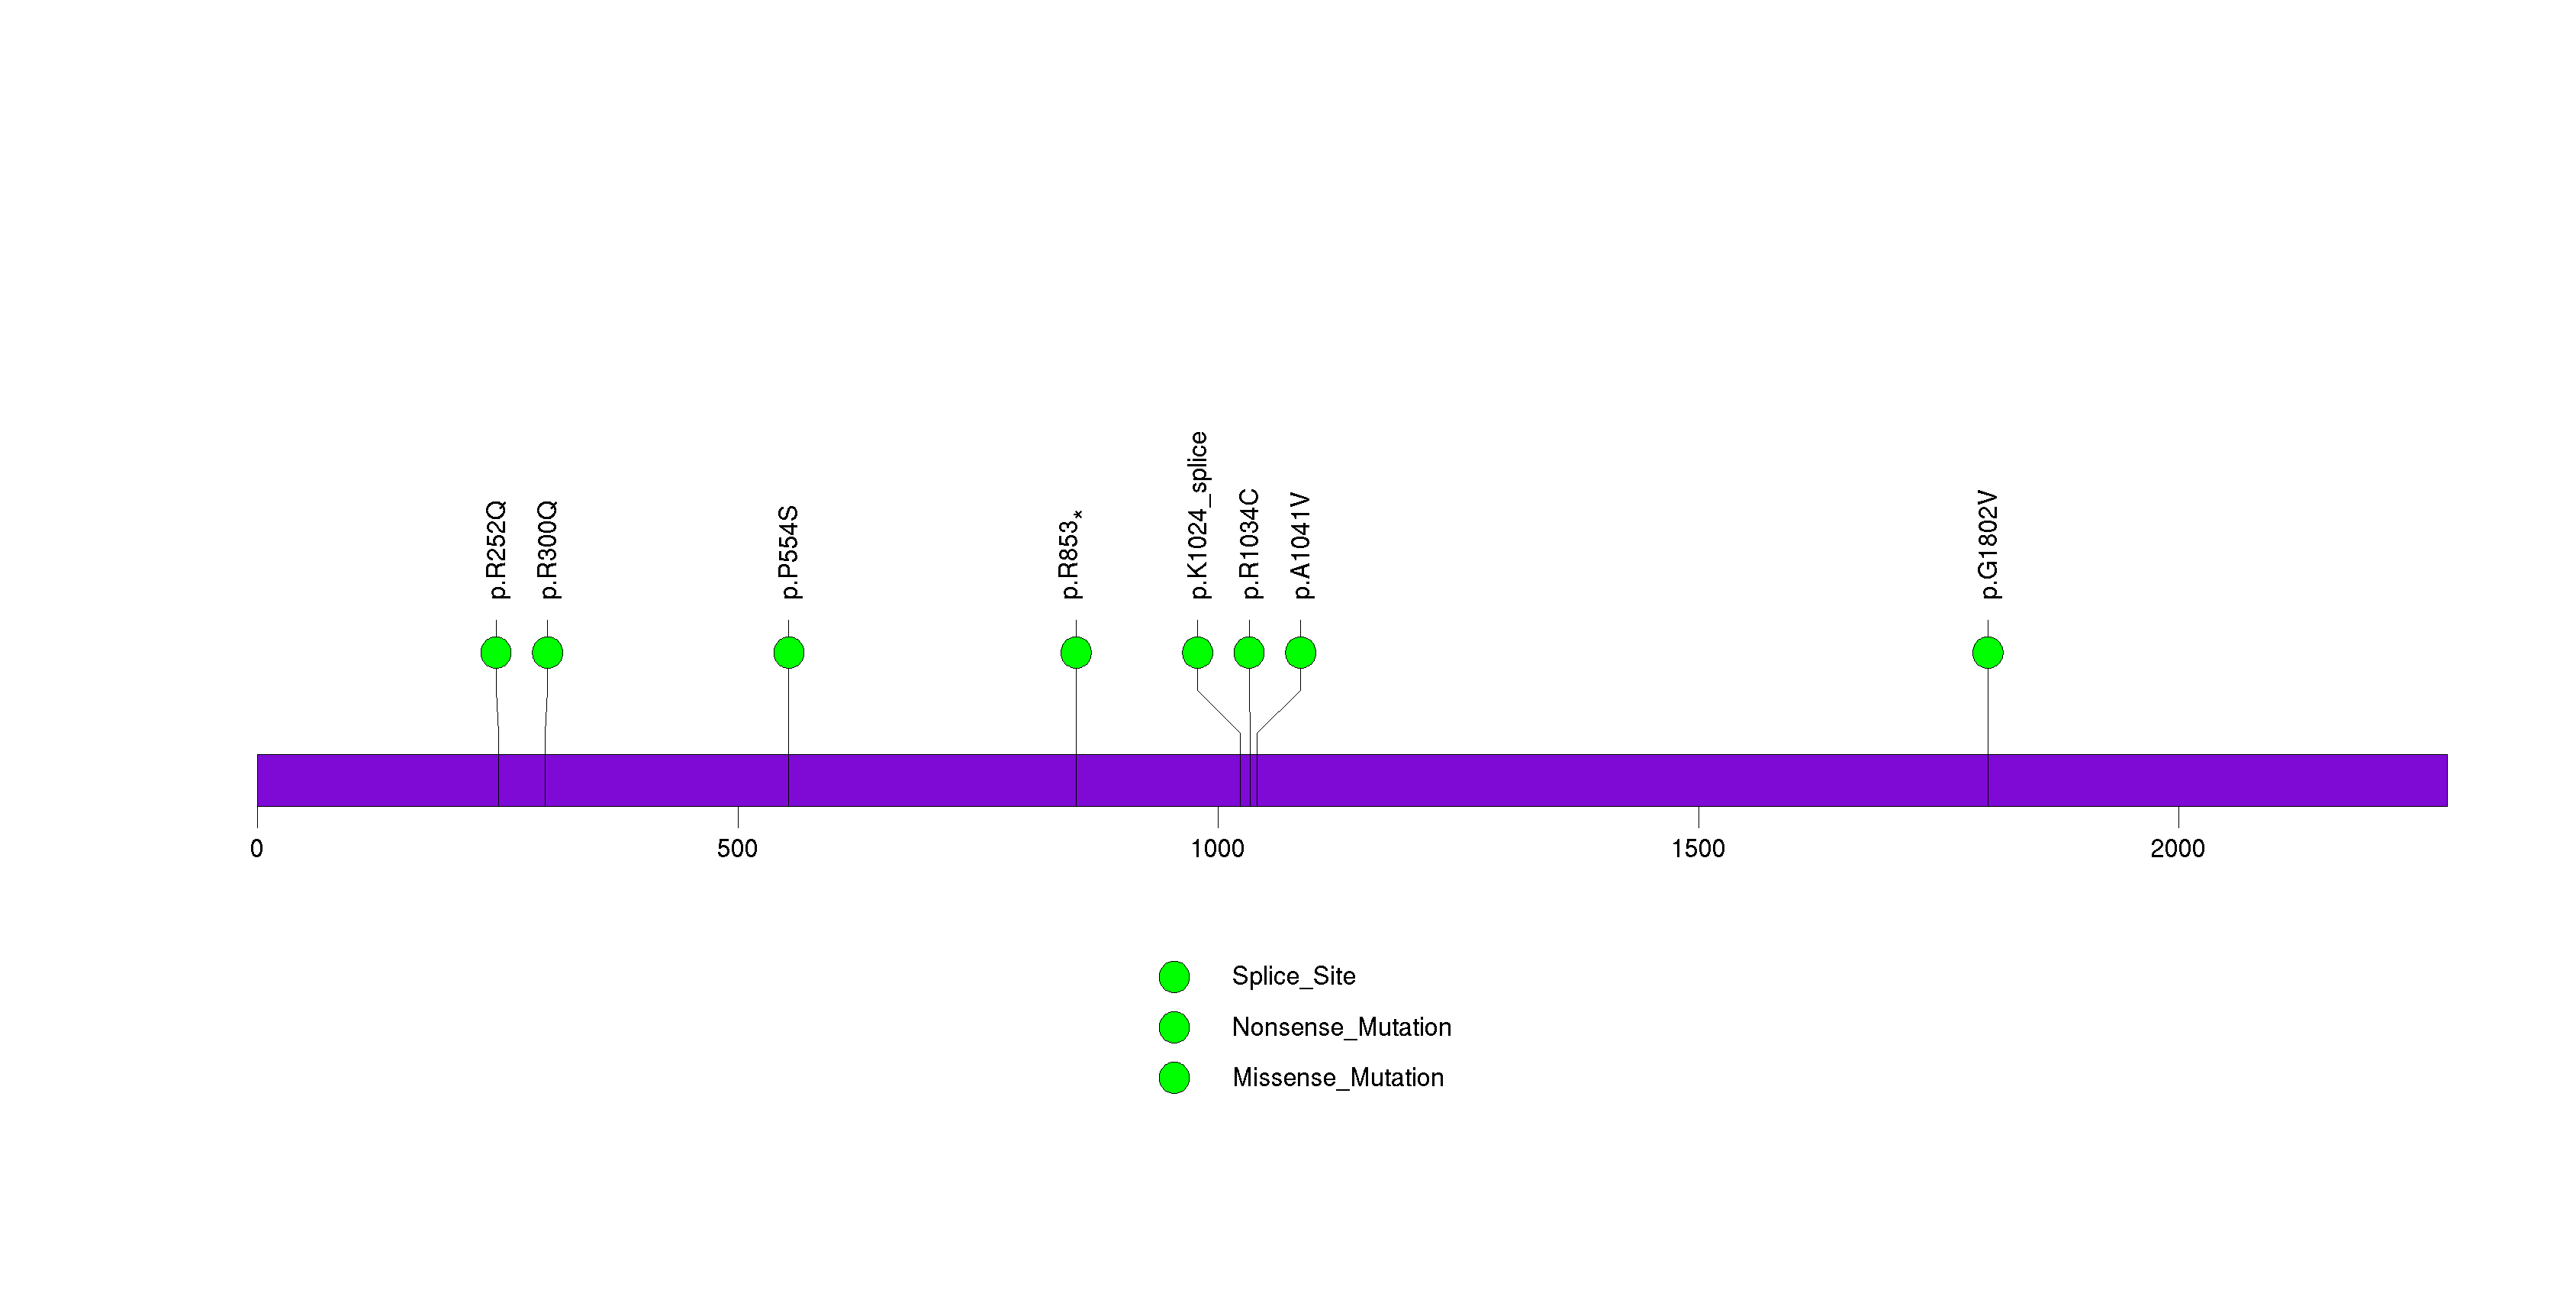
Figure S25. This figure depicts the distribution of mutations and mutation types across the MCCC2 significant gene.
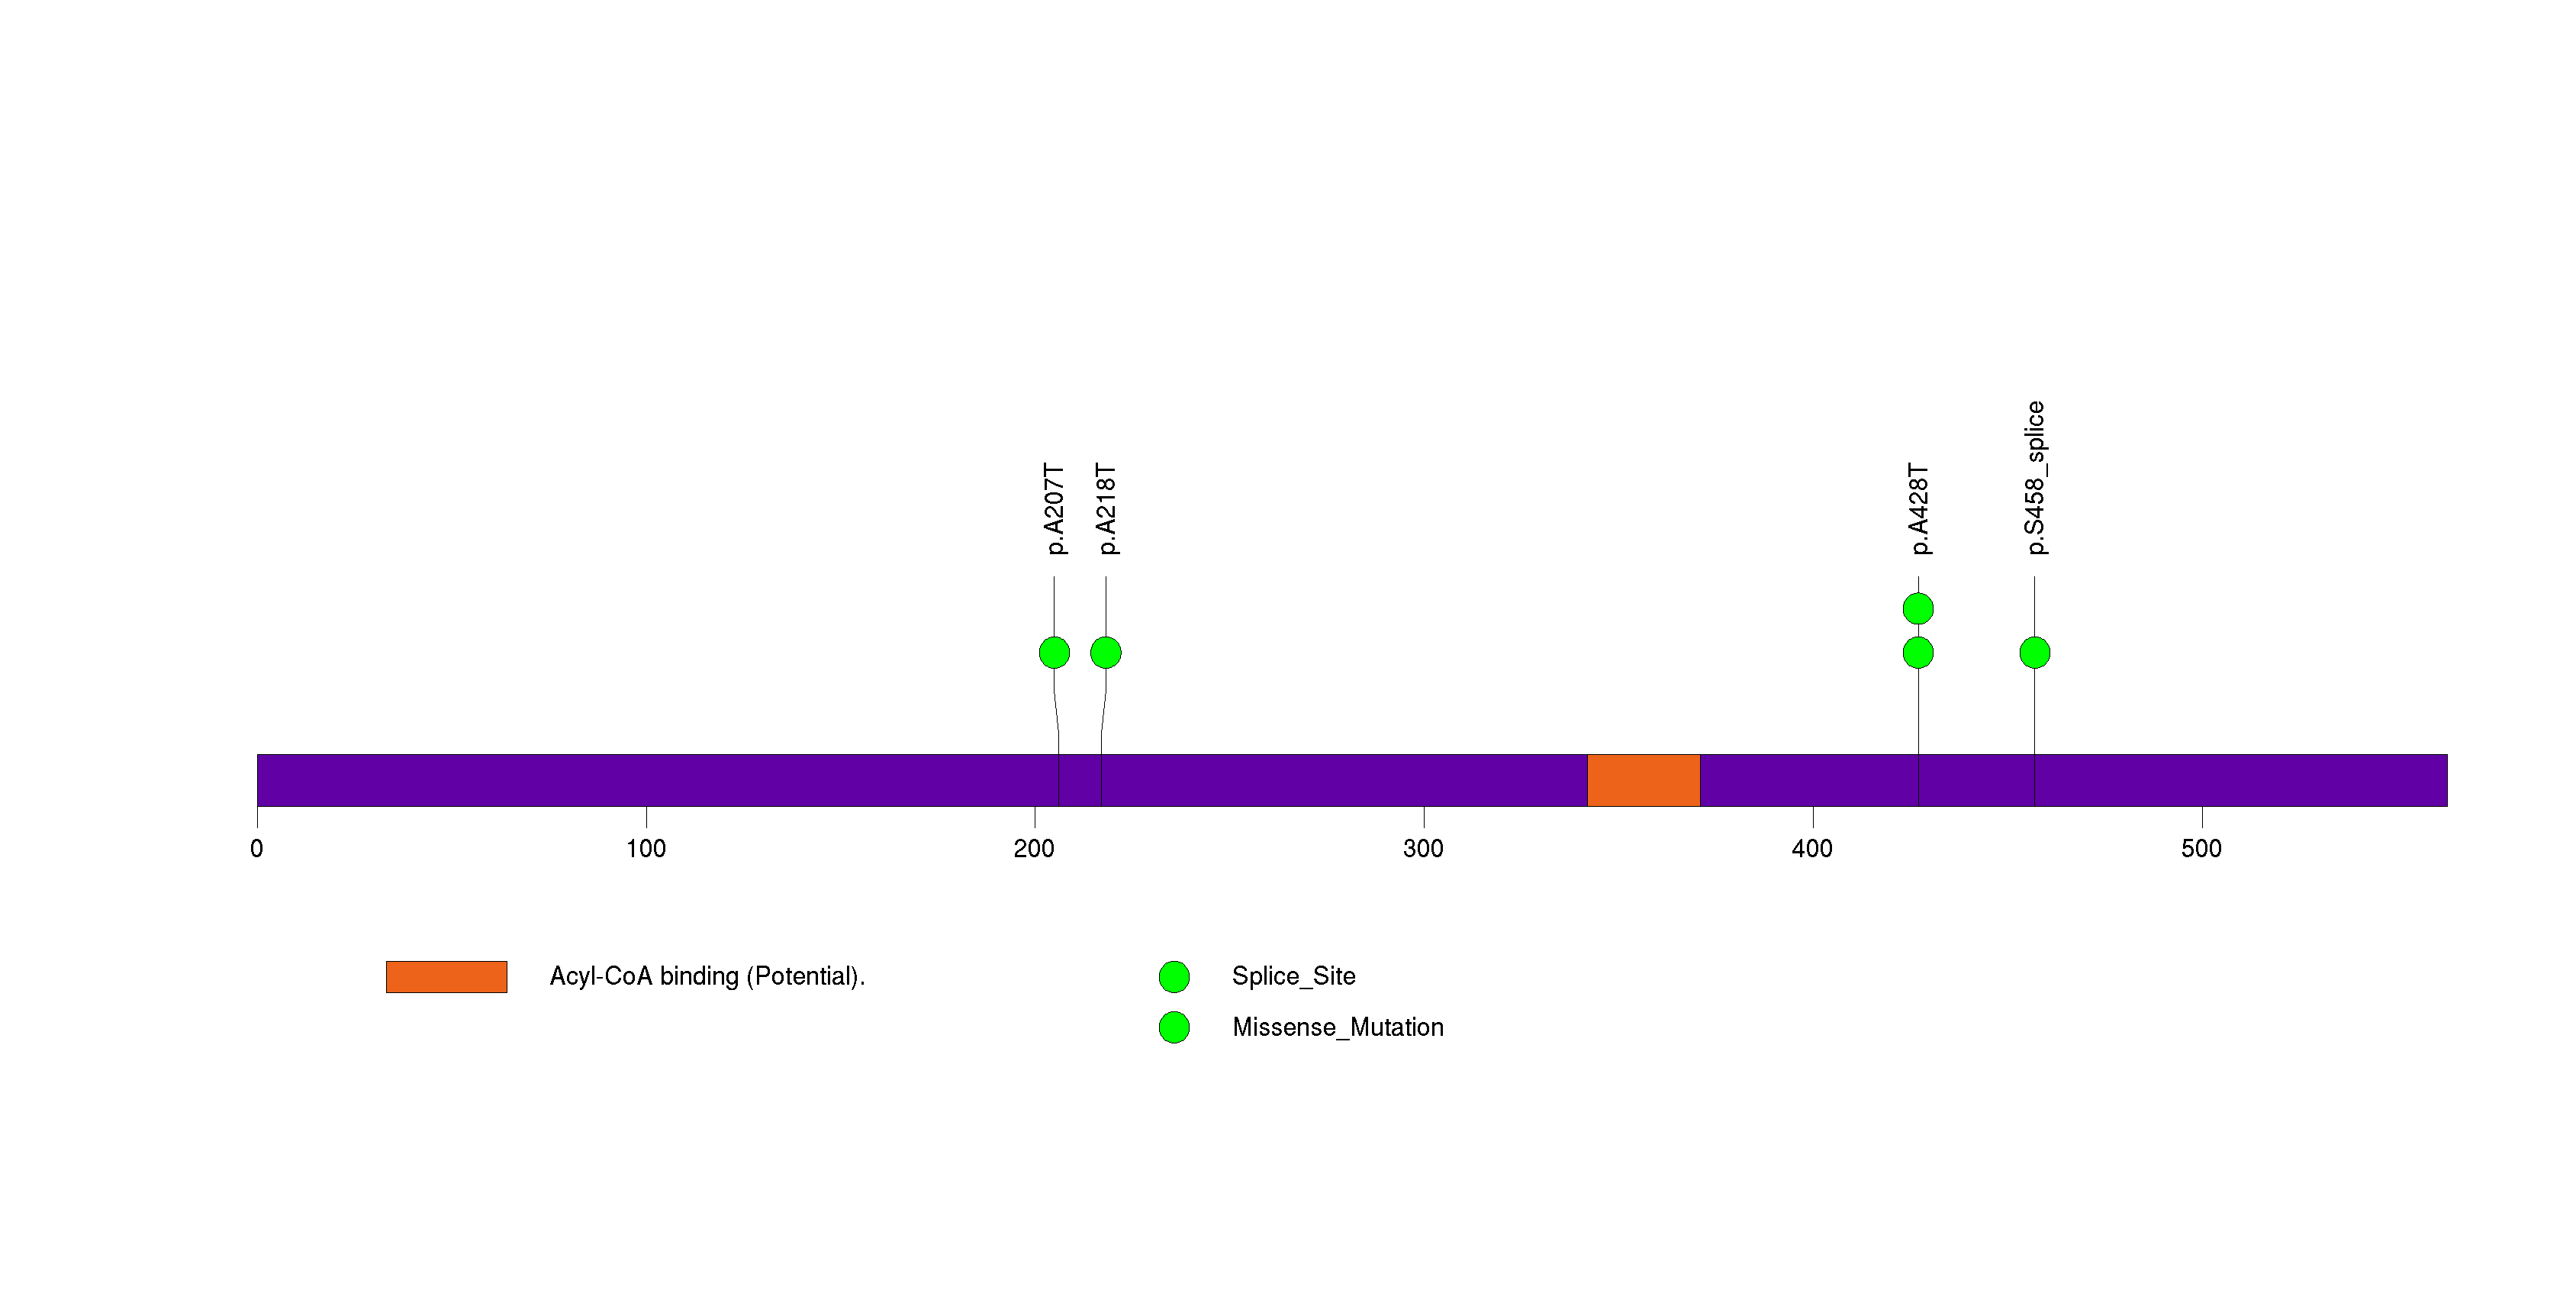
Figure S26. This figure depicts the distribution of mutations and mutation types across the C2orf71 significant gene.
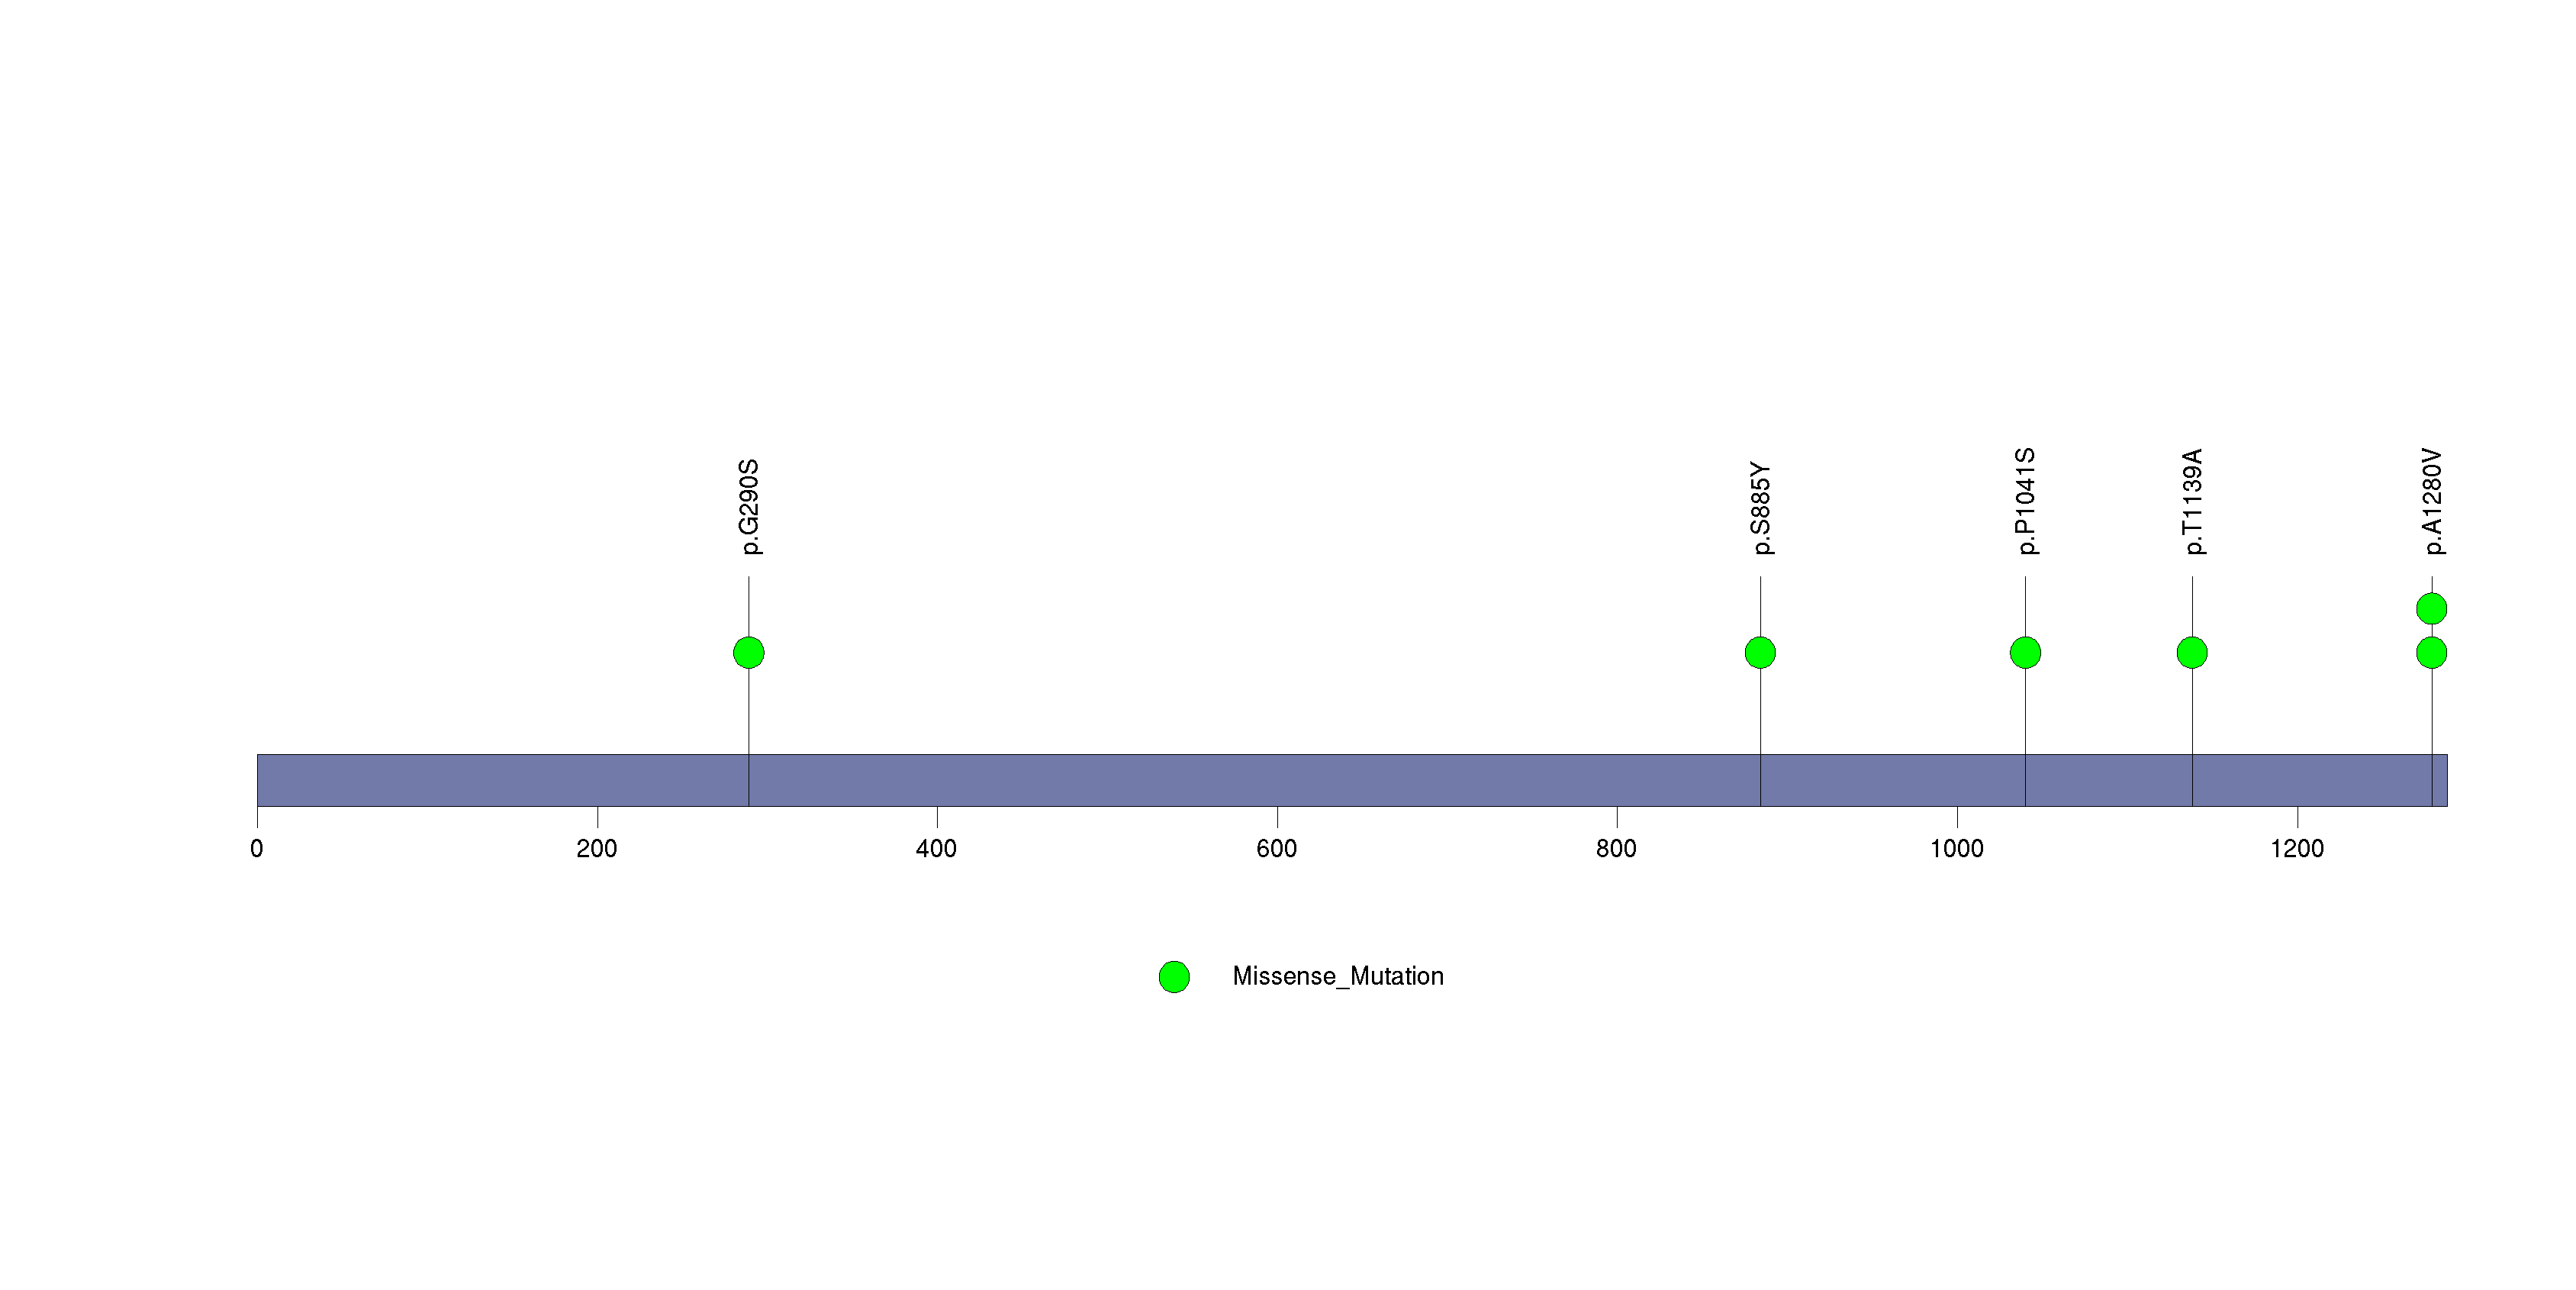
Figure S27. This figure depicts the distribution of mutations and mutation types across the SLTM significant gene.
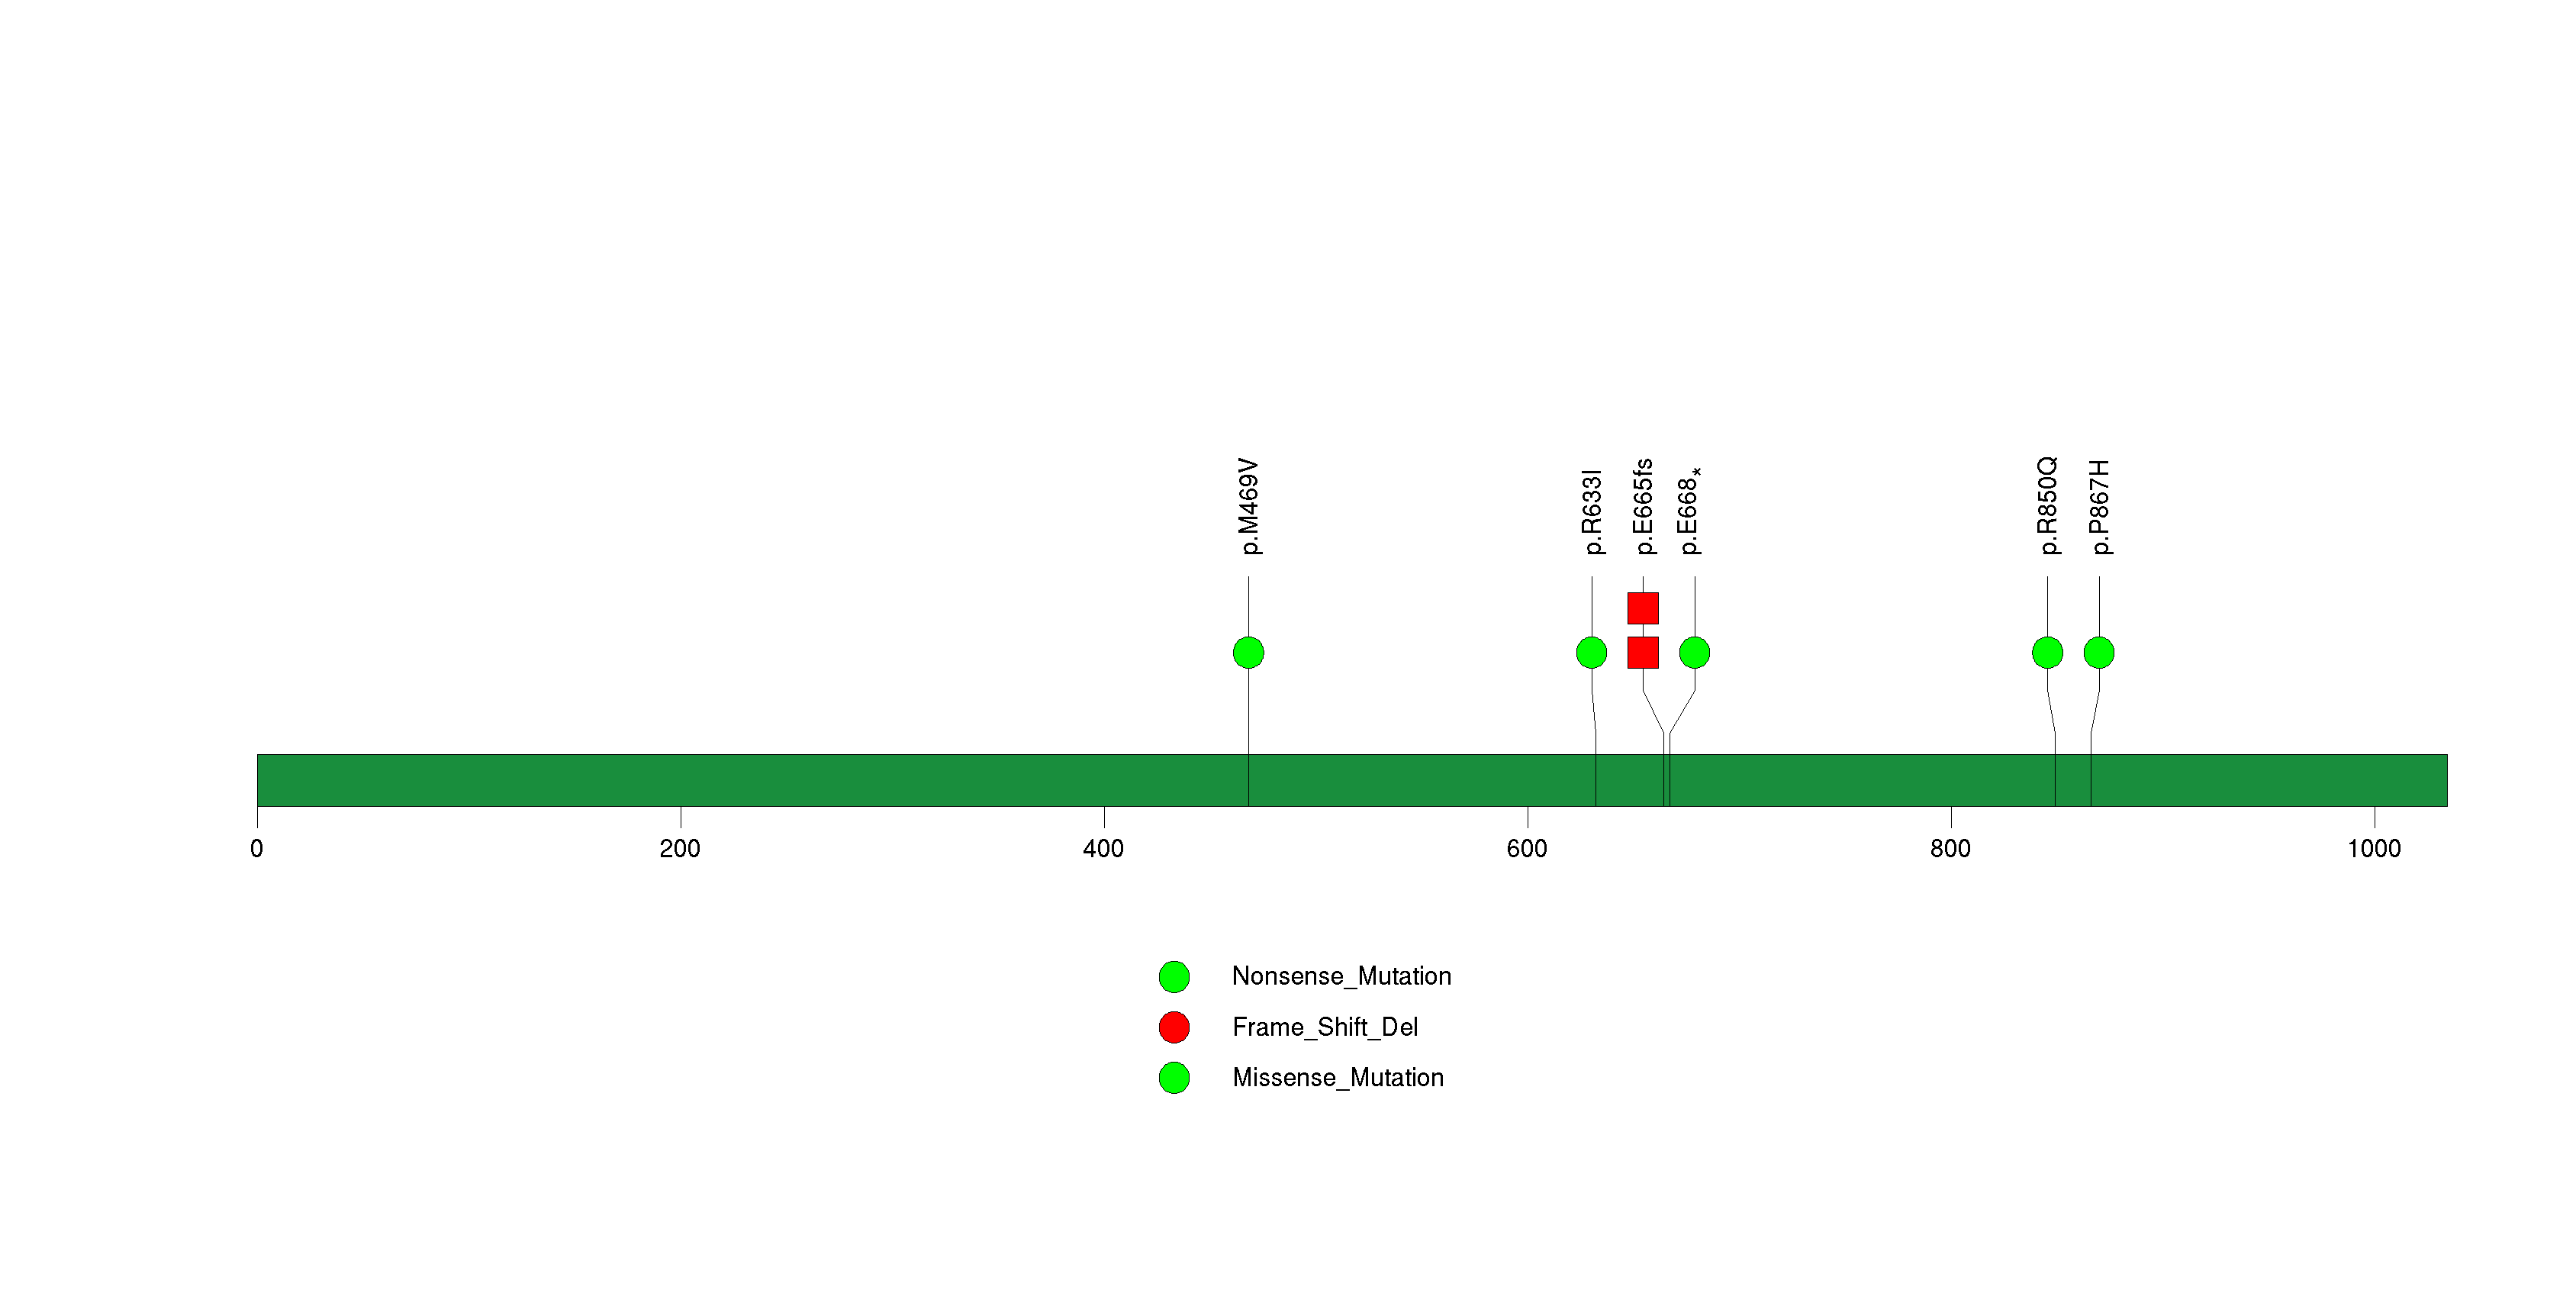
Figure S28. This figure depicts the distribution of mutations and mutation types across the IQGAP1 significant gene.
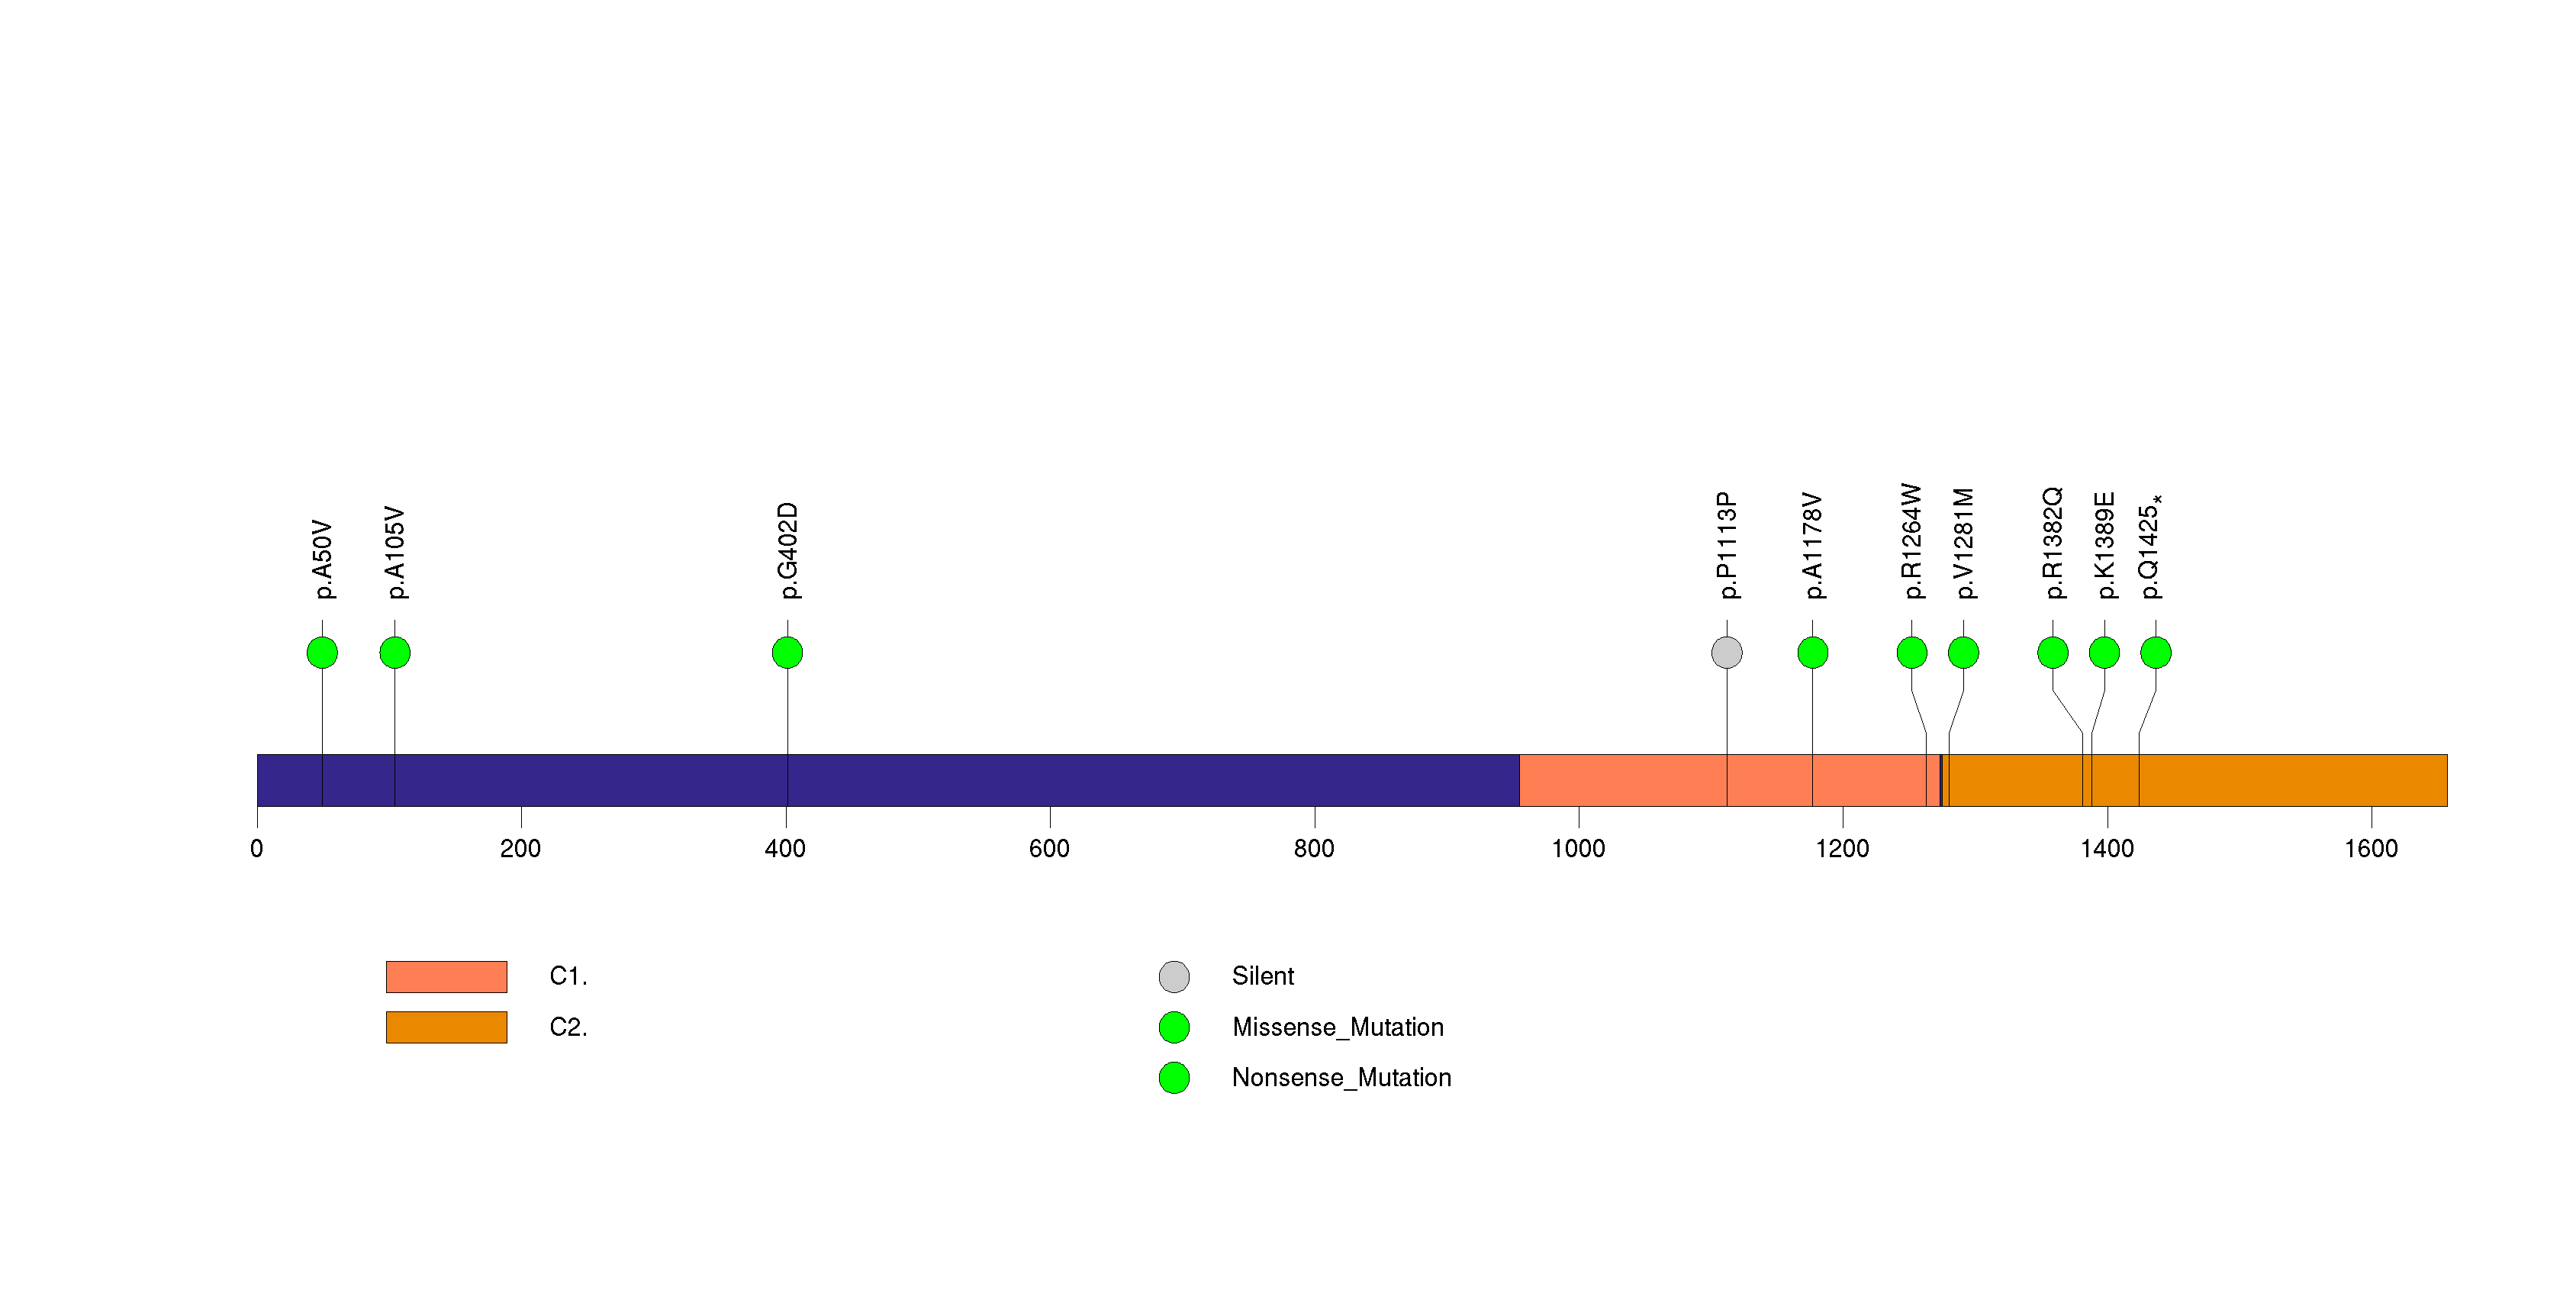
Figure S29. This figure depicts the distribution of mutations and mutation types across the ZNF57 significant gene.
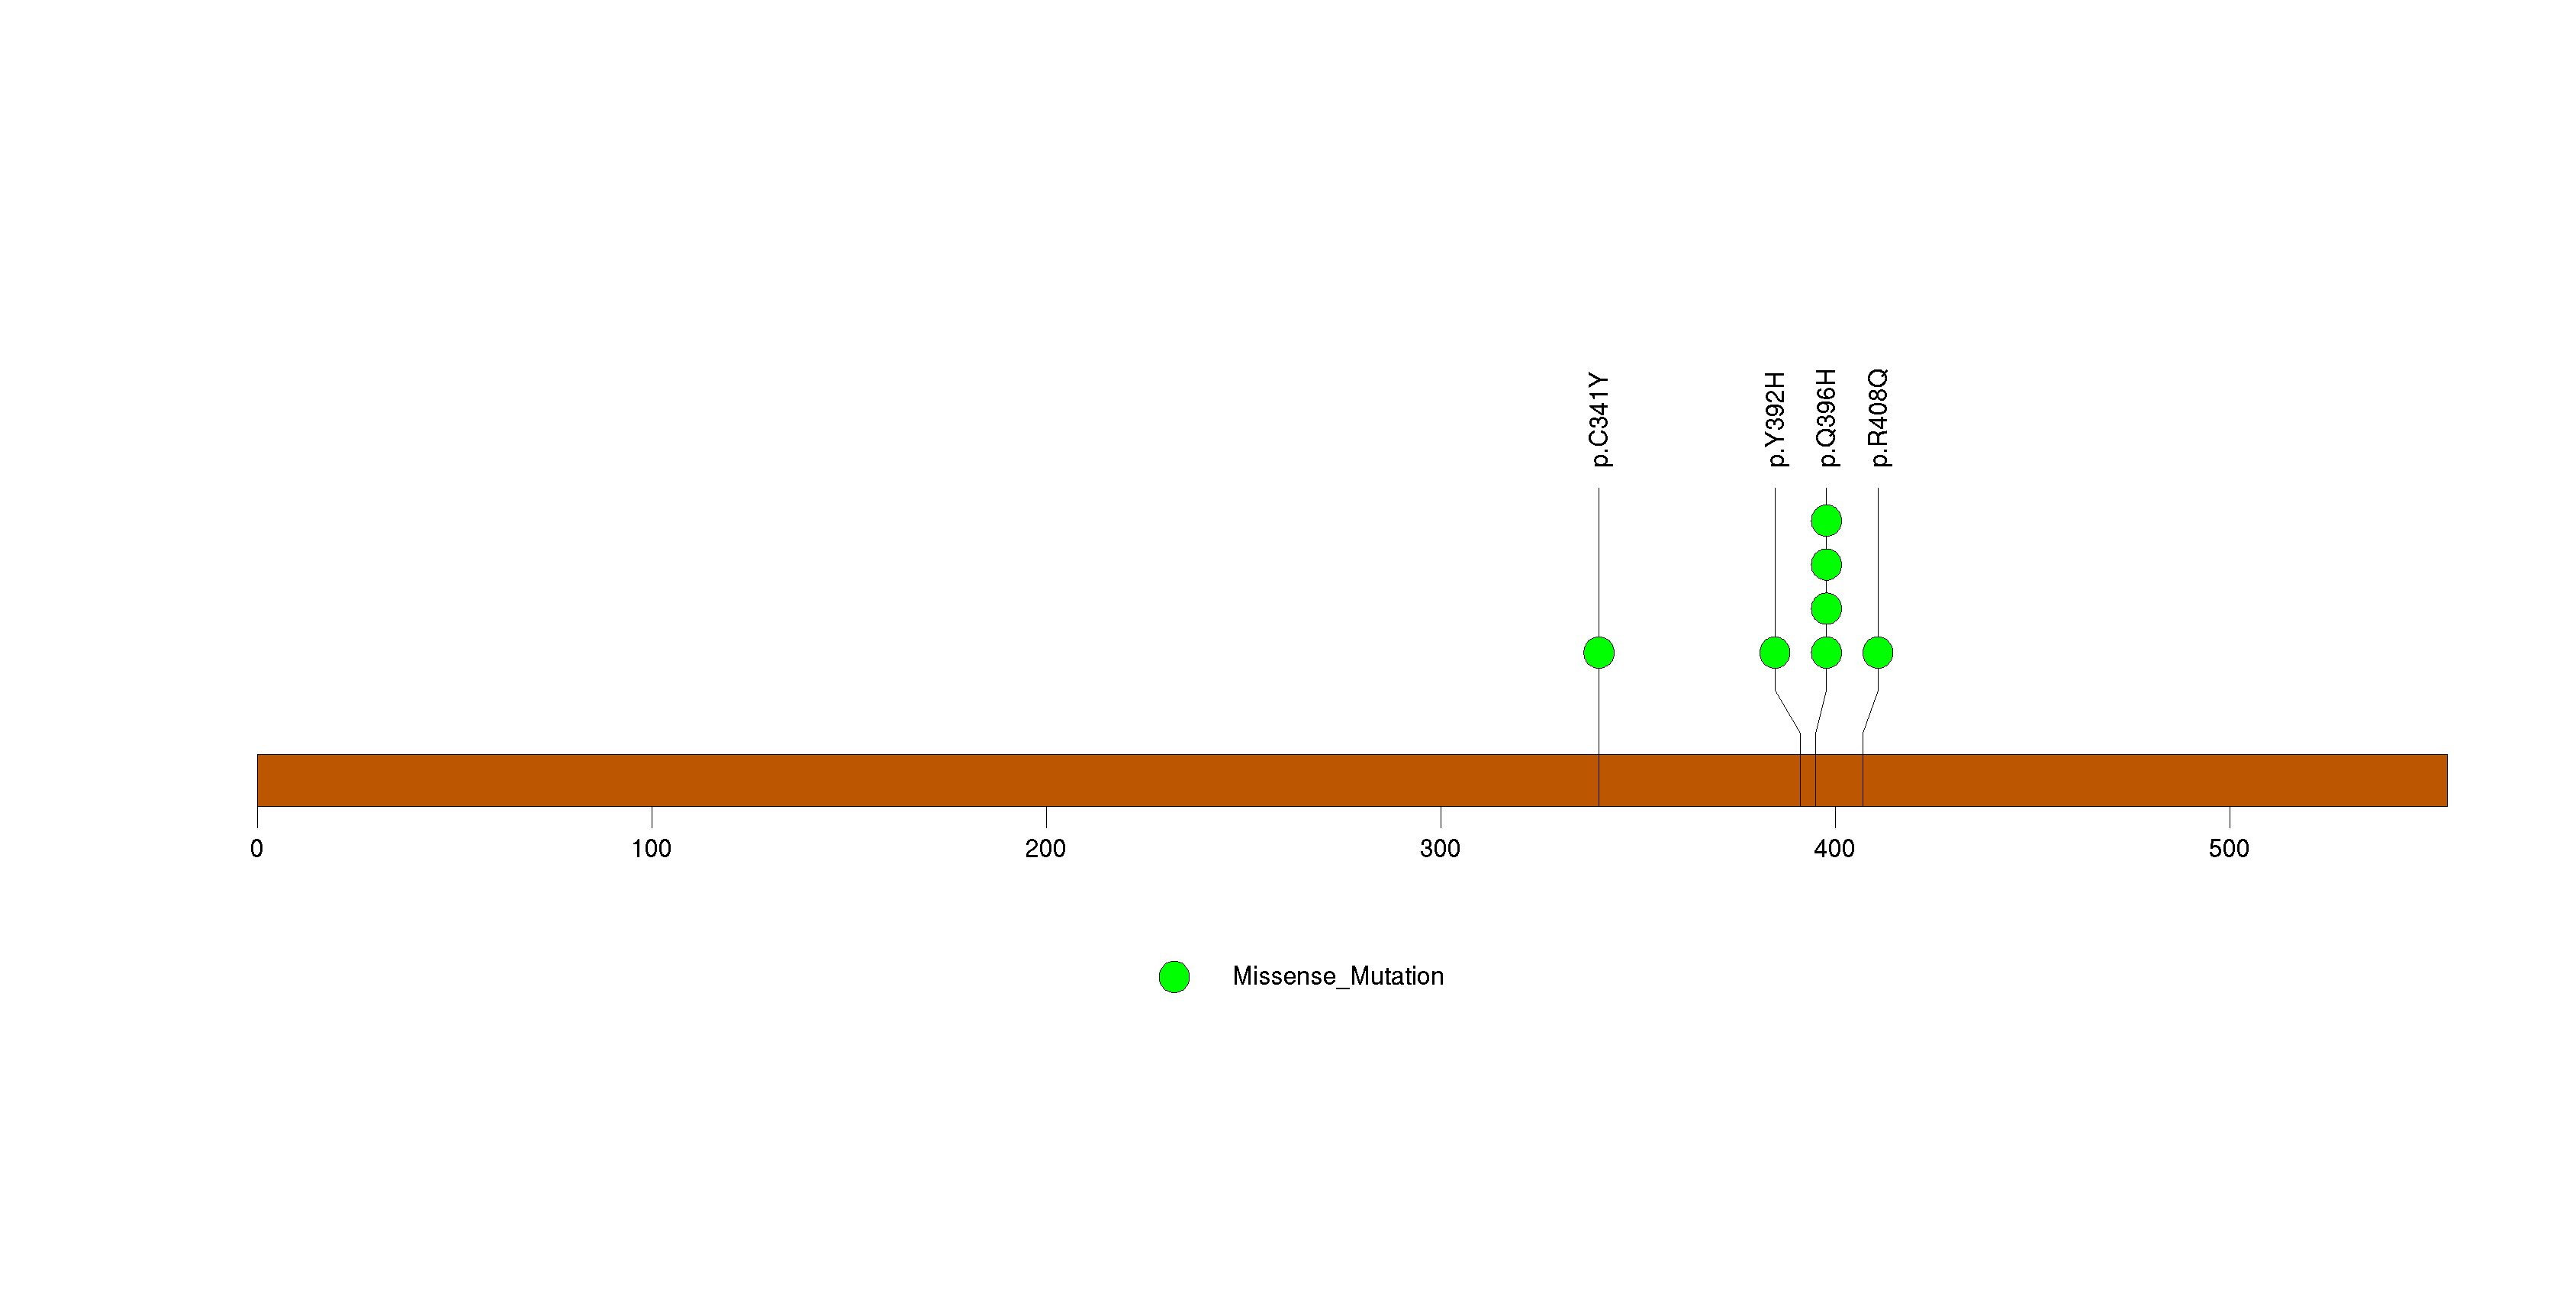
Figure S30. This figure depicts the distribution of mutations and mutation types across the EGFR significant gene.
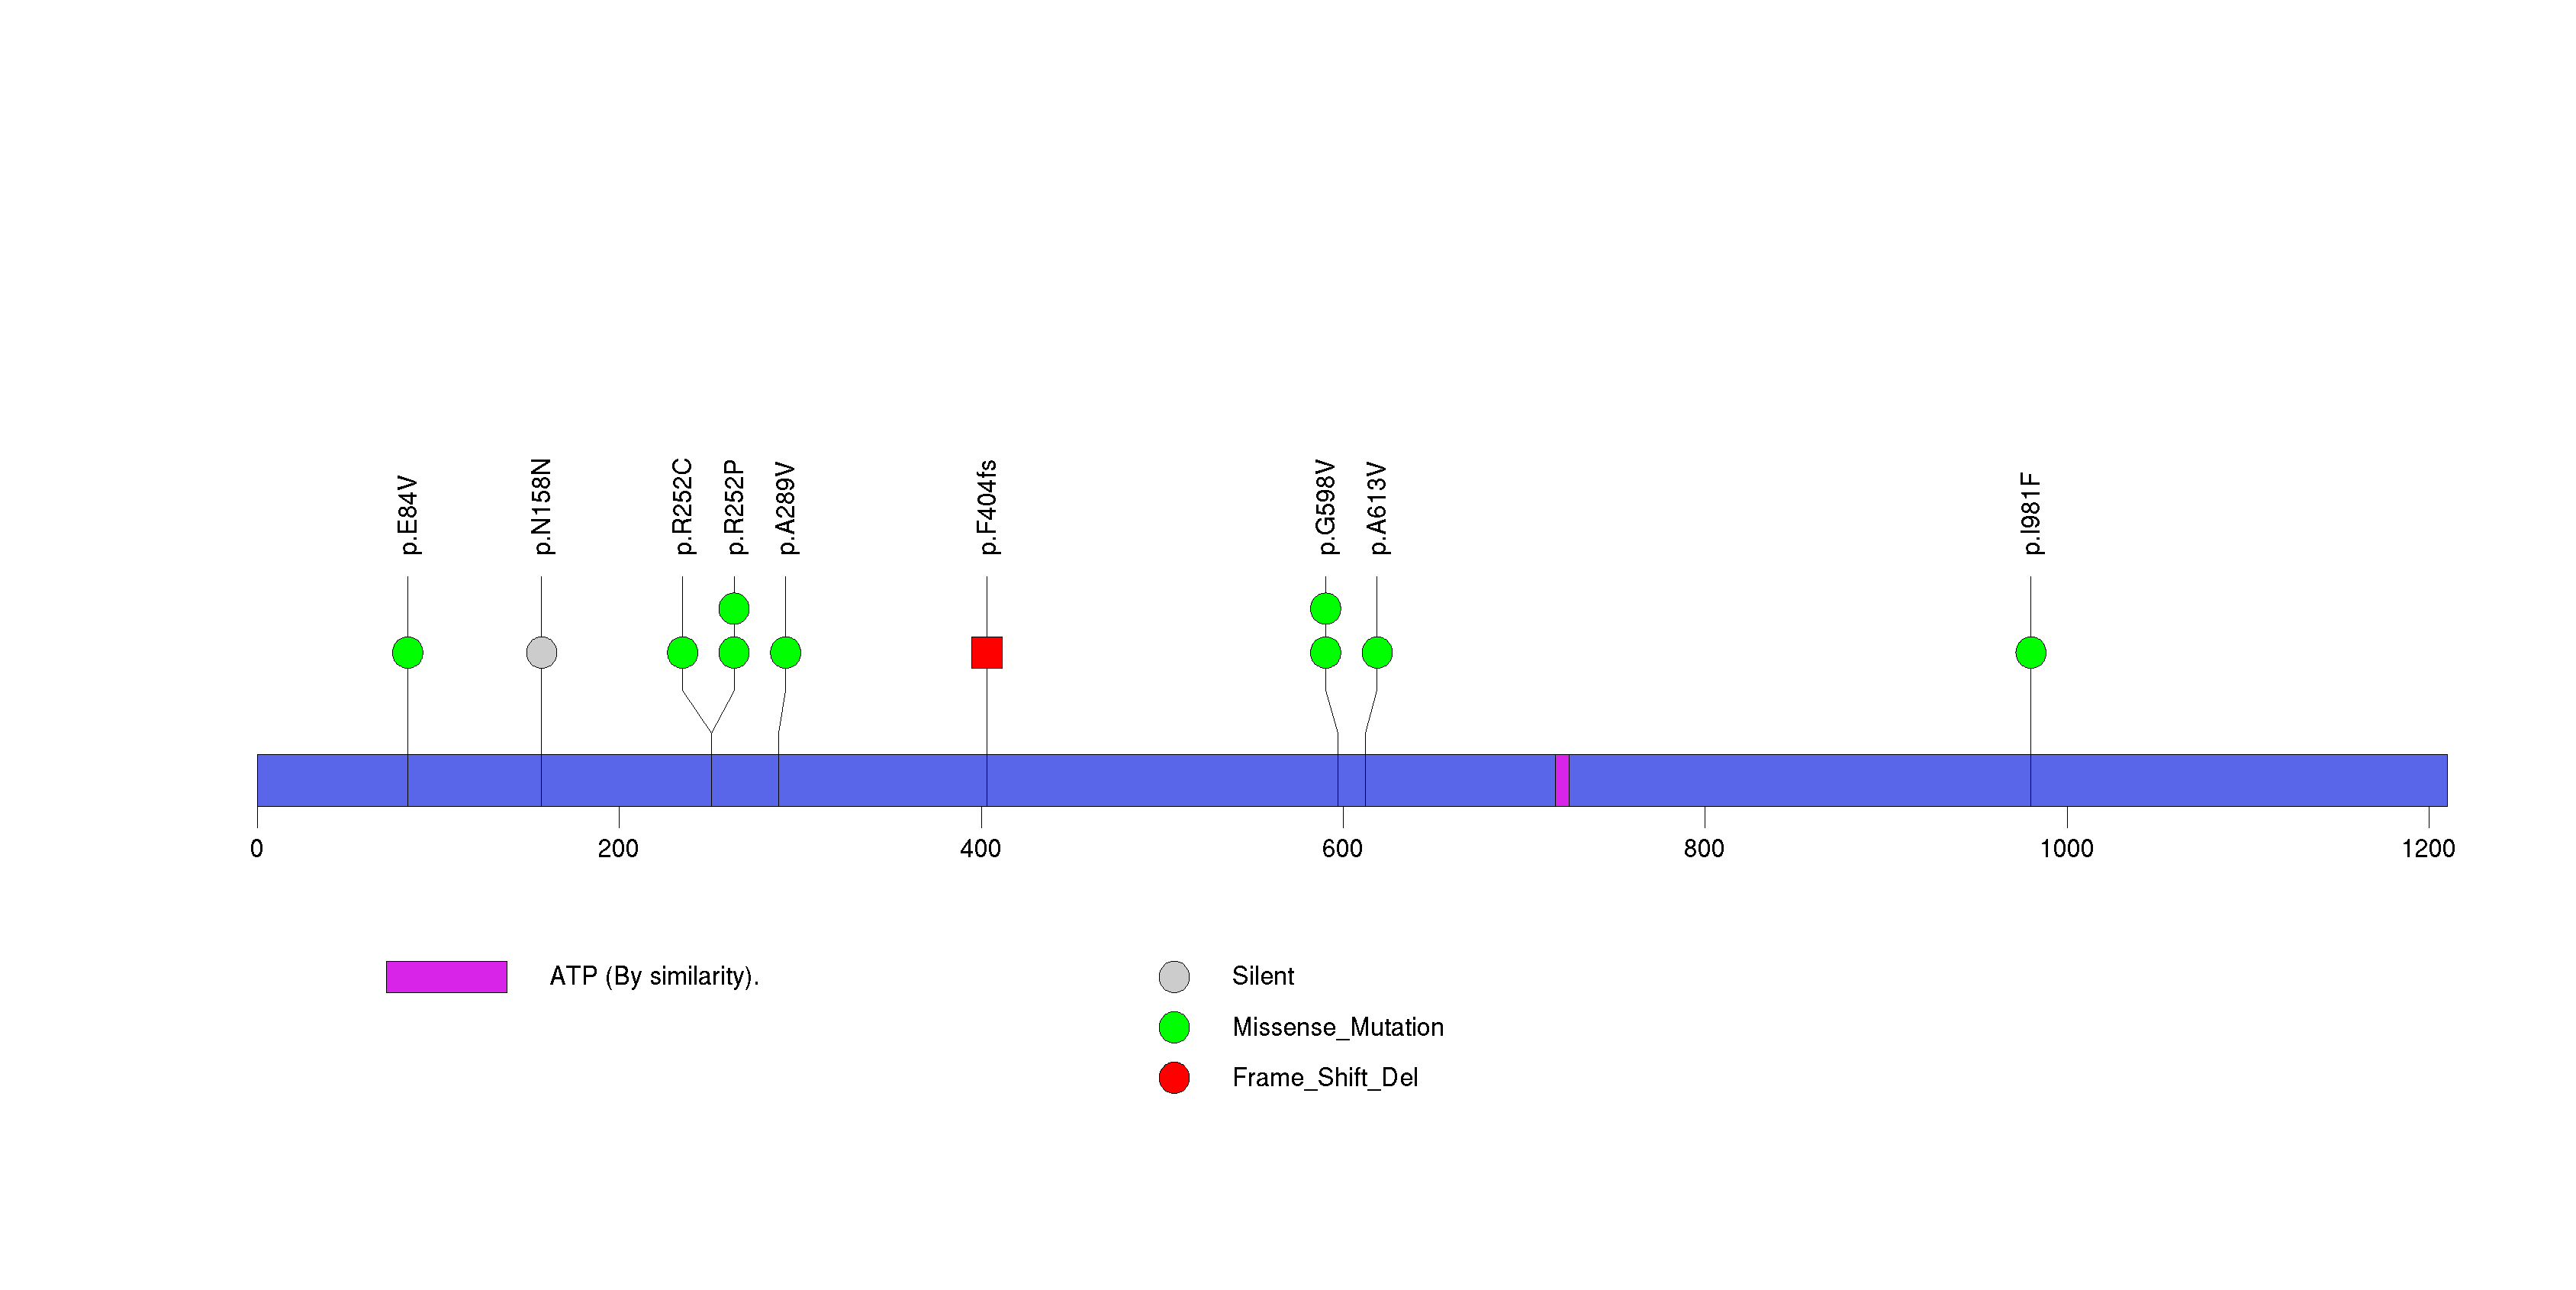
Figure S31. This figure depicts the distribution of mutations and mutation types across the CELSR2 significant gene.
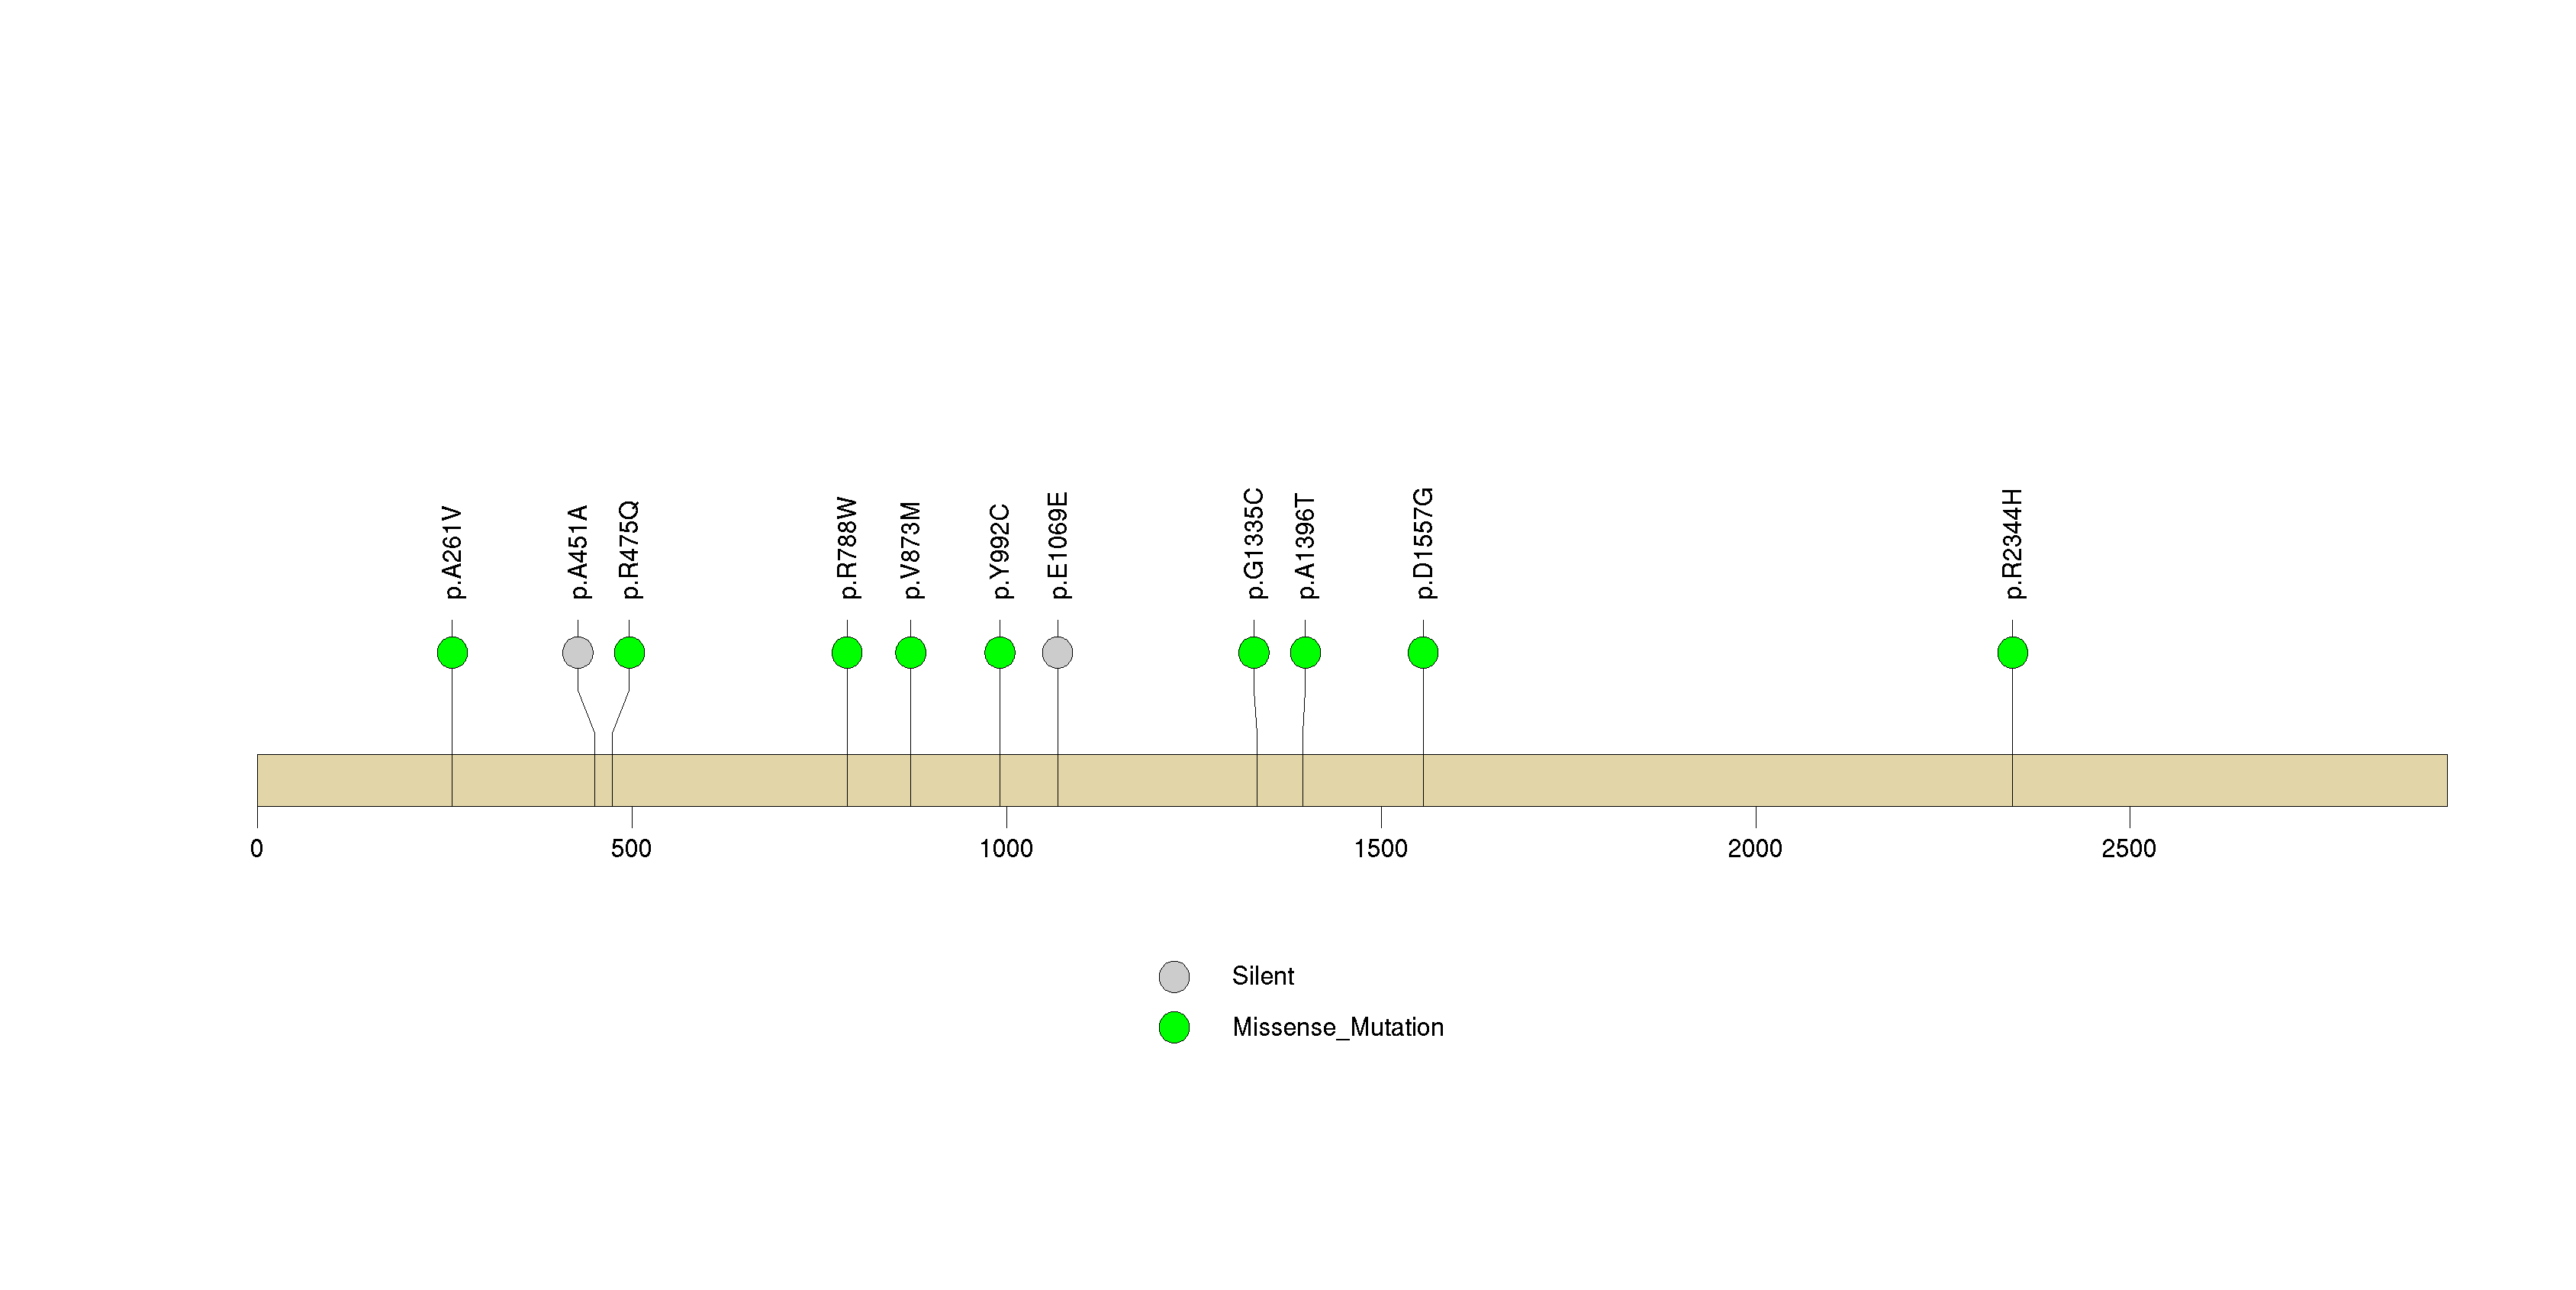
Figure S32. This figure depicts the distribution of mutations and mutation types across the NLRP1 significant gene.
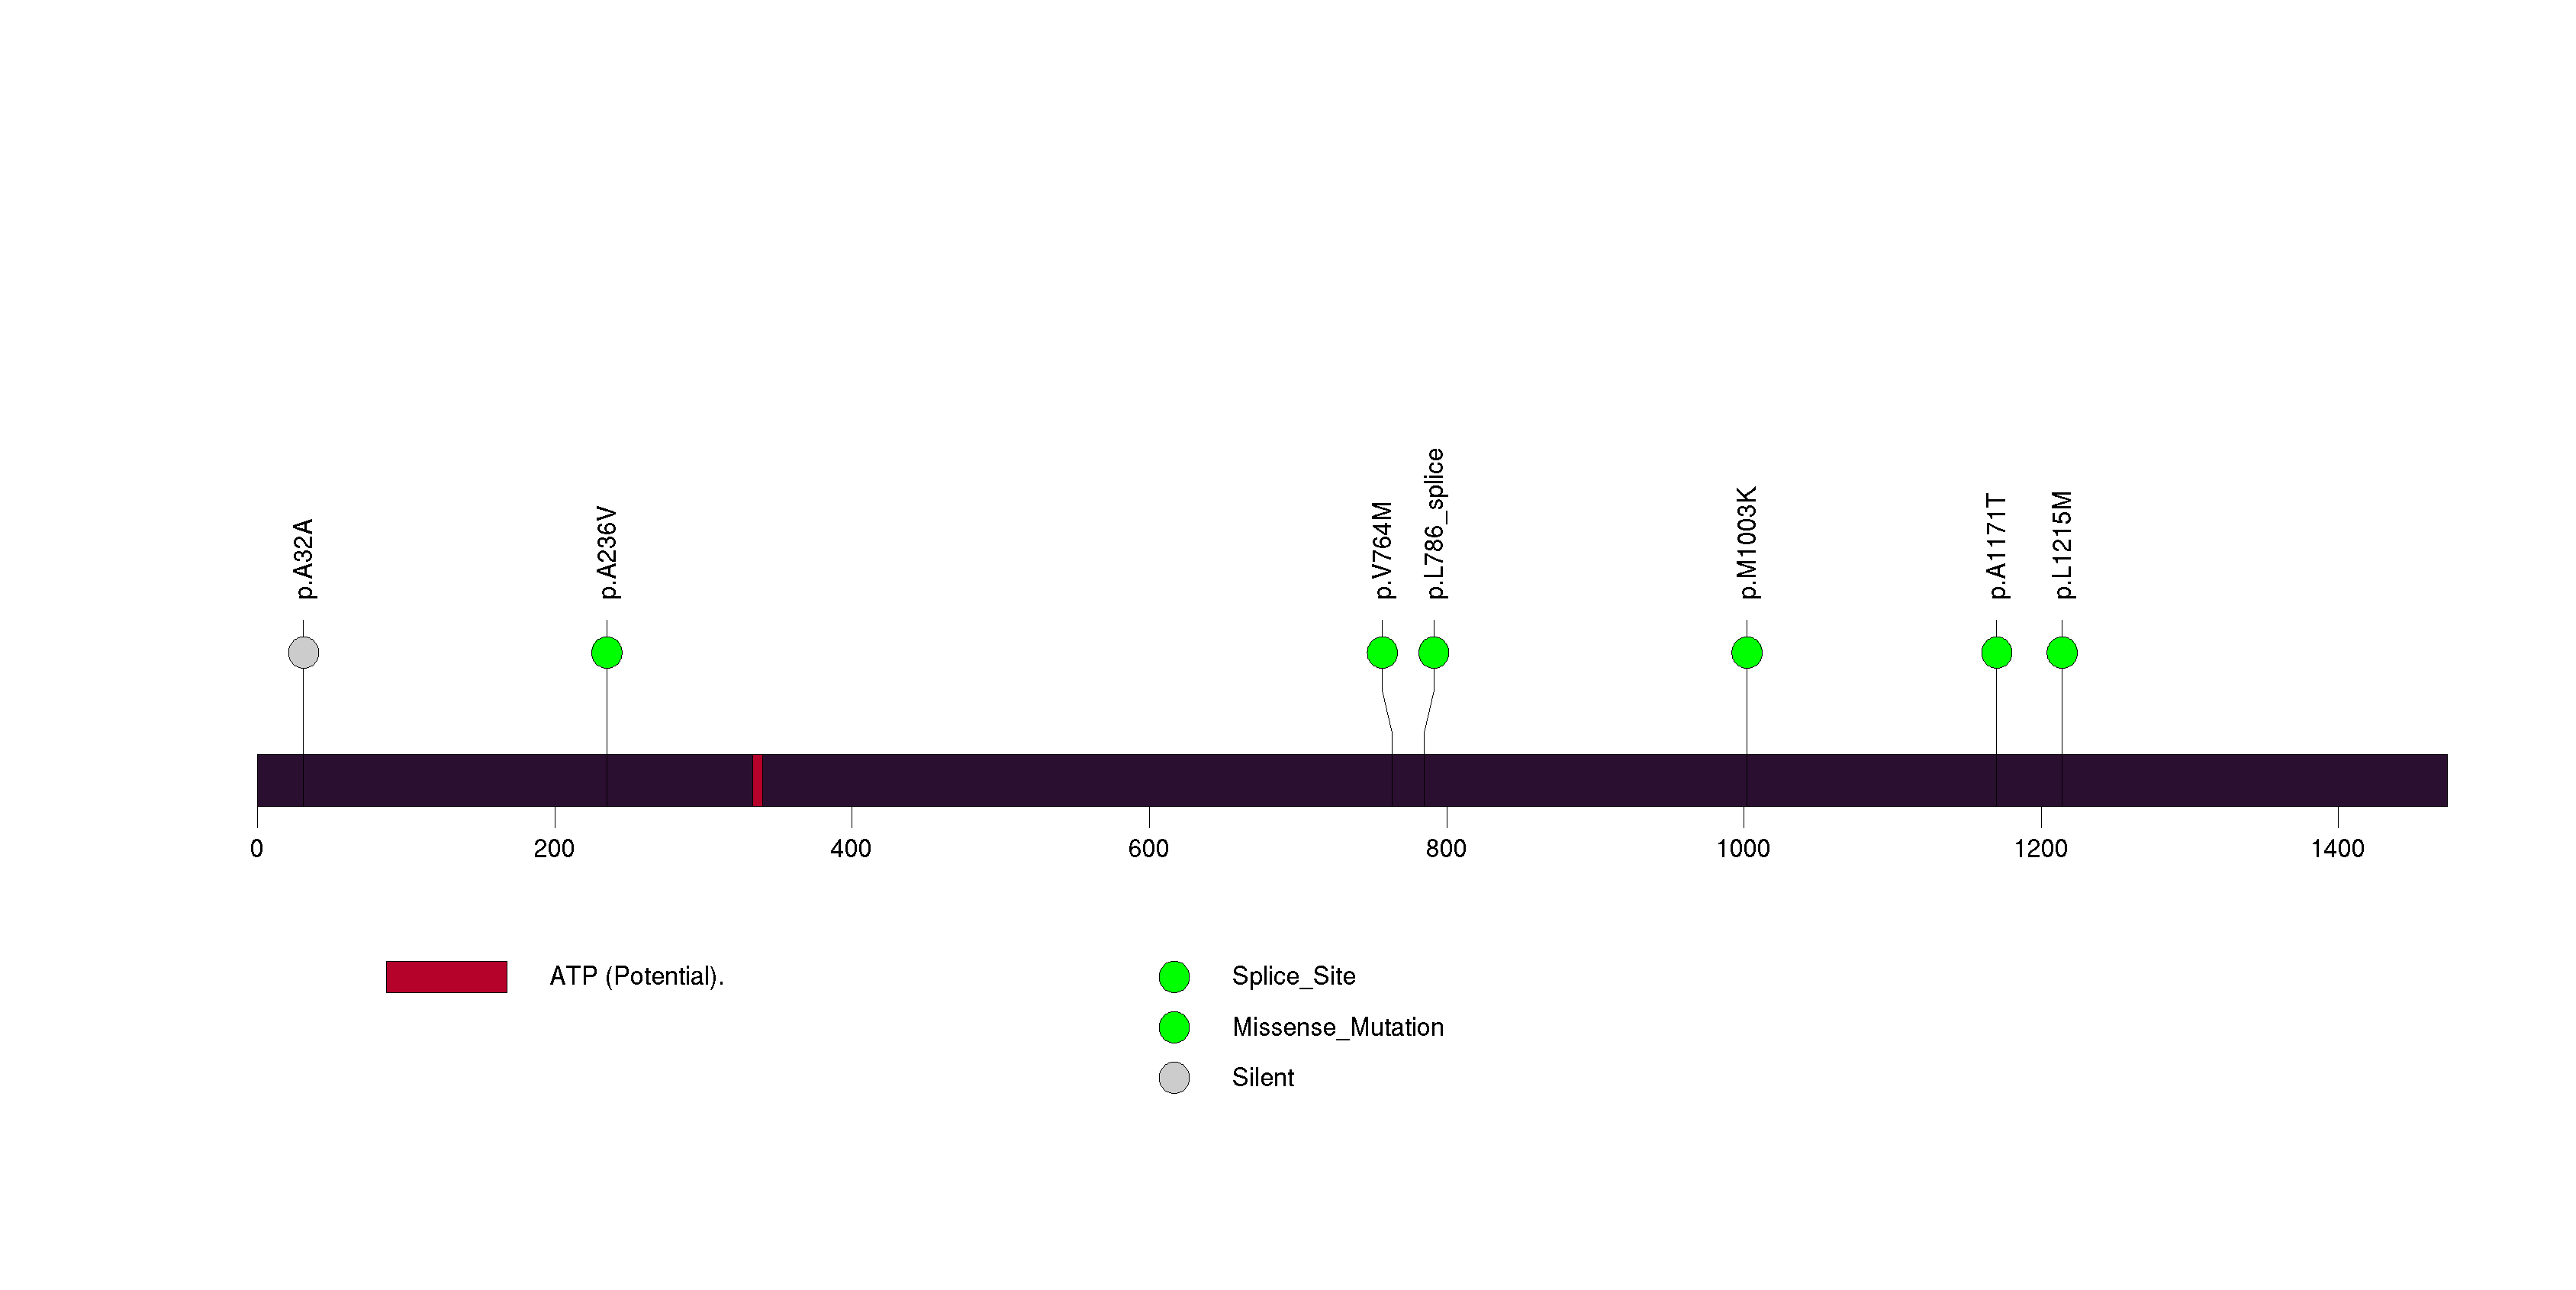
Figure S33. This figure depicts the distribution of mutations and mutation types across the PIK3CA significant gene.
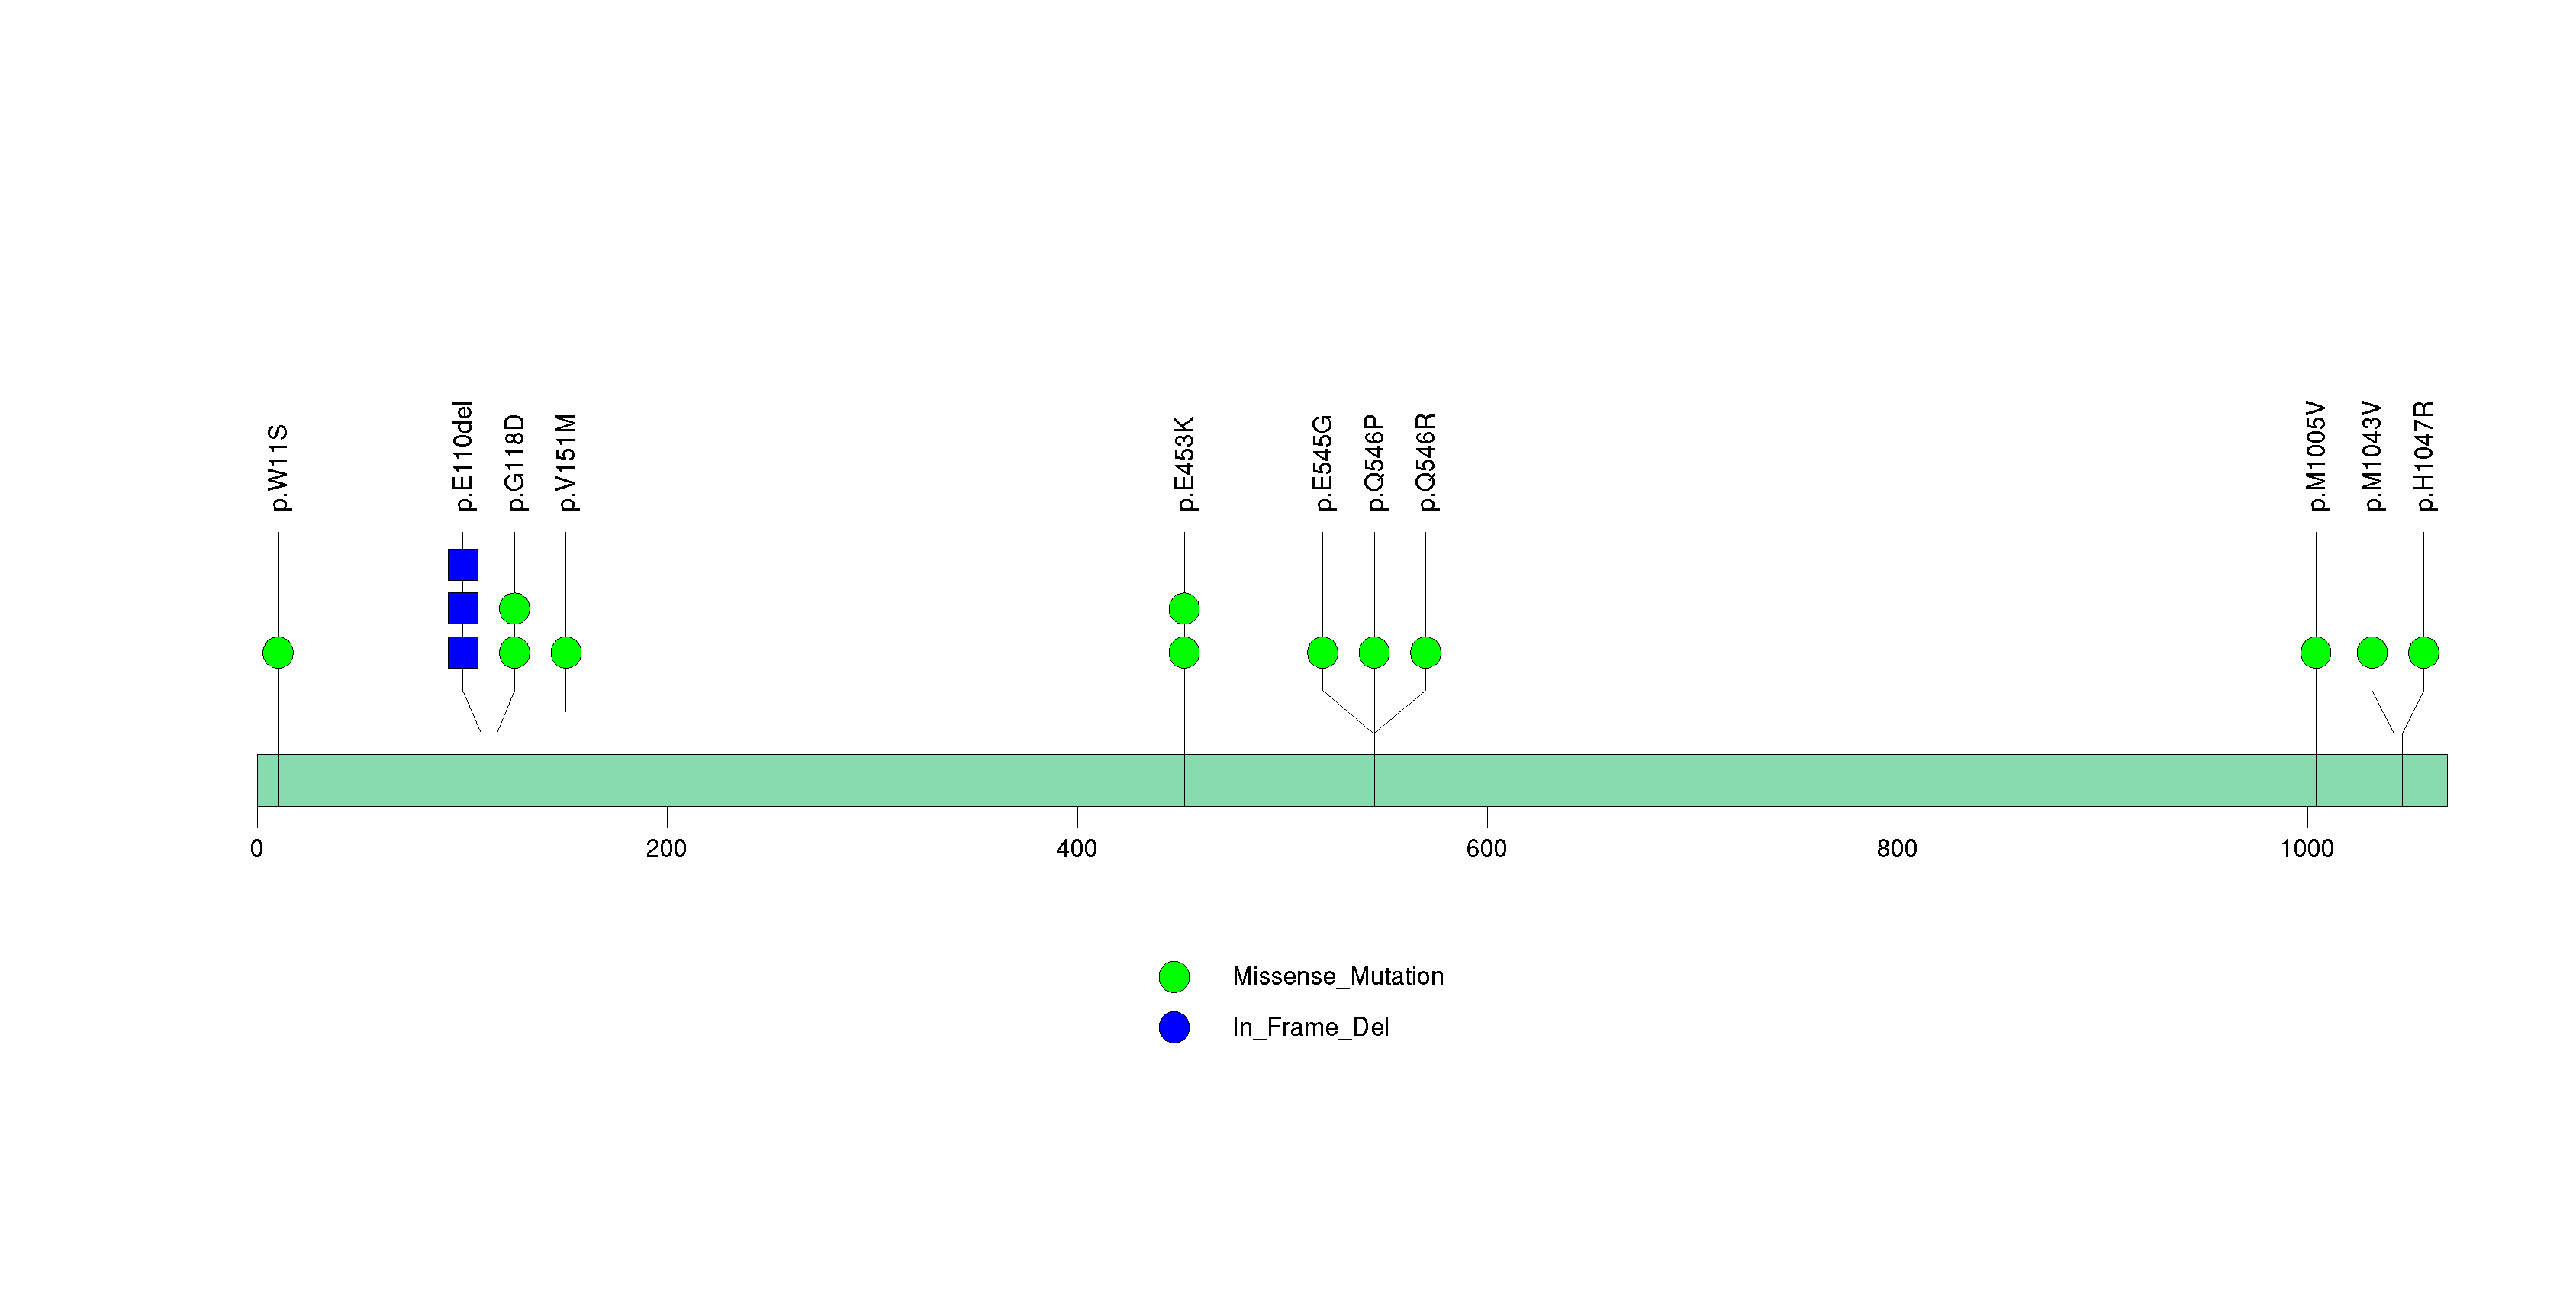
Figure S34. This figure depicts the distribution of mutations and mutation types across the PTPRH significant gene.
In brief, we tabulate the number of mutations and the number of covered bases for each gene. The counts are broken down by mutation context category: four context categories that are discovered by MutSig, and one for indel and 'null' mutations, which include indels, nonsense mutations, splice-site mutations, and non-stop (read-through) mutations. For each gene, we calculate the probability of seeing the observed constellation of mutations, i.e. the product P1 x P2 x ... x Pm, or a more extreme one, given the background mutation rates calculated across the dataset. [1]
This is an experimental feature. The full results of the analysis summarized in this report can be downloaded from the TCGA Data Coordination Center.