This pipeline computes the correlation between significantly recurrent gene mutations and selected clinical features.
Testing the association between mutation status of 114 genes and 5 clinical features across 276 patients, 2 significant findings detected with Q value < 0.25.
-
IDH1 mutation correlated to 'AGE'.
-
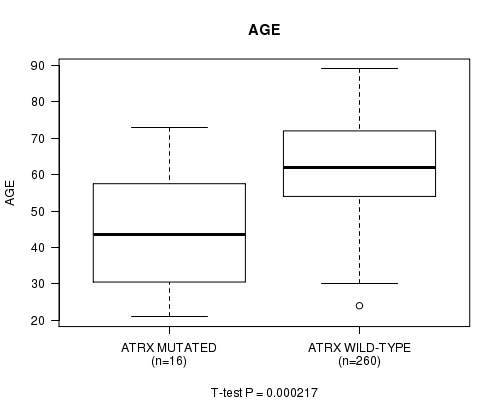
ATRX mutation correlated to 'AGE'.
Table 1. Get Full Table Overview of the association between mutation status of 114 genes and 5 clinical features. Shown in the table are P values (Q values). Thresholded by Q value < 0.25, 2 significant findings detected.
|
Clinical Features |
Time to Death |
AGE | GENDER |
KARNOFSKY PERFORMANCE SCORE |
RADIATIONS RADIATION REGIMENINDICATION |
||
| nMutated (%) | nWild-Type | logrank test | t-test | Fisher's exact test | t-test | Fisher's exact test | |
| IDH1 | 14 (5%) | 262 |
0.00261 (1.00) |
7.95e-05 (0.0441) |
0.269 (1.00) |
0.0319 (1.00) |
0.00287 (1.00) |
| ATRX | 16 (6%) | 260 |
0.0494 (1.00) |
0.000217 (0.12) |
0.597 (1.00) |
0.0201 (1.00) |
0.0609 (1.00) |
| PIK3R1 | 32 (12%) | 244 |
0.868 (1.00) |
0.558 (1.00) |
0.334 (1.00) |
0.889 (1.00) |
0.699 (1.00) |
| BRAF | 4 (1%) | 272 |
0.253 (1.00) |
0.195 (1.00) |
1 (1.00) |
0.166 (1.00) |
0.123 (1.00) |
| EGFR | 75 (27%) | 201 |
0.952 (1.00) |
0.449 (1.00) |
0.4 (1.00) |
0.406 (1.00) |
0.67 (1.00) |
| TP53 | 81 (29%) | 195 |
0.0583 (1.00) |
0.137 (1.00) |
0.583 (1.00) |
0.00907 (1.00) |
0.269 (1.00) |
| PTEN | 88 (32%) | 188 |
0.778 (1.00) |
0.162 (1.00) |
0.503 (1.00) |
0.676 (1.00) |
0.0574 (1.00) |
| PIK3CA | 30 (11%) | 246 |
0.435 (1.00) |
0.938 (1.00) |
0.692 (1.00) |
0.796 (1.00) |
0.418 (1.00) |
| RB1 | 22 (8%) | 254 |
0.111 (1.00) |
0.853 (1.00) |
0.818 (1.00) |
0.0207 (1.00) |
0.494 (1.00) |
| NF1 | 31 (11%) | 245 |
0.623 (1.00) |
0.208 (1.00) |
0.844 (1.00) |
0.136 (1.00) |
0.69 (1.00) |
| SPTA1 | 27 (10%) | 249 |
0.407 (1.00) |
0.121 (1.00) |
0.21 (1.00) |
0.434 (1.00) |
0.291 (1.00) |
| KRTAP4-11 | 9 (3%) | 267 |
0.629 (1.00) |
0.397 (1.00) |
0.728 (1.00) |
0.843 (1.00) |
0.724 (1.00) |
| GABRA6 | 11 (4%) | 265 |
0.915 (1.00) |
0.208 (1.00) |
1 (1.00) |
0.58 (1.00) |
1 (1.00) |
| KEL | 15 (5%) | 261 |
0.503 (1.00) |
0.383 (1.00) |
0.419 (1.00) |
0.104 (1.00) |
0.404 (1.00) |
| RPL5 | 8 (3%) | 268 |
0.897 (1.00) |
0.846 (1.00) |
0.47 (1.00) |
0.881 (1.00) |
0.718 (1.00) |
| CDH18 | 11 (4%) | 265 |
0.395 (1.00) |
0.504 (1.00) |
1 (1.00) |
0.546 (1.00) |
0.522 (1.00) |
| PRB2 | 5 (2%) | 271 |
0.928 (1.00) |
0.17 (1.00) |
1 (1.00) |
0.000758 (0.418) |
1 (1.00) |
| SEMA3C | 11 (4%) | 265 |
0.0506 (1.00) |
0.978 (1.00) |
0.751 (1.00) |
0.751 (1.00) |
0.199 (1.00) |
| TPTE2 | 8 (3%) | 268 |
0.266 (1.00) |
0.601 (1.00) |
1 (1.00) |
0.026 (1.00) |
0.455 (1.00) |
| ZNF844 | 6 (2%) | 270 |
0.56 (1.00) |
0.809 (1.00) |
0.196 (1.00) |
0.84 (1.00) |
1 (1.00) |
| OR8K3 | 6 (2%) | 270 |
0.704 (1.00) |
0.882 (1.00) |
0.42 (1.00) |
0.566 (1.00) |
0.668 (1.00) |
| OR5AR1 | 6 (2%) | 270 |
0.413 (1.00) |
0.00681 (1.00) |
0.672 (1.00) |
0.0583 (1.00) |
0.422 (1.00) |
| STAG2 | 12 (4%) | 264 |
0.0133 (1.00) |
0.921 (1.00) |
0.763 (1.00) |
0.091 (1.00) |
0.352 (1.00) |
| SEMG1 | 8 (3%) | 268 |
0.967 (1.00) |
0.136 (1.00) |
0.715 (1.00) |
0.342 (1.00) |
0.131 (1.00) |
| CDC27 | 5 (2%) | 271 |
0.201 (1.00) |
0.701 (1.00) |
0.359 (1.00) |
1 (1.00) |
|
| PDGFRA | 11 (4%) | 265 |
0.586 (1.00) |
0.0263 (1.00) |
1 (1.00) |
0.688 (1.00) |
0.522 (1.00) |
| SULT1B1 | 6 (2%) | 270 |
0.0691 (1.00) |
0.969 (1.00) |
1 (1.00) |
0.874 (1.00) |
1 (1.00) |
| ADAM29 | 9 (3%) | 267 |
0.68 (1.00) |
0.0529 (1.00) |
0.162 (1.00) |
0.874 (1.00) |
0.503 (1.00) |
| HEATR7B2 | 12 (4%) | 264 |
0.994 (1.00) |
0.163 (1.00) |
0.545 (1.00) |
0.669 (1.00) |
0.118 (1.00) |
| COL1A2 | 11 (4%) | 265 |
0.657 (1.00) |
0.305 (1.00) |
1 (1.00) |
0.715 (1.00) |
0.199 (1.00) |
| ABCC9 | 11 (4%) | 265 |
0.976 (1.00) |
0.253 (1.00) |
0.218 (1.00) |
0.542 (1.00) |
0.522 (1.00) |
| NLRP5 | 12 (4%) | 264 |
0.349 (1.00) |
0.99 (1.00) |
0.545 (1.00) |
0.0724 (1.00) |
1 (1.00) |
| CALCR | 7 (3%) | 269 |
0.0293 (1.00) |
0.0155 (1.00) |
1 (1.00) |
0.702 (1.00) |
1 (1.00) |
| LZTR1 | 10 (4%) | 266 |
0.72 (1.00) |
0.273 (1.00) |
0.0985 (1.00) |
0.751 (1.00) |
0.324 (1.00) |
| QKI | 5 (2%) | 271 |
0.926 (1.00) |
0.825 (1.00) |
1 (1.00) |
0.494 (1.00) |
0.0512 (1.00) |
| ZPBP | 5 (2%) | 271 |
0.342 (1.00) |
0.982 (1.00) |
0.359 (1.00) |
0.84 (1.00) |
0.346 (1.00) |
| PSPH | 5 (2%) | 271 |
0.219 (1.00) |
0.362 (1.00) |
0.655 (1.00) |
0.914 (1.00) |
0.661 (1.00) |
| UGT2A3 | 6 (2%) | 270 |
0.977 (1.00) |
0.815 (1.00) |
1 (1.00) |
0.84 (1.00) |
0.0952 (1.00) |
| WNT2 | 5 (2%) | 271 |
0.376 (1.00) |
0.237 (1.00) |
0.0617 (1.00) |
0.717 (1.00) |
1 (1.00) |
| OR5D18 | 6 (2%) | 270 |
0.159 (1.00) |
0.695 (1.00) |
0.672 (1.00) |
0.173 (1.00) |
1 (1.00) |
| ABCB1 | 10 (4%) | 266 |
0.502 (1.00) |
0.114 (1.00) |
0.178 (1.00) |
0.48 (1.00) |
0.324 (1.00) |
| CXORF22 | 9 (3%) | 267 |
0.937 (1.00) |
0.364 (1.00) |
0.295 (1.00) |
0.234 (1.00) |
0.503 (1.00) |
| C1ORF150 | 3 (1%) | 273 |
0.682 (1.00) |
0.0919 (1.00) |
1 (1.00) |
0.247 (1.00) |
1 (1.00) |
| GPX5 | 4 (1%) | 272 |
0.373 (1.00) |
0.285 (1.00) |
1 (1.00) |
0.888 (1.00) |
0.302 (1.00) |
| LRRC55 | 6 (2%) | 270 |
0.0155 (1.00) |
0.552 (1.00) |
0.672 (1.00) |
0.0486 (1.00) |
1 (1.00) |
| DCAF12L2 | 8 (3%) | 268 |
0.531 (1.00) |
0.716 (1.00) |
0.265 (1.00) |
0.69 (1.00) |
1 (1.00) |
| LRFN5 | 7 (3%) | 269 |
0.0281 (1.00) |
0.399 (1.00) |
0.264 (1.00) |
0.323 (1.00) |
0.00797 (1.00) |
| LUM | 4 (1%) | 272 |
0.0826 (1.00) |
0.853 (1.00) |
1 (1.00) |
0.765 (1.00) |
0.612 (1.00) |
| MMP13 | 6 (2%) | 270 |
0.629 (1.00) |
0.152 (1.00) |
1 (1.00) |
0.0271 (1.00) |
0.0952 (1.00) |
| UGT2B28 | 6 (2%) | 270 |
0.768 (1.00) |
0.817 (1.00) |
0.42 (1.00) |
0.793 (1.00) |
1 (1.00) |
| OR5D13 | 5 (2%) | 271 |
0.461 (1.00) |
0.434 (1.00) |
0.655 (1.00) |
0.661 (1.00) |
|
| ZNF99 | 6 (2%) | 270 |
0.752 (1.00) |
0.719 (1.00) |
0.42 (1.00) |
0.809 (1.00) |
1 (1.00) |
| SLC5A7 | 6 (2%) | 270 |
0.116 (1.00) |
0.659 (1.00) |
0.42 (1.00) |
0.342 (1.00) |
1 (1.00) |
| TRPV6 | 8 (3%) | 268 |
0.929 (1.00) |
0.104 (1.00) |
1 (1.00) |
0.401 (1.00) |
0.0538 (1.00) |
| SEMA3E | 7 (3%) | 269 |
0.403 (1.00) |
0.644 (1.00) |
1 (1.00) |
0.566 (1.00) |
0.1 (1.00) |
| SLC26A3 | 6 (2%) | 270 |
0.484 (1.00) |
0.357 (1.00) |
0.42 (1.00) |
0.566 (1.00) |
0.668 (1.00) |
| OR4D5 | 5 (2%) | 271 |
0.601 (1.00) |
0.143 (1.00) |
0.162 (1.00) |
0.378 (1.00) |
0.346 (1.00) |
| TCHH | 16 (6%) | 260 |
0.354 (1.00) |
0.355 (1.00) |
0.427 (1.00) |
0.511 (1.00) |
0.189 (1.00) |
| CFHR4 | 5 (2%) | 271 |
0.377 (1.00) |
0.99 (1.00) |
0.359 (1.00) |
0.981 (1.00) |
1 (1.00) |
| GABRB2 | 6 (2%) | 270 |
0.281 (1.00) |
0.0297 (1.00) |
0.196 (1.00) |
0.36 (1.00) |
0.187 (1.00) |
| IL18RAP | 5 (2%) | 271 |
0.789 (1.00) |
0.19 (1.00) |
0.359 (1.00) |
0.286 (1.00) |
0.661 (1.00) |
| OGDH | 3 (1%) | 273 |
0.229 (1.00) |
0.311 (1.00) |
1 (1.00) |
0.292 (1.00) |
1 (1.00) |
| PCDH11X | 8 (3%) | 268 |
0.0923 (1.00) |
0.157 (1.00) |
0.47 (1.00) |
0.0226 (1.00) |
0.131 (1.00) |
| SPRYD5 | 6 (2%) | 270 |
0.813 (1.00) |
0.829 (1.00) |
0.672 (1.00) |
0.566 (1.00) |
1 (1.00) |
| TGFA | 4 (1%) | 272 |
0.917 (1.00) |
0.37 (1.00) |
0.141 (1.00) |
1 (1.00) |
|
| OR5P2 | 4 (1%) | 272 |
0.268 (1.00) |
0.123 (1.00) |
0.3 (1.00) |
0.000758 (0.418) |
0.612 (1.00) |
| FOXR2 | 5 (2%) | 271 |
0.208 (1.00) |
0.95 (1.00) |
1 (1.00) |
0.84 (1.00) |
1 (1.00) |
| PSG8 | 6 (2%) | 270 |
0.278 (1.00) |
0.472 (1.00) |
0.196 (1.00) |
0.853 (1.00) |
0.422 (1.00) |
| CNTNAP2 | 12 (4%) | 264 |
0.825 (1.00) |
0.134 (1.00) |
0.366 (1.00) |
0.165 (1.00) |
1 (1.00) |
| GABRA1 | 5 (2%) | 271 |
0.772 (1.00) |
0.927 (1.00) |
0.655 (1.00) |
0.247 (1.00) |
1 (1.00) |
| DYNC1I1 | 7 (3%) | 269 |
0.0966 (1.00) |
0.438 (1.00) |
1 (1.00) |
0.0886 (1.00) |
0.697 (1.00) |
| KDR | 8 (3%) | 268 |
0.16 (1.00) |
0.827 (1.00) |
0.715 (1.00) |
0.881 (1.00) |
0.269 (1.00) |
| PODXL | 3 (1%) | 273 |
0.339 (1.00) |
0.213 (1.00) |
0.556 (1.00) |
0.129 (1.00) |
0.554 (1.00) |
| SCN9A | 11 (4%) | 265 |
0.0287 (1.00) |
0.25 (1.00) |
0.751 (1.00) |
0.242 (1.00) |
0.199 (1.00) |
| PIK3C2G | 9 (3%) | 267 |
0.126 (1.00) |
0.393 (1.00) |
0.295 (1.00) |
0.566 (1.00) |
0.284 (1.00) |
| AFM | 6 (2%) | 270 |
0.271 (1.00) |
0.398 (1.00) |
0.672 (1.00) |
0.363 (1.00) |
1 (1.00) |
| CARD6 | 7 (3%) | 269 |
0.00681 (1.00) |
0.0289 (1.00) |
0.429 (1.00) |
0.945 (1.00) |
0.242 (1.00) |
| OR5K4 | 4 (1%) | 272 |
0.2 (1.00) |
0.193 (1.00) |
1 (1.00) |
0.716 (1.00) |
0.612 (1.00) |
| KRTAP20-2 | 3 (1%) | 273 |
0.509 (1.00) |
0.334 (1.00) |
1 (1.00) |
0.554 (1.00) |
|
| PODNL1 | 4 (1%) | 272 |
0.102 (1.00) |
0.174 (1.00) |
0.625 (1.00) |
0.506 (1.00) |
0.123 (1.00) |
| POTEF | 5 (2%) | 271 |
0.971 (1.00) |
0.718 (1.00) |
1 (1.00) |
1 (1.00) |
|
| OTC | 3 (1%) | 273 |
0.114 (1.00) |
0.774 (1.00) |
0.556 (1.00) |
0.278 (1.00) |
|
| TRAT1 | 4 (1%) | 272 |
0.131 (1.00) |
0.465 (1.00) |
1 (1.00) |
0.612 (1.00) |
|
| RBM47 | 8 (3%) | 268 |
0.893 (1.00) |
0.525 (1.00) |
1 (1.00) |
0.414 (1.00) |
1 (1.00) |
| KLK6 | 3 (1%) | 273 |
0.248 (1.00) |
0.224 (1.00) |
0.556 (1.00) |
0.554 (1.00) |
|
| KRTAP4-7 | 3 (1%) | 273 |
0.454 (1.00) |
0.314 (1.00) |
0.301 (1.00) |
0.278 (1.00) |
|
| CDH9 | 8 (3%) | 268 |
0.558 (1.00) |
0.59 (1.00) |
0.47 (1.00) |
0.467 (1.00) |
1 (1.00) |
| OR4P4 | 4 (1%) | 272 |
0.944 (1.00) |
0.357 (1.00) |
1 (1.00) |
1 (1.00) |
|
| OR52M1 | 4 (1%) | 272 |
0.966 (1.00) |
0.473 (1.00) |
1 (1.00) |
0.743 (1.00) |
1 (1.00) |
| ADAMTS16 | 8 (3%) | 268 |
0.859 (1.00) |
0.561 (1.00) |
0.715 (1.00) |
0.0904 (1.00) |
0.269 (1.00) |
| GLT8D2 | 3 (1%) | 273 |
0.12 (1.00) |
0.405 (1.00) |
1 (1.00) |
0.0412 (1.00) |
|
| KLF17 | 5 (2%) | 271 |
0.00218 (1.00) |
0.3 (1.00) |
0.162 (1.00) |
0.446 (1.00) |
1 (1.00) |
| CDHR3 | 3 (1%) | 273 |
0.255 (1.00) |
0.544 (1.00) |
1 (1.00) |
0.286 (1.00) |
0.554 (1.00) |
| CD3EAP | 3 (1%) | 273 |
0.864 (1.00) |
0.663 (1.00) |
1 (1.00) |
0.716 (1.00) |
1 (1.00) |
| OR8J3 | 4 (1%) | 272 |
0.377 (1.00) |
0.58 (1.00) |
0.625 (1.00) |
0.661 (1.00) |
0.302 (1.00) |
| AP3S1 | 3 (1%) | 273 |
0.247 (1.00) |
0.351 (1.00) |
0.301 (1.00) |
0.247 (1.00) |
0.554 (1.00) |
| CKMT1A | 3 (1%) | 273 |
0.491 (1.00) |
0.0428 (1.00) |
0.301 (1.00) |
0.861 (1.00) |
1 (1.00) |
| ST6GAL2 | 5 (2%) | 271 |
0.882 (1.00) |
0.347 (1.00) |
0.0617 (1.00) |
0.0899 (1.00) |
0.661 (1.00) |
| F9 | 4 (1%) | 272 |
0.0203 (1.00) |
0.559 (1.00) |
0.625 (1.00) |
1 (1.00) |
|
| SHB | 3 (1%) | 273 |
0.988 (1.00) |
0.649 (1.00) |
0.556 (1.00) |
0.000758 (0.418) |
0.554 (1.00) |
| RSPO3 | 3 (1%) | 273 |
0.397 (1.00) |
0.766 (1.00) |
0.556 (1.00) |
0.278 (1.00) |
|
| TCN1 | 4 (1%) | 272 |
0.913 (1.00) |
0.315 (1.00) |
0.625 (1.00) |
0.123 (1.00) |
|
| CDKN2C | 3 (1%) | 273 |
0.731 (1.00) |
0.576 (1.00) |
0.301 (1.00) |
1 (1.00) |
|
| DRD5 | 7 (3%) | 269 |
0.631 (1.00) |
0.229 (1.00) |
1 (1.00) |
0.286 (1.00) |
1 (1.00) |
| FGA | 6 (2%) | 270 |
0.911 (1.00) |
0.359 (1.00) |
0.089 (1.00) |
0.36 (1.00) |
0.668 (1.00) |
| FGG | 5 (2%) | 271 |
0.411 (1.00) |
0.0715 (1.00) |
0.359 (1.00) |
0.286 (1.00) |
0.661 (1.00) |
| HCN1 | 11 (4%) | 265 |
0.234 (1.00) |
0.834 (1.00) |
0.538 (1.00) |
0.566 (1.00) |
0.199 (1.00) |
| PAN3 | 6 (2%) | 270 |
0.284 (1.00) |
0.47 (1.00) |
1 (1.00) |
0.763 (1.00) |
0.668 (1.00) |
| OR10G8 | 4 (1%) | 272 |
0.87 (1.00) |
0.256 (1.00) |
0.625 (1.00) |
0.84 (1.00) |
0.612 (1.00) |
| PROKR2 | 6 (2%) | 270 |
0.474 (1.00) |
0.0196 (1.00) |
1 (1.00) |
0.993 (1.00) |
0.668 (1.00) |
| AZGP1 | 4 (1%) | 272 |
0.644 (1.00) |
0.84 (1.00) |
1 (1.00) |
1 (1.00) |
|
| CYP3A5 | 5 (2%) | 271 |
0.313 (1.00) |
0.699 (1.00) |
0.359 (1.00) |
0.363 (1.00) |
1 (1.00) |
| HIST1H2BE | 3 (1%) | 273 |
0.732 (1.00) |
0.192 (1.00) |
0.301 (1.00) |
0.5 (1.00) |
1 (1.00) |
| PCMTD1 | 4 (1%) | 272 |
0.953 (1.00) |
0.288 (1.00) |
0.3 (1.00) |
0.935 (1.00) |
0.302 (1.00) |
P value = 7.95e-05 (t-test), Q value = 0.044
Table S1. Gene #4: 'IDH1 MUTATION STATUS' versus Clinical Feature #2: 'AGE'
| nPatients | Mean (Std.Dev) | |
|---|---|---|
| ALL | 276 | 61.1 (12.6) |
| IDH1 MUTATED | 14 | 40.7 (14.4) |
| IDH1 WILD-TYPE | 262 | 62.2 (11.5) |
Figure S1. Get High-res Image Gene #4: 'IDH1 MUTATION STATUS' versus Clinical Feature #2: 'AGE'

P value = 0.000217 (t-test), Q value = 0.12
Table S2. Gene #36: 'ATRX MUTATION STATUS' versus Clinical Feature #2: 'AGE'
| nPatients | Mean (Std.Dev) | |
|---|---|---|
| ALL | 276 | 61.1 (12.6) |
| ATRX MUTATED | 16 | 43.3 (15.7) |
| ATRX WILD-TYPE | 260 | 62.2 (11.5) |
Figure S2. Get High-res Image Gene #36: 'ATRX MUTATION STATUS' versus Clinical Feature #2: 'AGE'
-
Mutation data file = GBM-TP.mutsig.cluster.txt
-
Clinical data file = GBM-TP.clin.merged.picked.txt
-
Number of patients = 276
-
Number of significantly mutated genes = 114
-
Number of selected clinical features = 5
-
Exclude genes that fewer than K tumors have mutations, K = 3
For survival clinical features, the Kaplan-Meier survival curves of tumors with and without gene mutations were plotted and the statistical significance P values were estimated by logrank test (Bland and Altman 2004) using the 'survdiff' function in R
For continuous numerical clinical features, two-tailed Student's t test with unequal variance (Lehmann and Romano 2005) was applied to compare the clinical values between tumors with and without gene mutations using 't.test' function in R
For binary or multi-class clinical features (nominal or ordinal), two-tailed Fisher's exact tests (Fisher 1922) were used to estimate the P values using the 'fisher.test' function in R
For multiple hypothesis correction, Q value is the False Discovery Rate (FDR) analogue of the P value (Benjamini and Hochberg 1995), defined as the minimum FDR at which the test may be called significant. We used the 'Benjamini and Hochberg' method of 'p.adjust' function in R to convert P values into Q values.
This is an experimental feature. The full results of the analysis summarized in this report can be downloaded from the TCGA Data Coordination Center.