This pipeline computes the correlation between significant arm-level copy number variations (cnvs) and subtypes.
Testing the association between copy number variation 79 arm-level results and 10 molecular subtypes across 563 patients, 72 significant findings detected with Q value < 0.25.
-
1p gain cnv correlated to 'CN_CNMF'.
-
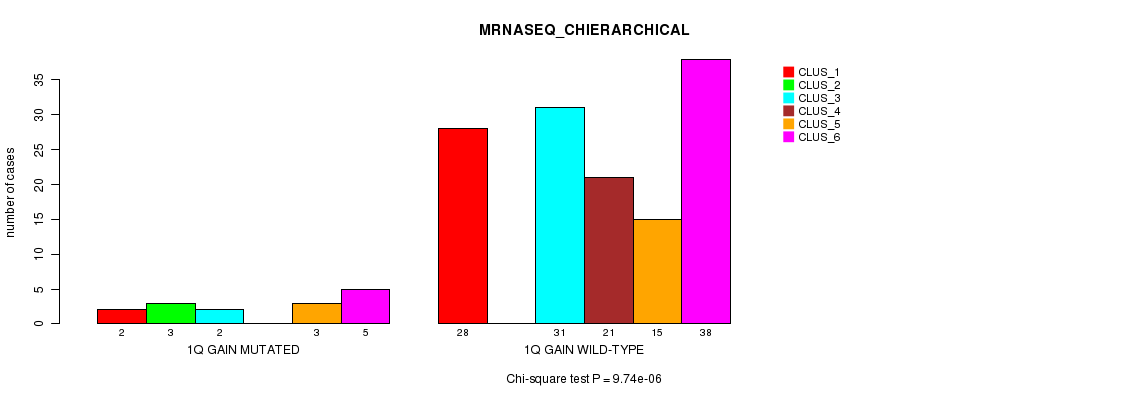
1q gain cnv correlated to 'CN_CNMF' and 'MRNASEQ_CHIERARCHICAL'.
-
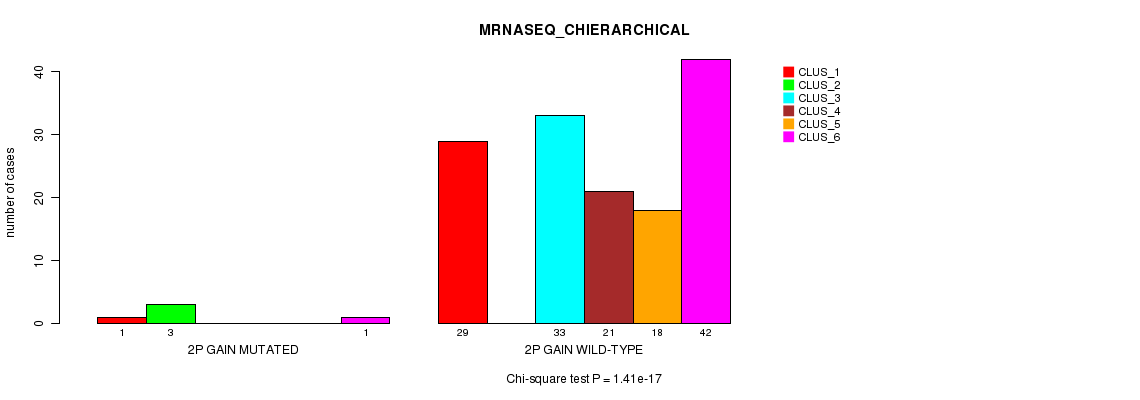
2p gain cnv correlated to 'MRNASEQ_CHIERARCHICAL'.
-
2q gain cnv correlated to 'MIR_CNMF' and 'MRNASEQ_CHIERARCHICAL'.
-
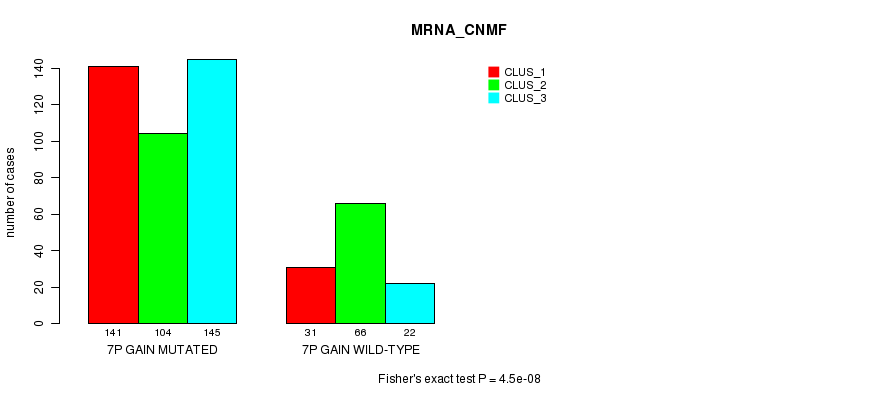
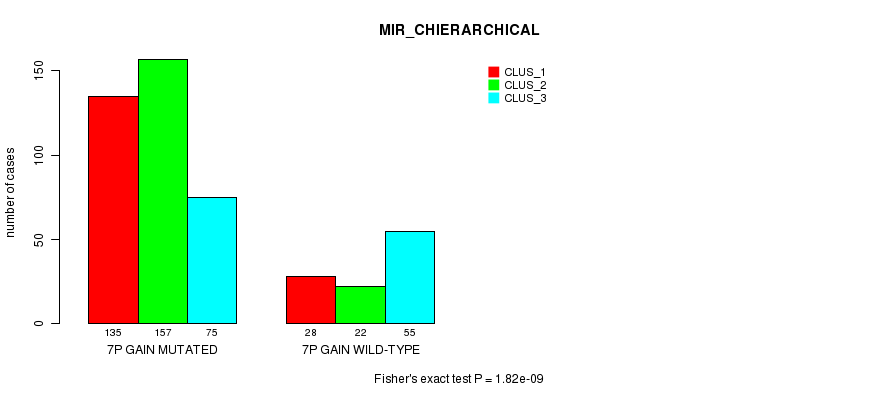
7p gain cnv correlated to 'MRNA_CNMF', 'MRNA_CHIERARCHICAL', 'MIR_CHIERARCHICAL', and 'CN_CNMF'.
-
7q gain cnv correlated to 'MRNA_CNMF', 'MRNA_CHIERARCHICAL', 'MIR_CHIERARCHICAL', and 'CN_CNMF'.
-
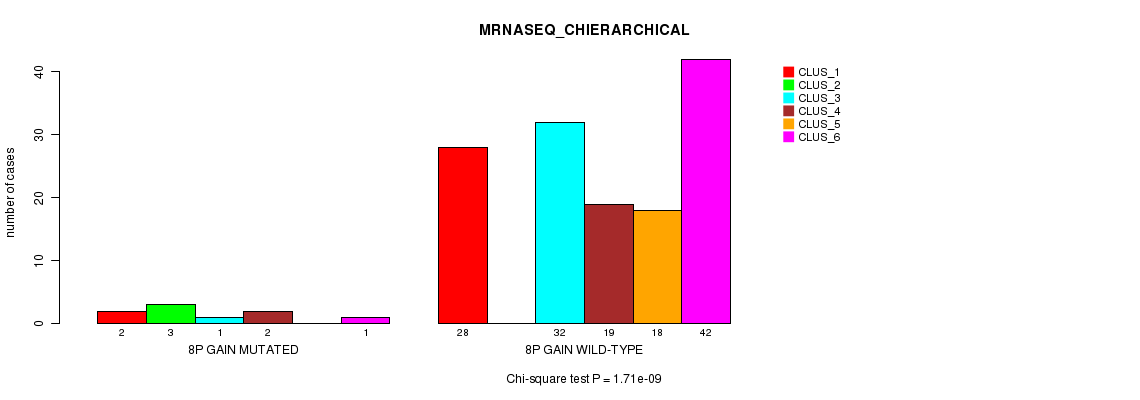
8p gain cnv correlated to 'MRNASEQ_CHIERARCHICAL'.
-
8q gain cnv correlated to 'MRNASEQ_CHIERARCHICAL'.
-
18p gain cnv correlated to 'CN_CNMF'.
-
18q gain cnv correlated to 'CN_CNMF'.
-
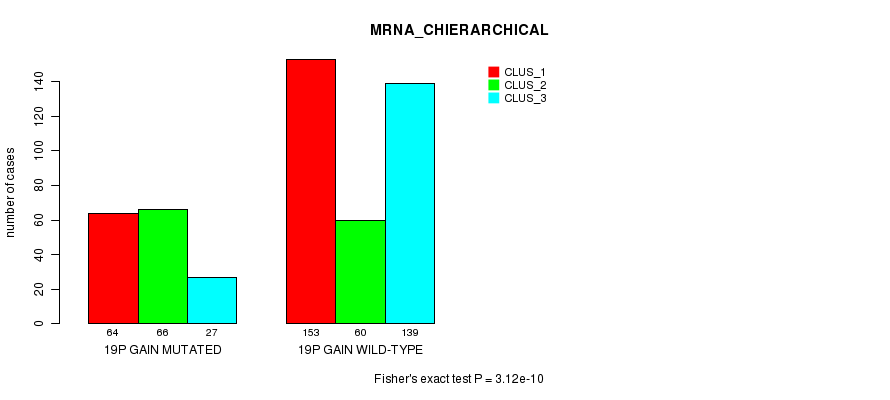
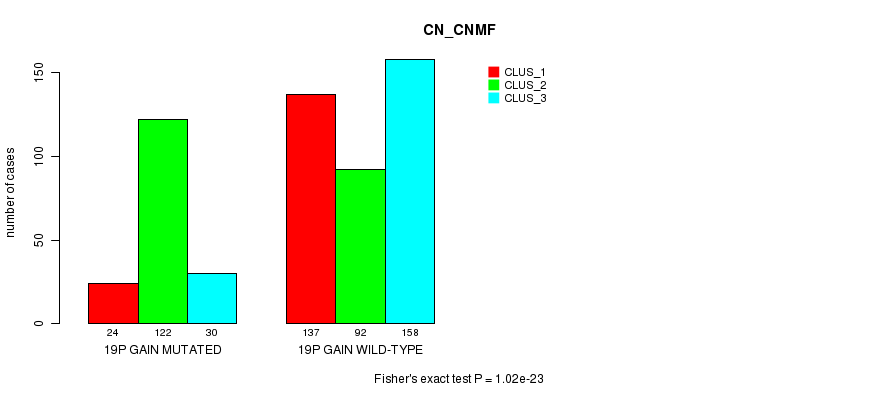
19p gain cnv correlated to 'MRNA_CNMF', 'MRNA_CHIERARCHICAL', 'MIR_CHIERARCHICAL', 'CN_CNMF', 'RPPA_CHIERARCHICAL', and 'MRNASEQ_CHIERARCHICAL'.
-
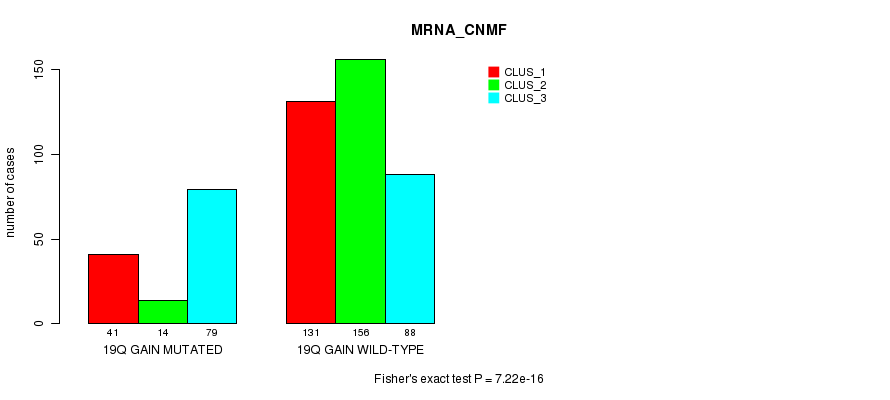
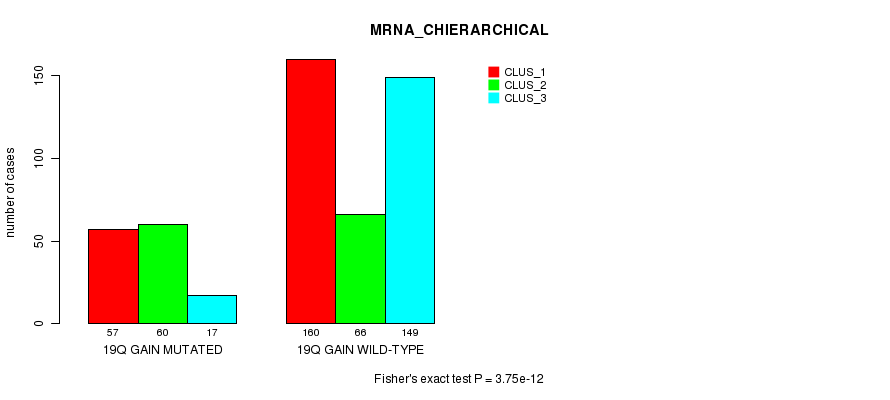
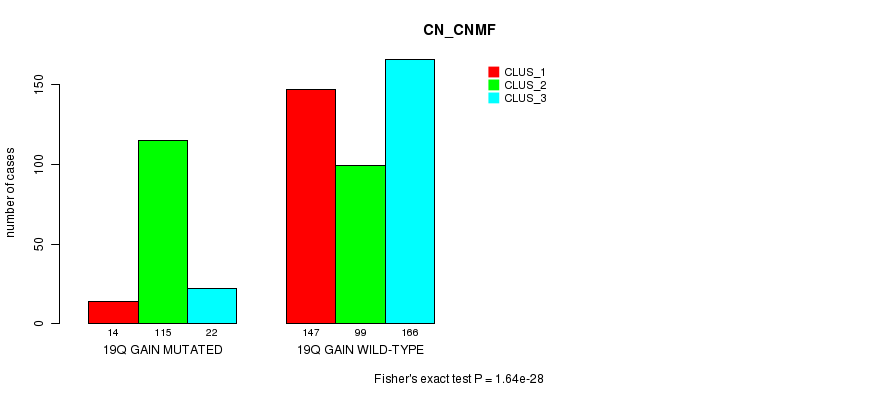
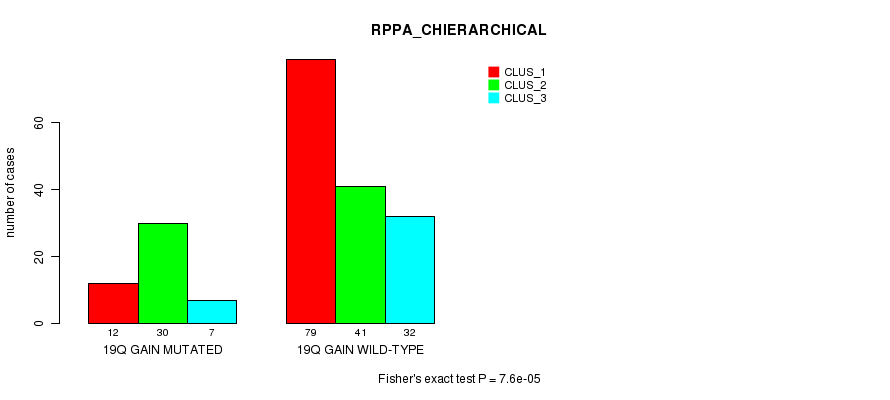
19q gain cnv correlated to 'MRNA_CNMF', 'MRNA_CHIERARCHICAL', 'MIR_CHIERARCHICAL', 'CN_CNMF', 'RPPA_CHIERARCHICAL', 'MRNASEQ_CNMF', and 'MRNASEQ_CHIERARCHICAL'.
-
20p gain cnv correlated to 'MRNA_CNMF', 'MRNA_CHIERARCHICAL', 'MIR_CHIERARCHICAL', and 'CN_CNMF'.
-
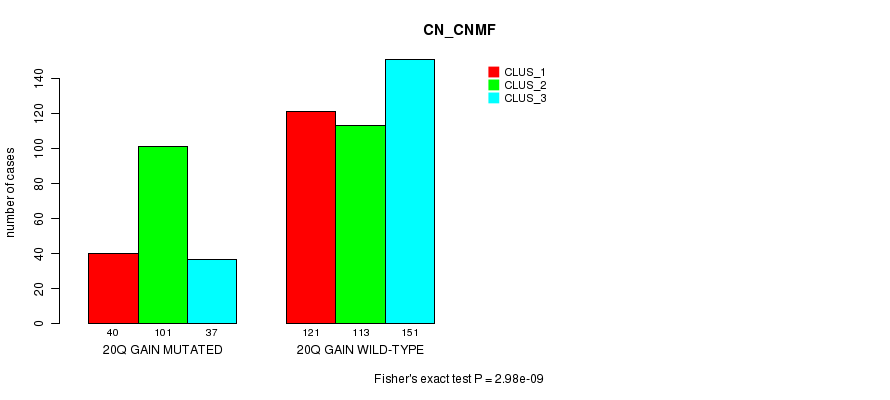
20q gain cnv correlated to 'MRNA_CNMF', 'MRNA_CHIERARCHICAL', 'MIR_CHIERARCHICAL', 'CN_CNMF', and 'MRNASEQ_CHIERARCHICAL'.
-
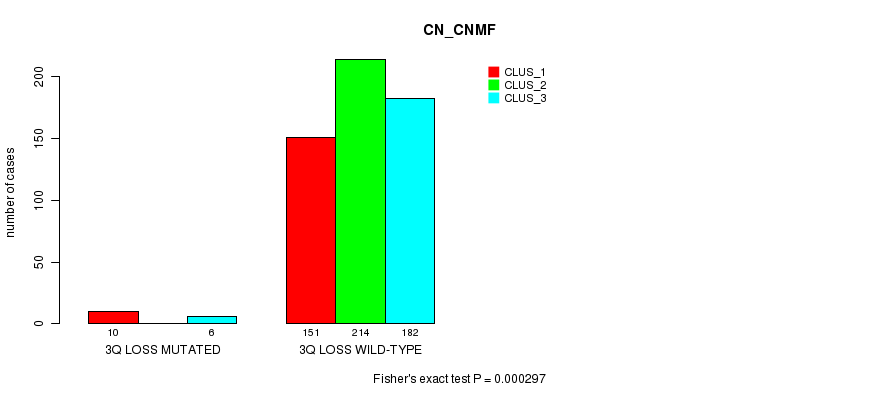
3q loss cnv correlated to 'CN_CNMF'.
-
5q loss cnv correlated to 'MRNASEQ_CHIERARCHICAL'.
-
6p loss cnv correlated to 'CN_CNMF'.
-
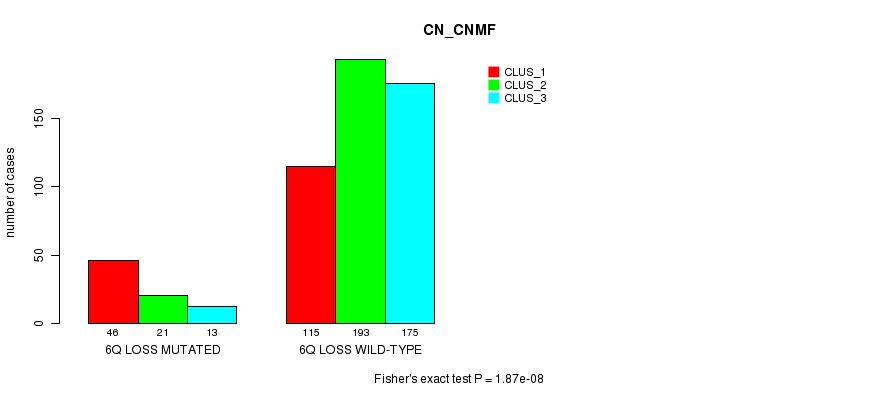
6q loss cnv correlated to 'CN_CNMF'.
-
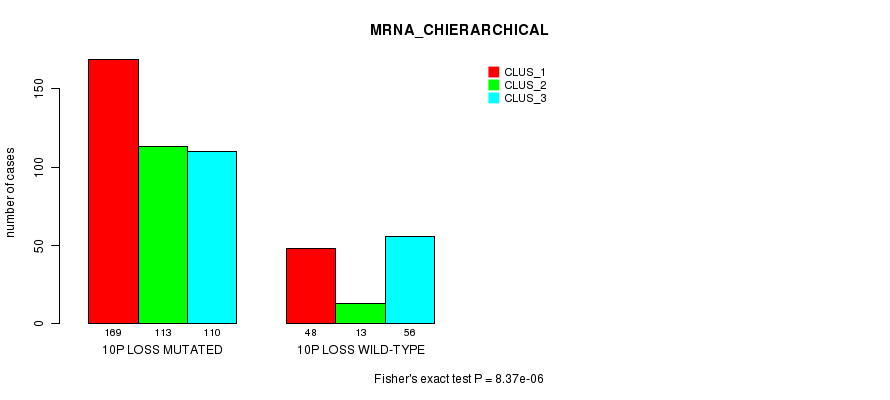
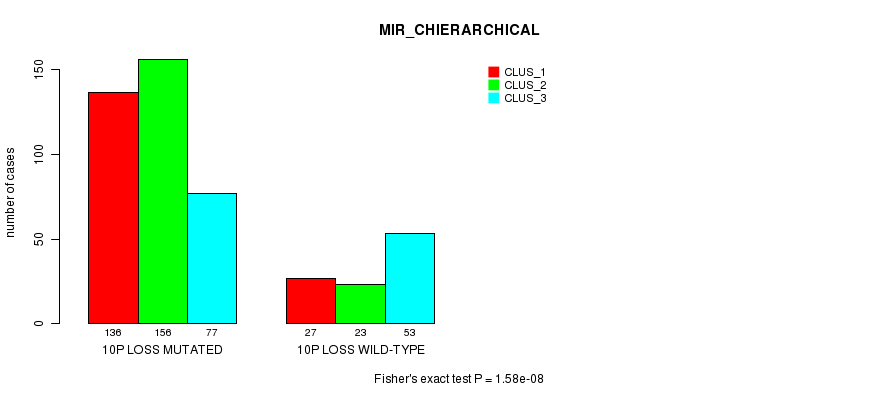
10p loss cnv correlated to 'MRNA_CNMF', 'MRNA_CHIERARCHICAL', 'MIR_CHIERARCHICAL', 'CN_CNMF', and 'RPPA_CHIERARCHICAL'.
-
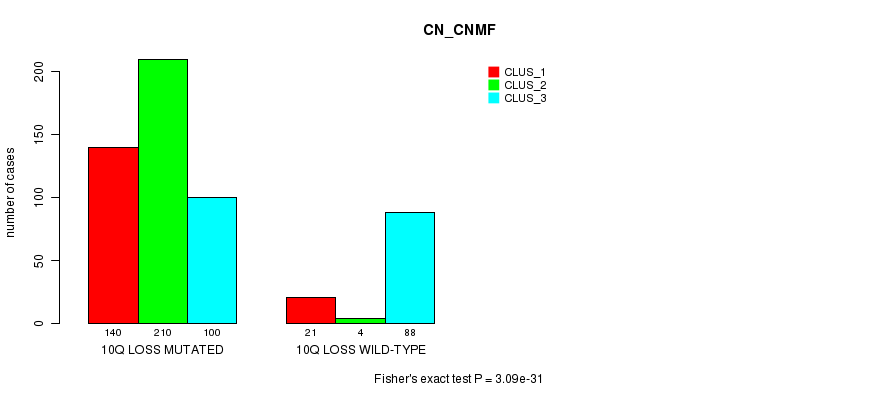
10q loss cnv correlated to 'MRNA_CNMF', 'MRNA_CHIERARCHICAL', 'MIR_CHIERARCHICAL', 'CN_CNMF', and 'RPPA_CNMF'.
-
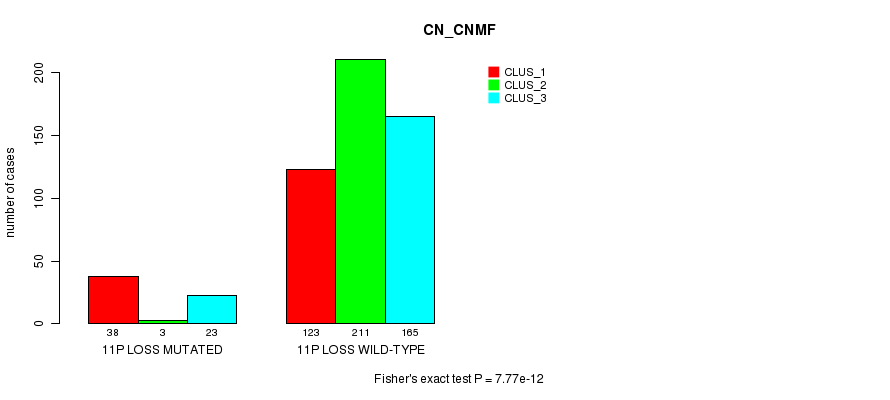
11p loss cnv correlated to 'MRNA_CNMF', 'MRNA_CHIERARCHICAL', 'MIR_CHIERARCHICAL', and 'CN_CNMF'.
-
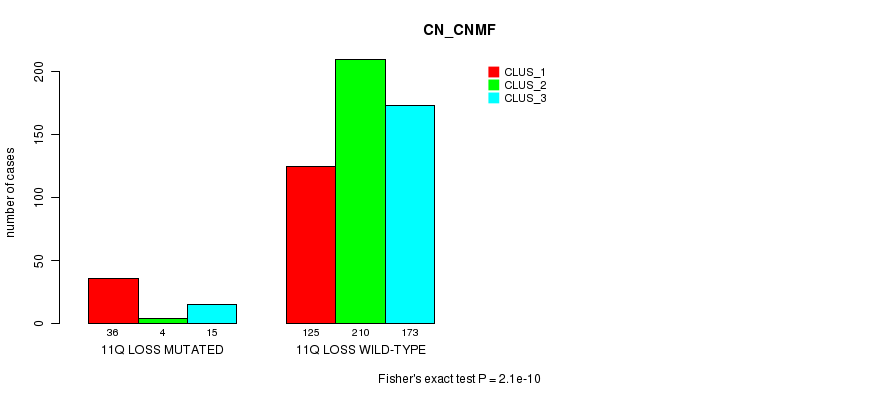
11q loss cnv correlated to 'MRNA_CNMF' and 'CN_CNMF'.
-
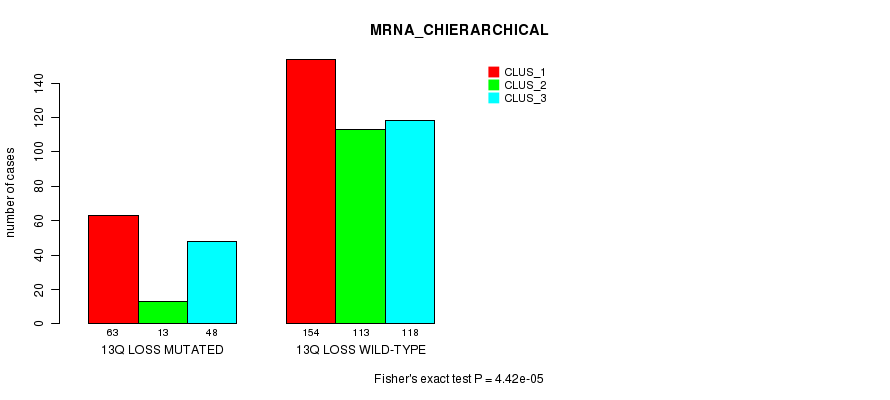
13q loss cnv correlated to 'MRNA_CHIERARCHICAL' and 'CN_CNMF'.
-
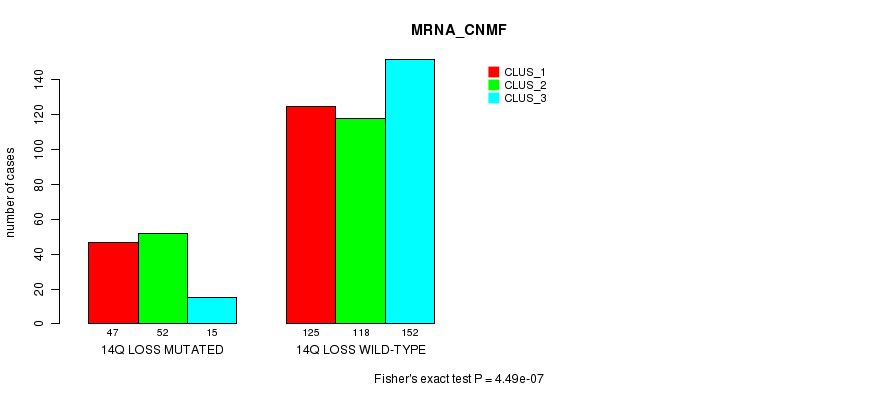
14q loss cnv correlated to 'MRNA_CNMF' and 'CN_CNMF'.
-
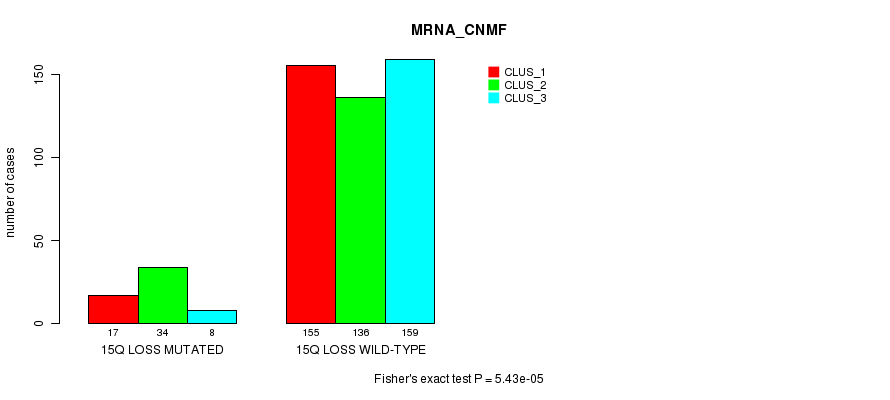
15q loss cnv correlated to 'MRNA_CNMF', 'MRNA_CHIERARCHICAL', 'MIR_CHIERARCHICAL', 'CN_CNMF', 'METHLYATION_CNMF', and 'MRNASEQ_CHIERARCHICAL'.
-
17p loss cnv correlated to 'CN_CNMF'.
-
22q loss cnv correlated to 'CN_CNMF'.
Table 1. Get Full Table Overview of the association between significant copy number variation of 79 arm-level results and 10 molecular subtypes. Shown in the table are P values (Q values). Thresholded by Q value < 0.25, 72 significant findings detected.
|
Molecular subtypes |
MRNA CNMF |
MRNA CHIERARCHICAL |
MIR CNMF |
MIR CHIERARCHICAL |
CN CNMF |
METHLYATION CNMF |
RPPA CNMF |
RPPA CHIERARCHICAL |
MRNASEQ CNMF |
MRNASEQ CHIERARCHICAL |
||
| nCNV (%) | nWild-Type | Fisher's exact test | Fisher's exact test | Fisher's exact test | Fisher's exact test | Fisher's exact test | Fisher's exact test | Fisher's exact test | Fisher's exact test | Chi-square test | Chi-square test | |
| 19q gain | 151 (27%) | 412 |
7.22e-16 (4.98e-13) |
3.75e-12 (2.56e-09) |
0.0671 (1.00) |
2.31e-05 (0.0149) |
1.64e-28 (1.14e-25) |
0.0112 (1.00) |
0.04 (1.00) |
7.6e-05 (0.0487) |
0.000315 (0.198) |
6.39e-07 (0.000425) |
| 19p gain | 176 (31%) | 387 |
2.15e-14 (1.48e-11) |
3.12e-10 (2.11e-07) |
0.236 (1.00) |
0.000117 (0.0745) |
1.02e-23 (7.09e-21) |
0.000451 (0.282) |
0.0126 (1.00) |
9.62e-05 (0.0615) |
0.000511 (0.318) |
4.39e-06 (0.00289) |
| 15q loss | 62 (11%) | 501 |
5.43e-05 (0.0349) |
0.000315 (0.198) |
0.000622 (0.386) |
4.06e-06 (0.00267) |
6.26e-06 (0.00409) |
0.000258 (0.163) |
0.122 (1.00) |
0.00643 (1.00) |
0.00768 (1.00) |
0.000145 (0.092) |
| 20q gain | 178 (32%) | 385 |
3.25e-13 (2.22e-10) |
4.38e-11 (2.98e-08) |
0.157 (1.00) |
6.8e-06 (0.00443) |
2.98e-09 (2.01e-06) |
0.011 (1.00) |
0.0665 (1.00) |
0.00831 (1.00) |
0.00802 (1.00) |
0.000273 (0.172) |
| 10p loss | 437 (78%) | 126 |
1.2e-06 (0.000793) |
8.37e-06 (0.00544) |
0.0358 (1.00) |
1.58e-08 (1.06e-05) |
1.8e-28 (1.25e-25) |
0.00348 (1.00) |
0.000677 (0.419) |
0.000111 (0.0704) |
0.208 (1.00) |
0.032 (1.00) |
| 10q loss | 450 (80%) | 113 |
2.16e-06 (0.00143) |
4.5e-06 (0.00295) |
0.0242 (1.00) |
7.65e-06 (0.00498) |
3.09e-31 (2.15e-28) |
0.00202 (1.00) |
8.72e-05 (0.0558) |
0.00166 (1.00) |
0.51 (1.00) |
0.056 (1.00) |
| 7p gain | 434 (77%) | 129 |
4.5e-08 (3e-05) |
7.2e-07 (0.000478) |
0.000718 (0.443) |
1.82e-09 (1.23e-06) |
2e-16 (1.38e-13) |
0.0011 (0.673) |
0.00184 (1.00) |
0.238 (1.00) |
0.0444 (1.00) |
0.00541 (1.00) |
| 7q gain | 439 (78%) | 124 |
3.49e-06 (0.0023) |
1.75e-05 (0.0113) |
0.00102 (0.625) |
1.56e-06 (0.00103) |
9.36e-15 (6.44e-12) |
0.00348 (1.00) |
0.0239 (1.00) |
0.117 (1.00) |
0.0327 (1.00) |
0.00714 (1.00) |
| 20p gain | 180 (32%) | 383 |
2.17e-13 (1.49e-10) |
3.72e-12 (2.54e-09) |
0.201 (1.00) |
6.21e-05 (0.0398) |
1.54e-09 (1.04e-06) |
0.0645 (1.00) |
0.111 (1.00) |
0.0136 (1.00) |
0.0158 (1.00) |
0.000628 (0.389) |
| 11p loss | 64 (11%) | 499 |
1.2e-07 (7.99e-05) |
6.61e-06 (0.00432) |
0.0946 (1.00) |
2.43e-06 (0.00161) |
7.77e-12 (5.29e-09) |
0.00107 (0.655) |
0.721 (1.00) |
0.0947 (1.00) |
0.0342 (1.00) |
0.0741 (1.00) |
| 1q gain | 45 (8%) | 518 |
0.621 (1.00) |
0.116 (1.00) |
0.44 (1.00) |
0.343 (1.00) |
2.64e-08 (1.77e-05) |
0.295 (1.00) |
0.539 (1.00) |
0.887 (1.00) |
0.0876 (1.00) |
9.74e-06 (0.00632) |
| 2q gain | 18 (3%) | 545 |
0.173 (1.00) |
0.447 (1.00) |
3.9e-05 (0.0252) |
0.0743 (1.00) |
0.372 (1.00) |
0.46 (1.00) |
0.5 (1.00) |
0.886 (1.00) |
0.147 (1.00) |
2.7e-22 (1.87e-19) |
| 11q loss | 55 (10%) | 508 |
9.72e-05 (0.062) |
0.00427 (1.00) |
0.512 (1.00) |
0.00501 (1.00) |
2.1e-10 (1.42e-07) |
0.254 (1.00) |
0.622 (1.00) |
0.198 (1.00) |
0.348 (1.00) |
0.328 (1.00) |
| 13q loss | 138 (25%) | 425 |
0.000801 (0.492) |
4.42e-05 (0.0285) |
0.569 (1.00) |
0.647 (1.00) |
4.3e-13 (2.94e-10) |
0.00114 (0.698) |
0.658 (1.00) |
0.01 (1.00) |
0.341 (1.00) |
0.0161 (1.00) |
| 14q loss | 121 (21%) | 442 |
4.49e-07 (0.000299) |
0.025 (1.00) |
0.595 (1.00) |
0.714 (1.00) |
8.63e-34 (6.02e-31) |
0.0159 (1.00) |
0.561 (1.00) |
0.133 (1.00) |
0.0272 (1.00) |
0.0272 (1.00) |
| 1p gain | 40 (7%) | 523 |
0.681 (1.00) |
0.0934 (1.00) |
0.934 (1.00) |
0.0651 (1.00) |
1.1e-05 (0.00714) |
0.388 (1.00) |
0.27 (1.00) |
1 (1.00) |
0.0956 (1.00) |
0.421 (1.00) |
| 2p gain | 20 (4%) | 543 |
0.11 (1.00) |
0.786 (1.00) |
0.002 (1.00) |
0.128 (1.00) |
0.252 (1.00) |
0.46 (1.00) |
0.684 (1.00) |
0.641 (1.00) |
0.348 (1.00) |
1.41e-17 (9.76e-15) |
| 8p gain | 26 (5%) | 537 |
0.00124 (0.754) |
0.0814 (1.00) |
0.335 (1.00) |
0.00812 (1.00) |
0.0015 (0.907) |
0.15 (1.00) |
0.0671 (1.00) |
0.0194 (1.00) |
0.442 (1.00) |
1.71e-09 (1.16e-06) |
| 8q gain | 31 (6%) | 532 |
0.000511 (0.318) |
0.0416 (1.00) |
0.286 (1.00) |
0.00535 (1.00) |
0.00362 (1.00) |
0.0434 (1.00) |
0.0671 (1.00) |
0.0194 (1.00) |
0.412 (1.00) |
3.66e-08 (2.45e-05) |
| 18p gain | 28 (5%) | 535 |
0.501 (1.00) |
0.188 (1.00) |
0.509 (1.00) |
0.364 (1.00) |
0.000326 (0.204) |
0.313 (1.00) |
0.398 (1.00) |
0.259 (1.00) |
0.0195 (1.00) |
0.0135 (1.00) |
| 18q gain | 30 (5%) | 533 |
0.11 (1.00) |
0.186 (1.00) |
0.356 (1.00) |
0.597 (1.00) |
0.000159 (0.101) |
0.313 (1.00) |
0.768 (1.00) |
0.179 (1.00) |
0.00815 (1.00) |
0.00591 (1.00) |
| 3q loss | 16 (3%) | 547 |
0.643 (1.00) |
0.473 (1.00) |
0.0271 (1.00) |
0.383 (1.00) |
0.000297 (0.187) |
0.806 (1.00) |
1 (1.00) |
0.438 (1.00) |
0.00512 (1.00) |
|
| 5q loss | 20 (4%) | 543 |
0.0743 (1.00) |
0.872 (1.00) |
0.304 (1.00) |
0.122 (1.00) |
0.0512 (1.00) |
0.0858 (1.00) |
0.873 (1.00) |
1 (1.00) |
0.583 (1.00) |
0.00014 (0.0892) |
| 6p loss | 47 (8%) | 516 |
0.98 (1.00) |
0.553 (1.00) |
0.375 (1.00) |
0.538 (1.00) |
2.84e-09 (1.91e-06) |
0.622 (1.00) |
0.949 (1.00) |
0.85 (1.00) |
0.857 (1.00) |
0.863 (1.00) |
| 6q loss | 80 (14%) | 483 |
0.672 (1.00) |
0.58 (1.00) |
0.462 (1.00) |
0.112 (1.00) |
1.87e-08 (1.25e-05) |
0.0853 (1.00) |
0.902 (1.00) |
0.295 (1.00) |
0.963 (1.00) |
0.89 (1.00) |
| 17p loss | 36 (6%) | 527 |
0.429 (1.00) |
0.62 (1.00) |
0.835 (1.00) |
0.633 (1.00) |
5.94e-06 (0.00389) |
0.18 (1.00) |
0.061 (1.00) |
0.436 (1.00) |
0.735 (1.00) |
0.304 (1.00) |
| 22q loss | 140 (25%) | 423 |
0.809 (1.00) |
1 (1.00) |
0.511 (1.00) |
0.886 (1.00) |
0.000148 (0.0937) |
0.275 (1.00) |
0.659 (1.00) |
0.525 (1.00) |
0.376 (1.00) |
0.0141 (1.00) |
| 3p gain | 30 (5%) | 533 |
0.0036 (1.00) |
0.0573 (1.00) |
0.551 (1.00) |
0.677 (1.00) |
0.0193 (1.00) |
0.15 (1.00) |
0.418 (1.00) |
0.0686 (1.00) |
0.7 (1.00) |
0.233 (1.00) |
| 3q gain | 30 (5%) | 533 |
0.0036 (1.00) |
0.0573 (1.00) |
0.551 (1.00) |
0.907 (1.00) |
0.0473 (1.00) |
0.15 (1.00) |
0.418 (1.00) |
0.0686 (1.00) |
0.637 (1.00) |
0.377 (1.00) |
| 4p gain | 15 (3%) | 548 |
0.747 (1.00) |
0.656 (1.00) |
0.382 (1.00) |
0.0456 (1.00) |
0.29 (1.00) |
0.47 (1.00) |
0.174 (1.00) |
|||
| 4q gain | 14 (2%) | 549 |
0.733 (1.00) |
0.633 (1.00) |
0.206 (1.00) |
0.0828 (1.00) |
0.193 (1.00) |
0.47 (1.00) |
0.174 (1.00) |
|||
| 5p gain | 30 (5%) | 533 |
0.112 (1.00) |
0.31 (1.00) |
0.241 (1.00) |
0.353 (1.00) |
0.0037 (1.00) |
0.147 (1.00) |
0.41 (1.00) |
0.0294 (1.00) |
0.156 (1.00) |
|
| 5q gain | 23 (4%) | 540 |
0.0427 (1.00) |
0.183 (1.00) |
0.0508 (1.00) |
0.0905 (1.00) |
0.0152 (1.00) |
0.148 (1.00) |
0.476 (1.00) |
|||
| 6p gain | 7 (1%) | 556 |
0.79 (1.00) |
0.769 (1.00) |
0.657 (1.00) |
0.395 (1.00) |
0.161 (1.00) |
|||||
| 6q gain | 9 (2%) | 554 |
0.237 (1.00) |
0.601 (1.00) |
0.595 (1.00) |
0.746 (1.00) |
0.0295 (1.00) |
|||||
| 9p gain | 17 (3%) | 546 |
0.234 (1.00) |
0.0394 (1.00) |
0.738 (1.00) |
0.56 (1.00) |
0.0422 (1.00) |
0.544 (1.00) |
0.229 (1.00) |
0.847 (1.00) |
0.355 (1.00) |
0.347 (1.00) |
| 9q gain | 34 (6%) | 529 |
0.431 (1.00) |
0.0317 (1.00) |
0.619 (1.00) |
0.739 (1.00) |
0.169 (1.00) |
1 (1.00) |
0.433 (1.00) |
0.478 (1.00) |
0.217 (1.00) |
0.291 (1.00) |
| 10p gain | 12 (2%) | 551 |
0.00052 (0.323) |
0.00472 (1.00) |
0.0911 (1.00) |
0.00145 (0.877) |
0.00123 (0.749) |
0.307 (1.00) |
0.258 (1.00) |
|||
| 11p gain | 4 (1%) | 559 |
1 (1.00) |
1 (1.00) |
0.682 (1.00) |
0.497 (1.00) |
0.259 (1.00) |
|||||
| 11q gain | 7 (1%) | 556 |
0.152 (1.00) |
0.209 (1.00) |
0.265 (1.00) |
0.0781 (1.00) |
0.161 (1.00) |
1 (1.00) |
0.14 (1.00) |
|||
| 12p gain | 43 (8%) | 520 |
0.413 (1.00) |
0.201 (1.00) |
1 (1.00) |
0.265 (1.00) |
0.00126 (0.766) |
0.446 (1.00) |
0.342 (1.00) |
1 (1.00) |
0.00635 (1.00) |
0.246 (1.00) |
| 12q gain | 33 (6%) | 530 |
0.32 (1.00) |
0.0664 (1.00) |
0.993 (1.00) |
0.209 (1.00) |
0.00567 (1.00) |
0.634 (1.00) |
0.517 (1.00) |
0.362 (1.00) |
0.0317 (1.00) |
0.184 (1.00) |
| 13q gain | 3 (1%) | 560 |
0.777 (1.00) |
0.792 (1.00) |
0.156 (1.00) |
0.497 (1.00) |
0.289 (1.00) |
0.8 (1.00) |
0.577 (1.00) |
|||
| 14q gain | 7 (1%) | 556 |
0.706 (1.00) |
0.674 (1.00) |
0.0567 (1.00) |
0.564 (1.00) |
0.638 (1.00) |
|||||
| 15q gain | 6 (1%) | 557 |
0.379 (1.00) |
0.536 (1.00) |
0.512 (1.00) |
0.588 (1.00) |
0.0126 (1.00) |
|||||
| 16p gain | 18 (3%) | 545 |
0.0318 (1.00) |
0.297 (1.00) |
0.6 (1.00) |
0.263 (1.00) |
0.0155 (1.00) |
0.34 (1.00) |
0.0473 (1.00) |
|||
| 16q gain | 18 (3%) | 545 |
0.048 (1.00) |
0.253 (1.00) |
0.439 (1.00) |
0.0325 (1.00) |
0.0155 (1.00) |
0.433 (1.00) |
0.0473 (1.00) |
|||
| 17p gain | 11 (2%) | 552 |
0.0188 (1.00) |
0.389 (1.00) |
0.721 (1.00) |
0.349 (1.00) |
0.108 (1.00) |
1 (1.00) |
0.423 (1.00) |
|||
| 17q gain | 19 (3%) | 544 |
0.22 (1.00) |
1 (1.00) |
0.806 (1.00) |
0.609 (1.00) |
0.0584 (1.00) |
0.785 (1.00) |
0.258 (1.00) |
0.321 (1.00) |
0.0799 (1.00) |
|
| 21q gain | 36 (6%) | 527 |
0.00268 (1.00) |
0.0318 (1.00) |
0.00816 (1.00) |
0.00191 (1.00) |
0.0469 (1.00) |
0.449 (1.00) |
0.698 (1.00) |
0.0345 (1.00) |
0.00074 (0.456) |
|
| 22q gain | 11 (2%) | 552 |
0.0378 (1.00) |
0.143 (1.00) |
0.127 (1.00) |
0.48 (1.00) |
0.0767 (1.00) |
1 (1.00) |
0.14 (1.00) |
|||
| Xq gain | 4 (1%) | 559 |
0.331 (1.00) |
0.468 (1.00) |
0.757 (1.00) |
0.259 (1.00) |
0.0702 (1.00) |
|||||
| 1p loss | 5 (1%) | 558 |
0.849 (1.00) |
0.823 (1.00) |
1 (1.00) |
0.0996 (1.00) |
0.532 (1.00) |
|||||
| 1q loss | 4 (1%) | 559 |
0.218 (1.00) |
1 (1.00) |
0.682 (1.00) |
1 (1.00) |
1 (1.00) |
|||||
| 2p loss | 10 (2%) | 553 |
0.0274 (1.00) |
0.0705 (1.00) |
0.656 (1.00) |
0.112 (1.00) |
0.163 (1.00) |
0.135 (1.00) |
0.724 (1.00) |
0.847 (1.00) |
0.0785 (1.00) |
0.0342 (1.00) |
| 2q loss | 9 (2%) | 554 |
0.035 (1.00) |
0.071 (1.00) |
0.236 (1.00) |
0.0562 (1.00) |
0.183 (1.00) |
0.135 (1.00) |
0.724 (1.00) |
0.847 (1.00) |
0.0785 (1.00) |
0.0342 (1.00) |
| 3p loss | 22 (4%) | 541 |
0.854 (1.00) |
0.513 (1.00) |
0.582 (1.00) |
0.502 (1.00) |
0.00763 (1.00) |
0.15 (1.00) |
0.0763 (1.00) |
0.824 (1.00) |
0.711 (1.00) |
0.431 (1.00) |
| 4p loss | 26 (5%) | 537 |
0.0199 (1.00) |
0.669 (1.00) |
0.175 (1.00) |
0.0211 (1.00) |
0.876 (1.00) |
0.761 (1.00) |
0.0842 (1.00) |
0.495 (1.00) |
0.0543 (1.00) |
0.768 (1.00) |
| 4q loss | 25 (4%) | 538 |
0.0426 (1.00) |
0.644 (1.00) |
0.162 (1.00) |
0.145 (1.00) |
0.101 (1.00) |
0.701 (1.00) |
0.084 (1.00) |
0.639 (1.00) |
0.781 (1.00) |
0.0772 (1.00) |
| 5p loss | 21 (4%) | 542 |
0.00423 (1.00) |
0.0947 (1.00) |
0.186 (1.00) |
0.0966 (1.00) |
0.11 (1.00) |
0.0858 (1.00) |
0.469 (1.00) |
0.698 (1.00) |
0.464 (1.00) |
0.0601 (1.00) |
| 7p loss | 5 (1%) | 558 |
0.542 (1.00) |
0.453 (1.00) |
0.81 (1.00) |
0.0341 (1.00) |
0.532 (1.00) |
|||||
| 7q loss | 4 (1%) | 559 |
0.849 (1.00) |
0.823 (1.00) |
1 (1.00) |
0.0996 (1.00) |
0.833 (1.00) |
|||||
| 8p loss | 34 (6%) | 529 |
0.894 (1.00) |
0.593 (1.00) |
0.783 (1.00) |
0.239 (1.00) |
0.272 (1.00) |
0.134 (1.00) |
0.664 (1.00) |
0.698 (1.00) |
0.408 (1.00) |
0.838 (1.00) |
| 8q loss | 21 (4%) | 542 |
0.717 (1.00) |
0.144 (1.00) |
0.384 (1.00) |
0.185 (1.00) |
0.0154 (1.00) |
0.211 (1.00) |
0.331 (1.00) |
0.353 (1.00) |
0.21 (1.00) |
|
| 9p loss | 164 (29%) | 399 |
0.0137 (1.00) |
0.00133 (0.808) |
0.832 (1.00) |
0.147 (1.00) |
0.227 (1.00) |
0.921 (1.00) |
0.284 (1.00) |
0.212 (1.00) |
0.0773 (1.00) |
0.0594 (1.00) |
| 9q loss | 63 (11%) | 500 |
0.0461 (1.00) |
0.0252 (1.00) |
0.564 (1.00) |
0.262 (1.00) |
0.0587 (1.00) |
0.552 (1.00) |
0.037 (1.00) |
0.0244 (1.00) |
0.404 (1.00) |
0.603 (1.00) |
| 12p loss | 38 (7%) | 525 |
0.0116 (1.00) |
0.0172 (1.00) |
0.151 (1.00) |
0.0306 (1.00) |
0.756 (1.00) |
0.425 (1.00) |
0.0898 (1.00) |
0.166 (1.00) |
0.774 (1.00) |
0.597 (1.00) |
| 12q loss | 35 (6%) | 528 |
0.00882 (1.00) |
0.0185 (1.00) |
0.61 (1.00) |
0.0536 (1.00) |
0.127 (1.00) |
0.14 (1.00) |
0.0852 (1.00) |
0.362 (1.00) |
0.404 (1.00) |
0.261 (1.00) |
| 16p loss | 23 (4%) | 540 |
0.2 (1.00) |
0.684 (1.00) |
0.46 (1.00) |
0.793 (1.00) |
0.127 (1.00) |
0.397 (1.00) |
0.644 (1.00) |
0.641 (1.00) |
0.736 (1.00) |
0.33 (1.00) |
| 16q loss | 41 (7%) | 522 |
0.112 (1.00) |
0.0209 (1.00) |
0.122 (1.00) |
0.52 (1.00) |
0.287 (1.00) |
0.228 (1.00) |
0.0793 (1.00) |
0.807 (1.00) |
0.882 (1.00) |
0.699 (1.00) |
| 17q loss | 19 (3%) | 544 |
0.39 (1.00) |
0.136 (1.00) |
0.402 (1.00) |
0.347 (1.00) |
0.0017 (1.00) |
0.212 (1.00) |
0.608 (1.00) |
0.0771 (1.00) |
0.0155 (1.00) |
|
| 18p loss | 44 (8%) | 519 |
0.0244 (1.00) |
0.0871 (1.00) |
0.504 (1.00) |
0.712 (1.00) |
0.00156 (0.943) |
0.0747 (1.00) |
0.252 (1.00) |
0.101 (1.00) |
0.355 (1.00) |
0.482 (1.00) |
| 18q loss | 39 (7%) | 524 |
0.28 (1.00) |
0.381 (1.00) |
0.337 (1.00) |
0.923 (1.00) |
0.0795 (1.00) |
0.0599 (1.00) |
0.159 (1.00) |
0.253 (1.00) |
0.833 (1.00) |
0.825 (1.00) |
| 19p loss | 13 (2%) | 550 |
0.00284 (1.00) |
0.024 (1.00) |
0.000418 (0.261) |
0.00738 (1.00) |
0.158 (1.00) |
0.592 (1.00) |
0.345 (1.00) |
0.351 (1.00) |
0.0414 (1.00) |
0.0227 (1.00) |
| 19q loss | 18 (3%) | 545 |
0.00902 (1.00) |
0.047 (1.00) |
0.00964 (1.00) |
0.00144 (0.872) |
0.0738 (1.00) |
0.592 (1.00) |
0.345 (1.00) |
0.351 (1.00) |
0.123 (1.00) |
0.0876 (1.00) |
| 20p loss | 11 (2%) | 552 |
0.054 (1.00) |
0.129 (1.00) |
0.116 (1.00) |
0.0621 (1.00) |
0.00377 (1.00) |
0.449 (1.00) |
0.187 (1.00) |
|||
| 20q loss | 10 (2%) | 553 |
0.0789 (1.00) |
0.171 (1.00) |
0.656 (1.00) |
0.399 (1.00) |
0.019 (1.00) |
0.449 (1.00) |
0.187 (1.00) |
|||
| 21q loss | 25 (4%) | 538 |
0.0133 (1.00) |
0.0152 (1.00) |
0.0903 (1.00) |
0.0121 (1.00) |
0.0284 (1.00) |
0.219 (1.00) |
0.0223 (1.00) |
0.364 (1.00) |
0.129 (1.00) |
0.378 (1.00) |
| Xq loss | 11 (2%) | 552 |
0.443 (1.00) |
0.468 (1.00) |
0.116 (1.00) |
0.37 (1.00) |
0.153 (1.00) |
1 (1.00) |
0.296 (1.00) |
0.788 (1.00) |
0.0626 (1.00) |
P value = 1.1e-05 (Fisher's exact test), Q value = 0.0071
Table S1. Gene #1: '1p gain mutation analysis' versus Clinical Feature #5: 'CN_CNMF'
| nPatients | CLUS_1 | CLUS_2 | CLUS_3 |
|---|---|---|---|
| ALL | 161 | 214 | 188 |
| 1P GAIN MUTATED | 25 | 6 | 9 |
| 1P GAIN WILD-TYPE | 136 | 208 | 179 |
Figure S1. Get High-res Image Gene #1: '1p gain mutation analysis' versus Clinical Feature #5: 'CN_CNMF'

P value = 2.64e-08 (Fisher's exact test), Q value = 1.8e-05
Table S2. Gene #2: '1q gain mutation analysis' versus Clinical Feature #5: 'CN_CNMF'
| nPatients | CLUS_1 | CLUS_2 | CLUS_3 |
|---|---|---|---|
| ALL | 161 | 214 | 188 |
| 1Q GAIN MUTATED | 30 | 4 | 11 |
| 1Q GAIN WILD-TYPE | 131 | 210 | 177 |
Figure S2. Get High-res Image Gene #2: '1q gain mutation analysis' versus Clinical Feature #5: 'CN_CNMF'

P value = 9.74e-06 (Chi-square test), Q value = 0.0063
Table S3. Gene #2: '1q gain mutation analysis' versus Clinical Feature #10: 'MRNASEQ_CHIERARCHICAL'
| nPatients | CLUS_1 | CLUS_2 | CLUS_3 | CLUS_4 | CLUS_5 | CLUS_6 |
|---|---|---|---|---|---|---|
| ALL | 30 | 3 | 33 | 21 | 18 | 43 |
| 1Q GAIN MUTATED | 2 | 3 | 2 | 0 | 3 | 5 |
| 1Q GAIN WILD-TYPE | 28 | 0 | 31 | 21 | 15 | 38 |
Figure S3. Get High-res Image Gene #2: '1q gain mutation analysis' versus Clinical Feature #10: 'MRNASEQ_CHIERARCHICAL'
P value = 1.41e-17 (Chi-square test), Q value = 9.8e-15
Table S4. Gene #3: '2p gain mutation analysis' versus Clinical Feature #10: 'MRNASEQ_CHIERARCHICAL'
| nPatients | CLUS_1 | CLUS_2 | CLUS_3 | CLUS_4 | CLUS_5 | CLUS_6 |
|---|---|---|---|---|---|---|
| ALL | 30 | 3 | 33 | 21 | 18 | 43 |
| 2P GAIN MUTATED | 1 | 3 | 0 | 0 | 0 | 1 |
| 2P GAIN WILD-TYPE | 29 | 0 | 33 | 21 | 18 | 42 |
Figure S4. Get High-res Image Gene #3: '2p gain mutation analysis' versus Clinical Feature #10: 'MRNASEQ_CHIERARCHICAL'
P value = 3.9e-05 (Fisher's exact test), Q value = 0.025
Table S5. Gene #4: '2q gain mutation analysis' versus Clinical Feature #3: 'MIR_CNMF'
| nPatients | CLUS_1 | CLUS_2 | CLUS_3 | CLUS_4 |
|---|---|---|---|---|
| ALL | 139 | 157 | 72 | 104 |
| 2Q GAIN MUTATED | 6 | 0 | 0 | 10 |
| 2Q GAIN WILD-TYPE | 133 | 157 | 72 | 94 |
Figure S5. Get High-res Image Gene #4: '2q gain mutation analysis' versus Clinical Feature #3: 'MIR_CNMF'

P value = 2.7e-22 (Chi-square test), Q value = 1.9e-19
Table S6. Gene #4: '2q gain mutation analysis' versus Clinical Feature #10: 'MRNASEQ_CHIERARCHICAL'
| nPatients | CLUS_1 | CLUS_2 | CLUS_3 | CLUS_4 | CLUS_5 | CLUS_6 |
|---|---|---|---|---|---|---|
| ALL | 30 | 3 | 33 | 21 | 18 | 43 |
| 2Q GAIN MUTATED | 0 | 3 | 0 | 0 | 0 | 1 |
| 2Q GAIN WILD-TYPE | 30 | 0 | 33 | 21 | 18 | 42 |
Figure S6. Get High-res Image Gene #4: '2q gain mutation analysis' versus Clinical Feature #10: 'MRNASEQ_CHIERARCHICAL'

P value = 4.5e-08 (Fisher's exact test), Q value = 3e-05
Table S7. Gene #13: '7p gain mutation analysis' versus Clinical Feature #1: 'MRNA_CNMF'
| nPatients | CLUS_1 | CLUS_2 | CLUS_3 |
|---|---|---|---|
| ALL | 172 | 170 | 167 |
| 7P GAIN MUTATED | 141 | 104 | 145 |
| 7P GAIN WILD-TYPE | 31 | 66 | 22 |
Figure S7. Get High-res Image Gene #13: '7p gain mutation analysis' versus Clinical Feature #1: 'MRNA_CNMF'
P value = 7.2e-07 (Fisher's exact test), Q value = 0.00048
Table S8. Gene #13: '7p gain mutation analysis' versus Clinical Feature #2: 'MRNA_CHIERARCHICAL'
| nPatients | CLUS_1 | CLUS_2 | CLUS_3 |
|---|---|---|---|
| ALL | 217 | 126 | 166 |
| 7P GAIN MUTATED | 179 | 108 | 103 |
| 7P GAIN WILD-TYPE | 38 | 18 | 63 |
Figure S8. Get High-res Image Gene #13: '7p gain mutation analysis' versus Clinical Feature #2: 'MRNA_CHIERARCHICAL'

P value = 1.82e-09 (Fisher's exact test), Q value = 1.2e-06
Table S9. Gene #13: '7p gain mutation analysis' versus Clinical Feature #4: 'MIR_CHIERARCHICAL'
| nPatients | CLUS_1 | CLUS_2 | CLUS_3 |
|---|---|---|---|
| ALL | 163 | 179 | 130 |
| 7P GAIN MUTATED | 135 | 157 | 75 |
| 7P GAIN WILD-TYPE | 28 | 22 | 55 |
Figure S9. Get High-res Image Gene #13: '7p gain mutation analysis' versus Clinical Feature #4: 'MIR_CHIERARCHICAL'
P value = 2e-16 (Fisher's exact test), Q value = 1.4e-13
Table S10. Gene #13: '7p gain mutation analysis' versus Clinical Feature #5: 'CN_CNMF'
| nPatients | CLUS_1 | CLUS_2 | CLUS_3 |
|---|---|---|---|
| ALL | 161 | 214 | 188 |
| 7P GAIN MUTATED | 140 | 190 | 104 |
| 7P GAIN WILD-TYPE | 21 | 24 | 84 |
Figure S10. Get High-res Image Gene #13: '7p gain mutation analysis' versus Clinical Feature #5: 'CN_CNMF'

P value = 3.49e-06 (Fisher's exact test), Q value = 0.0023
Table S11. Gene #14: '7q gain mutation analysis' versus Clinical Feature #1: 'MRNA_CNMF'
| nPatients | CLUS_1 | CLUS_2 | CLUS_3 |
|---|---|---|---|
| ALL | 172 | 170 | 167 |
| 7Q GAIN MUTATED | 140 | 109 | 144 |
| 7Q GAIN WILD-TYPE | 32 | 61 | 23 |
Figure S11. Get High-res Image Gene #14: '7q gain mutation analysis' versus Clinical Feature #1: 'MRNA_CNMF'

P value = 1.75e-05 (Fisher's exact test), Q value = 0.011
Table S12. Gene #14: '7q gain mutation analysis' versus Clinical Feature #2: 'MRNA_CHIERARCHICAL'
| nPatients | CLUS_1 | CLUS_2 | CLUS_3 |
|---|---|---|---|
| ALL | 217 | 126 | 166 |
| 7Q GAIN MUTATED | 179 | 107 | 107 |
| 7Q GAIN WILD-TYPE | 38 | 19 | 59 |
Figure S12. Get High-res Image Gene #14: '7q gain mutation analysis' versus Clinical Feature #2: 'MRNA_CHIERARCHICAL'

P value = 1.56e-06 (Fisher's exact test), Q value = 0.001
Table S13. Gene #14: '7q gain mutation analysis' versus Clinical Feature #4: 'MIR_CHIERARCHICAL'
| nPatients | CLUS_1 | CLUS_2 | CLUS_3 |
|---|---|---|---|
| ALL | 163 | 179 | 130 |
| 7Q GAIN MUTATED | 135 | 153 | 80 |
| 7Q GAIN WILD-TYPE | 28 | 26 | 50 |
Figure S13. Get High-res Image Gene #14: '7q gain mutation analysis' versus Clinical Feature #4: 'MIR_CHIERARCHICAL'

P value = 9.36e-15 (Fisher's exact test), Q value = 6.4e-12
Table S14. Gene #14: '7q gain mutation analysis' versus Clinical Feature #5: 'CN_CNMF'
| nPatients | CLUS_1 | CLUS_2 | CLUS_3 |
|---|---|---|---|
| ALL | 161 | 214 | 188 |
| 7Q GAIN MUTATED | 137 | 193 | 109 |
| 7Q GAIN WILD-TYPE | 24 | 21 | 79 |
Figure S14. Get High-res Image Gene #14: '7q gain mutation analysis' versus Clinical Feature #5: 'CN_CNMF'

P value = 1.71e-09 (Chi-square test), Q value = 1.2e-06
Table S15. Gene #15: '8p gain mutation analysis' versus Clinical Feature #10: 'MRNASEQ_CHIERARCHICAL'
| nPatients | CLUS_1 | CLUS_2 | CLUS_3 | CLUS_4 | CLUS_5 | CLUS_6 |
|---|---|---|---|---|---|---|
| ALL | 30 | 3 | 33 | 21 | 18 | 43 |
| 8P GAIN MUTATED | 2 | 3 | 1 | 2 | 0 | 1 |
| 8P GAIN WILD-TYPE | 28 | 0 | 32 | 19 | 18 | 42 |
Figure S15. Get High-res Image Gene #15: '8p gain mutation analysis' versus Clinical Feature #10: 'MRNASEQ_CHIERARCHICAL'
P value = 3.66e-08 (Chi-square test), Q value = 2.4e-05
Table S16. Gene #16: '8q gain mutation analysis' versus Clinical Feature #10: 'MRNASEQ_CHIERARCHICAL'
| nPatients | CLUS_1 | CLUS_2 | CLUS_3 | CLUS_4 | CLUS_5 | CLUS_6 |
|---|---|---|---|---|---|---|
| ALL | 30 | 3 | 33 | 21 | 18 | 43 |
| 8Q GAIN MUTATED | 4 | 3 | 1 | 2 | 0 | 1 |
| 8Q GAIN WILD-TYPE | 26 | 0 | 32 | 19 | 18 | 42 |
Figure S16. Get High-res Image Gene #16: '8q gain mutation analysis' versus Clinical Feature #10: 'MRNASEQ_CHIERARCHICAL'

P value = 0.000326 (Fisher's exact test), Q value = 0.2
Table S17. Gene #31: '18p gain mutation analysis' versus Clinical Feature #5: 'CN_CNMF'
| nPatients | CLUS_1 | CLUS_2 | CLUS_3 |
|---|---|---|---|
| ALL | 161 | 214 | 188 |
| 18P GAIN MUTATED | 17 | 3 | 8 |
| 18P GAIN WILD-TYPE | 144 | 211 | 180 |
Figure S17. Get High-res Image Gene #31: '18p gain mutation analysis' versus Clinical Feature #5: 'CN_CNMF'

P value = 0.000159 (Fisher's exact test), Q value = 0.1
Table S18. Gene #32: '18q gain mutation analysis' versus Clinical Feature #5: 'CN_CNMF'
| nPatients | CLUS_1 | CLUS_2 | CLUS_3 |
|---|---|---|---|
| ALL | 161 | 214 | 188 |
| 18Q GAIN MUTATED | 18 | 3 | 9 |
| 18Q GAIN WILD-TYPE | 143 | 211 | 179 |
Figure S18. Get High-res Image Gene #32: '18q gain mutation analysis' versus Clinical Feature #5: 'CN_CNMF'

P value = 2.15e-14 (Fisher's exact test), Q value = 1.5e-11
Table S19. Gene #33: '19p gain mutation analysis' versus Clinical Feature #1: 'MRNA_CNMF'
| nPatients | CLUS_1 | CLUS_2 | CLUS_3 |
|---|---|---|---|
| ALL | 172 | 170 | 167 |
| 19P GAIN MUTATED | 46 | 23 | 88 |
| 19P GAIN WILD-TYPE | 126 | 147 | 79 |
Figure S19. Get High-res Image Gene #33: '19p gain mutation analysis' versus Clinical Feature #1: 'MRNA_CNMF'

P value = 3.12e-10 (Fisher's exact test), Q value = 2.1e-07
Table S20. Gene #33: '19p gain mutation analysis' versus Clinical Feature #2: 'MRNA_CHIERARCHICAL'
| nPatients | CLUS_1 | CLUS_2 | CLUS_3 |
|---|---|---|---|
| ALL | 217 | 126 | 166 |
| 19P GAIN MUTATED | 64 | 66 | 27 |
| 19P GAIN WILD-TYPE | 153 | 60 | 139 |
Figure S20. Get High-res Image Gene #33: '19p gain mutation analysis' versus Clinical Feature #2: 'MRNA_CHIERARCHICAL'
P value = 0.000117 (Fisher's exact test), Q value = 0.075
Table S21. Gene #33: '19p gain mutation analysis' versus Clinical Feature #4: 'MIR_CHIERARCHICAL'
| nPatients | CLUS_1 | CLUS_2 | CLUS_3 |
|---|---|---|---|
| ALL | 163 | 179 | 130 |
| 19P GAIN MUTATED | 52 | 75 | 25 |
| 19P GAIN WILD-TYPE | 111 | 104 | 105 |
Figure S21. Get High-res Image Gene #33: '19p gain mutation analysis' versus Clinical Feature #4: 'MIR_CHIERARCHICAL'

P value = 1.02e-23 (Fisher's exact test), Q value = 7.1e-21
Table S22. Gene #33: '19p gain mutation analysis' versus Clinical Feature #5: 'CN_CNMF'
| nPatients | CLUS_1 | CLUS_2 | CLUS_3 |
|---|---|---|---|
| ALL | 161 | 214 | 188 |
| 19P GAIN MUTATED | 24 | 122 | 30 |
| 19P GAIN WILD-TYPE | 137 | 92 | 158 |
Figure S22. Get High-res Image Gene #33: '19p gain mutation analysis' versus Clinical Feature #5: 'CN_CNMF'
P value = 9.62e-05 (Fisher's exact test), Q value = 0.061
Table S23. Gene #33: '19p gain mutation analysis' versus Clinical Feature #8: 'RPPA_CHIERARCHICAL'
| nPatients | CLUS_1 | CLUS_2 | CLUS_3 |
|---|---|---|---|
| ALL | 91 | 71 | 39 |
| 19P GAIN MUTATED | 17 | 35 | 9 |
| 19P GAIN WILD-TYPE | 74 | 36 | 30 |
Figure S23. Get High-res Image Gene #33: '19p gain mutation analysis' versus Clinical Feature #8: 'RPPA_CHIERARCHICAL'

P value = 4.39e-06 (Chi-square test), Q value = 0.0029
Table S24. Gene #33: '19p gain mutation analysis' versus Clinical Feature #10: 'MRNASEQ_CHIERARCHICAL'
| nPatients | CLUS_1 | CLUS_2 | CLUS_3 | CLUS_4 | CLUS_5 | CLUS_6 |
|---|---|---|---|---|---|---|
| ALL | 30 | 3 | 33 | 21 | 18 | 43 |
| 19P GAIN MUTATED | 5 | 1 | 10 | 0 | 14 | 11 |
| 19P GAIN WILD-TYPE | 25 | 2 | 23 | 21 | 4 | 32 |
Figure S24. Get High-res Image Gene #33: '19p gain mutation analysis' versus Clinical Feature #10: 'MRNASEQ_CHIERARCHICAL'

P value = 7.22e-16 (Fisher's exact test), Q value = 5e-13
Table S25. Gene #34: '19q gain mutation analysis' versus Clinical Feature #1: 'MRNA_CNMF'
| nPatients | CLUS_1 | CLUS_2 | CLUS_3 |
|---|---|---|---|
| ALL | 172 | 170 | 167 |
| 19Q GAIN MUTATED | 41 | 14 | 79 |
| 19Q GAIN WILD-TYPE | 131 | 156 | 88 |
Figure S25. Get High-res Image Gene #34: '19q gain mutation analysis' versus Clinical Feature #1: 'MRNA_CNMF'
P value = 3.75e-12 (Fisher's exact test), Q value = 2.6e-09
Table S26. Gene #34: '19q gain mutation analysis' versus Clinical Feature #2: 'MRNA_CHIERARCHICAL'
| nPatients | CLUS_1 | CLUS_2 | CLUS_3 |
|---|---|---|---|
| ALL | 217 | 126 | 166 |
| 19Q GAIN MUTATED | 57 | 60 | 17 |
| 19Q GAIN WILD-TYPE | 160 | 66 | 149 |
Figure S26. Get High-res Image Gene #34: '19q gain mutation analysis' versus Clinical Feature #2: 'MRNA_CHIERARCHICAL'
P value = 2.31e-05 (Fisher's exact test), Q value = 0.015
Table S27. Gene #34: '19q gain mutation analysis' versus Clinical Feature #4: 'MIR_CHIERARCHICAL'
| nPatients | CLUS_1 | CLUS_2 | CLUS_3 |
|---|---|---|---|
| ALL | 163 | 179 | 130 |
| 19Q GAIN MUTATED | 48 | 66 | 18 |
| 19Q GAIN WILD-TYPE | 115 | 113 | 112 |
Figure S27. Get High-res Image Gene #34: '19q gain mutation analysis' versus Clinical Feature #4: 'MIR_CHIERARCHICAL'

P value = 1.64e-28 (Fisher's exact test), Q value = 1.1e-25
Table S28. Gene #34: '19q gain mutation analysis' versus Clinical Feature #5: 'CN_CNMF'
| nPatients | CLUS_1 | CLUS_2 | CLUS_3 |
|---|---|---|---|
| ALL | 161 | 214 | 188 |
| 19Q GAIN MUTATED | 14 | 115 | 22 |
| 19Q GAIN WILD-TYPE | 147 | 99 | 166 |
Figure S28. Get High-res Image Gene #34: '19q gain mutation analysis' versus Clinical Feature #5: 'CN_CNMF'
P value = 7.6e-05 (Fisher's exact test), Q value = 0.049
Table S29. Gene #34: '19q gain mutation analysis' versus Clinical Feature #8: 'RPPA_CHIERARCHICAL'
| nPatients | CLUS_1 | CLUS_2 | CLUS_3 |
|---|---|---|---|
| ALL | 91 | 71 | 39 |
| 19Q GAIN MUTATED | 12 | 30 | 7 |
| 19Q GAIN WILD-TYPE | 79 | 41 | 32 |
Figure S29. Get High-res Image Gene #34: '19q gain mutation analysis' versus Clinical Feature #8: 'RPPA_CHIERARCHICAL'
P value = 0.000315 (Chi-square test), Q value = 0.2
Table S30. Gene #34: '19q gain mutation analysis' versus Clinical Feature #9: 'MRNASEQ_CNMF'
| nPatients | CLUS_1 | CLUS_2 | CLUS_3 | CLUS_4 | CLUS_5 | CLUS_6 |
|---|---|---|---|---|---|---|
| ALL | 35 | 32 | 27 | 25 | 5 | 24 |
| 19Q GAIN MUTATED | 3 | 7 | 16 | 6 | 2 | 4 |
| 19Q GAIN WILD-TYPE | 32 | 25 | 11 | 19 | 3 | 20 |
Figure S30. Get High-res Image Gene #34: '19q gain mutation analysis' versus Clinical Feature #9: 'MRNASEQ_CNMF'
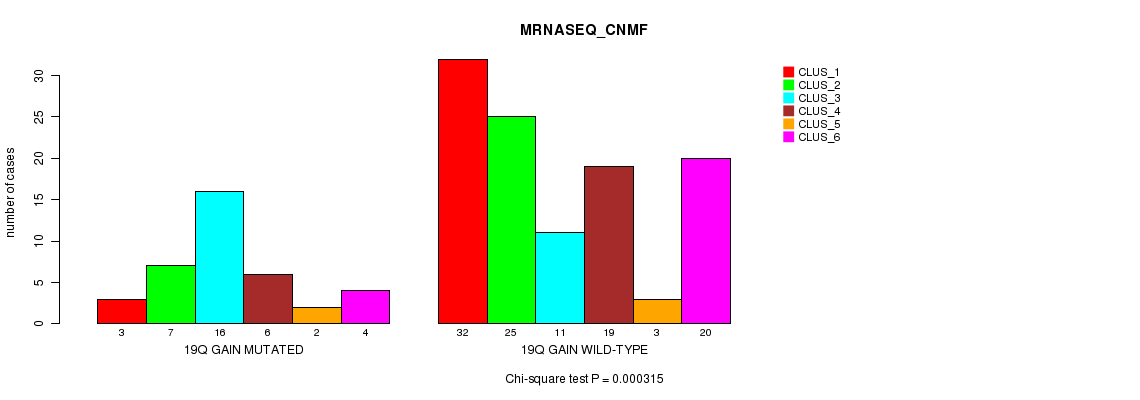
P value = 6.39e-07 (Chi-square test), Q value = 0.00043
Table S31. Gene #34: '19q gain mutation analysis' versus Clinical Feature #10: 'MRNASEQ_CHIERARCHICAL'
| nPatients | CLUS_1 | CLUS_2 | CLUS_3 | CLUS_4 | CLUS_5 | CLUS_6 |
|---|---|---|---|---|---|---|
| ALL | 30 | 3 | 33 | 21 | 18 | 43 |
| 19Q GAIN MUTATED | 3 | 1 | 9 | 0 | 14 | 11 |
| 19Q GAIN WILD-TYPE | 27 | 2 | 24 | 21 | 4 | 32 |
Figure S31. Get High-res Image Gene #34: '19q gain mutation analysis' versus Clinical Feature #10: 'MRNASEQ_CHIERARCHICAL'

P value = 2.17e-13 (Fisher's exact test), Q value = 1.5e-10
Table S32. Gene #35: '20p gain mutation analysis' versus Clinical Feature #1: 'MRNA_CNMF'
| nPatients | CLUS_1 | CLUS_2 | CLUS_3 |
|---|---|---|---|
| ALL | 172 | 170 | 167 |
| 20P GAIN MUTATED | 41 | 27 | 88 |
| 20P GAIN WILD-TYPE | 131 | 143 | 79 |
Figure S32. Get High-res Image Gene #35: '20p gain mutation analysis' versus Clinical Feature #1: 'MRNA_CNMF'

P value = 3.72e-12 (Fisher's exact test), Q value = 2.5e-09
Table S33. Gene #35: '20p gain mutation analysis' versus Clinical Feature #2: 'MRNA_CHIERARCHICAL'
| nPatients | CLUS_1 | CLUS_2 | CLUS_3 |
|---|---|---|---|
| ALL | 217 | 126 | 166 |
| 20P GAIN MUTATED | 59 | 70 | 27 |
| 20P GAIN WILD-TYPE | 158 | 56 | 139 |
Figure S33. Get High-res Image Gene #35: '20p gain mutation analysis' versus Clinical Feature #2: 'MRNA_CHIERARCHICAL'

P value = 6.21e-05 (Fisher's exact test), Q value = 0.04
Table S34. Gene #35: '20p gain mutation analysis' versus Clinical Feature #4: 'MIR_CHIERARCHICAL'
| nPatients | CLUS_1 | CLUS_2 | CLUS_3 |
|---|---|---|---|
| ALL | 163 | 179 | 130 |
| 20P GAIN MUTATED | 58 | 69 | 22 |
| 20P GAIN WILD-TYPE | 105 | 110 | 108 |
Figure S34. Get High-res Image Gene #35: '20p gain mutation analysis' versus Clinical Feature #4: 'MIR_CHIERARCHICAL'

P value = 1.54e-09 (Fisher's exact test), Q value = 1e-06
Table S35. Gene #35: '20p gain mutation analysis' versus Clinical Feature #5: 'CN_CNMF'
| nPatients | CLUS_1 | CLUS_2 | CLUS_3 |
|---|---|---|---|
| ALL | 161 | 214 | 188 |
| 20P GAIN MUTATED | 42 | 102 | 36 |
| 20P GAIN WILD-TYPE | 119 | 112 | 152 |
Figure S35. Get High-res Image Gene #35: '20p gain mutation analysis' versus Clinical Feature #5: 'CN_CNMF'

P value = 3.25e-13 (Fisher's exact test), Q value = 2.2e-10
Table S36. Gene #36: '20q gain mutation analysis' versus Clinical Feature #1: 'MRNA_CNMF'
| nPatients | CLUS_1 | CLUS_2 | CLUS_3 |
|---|---|---|---|
| ALL | 172 | 170 | 167 |
| 20Q GAIN MUTATED | 42 | 26 | 87 |
| 20Q GAIN WILD-TYPE | 130 | 144 | 80 |
Figure S36. Get High-res Image Gene #36: '20q gain mutation analysis' versus Clinical Feature #1: 'MRNA_CNMF'

P value = 4.38e-11 (Fisher's exact test), Q value = 3e-08
Table S37. Gene #36: '20q gain mutation analysis' versus Clinical Feature #2: 'MRNA_CHIERARCHICAL'
| nPatients | CLUS_1 | CLUS_2 | CLUS_3 |
|---|---|---|---|
| ALL | 217 | 126 | 166 |
| 20Q GAIN MUTATED | 62 | 67 | 26 |
| 20Q GAIN WILD-TYPE | 155 | 59 | 140 |
Figure S37. Get High-res Image Gene #36: '20q gain mutation analysis' versus Clinical Feature #2: 'MRNA_CHIERARCHICAL'

P value = 6.8e-06 (Fisher's exact test), Q value = 0.0044
Table S38. Gene #36: '20q gain mutation analysis' versus Clinical Feature #4: 'MIR_CHIERARCHICAL'
| nPatients | CLUS_1 | CLUS_2 | CLUS_3 |
|---|---|---|---|
| ALL | 163 | 179 | 130 |
| 20Q GAIN MUTATED | 57 | 71 | 20 |
| 20Q GAIN WILD-TYPE | 106 | 108 | 110 |
Figure S38. Get High-res Image Gene #36: '20q gain mutation analysis' versus Clinical Feature #4: 'MIR_CHIERARCHICAL'
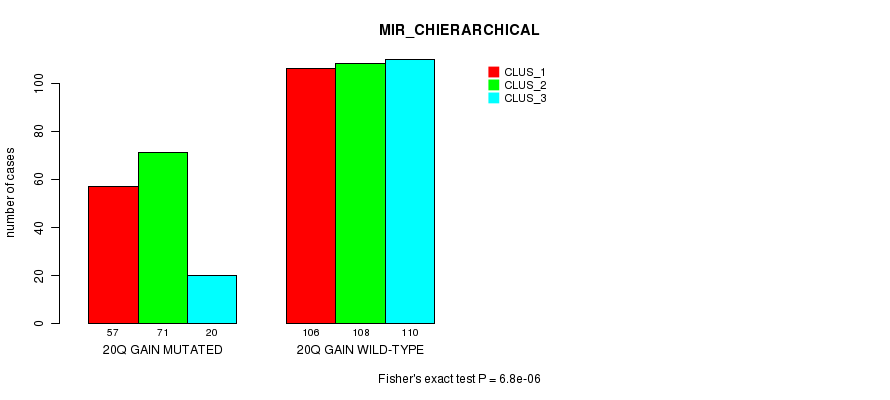
P value = 2.98e-09 (Fisher's exact test), Q value = 2e-06
Table S39. Gene #36: '20q gain mutation analysis' versus Clinical Feature #5: 'CN_CNMF'
| nPatients | CLUS_1 | CLUS_2 | CLUS_3 |
|---|---|---|---|
| ALL | 161 | 214 | 188 |
| 20Q GAIN MUTATED | 40 | 101 | 37 |
| 20Q GAIN WILD-TYPE | 121 | 113 | 151 |
Figure S39. Get High-res Image Gene #36: '20q gain mutation analysis' versus Clinical Feature #5: 'CN_CNMF'
P value = 0.000273 (Chi-square test), Q value = 0.17
Table S40. Gene #36: '20q gain mutation analysis' versus Clinical Feature #10: 'MRNASEQ_CHIERARCHICAL'
| nPatients | CLUS_1 | CLUS_2 | CLUS_3 | CLUS_4 | CLUS_5 | CLUS_6 |
|---|---|---|---|---|---|---|
| ALL | 30 | 3 | 33 | 21 | 18 | 43 |
| 20Q GAIN MUTATED | 3 | 3 | 11 | 3 | 10 | 9 |
| 20Q GAIN WILD-TYPE | 27 | 0 | 22 | 18 | 8 | 34 |
Figure S40. Get High-res Image Gene #36: '20q gain mutation analysis' versus Clinical Feature #10: 'MRNASEQ_CHIERARCHICAL'

P value = 0.000297 (Fisher's exact test), Q value = 0.19
Table S41. Gene #45: '3q loss mutation analysis' versus Clinical Feature #5: 'CN_CNMF'
| nPatients | CLUS_1 | CLUS_2 | CLUS_3 |
|---|---|---|---|
| ALL | 161 | 214 | 188 |
| 3Q LOSS MUTATED | 10 | 0 | 6 |
| 3Q LOSS WILD-TYPE | 151 | 214 | 182 |
Figure S41. Get High-res Image Gene #45: '3q loss mutation analysis' versus Clinical Feature #5: 'CN_CNMF'
P value = 0.00014 (Chi-square test), Q value = 0.089
Table S42. Gene #49: '5q loss mutation analysis' versus Clinical Feature #10: 'MRNASEQ_CHIERARCHICAL'
| nPatients | CLUS_1 | CLUS_2 | CLUS_3 | CLUS_4 | CLUS_5 | CLUS_6 |
|---|---|---|---|---|---|---|
| ALL | 30 | 3 | 33 | 21 | 18 | 43 |
| 5Q LOSS MUTATED | 2 | 2 | 0 | 3 | 1 | 1 |
| 5Q LOSS WILD-TYPE | 28 | 1 | 33 | 18 | 17 | 42 |
Figure S42. Get High-res Image Gene #49: '5q loss mutation analysis' versus Clinical Feature #10: 'MRNASEQ_CHIERARCHICAL'

P value = 2.84e-09 (Fisher's exact test), Q value = 1.9e-06
Table S43. Gene #50: '6p loss mutation analysis' versus Clinical Feature #5: 'CN_CNMF'
| nPatients | CLUS_1 | CLUS_2 | CLUS_3 |
|---|---|---|---|
| ALL | 161 | 214 | 188 |
| 6P LOSS MUTATED | 33 | 6 | 8 |
| 6P LOSS WILD-TYPE | 128 | 208 | 180 |
Figure S43. Get High-res Image Gene #50: '6p loss mutation analysis' versus Clinical Feature #5: 'CN_CNMF'

P value = 1.87e-08 (Fisher's exact test), Q value = 1.3e-05
Table S44. Gene #51: '6q loss mutation analysis' versus Clinical Feature #5: 'CN_CNMF'
| nPatients | CLUS_1 | CLUS_2 | CLUS_3 |
|---|---|---|---|
| ALL | 161 | 214 | 188 |
| 6Q LOSS MUTATED | 46 | 21 | 13 |
| 6Q LOSS WILD-TYPE | 115 | 193 | 175 |
Figure S44. Get High-res Image Gene #51: '6q loss mutation analysis' versus Clinical Feature #5: 'CN_CNMF'
P value = 1.2e-06 (Fisher's exact test), Q value = 0.00079
Table S45. Gene #58: '10p loss mutation analysis' versus Clinical Feature #1: 'MRNA_CNMF'
| nPatients | CLUS_1 | CLUS_2 | CLUS_3 |
|---|---|---|---|
| ALL | 172 | 170 | 167 |
| 10P LOSS MUTATED | 131 | 112 | 149 |
| 10P LOSS WILD-TYPE | 41 | 58 | 18 |
Figure S45. Get High-res Image Gene #58: '10p loss mutation analysis' versus Clinical Feature #1: 'MRNA_CNMF'

P value = 8.37e-06 (Fisher's exact test), Q value = 0.0054
Table S46. Gene #58: '10p loss mutation analysis' versus Clinical Feature #2: 'MRNA_CHIERARCHICAL'
| nPatients | CLUS_1 | CLUS_2 | CLUS_3 |
|---|---|---|---|
| ALL | 217 | 126 | 166 |
| 10P LOSS MUTATED | 169 | 113 | 110 |
| 10P LOSS WILD-TYPE | 48 | 13 | 56 |
Figure S46. Get High-res Image Gene #58: '10p loss mutation analysis' versus Clinical Feature #2: 'MRNA_CHIERARCHICAL'
P value = 1.58e-08 (Fisher's exact test), Q value = 1.1e-05
Table S47. Gene #58: '10p loss mutation analysis' versus Clinical Feature #4: 'MIR_CHIERARCHICAL'
| nPatients | CLUS_1 | CLUS_2 | CLUS_3 |
|---|---|---|---|
| ALL | 163 | 179 | 130 |
| 10P LOSS MUTATED | 136 | 156 | 77 |
| 10P LOSS WILD-TYPE | 27 | 23 | 53 |
Figure S47. Get High-res Image Gene #58: '10p loss mutation analysis' versus Clinical Feature #4: 'MIR_CHIERARCHICAL'
P value = 1.8e-28 (Fisher's exact test), Q value = 1.2e-25
Table S48. Gene #58: '10p loss mutation analysis' versus Clinical Feature #5: 'CN_CNMF'
| nPatients | CLUS_1 | CLUS_2 | CLUS_3 |
|---|---|---|---|
| ALL | 161 | 214 | 188 |
| 10P LOSS MUTATED | 137 | 205 | 95 |
| 10P LOSS WILD-TYPE | 24 | 9 | 93 |
Figure S48. Get High-res Image Gene #58: '10p loss mutation analysis' versus Clinical Feature #5: 'CN_CNMF'

P value = 0.000111 (Fisher's exact test), Q value = 0.07
Table S49. Gene #58: '10p loss mutation analysis' versus Clinical Feature #8: 'RPPA_CHIERARCHICAL'
| nPatients | CLUS_1 | CLUS_2 | CLUS_3 |
|---|---|---|---|
| ALL | 91 | 71 | 39 |
| 10P LOSS MUTATED | 66 | 68 | 29 |
| 10P LOSS WILD-TYPE | 25 | 3 | 10 |
Figure S49. Get High-res Image Gene #58: '10p loss mutation analysis' versus Clinical Feature #8: 'RPPA_CHIERARCHICAL'

P value = 2.16e-06 (Fisher's exact test), Q value = 0.0014
Table S50. Gene #59: '10q loss mutation analysis' versus Clinical Feature #1: 'MRNA_CNMF'
| nPatients | CLUS_1 | CLUS_2 | CLUS_3 |
|---|---|---|---|
| ALL | 172 | 170 | 167 |
| 10Q LOSS MUTATED | 133 | 120 | 153 |
| 10Q LOSS WILD-TYPE | 39 | 50 | 14 |
Figure S50. Get High-res Image Gene #59: '10q loss mutation analysis' versus Clinical Feature #1: 'MRNA_CNMF'

P value = 4.5e-06 (Fisher's exact test), Q value = 0.003
Table S51. Gene #59: '10q loss mutation analysis' versus Clinical Feature #2: 'MRNA_CHIERARCHICAL'
| nPatients | CLUS_1 | CLUS_2 | CLUS_3 |
|---|---|---|---|
| ALL | 217 | 126 | 166 |
| 10Q LOSS MUTATED | 172 | 117 | 117 |
| 10Q LOSS WILD-TYPE | 45 | 9 | 49 |
Figure S51. Get High-res Image Gene #59: '10q loss mutation analysis' versus Clinical Feature #2: 'MRNA_CHIERARCHICAL'

P value = 7.65e-06 (Fisher's exact test), Q value = 0.005
Table S52. Gene #59: '10q loss mutation analysis' versus Clinical Feature #4: 'MIR_CHIERARCHICAL'
| nPatients | CLUS_1 | CLUS_2 | CLUS_3 |
|---|---|---|---|
| ALL | 163 | 179 | 130 |
| 10Q LOSS MUTATED | 137 | 159 | 87 |
| 10Q LOSS WILD-TYPE | 26 | 20 | 43 |
Figure S52. Get High-res Image Gene #59: '10q loss mutation analysis' versus Clinical Feature #4: 'MIR_CHIERARCHICAL'

P value = 3.09e-31 (Fisher's exact test), Q value = 2.2e-28
Table S53. Gene #59: '10q loss mutation analysis' versus Clinical Feature #5: 'CN_CNMF'
| nPatients | CLUS_1 | CLUS_2 | CLUS_3 |
|---|---|---|---|
| ALL | 161 | 214 | 188 |
| 10Q LOSS MUTATED | 140 | 210 | 100 |
| 10Q LOSS WILD-TYPE | 21 | 4 | 88 |
Figure S53. Get High-res Image Gene #59: '10q loss mutation analysis' versus Clinical Feature #5: 'CN_CNMF'
P value = 8.72e-05 (Fisher's exact test), Q value = 0.056
Table S54. Gene #59: '10q loss mutation analysis' versus Clinical Feature #7: 'RPPA_CNMF'
| nPatients | CLUS_1 | CLUS_2 | CLUS_3 | CLUS_4 |
|---|---|---|---|---|
| ALL | 55 | 58 | 43 | 45 |
| 10Q LOSS MUTATED | 43 | 40 | 43 | 39 |
| 10Q LOSS WILD-TYPE | 12 | 18 | 0 | 6 |
Figure S54. Get High-res Image Gene #59: '10q loss mutation analysis' versus Clinical Feature #7: 'RPPA_CNMF'

P value = 1.2e-07 (Fisher's exact test), Q value = 8e-05
Table S55. Gene #60: '11p loss mutation analysis' versus Clinical Feature #1: 'MRNA_CNMF'
| nPatients | CLUS_1 | CLUS_2 | CLUS_3 |
|---|---|---|---|
| ALL | 172 | 170 | 167 |
| 11P LOSS MUTATED | 18 | 38 | 5 |
| 11P LOSS WILD-TYPE | 154 | 132 | 162 |
Figure S55. Get High-res Image Gene #60: '11p loss mutation analysis' versus Clinical Feature #1: 'MRNA_CNMF'

P value = 6.61e-06 (Fisher's exact test), Q value = 0.0043
Table S56. Gene #60: '11p loss mutation analysis' versus Clinical Feature #2: 'MRNA_CHIERARCHICAL'
| nPatients | CLUS_1 | CLUS_2 | CLUS_3 |
|---|---|---|---|
| ALL | 217 | 126 | 166 |
| 11P LOSS MUTATED | 22 | 4 | 35 |
| 11P LOSS WILD-TYPE | 195 | 122 | 131 |
Figure S56. Get High-res Image Gene #60: '11p loss mutation analysis' versus Clinical Feature #2: 'MRNA_CHIERARCHICAL'

P value = 2.43e-06 (Fisher's exact test), Q value = 0.0016
Table S57. Gene #60: '11p loss mutation analysis' versus Clinical Feature #4: 'MIR_CHIERARCHICAL'
| nPatients | CLUS_1 | CLUS_2 | CLUS_3 |
|---|---|---|---|
| ALL | 163 | 179 | 130 |
| 11P LOSS MUTATED | 18 | 9 | 32 |
| 11P LOSS WILD-TYPE | 145 | 170 | 98 |
Figure S57. Get High-res Image Gene #60: '11p loss mutation analysis' versus Clinical Feature #4: 'MIR_CHIERARCHICAL'

P value = 7.77e-12 (Fisher's exact test), Q value = 5.3e-09
Table S58. Gene #60: '11p loss mutation analysis' versus Clinical Feature #5: 'CN_CNMF'
| nPatients | CLUS_1 | CLUS_2 | CLUS_3 |
|---|---|---|---|
| ALL | 161 | 214 | 188 |
| 11P LOSS MUTATED | 38 | 3 | 23 |
| 11P LOSS WILD-TYPE | 123 | 211 | 165 |
Figure S58. Get High-res Image Gene #60: '11p loss mutation analysis' versus Clinical Feature #5: 'CN_CNMF'
P value = 9.72e-05 (Fisher's exact test), Q value = 0.062
Table S59. Gene #61: '11q loss mutation analysis' versus Clinical Feature #1: 'MRNA_CNMF'
| nPatients | CLUS_1 | CLUS_2 | CLUS_3 |
|---|---|---|---|
| ALL | 172 | 170 | 167 |
| 11Q LOSS MUTATED | 18 | 30 | 6 |
| 11Q LOSS WILD-TYPE | 154 | 140 | 161 |
Figure S59. Get High-res Image Gene #61: '11q loss mutation analysis' versus Clinical Feature #1: 'MRNA_CNMF'

P value = 2.1e-10 (Fisher's exact test), Q value = 1.4e-07
Table S60. Gene #61: '11q loss mutation analysis' versus Clinical Feature #5: 'CN_CNMF'
| nPatients | CLUS_1 | CLUS_2 | CLUS_3 |
|---|---|---|---|
| ALL | 161 | 214 | 188 |
| 11Q LOSS MUTATED | 36 | 4 | 15 |
| 11Q LOSS WILD-TYPE | 125 | 210 | 173 |
Figure S60. Get High-res Image Gene #61: '11q loss mutation analysis' versus Clinical Feature #5: 'CN_CNMF'
P value = 4.42e-05 (Fisher's exact test), Q value = 0.028
Table S61. Gene #64: '13q loss mutation analysis' versus Clinical Feature #2: 'MRNA_CHIERARCHICAL'
| nPatients | CLUS_1 | CLUS_2 | CLUS_3 |
|---|---|---|---|
| ALL | 217 | 126 | 166 |
| 13Q LOSS MUTATED | 63 | 13 | 48 |
| 13Q LOSS WILD-TYPE | 154 | 113 | 118 |
Figure S61. Get High-res Image Gene #64: '13q loss mutation analysis' versus Clinical Feature #2: 'MRNA_CHIERARCHICAL'
P value = 4.3e-13 (Fisher's exact test), Q value = 2.9e-10
Table S62. Gene #64: '13q loss mutation analysis' versus Clinical Feature #5: 'CN_CNMF'
| nPatients | CLUS_1 | CLUS_2 | CLUS_3 |
|---|---|---|---|
| ALL | 161 | 214 | 188 |
| 13Q LOSS MUTATED | 68 | 20 | 50 |
| 13Q LOSS WILD-TYPE | 93 | 194 | 138 |
Figure S62. Get High-res Image Gene #64: '13q loss mutation analysis' versus Clinical Feature #5: 'CN_CNMF'

P value = 4.49e-07 (Fisher's exact test), Q value = 3e-04
Table S63. Gene #65: '14q loss mutation analysis' versus Clinical Feature #1: 'MRNA_CNMF'
| nPatients | CLUS_1 | CLUS_2 | CLUS_3 |
|---|---|---|---|
| ALL | 172 | 170 | 167 |
| 14Q LOSS MUTATED | 47 | 52 | 15 |
| 14Q LOSS WILD-TYPE | 125 | 118 | 152 |
Figure S63. Get High-res Image Gene #65: '14q loss mutation analysis' versus Clinical Feature #1: 'MRNA_CNMF'
P value = 8.63e-34 (Fisher's exact test), Q value = 6e-31
Table S64. Gene #65: '14q loss mutation analysis' versus Clinical Feature #5: 'CN_CNMF'
| nPatients | CLUS_1 | CLUS_2 | CLUS_3 |
|---|---|---|---|
| ALL | 161 | 214 | 188 |
| 14Q LOSS MUTATED | 85 | 4 | 32 |
| 14Q LOSS WILD-TYPE | 76 | 210 | 156 |
Figure S64. Get High-res Image Gene #65: '14q loss mutation analysis' versus Clinical Feature #5: 'CN_CNMF'

P value = 5.43e-05 (Fisher's exact test), Q value = 0.035
Table S65. Gene #66: '15q loss mutation analysis' versus Clinical Feature #1: 'MRNA_CNMF'
| nPatients | CLUS_1 | CLUS_2 | CLUS_3 |
|---|---|---|---|
| ALL | 172 | 170 | 167 |
| 15Q LOSS MUTATED | 17 | 34 | 8 |
| 15Q LOSS WILD-TYPE | 155 | 136 | 159 |
Figure S65. Get High-res Image Gene #66: '15q loss mutation analysis' versus Clinical Feature #1: 'MRNA_CNMF'
P value = 0.000315 (Fisher's exact test), Q value = 0.2
Table S66. Gene #66: '15q loss mutation analysis' versus Clinical Feature #2: 'MRNA_CHIERARCHICAL'
| nPatients | CLUS_1 | CLUS_2 | CLUS_3 |
|---|---|---|---|
| ALL | 217 | 126 | 166 |
| 15Q LOSS MUTATED | 23 | 5 | 31 |
| 15Q LOSS WILD-TYPE | 194 | 121 | 135 |
Figure S66. Get High-res Image Gene #66: '15q loss mutation analysis' versus Clinical Feature #2: 'MRNA_CHIERARCHICAL'

P value = 4.06e-06 (Fisher's exact test), Q value = 0.0027
Table S67. Gene #66: '15q loss mutation analysis' versus Clinical Feature #4: 'MIR_CHIERARCHICAL'
| nPatients | CLUS_1 | CLUS_2 | CLUS_3 |
|---|---|---|---|
| ALL | 163 | 179 | 130 |
| 15Q LOSS MUTATED | 6 | 20 | 29 |
| 15Q LOSS WILD-TYPE | 157 | 159 | 101 |
Figure S67. Get High-res Image Gene #66: '15q loss mutation analysis' versus Clinical Feature #4: 'MIR_CHIERARCHICAL'

P value = 6.26e-06 (Fisher's exact test), Q value = 0.0041
Table S68. Gene #66: '15q loss mutation analysis' versus Clinical Feature #5: 'CN_CNMF'
| nPatients | CLUS_1 | CLUS_2 | CLUS_3 |
|---|---|---|---|
| ALL | 161 | 214 | 188 |
| 15Q LOSS MUTATED | 35 | 13 | 14 |
| 15Q LOSS WILD-TYPE | 126 | 201 | 174 |
Figure S68. Get High-res Image Gene #66: '15q loss mutation analysis' versus Clinical Feature #5: 'CN_CNMF'

P value = 0.000258 (Fisher's exact test), Q value = 0.16
Table S69. Gene #66: '15q loss mutation analysis' versus Clinical Feature #6: 'METHLYATION_CNMF'
| nPatients | CLUS_1 | CLUS_2 | CLUS_3 | CLUS_4 |
|---|---|---|---|---|
| ALL | 38 | 20 | 24 | 27 |
| 15Q LOSS MUTATED | 1 | 2 | 0 | 9 |
| 15Q LOSS WILD-TYPE | 37 | 18 | 24 | 18 |
Figure S69. Get High-res Image Gene #66: '15q loss mutation analysis' versus Clinical Feature #6: 'METHLYATION_CNMF'

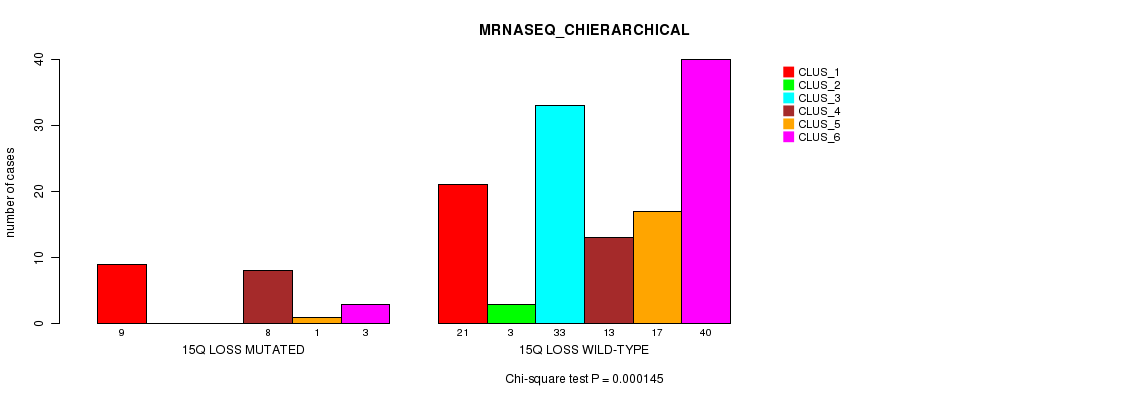
P value = 0.000145 (Chi-square test), Q value = 0.092
Table S70. Gene #66: '15q loss mutation analysis' versus Clinical Feature #10: 'MRNASEQ_CHIERARCHICAL'
| nPatients | CLUS_1 | CLUS_2 | CLUS_3 | CLUS_4 | CLUS_5 | CLUS_6 |
|---|---|---|---|---|---|---|
| ALL | 30 | 3 | 33 | 21 | 18 | 43 |
| 15Q LOSS MUTATED | 9 | 0 | 0 | 8 | 1 | 3 |
| 15Q LOSS WILD-TYPE | 21 | 3 | 33 | 13 | 17 | 40 |
Figure S70. Get High-res Image Gene #66: '15q loss mutation analysis' versus Clinical Feature #10: 'MRNASEQ_CHIERARCHICAL'
P value = 5.94e-06 (Fisher's exact test), Q value = 0.0039
Table S71. Gene #69: '17p loss mutation analysis' versus Clinical Feature #5: 'CN_CNMF'
| nPatients | CLUS_1 | CLUS_2 | CLUS_3 |
|---|---|---|---|
| ALL | 161 | 214 | 188 |
| 17P LOSS MUTATED | 20 | 2 | 14 |
| 17P LOSS WILD-TYPE | 141 | 212 | 174 |
Figure S71. Get High-res Image Gene #69: '17p loss mutation analysis' versus Clinical Feature #5: 'CN_CNMF'

P value = 0.000148 (Fisher's exact test), Q value = 0.094
Table S72. Gene #78: '22q loss mutation analysis' versus Clinical Feature #5: 'CN_CNMF'
| nPatients | CLUS_1 | CLUS_2 | CLUS_3 |
|---|---|---|---|
| ALL | 161 | 214 | 188 |
| 22Q LOSS MUTATED | 60 | 43 | 37 |
| 22Q LOSS WILD-TYPE | 101 | 171 | 151 |
Figure S72. Get High-res Image Gene #78: '22q loss mutation analysis' versus Clinical Feature #5: 'CN_CNMF'

-
Mutation data file = broad_values_by_arm.mutsig.cluster.txt
-
Molecular subtypes file = GBM-TP.transferedmergedcluster.txt
-
Number of patients = 563
-
Number of significantly arm-level cnvs = 79
-
Number of molecular subtypes = 10
-
Exclude genes that fewer than K tumors have mutations, K = 3
For binary or multi-class clinical features (nominal or ordinal), two-tailed Fisher's exact tests (Fisher 1922) were used to estimate the P values using the 'fisher.test' function in R
For multi-class clinical features (nominal or ordinal), Chi-square tests (Greenwood and Nikulin 1996) were used to estimate the P values using the 'chisq.test' function in R
For multiple hypothesis correction, Q value is the False Discovery Rate (FDR) analogue of the P value (Benjamini and Hochberg 1995), defined as the minimum FDR at which the test may be called significant. We used the 'Benjamini and Hochberg' method of 'p.adjust' function in R to convert P values into Q values.
This is an experimental feature. The full results of the analysis summarized in this report can be downloaded from the TCGA Data Coordination Center.